
Abstract
Accurate prediction of carbon price is of great value for production, operation, investment decisions and the establishment of carbon pricing mechanism. However, the large amount of data often limits the application of learning model with good predictive performance in carbon price prediction. Therefore, the development of learning algorithms with low computational complexity has become a research hotspot. Among them, subsampling integration technology is an effective method to reduce the computational complexity. However, lack of data representativeness in subsamples and ignorance of differences among submodels inhibit the prediction performance of the subsampled ensemble model. This project proposes an optimal weight random forest ensemble model with cluster-based subsampling (FCM-OWSRFE) for carbon price forecasting. Firstly, Fuzzy C-means cluster-based subsampling to ensure the data representativeness of subsamples. Secondly, a series of sub-random forest models are built based on subsamples with data representativeness. Finally, an optimal weight ensemble model from these sub-models is derived. To verify the validity of the model, we test FCM-OWSRFE model with the carbon price of Guangzhou Emission Exchange and the carbon price of Hubei Carbon Emission Exchange, respectively. Experimental results show that Fuzzy C-means cluster-based subsampling and the optimal weight scheme can efficiently improve the prediction performance of the subsampled random forest ensemble model.
Introduction
Background
In view of the increasing number of extreme weather caused by greenhouse gas emissions, the issue of carbon emissions is gaining attention in various countries. To date, 196 parties participate in the United Nations Framework Convention on Climate Change (UNFCCC) and 192 parties have signed and ratified the Kyoto protocol. As a climate policy system, the European Union Emissions Trading System (EU ETS) is a mature carbon trading system and has a exemplary role in the worldwide carbon trading markets [1]. In the trade market, carbon price is widely regarded as an effectual way to curb global warming and reduce global carbon emissions.
As the largest developing country, China has developed policies to ease the carbon emissions. To address the issue of carbon emissions, China has gradually launched carbon trading pilot projects in 8 provinces and cities since 2011, such as Beijing, Guangzhou and Hubei, and so on. To accelerate the pace of reducing carbon emissions and continuously improve the global competitiveness of the industry and economy, China aims to achieve carbon peak by 2030 and carbon neutrality by 2060. To accomplish the goal, China launched a carbon emission allowance trading market in July 2021 and traded 195 million tonnes of carbon emission allowances in one month, which signifies significant results in reducing carbon emissions in China. However, there are still series of problems in China’s carbon trading market, such as low market participation, inaccuracy of quota allocation, imperfect mechanisms of supervision, reward and punishment. Besides, as rapid economic development will inevitably have an impact on the environment, it is challenging for China to achieve its 2060 carbon neutrality target, in the context of both economic and environmental development.
Previous literature
For the past few years, carbon price prediction has attracted a lot of attention from researchers, which proves the significance of carbon price prediction. The main forecasting methods are also roughly divided into two categories, traditional statistical methods and artificial intelligence models. For traditional statistical methods, Byun and Cho [2] examine the prediction ability of Generalized Autoregressive Conditional Heteroskedasticity (GARCH) model using carbon future prices. Li and Lu [3] adopt the GARCH model to predict the carbon price of the five carbon trading pilots in China. Segnon et al. [4] compare the performance of GARCH-type models to long-term dependent models and regime switching models for forecasting carbon prices of the EU ETS. However, traditional statistical models are poor at capturing the nonstationary and nonlinear features of carbon prices and are unable to accurately predict them. With the development of data science, artificial intelligence models have gradually become the mainstream of research and are applied to predict carbon prices. An and Zhai [5] apply support vector regression (SVR) based framework to predict carbon prices. Liu and Sun [6] predict the carbon trading price and carbon trading volume in Shanghai with the backpropagation neural network (BPNN) model.
However, each model has its own advantages. How to combine the advantages of multiple models has become a research hotspot. To this end, ensemble models are widely used in the field of forecasting due to their advantages of high accuracy and less susceptibility to overfitting. Sun et al. [7] propose a carbon price forecasting framework combining VMD, selection matching strategy, and an ensemble model optimized by a hybrid optimization algorithm. Li et al. [8] propose causal temporal convolutional networks (CTCNs) for carbon price prediction with a real-time decomposition method based on the multiple ensemble patch transform (MEPT) and ICEEMDAN. Wang et al. [9] develop an ensemble forecasting model integrating decomposition module based on CEEMDAN and SE, feature selection module and sub-model determination module for both point and interval carbon price prediction.
To better solve the complexity of carbon price series, a large number of researchers propose new strategies to apply in this field. Due to the superiority of decomposition techniques, Li and Liu [10] propose a hybrid carbon price prediction model based on the secondary decomposition of improved complete ensemble empirical mode decomposition with adaptive noise (ICEEMDAN) and the discrete wavelet transform (DWT). Ji et al. [11] propose an interval prediction framework, which assembles the improved complete ensemble empirical mode decomposition model (ICEEMD), BPNN model optimised by the sparrow search algorithm (SSA-BPNN) and the kernel density estimation (KDE) model. Zhou and Chen [12] assemble ICEEMDAN, phase space reconstruction (PSR), partial autocorrelation function (PACF) and ELM model optimized by sparrow search algorithm (SSA) to derive the final forecasting of carbon price. In order to reduce the computational effort workload of decomposition-ensemble models, some scholars resort to sample entropy technique to integrate sub-series. Cai, Zhang and Zhang [13] develop a carbon price forecasting model integrating variational model decomposition (VMD), sample entropy (SE) and optimised extreme learning machine (ELM) model. Li et al. [14] use the secondary decomposition scheme, SE and BPNN model optimized by the improved sine cosine algorithm (ISCA) for carbon price prediction. Wang et al. [15] predict carbon price series with a hybrid model assembling CEEMDAN, SE, LSTM and random forest (RF). In order to maintain the diversity of submodels, some integration models based on data sampling techniques are proposed. Li, Che and Yang [16] employ subsampled ensemble model with SVR for power load forecasting and achieve a good performance in efficiency, accuracy and stability. Gul et al. [17] construct a randomly selected subset based ensemble model, and achieve better performance than other compared models. However, lack of data representativeness of subsamples and ignorance of differences among sub-models hinder the full play to the performance of the subsampled ensemble model.
Our contribution
To sum up, an integrated model with a subsampling strategy can be of great help in carbon price forecasting. In this study, we mainly develop a new ensemble model to enhance the diversity of sub-models and improve the representativeness of subsamling. In the model, Fuzzy C-means cluster-based subsampling is first introduced to lift the data representativeness of subsamples. Secondly, a series of random forest models are constructed with the subsamples extracted. Finally, subsampled random forest models are integrated with optimal weights to derive an final ensemble model. To validate the performance of our proposed model, the prediction experiment of carbon trading price in two pilot sites of Guangzhou and Hubei is carried out. The empirical results show that our model make a prediction with a high performance.
The main contributions of this paper can be demonstrated as follows. Propose an optimal weight random forest ensemble model based on Fuzzy C-means cluster-based subsampling (FCM-OWSRFE). Use Fuzzy C-means clustering method to categorize the feature data into several clusters with similar features. Employ cluster-based subsampling technique to generate subsamples with data representativeness to construct a series of random forest sub-models. Exploit optimal weight strategy for random forest sub-models to form a final ensemble model with high precision.
Organization of paper
The remainder of the paper is arranged as follows. Section 2 describes the related methodologies and framework of the proposed model. Confirmatory experiment is implemented and results are shown in Section 3. Section 4 concludes the paper.
Framework of carbon price forecasting
An ensemble model with cluster-based subsampling is proposed in the paper. In the ensemble model, Fuzzy C-means clustering is utilized to categorize the input data into several clusters with similar features. Then a series of sub-random forest models are constructed based on the subsamples extracted from the clustering results. Finally, an optimal weight ensemble strategy is employed to improve the efficiency and forecasting performance. Specifically, the framework of the carbon price forecasting model in this paper is roughly depicted in Fig. 1.
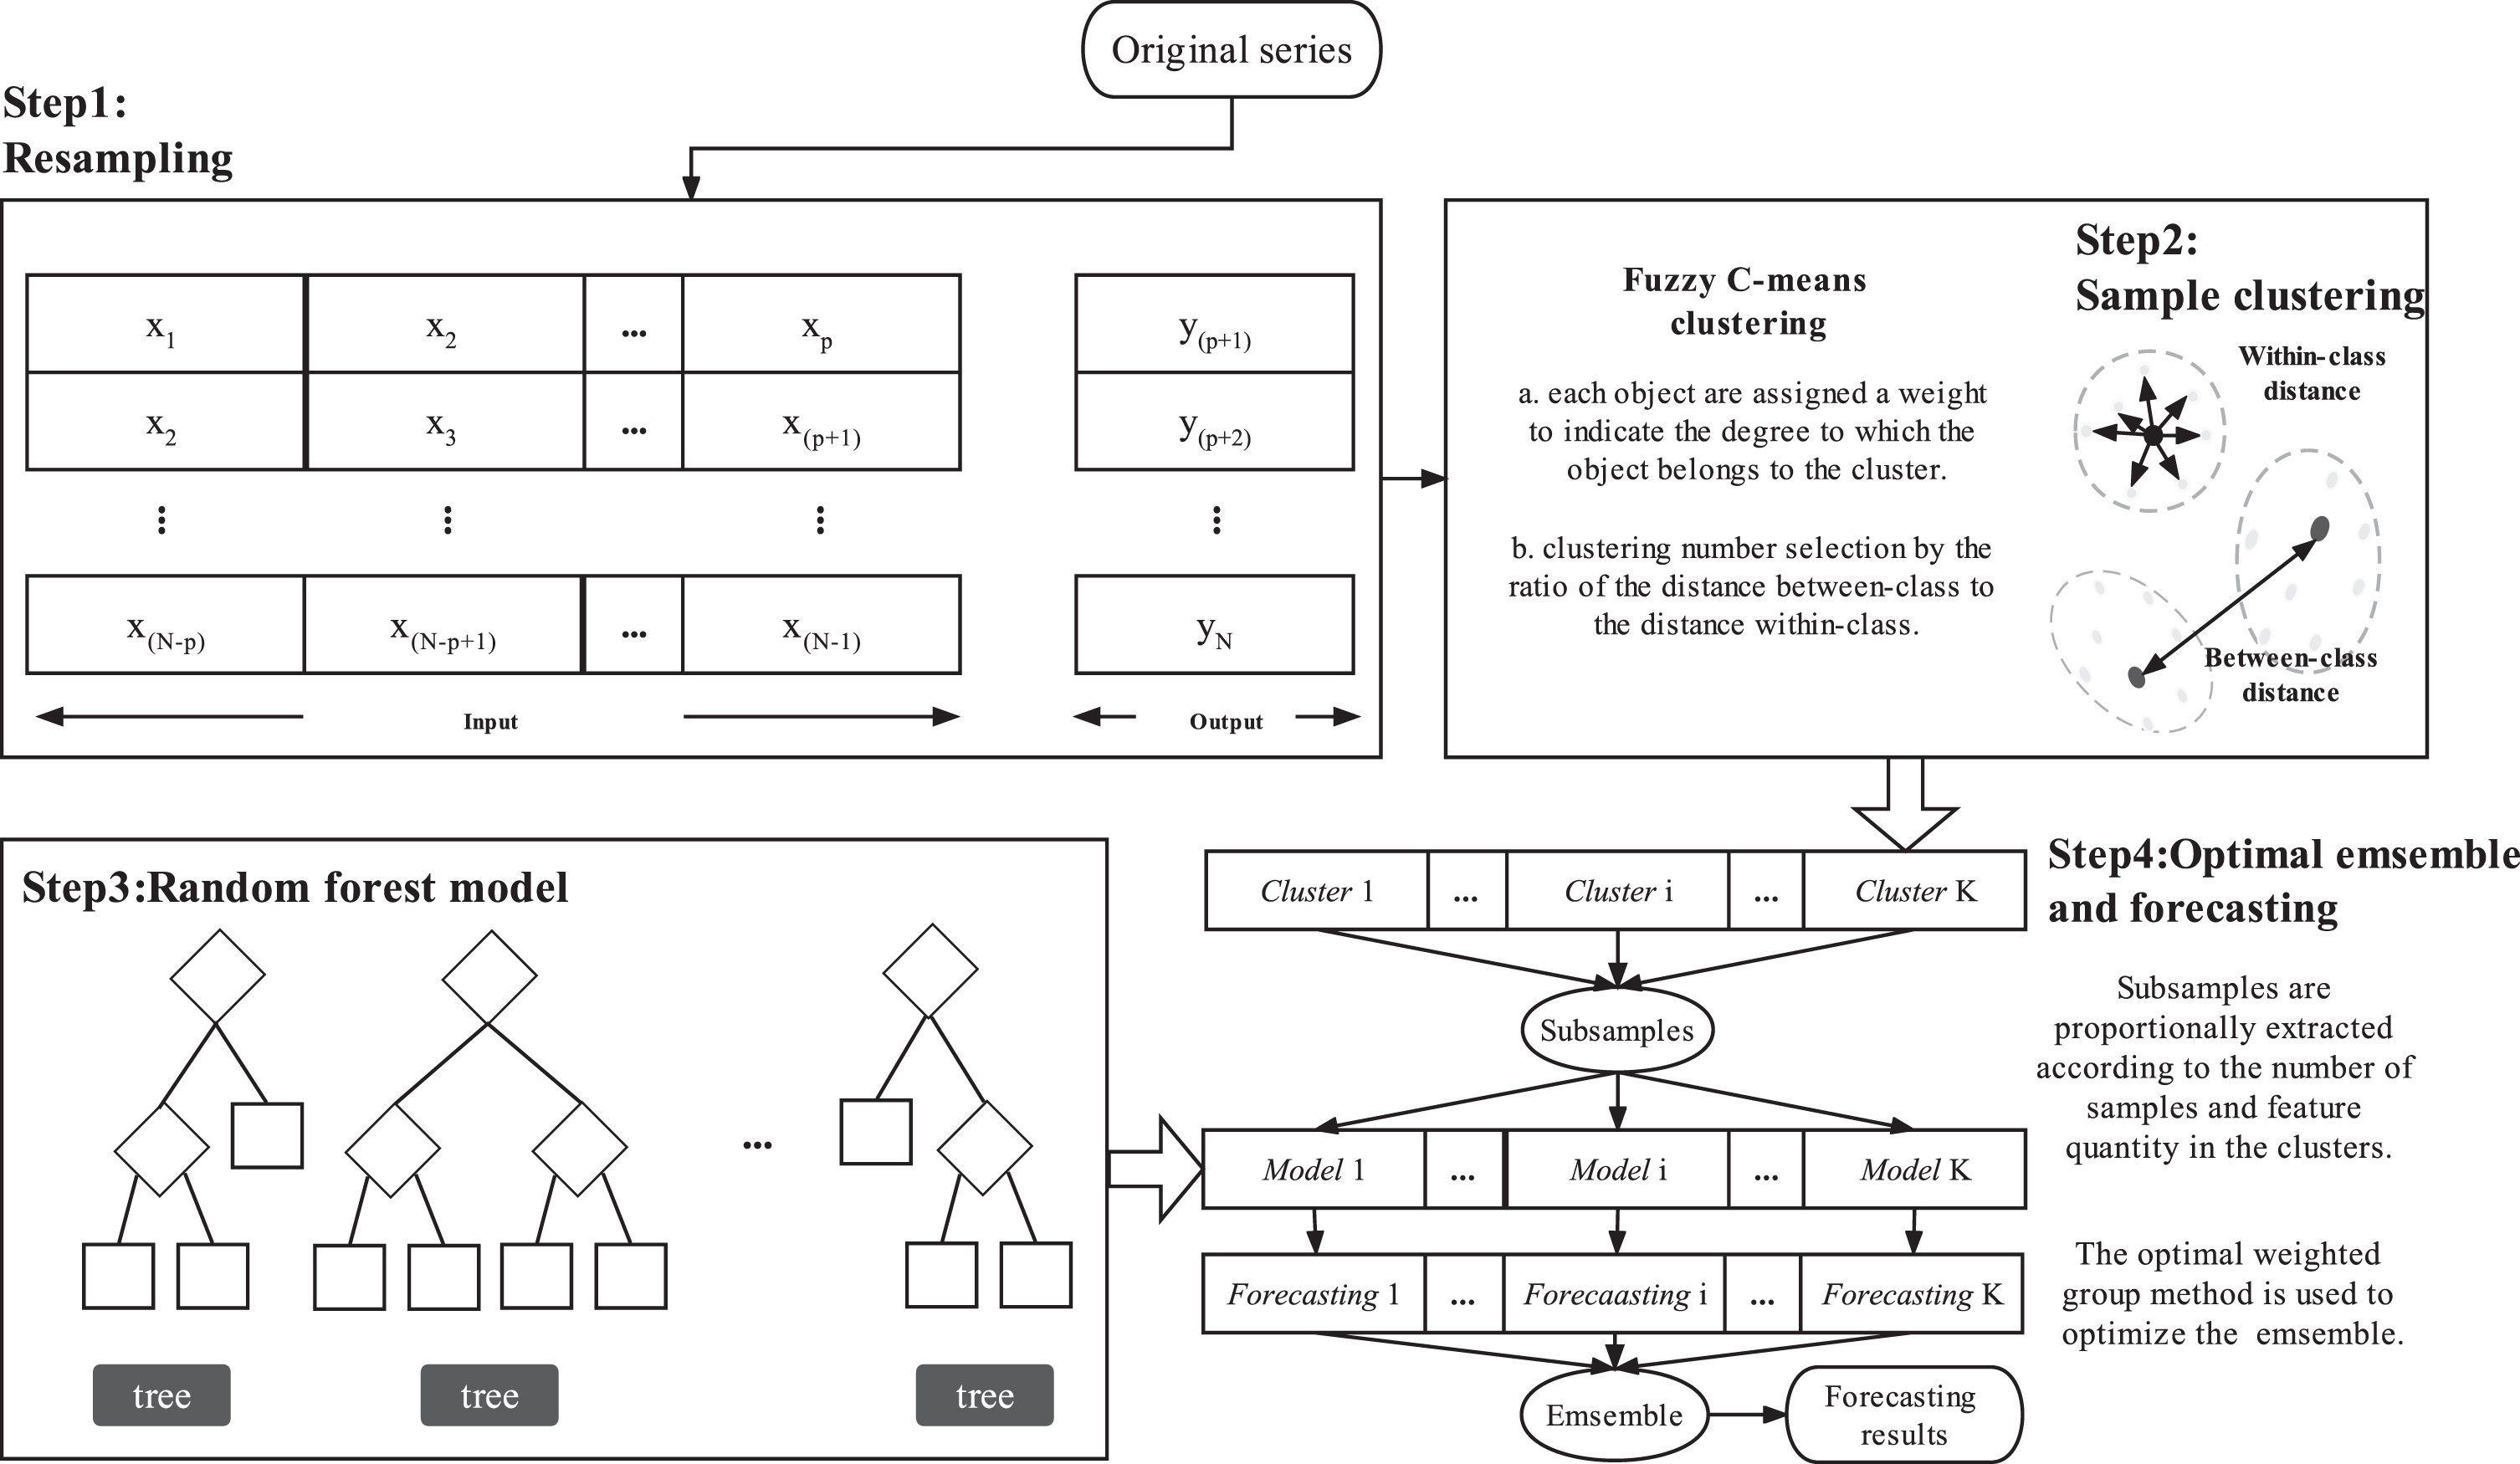
Model structure diagram.
Random Forest is an ensemble of decision trees in machine learning algorithm proposed by Leo Breiman [18, 19]. It is the efficient ensemble of multiple base learners to achieve better predictive performance than a single base learner. Because of its effective processing of large-scale and multidimensional nonlinear data, excellent feature selection ability and strong generalization ability, we mainly employ random forest regression as sub-models in this study. The random forest regression model is composed of a series of regression trees h (x, θ
t
) , t = {1, 2, ⋯ , T}, which takes the mean value of each decision tree h (x, θ
t
) as the regression prediction value using integrated learning. Specifically,
In the construction of each regression tree, p candidate features should be chosen and the optimal feature is chosen in succession for branching from the rest of features. Let S be the set of N objects with P variables. The specific steps of random forest regression algorithm are listed as follows: Sample a subset of n objects at random with replacement from the set S for growing the tree. Train a tree with the subset from Step 1. Specify a number p (p ⪡ P) such that at each node, p variables are chosen at random from the P variables and the best split on the selected p variables is used to split the node. Grow the tree to the largest extent and there is no pruning(Random forests prevent overfitting by integrating multiple decision trees with diversity). Repeat Step 1 and Step 2 to generate a series of regression trees. The final prediction is obtained by averaging the predictions from all regression trees from Step 3.
As a supervised learning method, random forest has good noise resistance. However, training a large number of samples can be computationally expensive and time-consuming for model learning, which can ultimately decrease the efficiency of the model. Specifically, a series of subsamples of size n (⪡N) are extracted from the original dataset to construct sub-random forest models SRF1 (
As we know, different choices of weights will lead to ensemble models with different efficiencies. Li, Che and Yang [16] employ the subsampled support vector regression ensemble with equal-weights for short term electric load forecasting. Intuitively, the better performance a sub-model has, the more weight should be be placed, vice versa. To derive the optimal weights in the least squares sense, the following objective function with constraints should be solved:
According to equation (2) and the objective function (3), we know that the ensemble model SRF (
For general subsampling techniques, random sampling without replacement is adopt and data representativeness of the subsamples can not be guaranteed. However, the performances of sub-models are highly dependent on the data representativeness of the subsample data. Therefore, it is necessary to take measures to ensure the representativeness of the sampled data. In this study, Fuzzy C-means clustering is first used to divide the sample into several clusters according to feature similarity. Then subsampling is implemented based on the results of Fuzzy C-means clustering.
Fuzzy C-means clustering
Fuzzy C-means clustering (FCM) is a soft clustering algorithm which incorporates the core of fuzzy theory [20]. Compared with the hard K-means clustering, FCM provides more flexible clustering results. FCM assigns a degree to each cluster for each observation for illustrating the extent that the observation belongs to the cluster. Let
The objective function (5) is minimized when all the objects in dataset close to the centroids of their clusters are assigned large membership values, and small membership values are assigned to the objects far from the centroids. It is an extreme problem with constraints and we can solve it by Lagrange multiplier method and derive the following results [20, 21]:
To obtain the optimal clustering results, equation (7) and equation (8) should be updated alternately with an initial values for all the membership degrees u
ij
(i = 1, ⋯ , N, j = 1, 2, ⋯ , C) until the memberships converge [22]. The flowchart of FCM clustering algorithm is listed as follows. Given the cluster number C, fuzzy weighted index m and convergence threshold ϵ. Initialize randomly the fuzzy partition membership matrix U = (u
ij
) N×C and calculate the cluster center V = (v1, v2, ⋯ , v
C
) according to equation (8). Update the fuzzy partition membership matrix U = (u
ij
) N×C according to equation (7). Update the cluster center V = (v1, v2, ⋯ , v
C
) according to equation (8). If ∥Ut+1 - U
t
∥ ≤ ϵ, the algorithm stops and derives the final clustering result.
After the optimization, the category of the sample point is determined by comparing the distance between the sample point and each cluster center. Based on the above procedure, we can get the number of samples for each category, denoted by N i (i = 1, ⋯ , C).
The choice of cluster number is critical to the clustering result and hence is of an important impact on the data representativeness of the subsamples. Intuitively, the larger the scatter between the clusters and the smaller the variance within each cluster, the better the clustering. Hence, we define an evaluation metric L (C) with respect to the cluster number C as the ratio of the inter-cluster distance to the sum of variances within each cluster, to measure the effect of Fuzzy C-means clustering as follows.
From the equation (9), we know that C - 1 and N - C are the freedoms of
After clustering, subsampling can be carried out among clusters to make subsamples representative. However, how to allocate the subsample size among each cluster given total subsample size to make the features of subsamples balanced is an outstanding issue. Generally speaking, the more features or the more objects the cluster has, the more samples from the cluster should be extracted. Following [23], the optimal sample size allocation is to minimize the following objective function:
In this study, we random draws samples in each cluster with fixed number according to equation (11).
To derive an ensemble model with higher accuracy, we combine an optimal weight subsampled random forest regression ensemble model integrating Fuzzy C-means clustering (FMC-OWSRFE). Firstly, we determine the cluster number according to (9) and use Fuzzy C-means clustering to group the traning data into C clusters. Secondly, cluster-based subsampling strategy is adopted to form a number of representative subsamples with fixed size. Thirdly, a series of subsampled random forest regression models are built based on the subsamples. Lastly, all the subsampled random forest regression models are combined with optimal weights to derive a final ensemble model. See Algorithm 1 for details of FCM-OWSRFE model.
The training set
m: number of ensembles
n: size of subsamples.
2.Determine the cluster number C according to the minimization of objective function (9).
3.Determine the sample allocation scheme n1, n2, ⋯ , n C based on equation (11).
4.
1)Randomly choose n k samples without replacement from the kth cluster (k = 1, 2, ⋯ , C) to form a subsample.
2)Utilize the subsample to build a subsampled random forest model SRF
j
(
5.Solve optimal weights k1, k2, ⋯ , k m by quadratic programming algorithm.
6.Combine the sub-models SRF1 (
7.
Confirmatory experiment
To validate the effectiveness of our proposed FCM-OWSRFE model, we examine it using the datasets obtained from the case of Guangzhou Carbon Emission Exchange and Hubei Carbon Emission Exchange, respectively. The dataset of Guangzhou Carbon Emission Exchange has 928 items, which covers the opening price, closing price, change amount, change rate, trading volume and trading value of carbon emission allowances from December 28, 2018 to October 14, 2022. The dataset of Hubei Carbon Emission Exchange has 988 items, which contains the closing price, change rate, trading volume and trading value of carbon emission allowances from January 2, 2019 to May 5, 2023. Fig. 3 shows the historical data of carbon trading prices in the two cases. To illustrate the efficacy of our algorithm, we randomly select 80% of the reconstructed data as training set, and the rest 20% as test set.
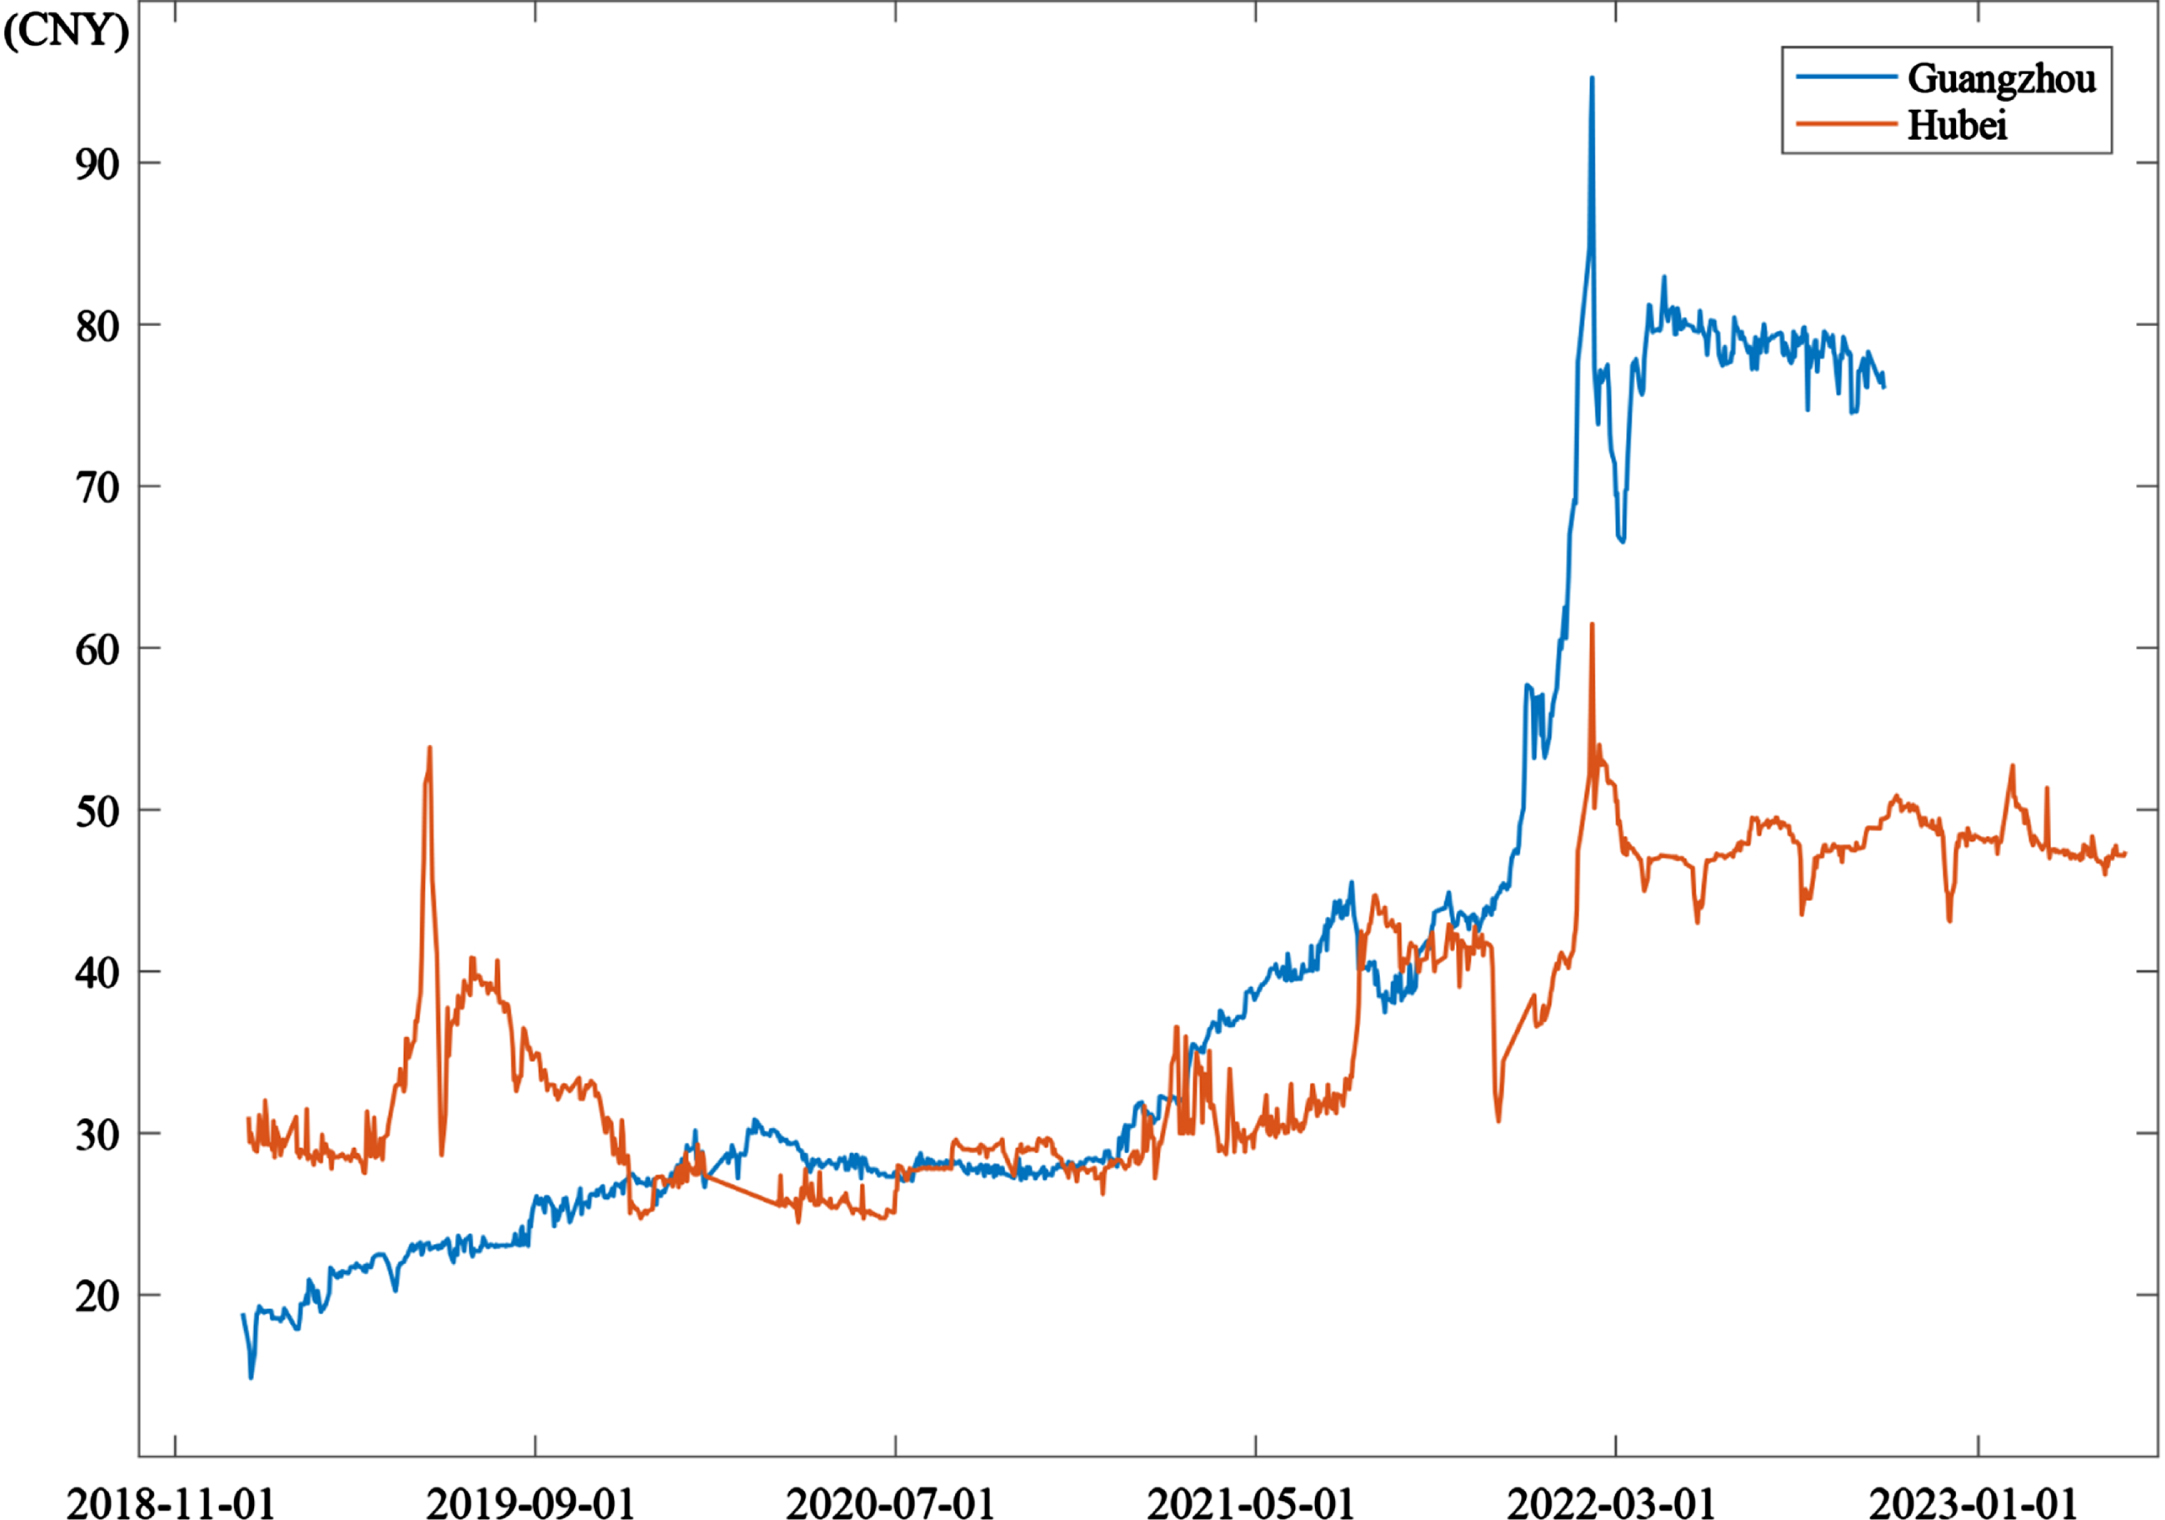
Historical data of carbon trading prices of Guangzhou dataset and Hubei dataset.
Before data analysis, the dataset should be normalized for Fuzzy C-Means. There are many methods for data normalization, such as Min-Max scaling method, Z-score scaling method, decimal scaling method and so on. In this study, Z-score normalization is adopted by default for data preprocessing. According to the Z-score normalization technique, each variable X in the data is scaled into unit variance by the following equation:
To evaluate the performance of the prediction model comprehensively, root mean square error (RMSE), mean absolute error (MAE) and mean absolute percentage error (MAPE) defined as follows are used as the evaluation criteria.
Cluster number is an essential parameter in our framework, which immediately determine the representativeness of the subsamples extracted. Fig. 3 describes the values L (C) with the cluster number from 2 and 10 of Guangzhou training set and Hubei training set, respectively. We see that Guangzhou training set reaches the highest value of L (C) of 654.90 at cluster number 2 and Hubei training set has the largest value L (C) of 673.52 at cluster number 4. Therefore, we employ cluster number 2 as the optimal cluster number both for Guangzhou training set and employ cluster number 4 as the optimal cluster number both for Hubei training set.
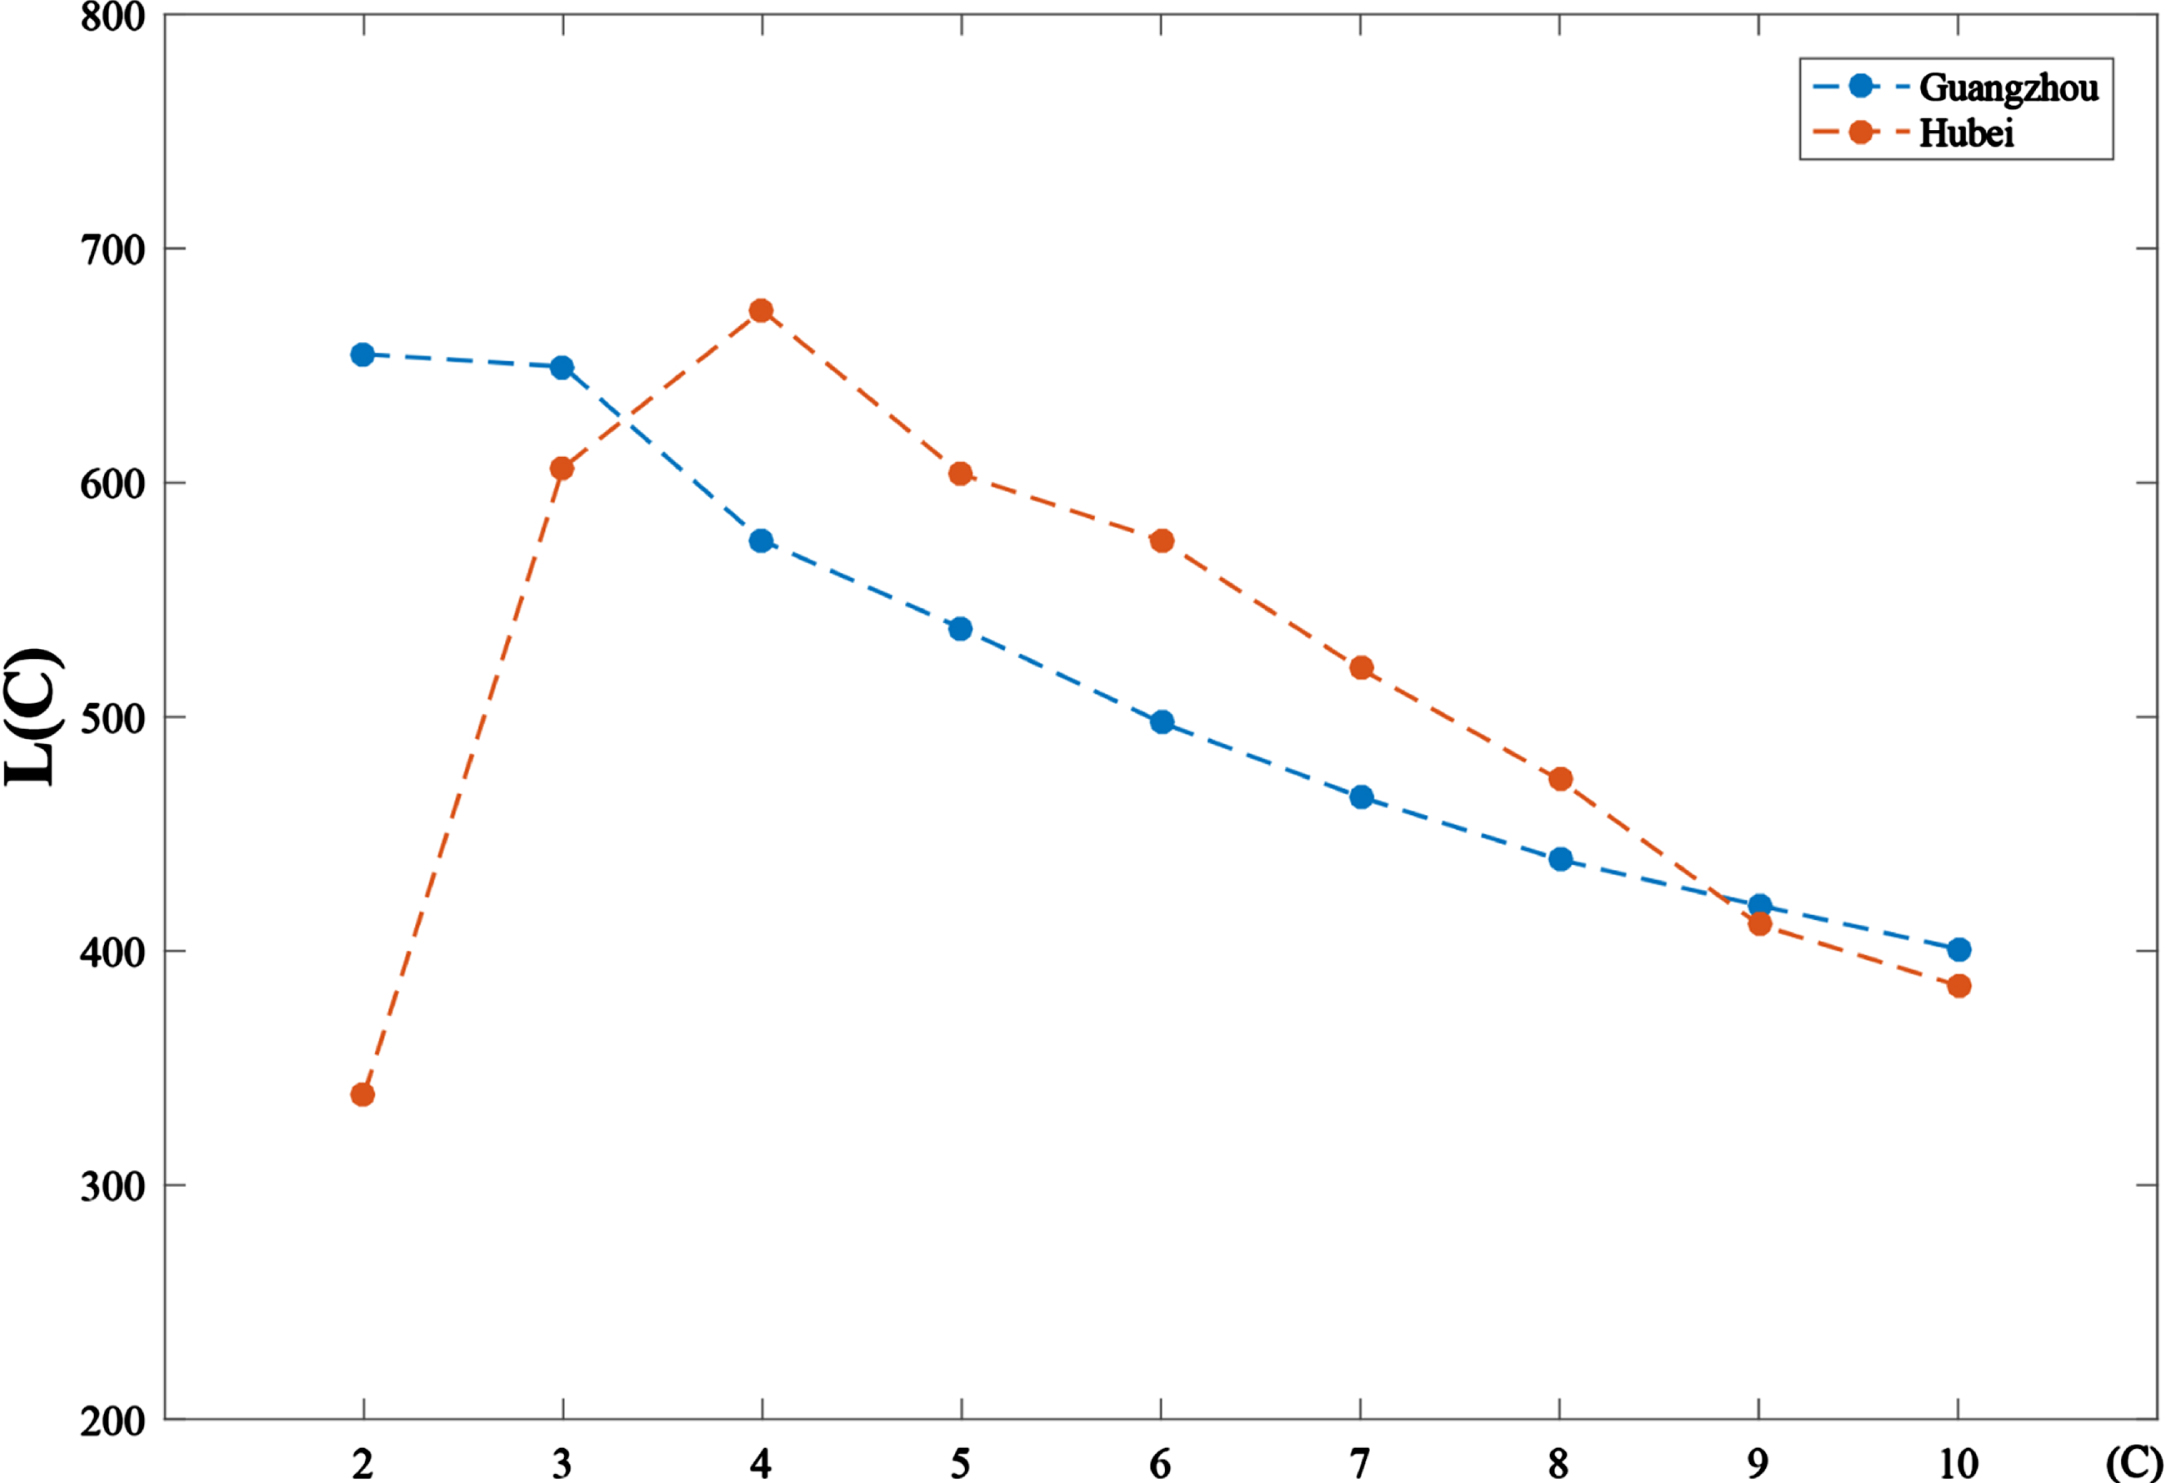
Evaluation metric L (C) with different cluster number C.
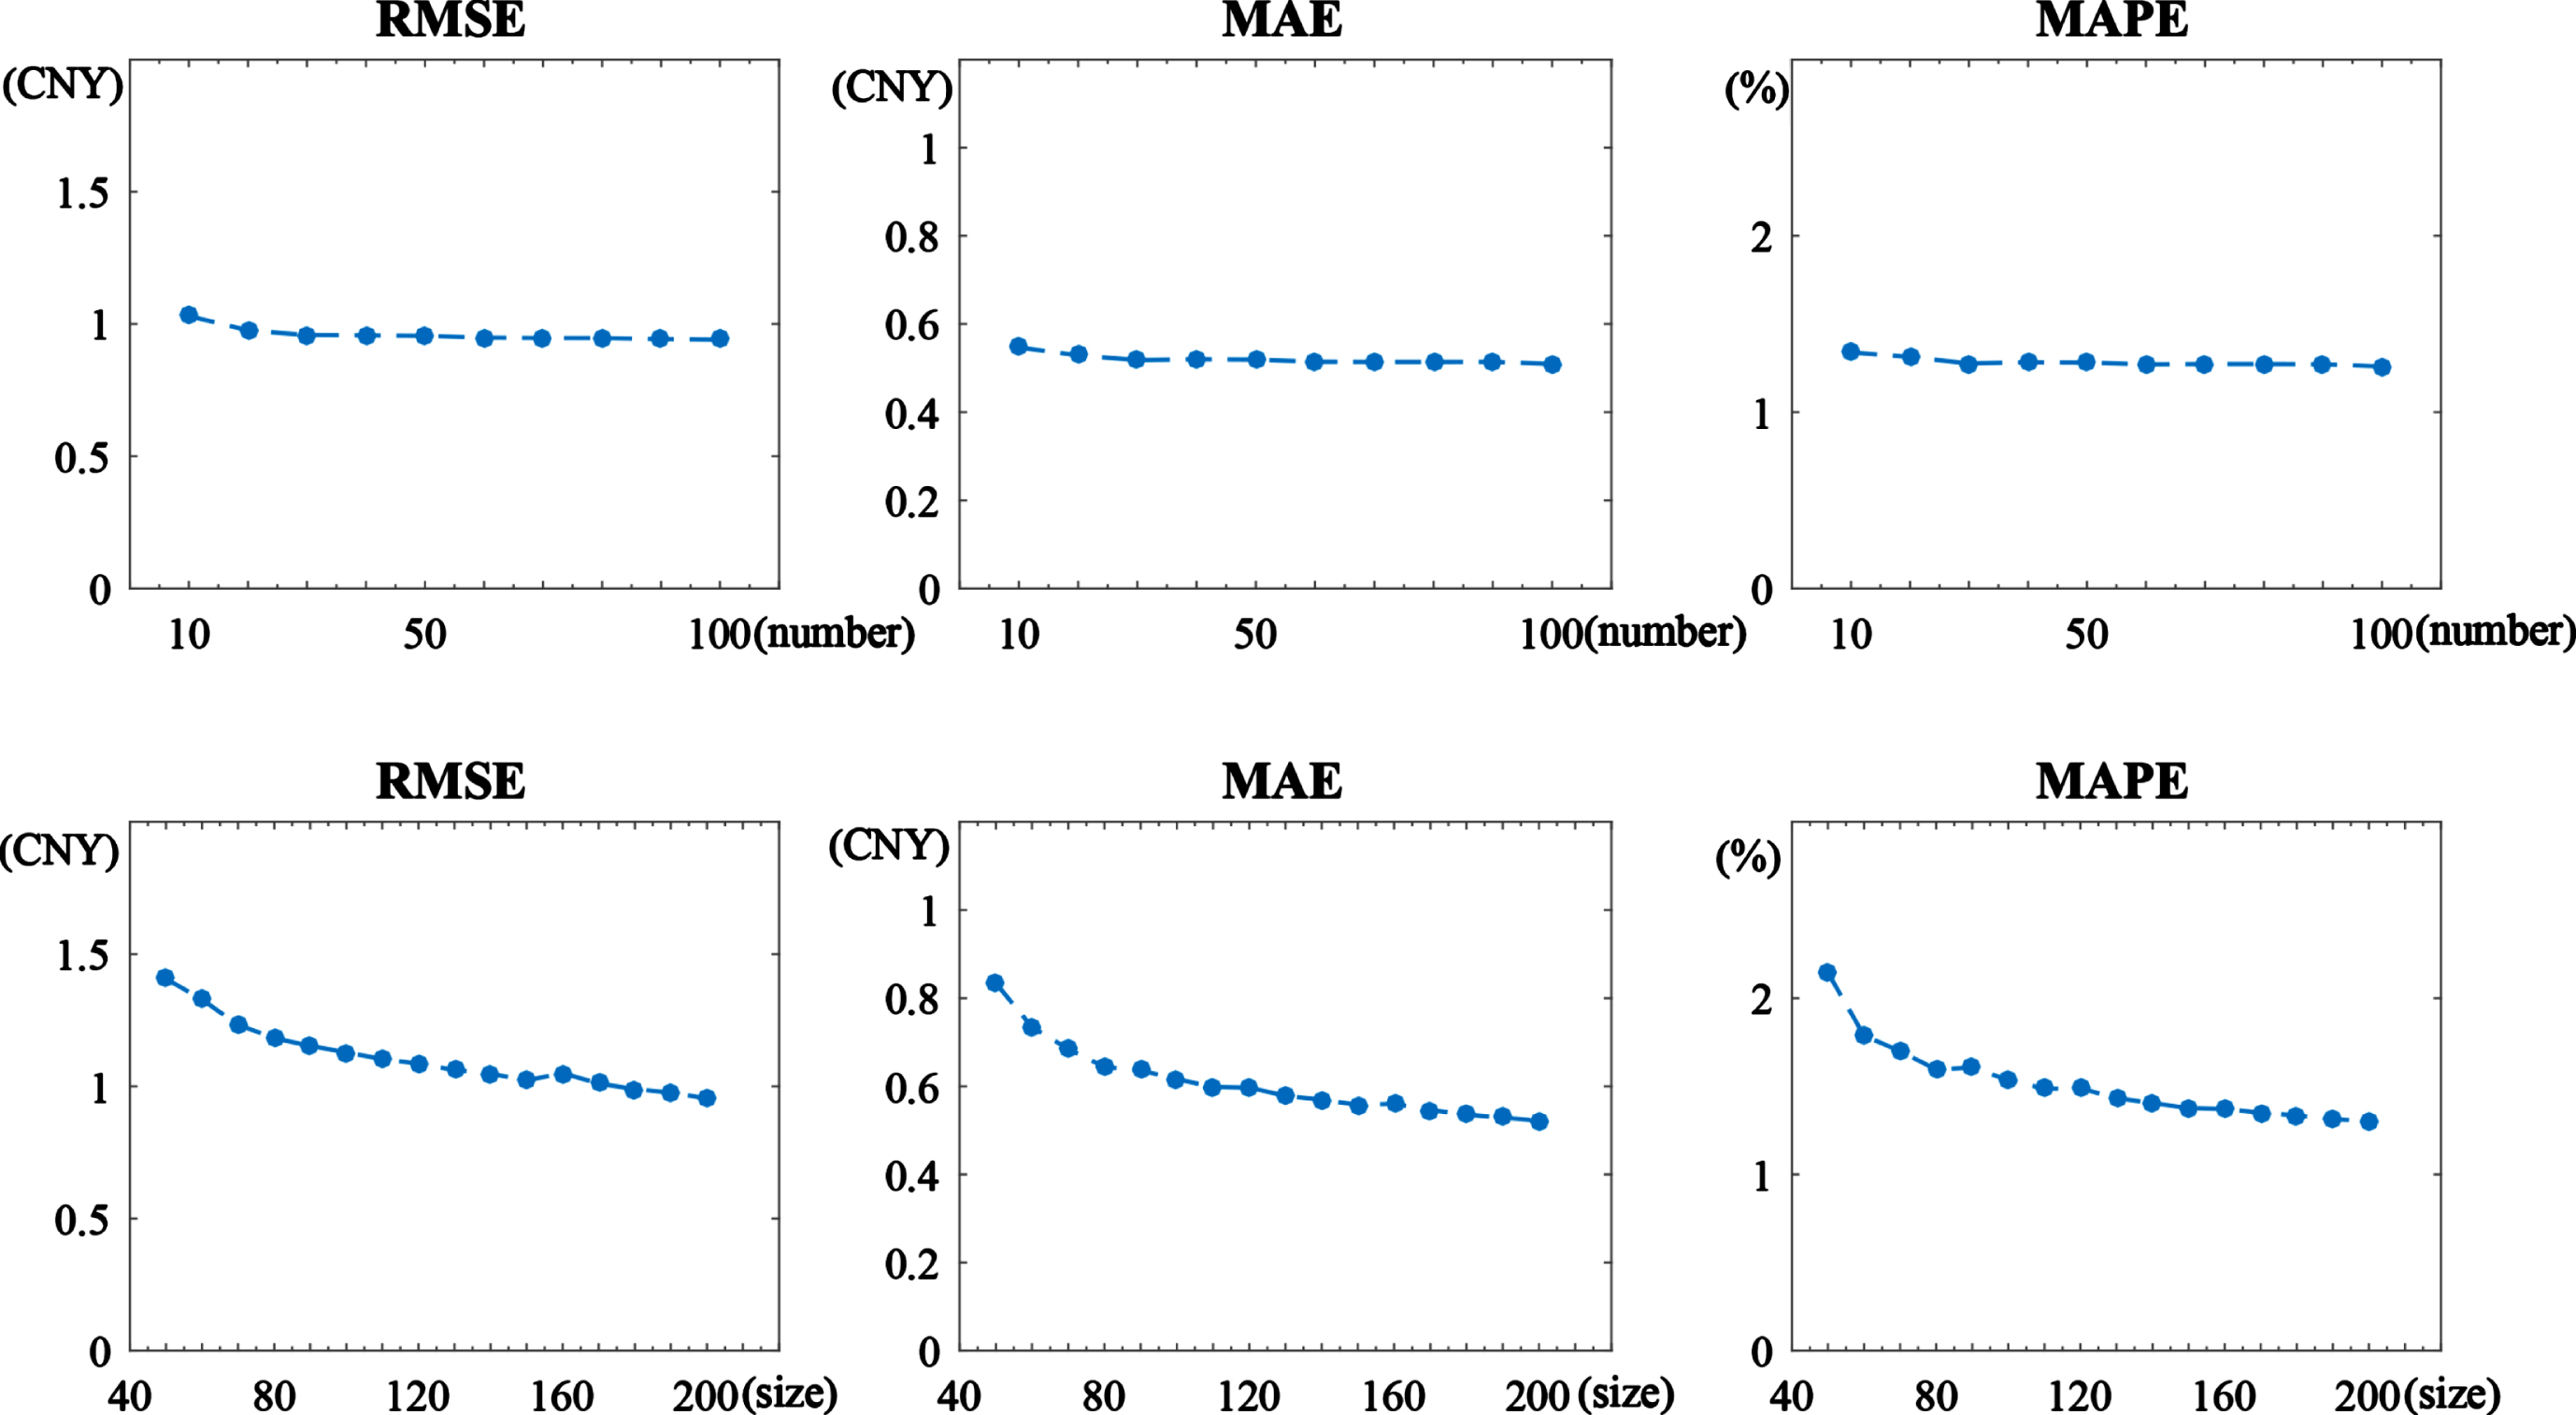
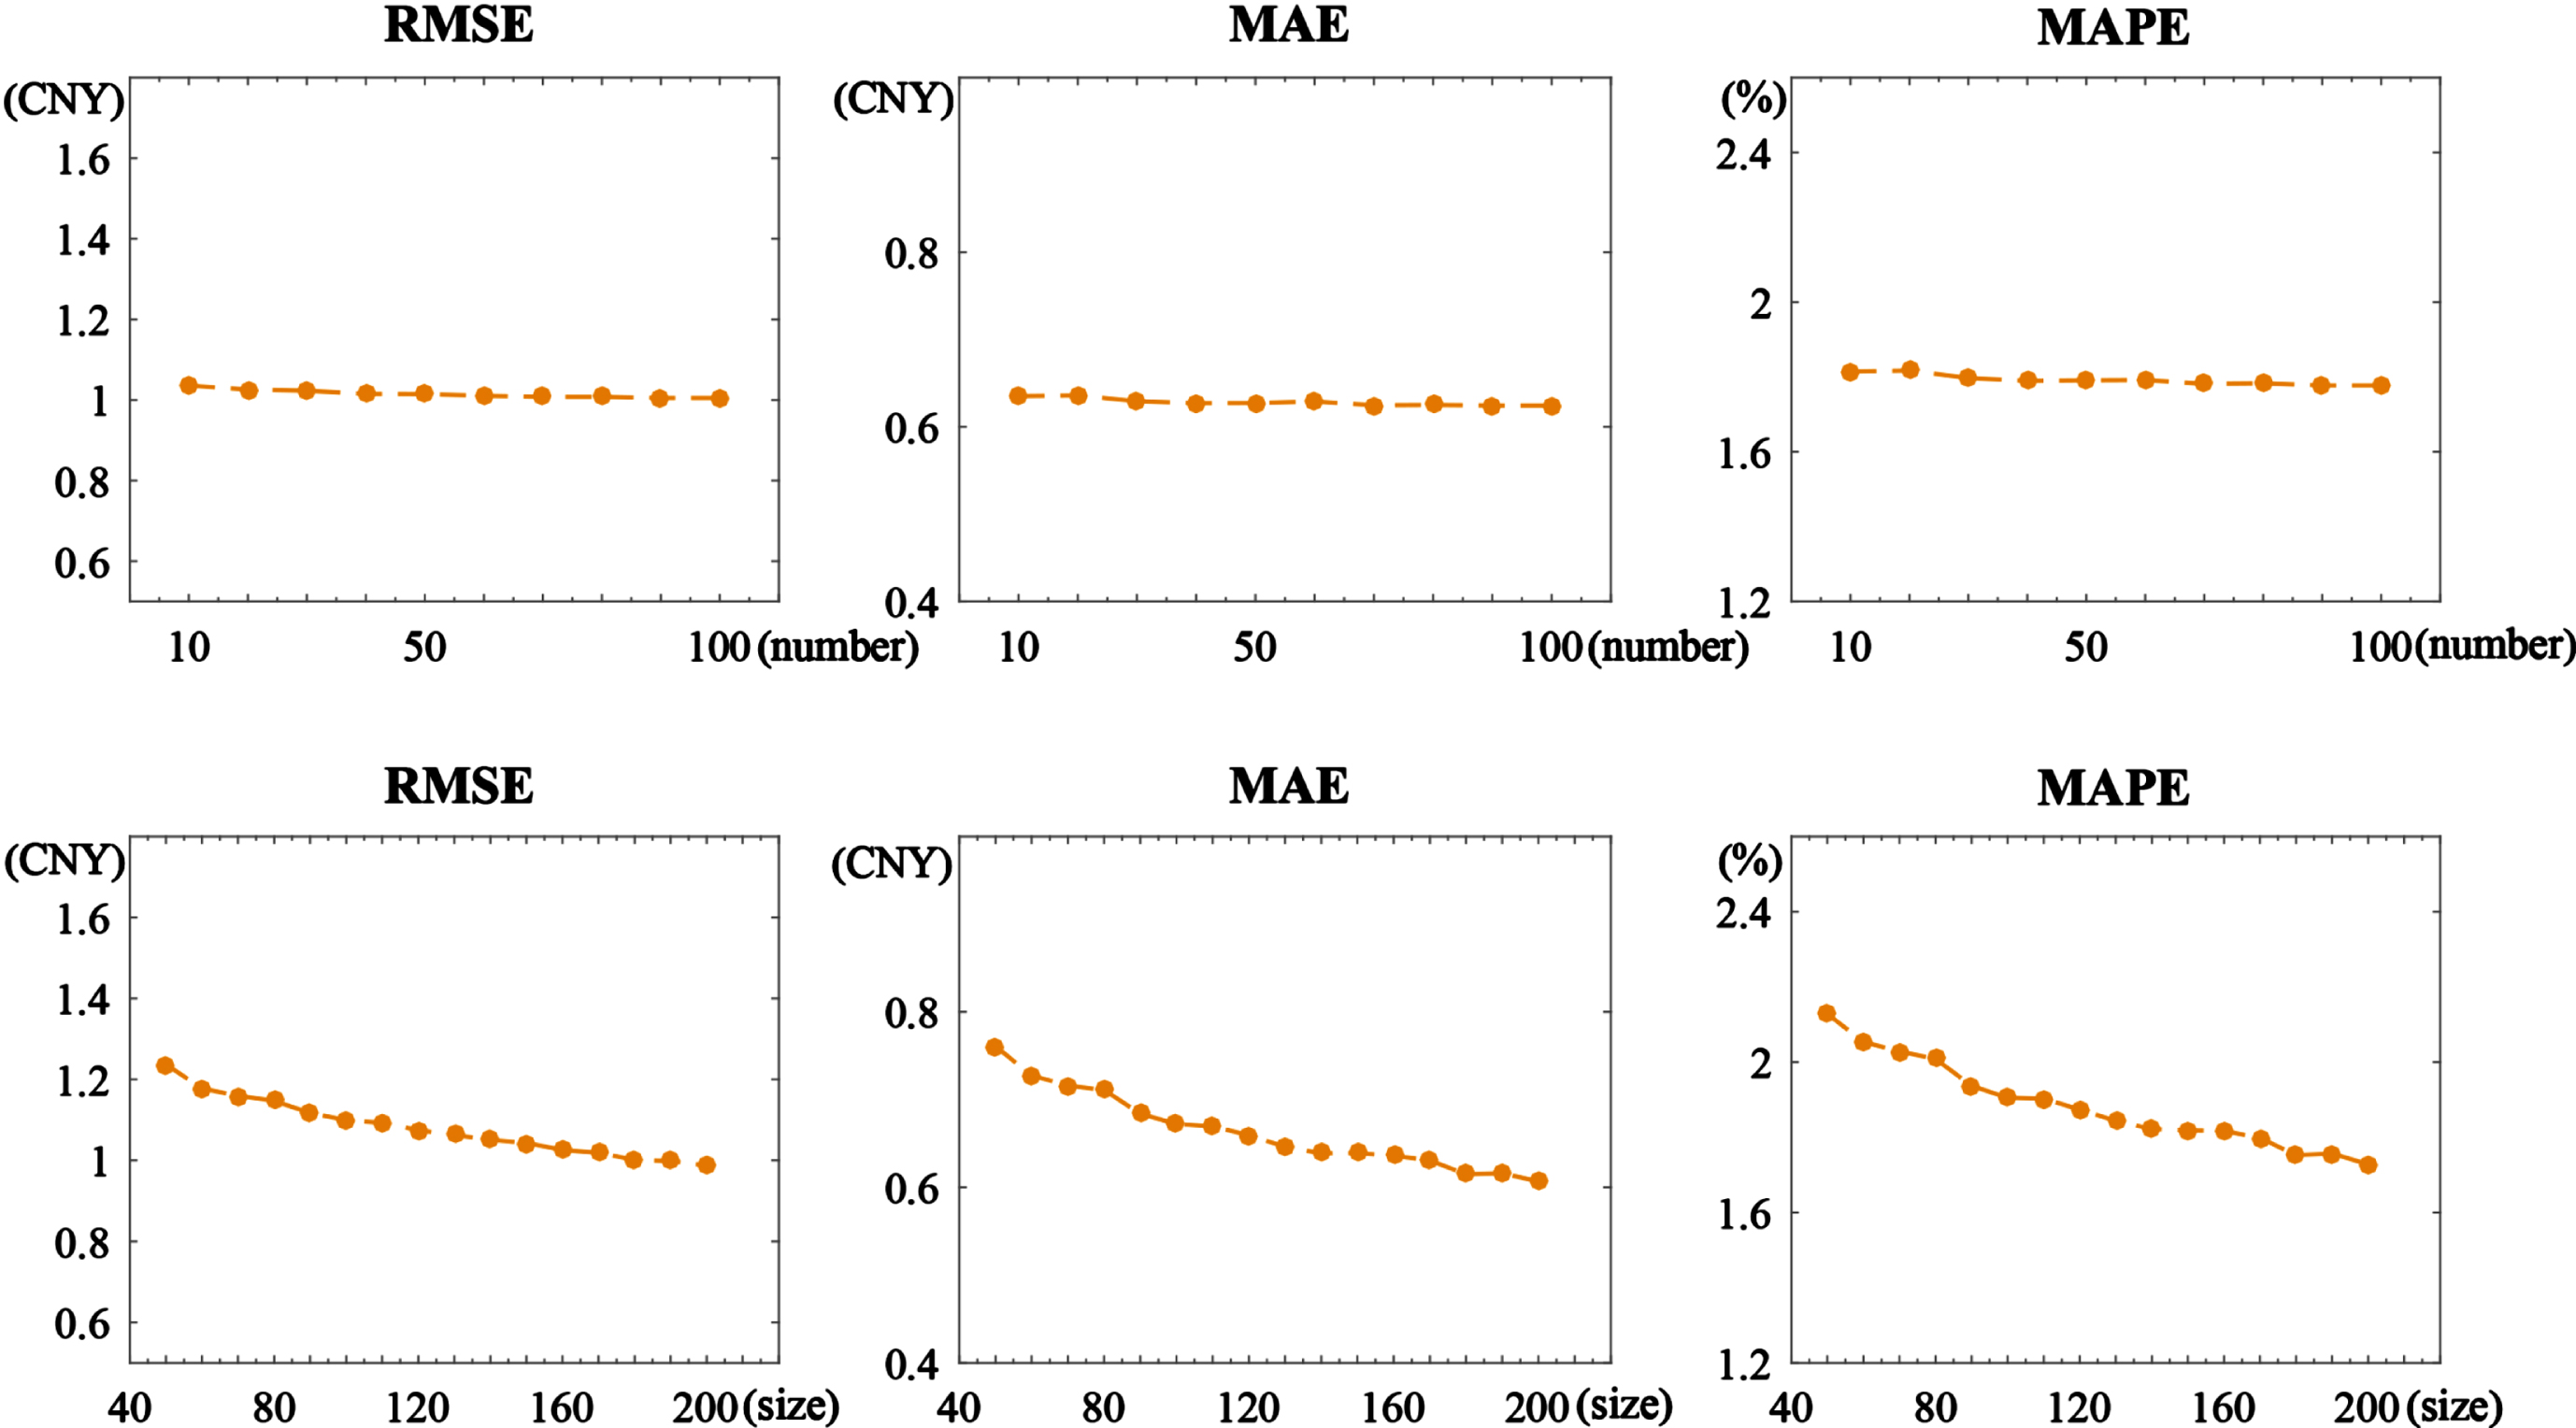
From the introduction of FCM-OWSRFE model above, we know that the ensemble number and subsample size extracted are of a significant effect on the performance of the model. Owing to the differences of the sample sizes and features between Guangzhou dataset and Hubei dataset, the appropriate number of the ensembles and size of the subsamples maybe different. In this study, we determine the ensemble number and subsample size through a series of experiment. The top three panels of Fig. 4 represent the curves of the three evaluation criteria RMSE, MAE and MAPE with respect to the ensemble number for a fixed subsample size 190 for the Guangzhou training set. It is clearly observed that the prediction error decreases with the increase of the ensemble number and reaches stability when the number of the ensemble is above 20. The bottom three panels of Fig. 4 show the performance of the FCM-OWSRFE model for different subsample size with a fixed ensemble number 20. As we can see, 190 is an stable point. Therefore, we select subsample size 190 and ensemble number 20 for Guangzhou dataset.
Similarly, Fig. 5 represents the determination of subsample size and ensemble number for Hubei training set. The top three panels shows that the three evaluation criteria RMSE, MAE and MAPE reach a stable status at ensemble number 20 when the subsample size is 160. The bottom panels show that 160 is a good choice for subsample size when the ensemble number is 20. In our study, as a consequence, we set the ensemble number 20 and subsample size 160 for Hubei training set. From the experimental results of Guangzhou dataset and Hubei dataset, it is interesting to see that our ensemble model is not sensitive to the ensemble number but the subsample size. This suggests that the subsample size plays a crucial role in determining the accuracy and reliability of the predictions.
Performance of FCM-OWSRFE model based on different ensemble numbers and subsample sizes of Guangzhou training set. Top panels have a fixed subsample size 190. Bottom panels have a fixed ensemble number 20.
Performance of FCM-OWSRFE model based on different ensemble numbers and subsample sizes of Hubei training set. Top panels have a fixed subsample size 160. Bottom panels have a fixed ensemble number 20.
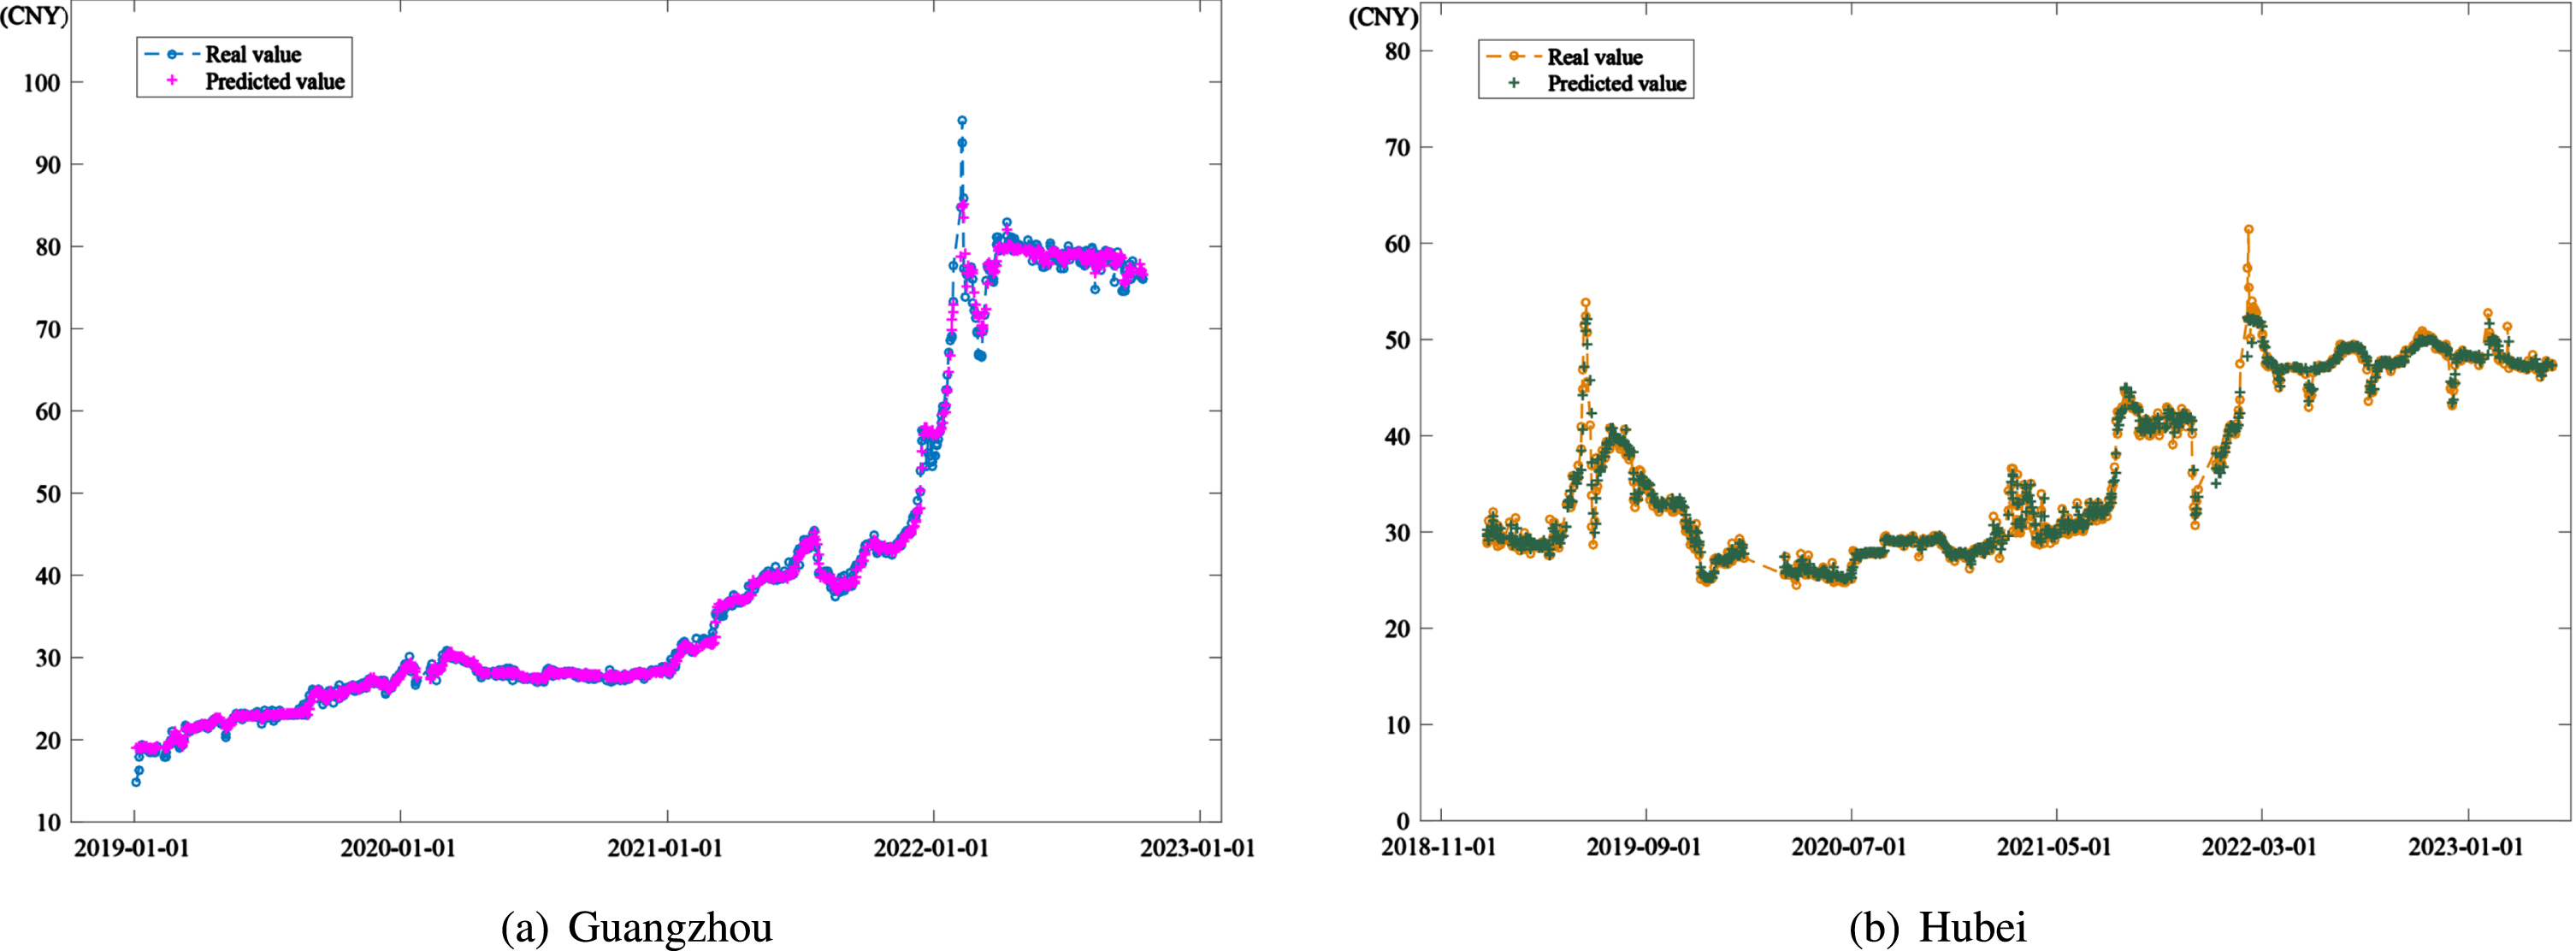
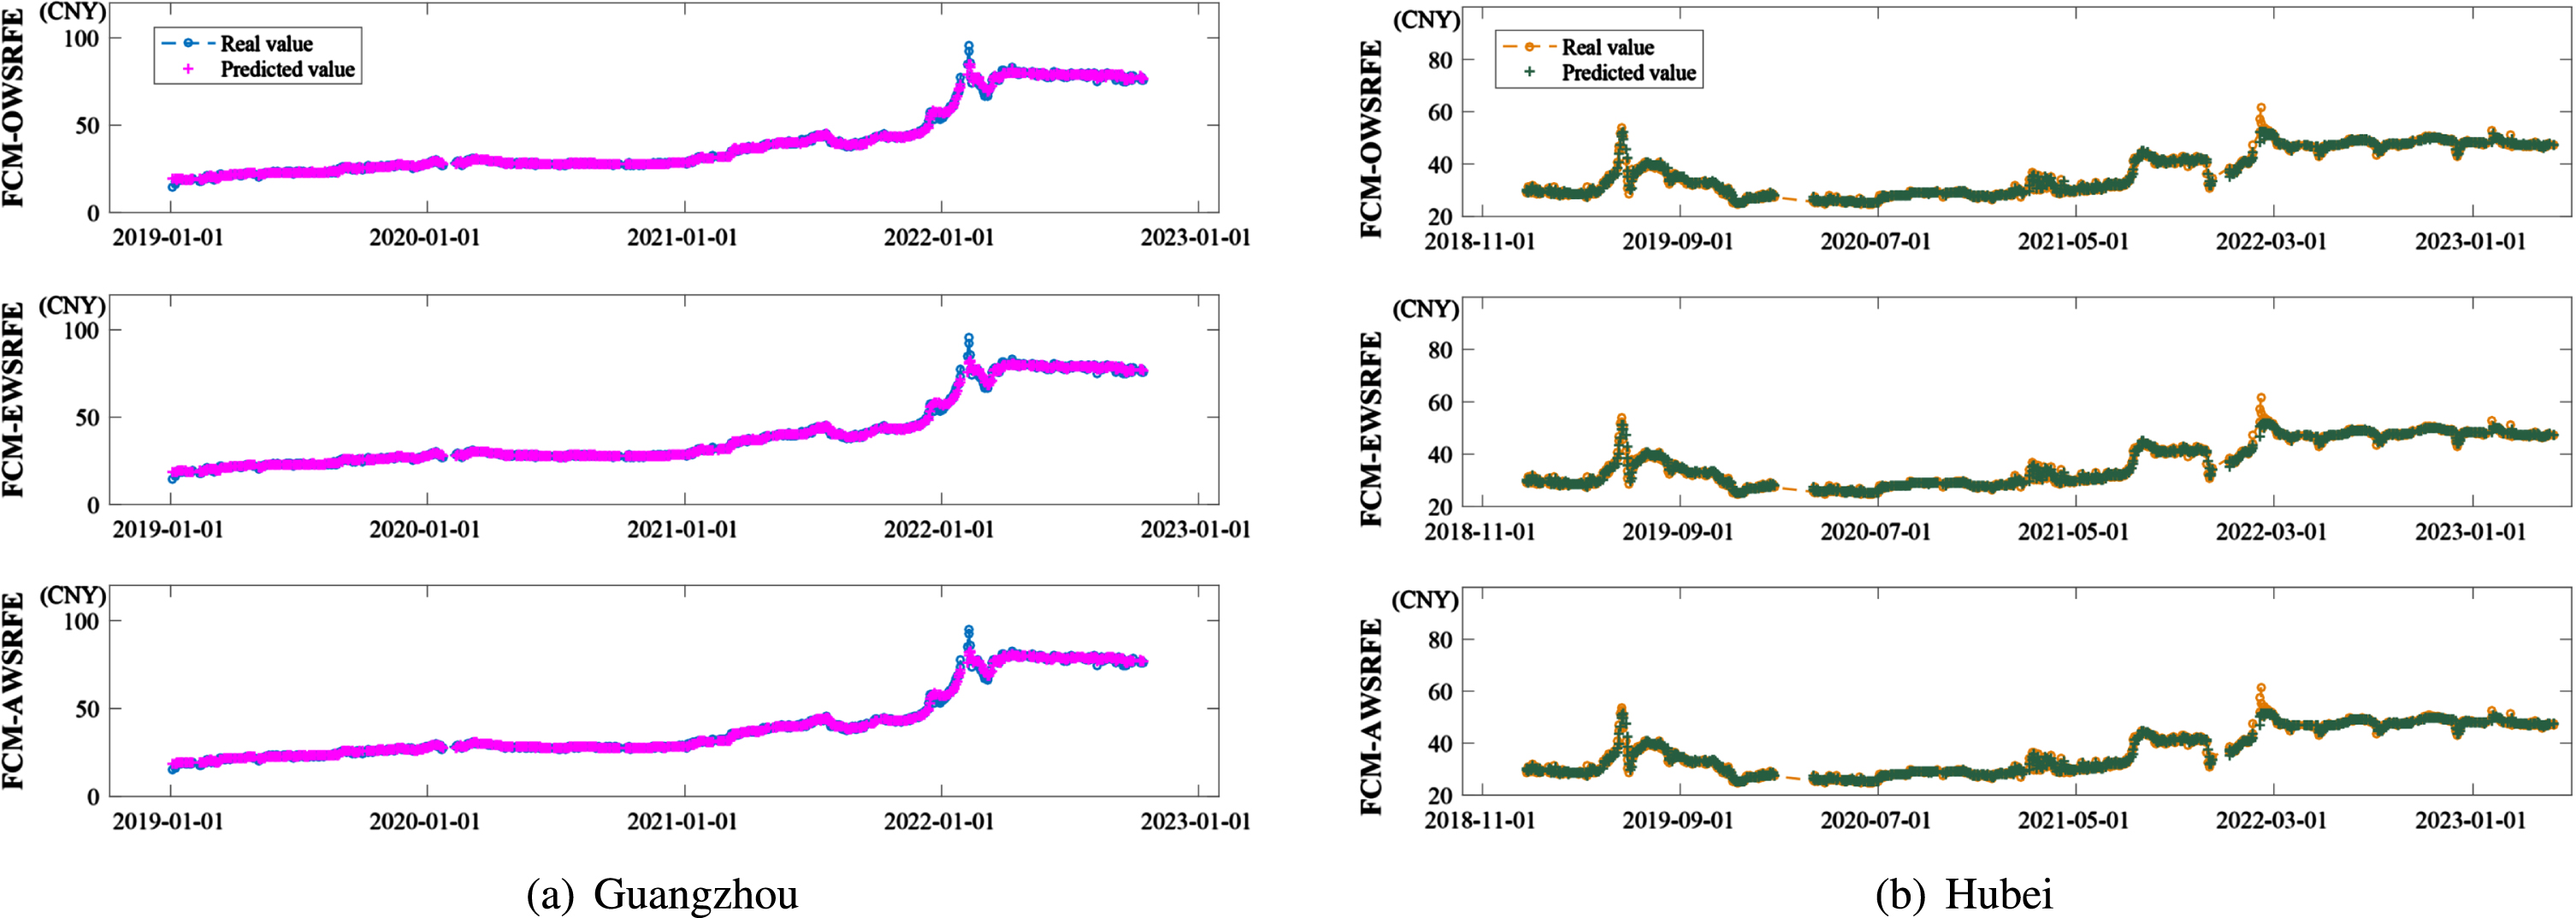
Carbon price prediction with FCM-OWSRFE model on the data of (a) Guangzhou and (b) Hubei, respectively.
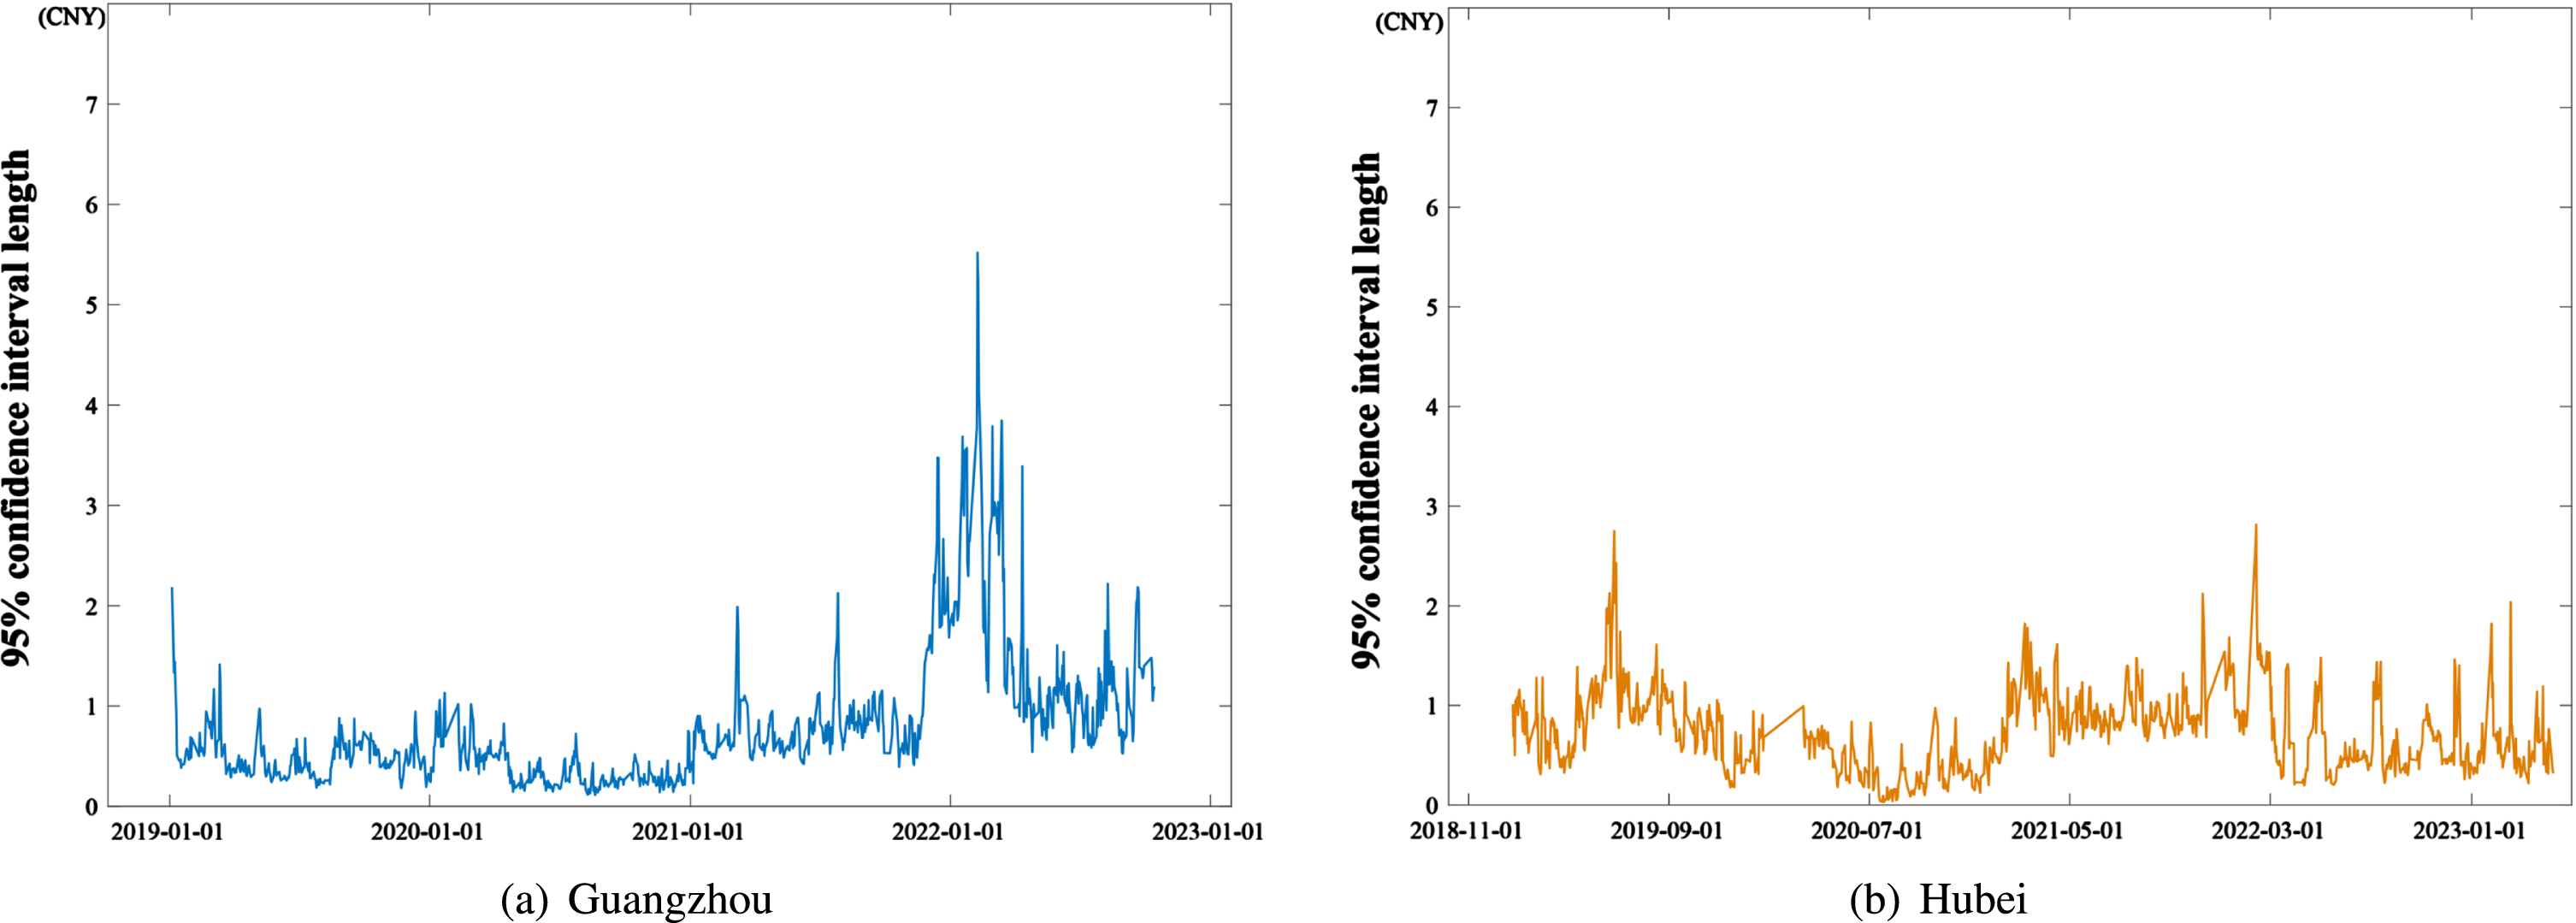
95% confidence interval length of carbon price prediction with FCM-OWSRFE model on the data of (a) Guangzhou and (b) Hubei, respectively.
Fig. 6 illustrates the results of carbon price prediction by FCM-OWSRFE model of Guangzhou dataset and Hubei dataset, which shows that FCM-OWSRFE model performs well for both dataset. Based on Monte Carlo simulation, we select different subsamples to a large number of FCM-OWSRFE models and derive the 95% confidence intervalof FCM-OWSRFE model, the length of which is shown in Fig. 7. Compared with the amplitude of the original carbon price depict in Fig. 2, we can see that the interval length is relatively small, which shows that FCM-OWSRFE model has a robust performance.
Table 1 reports the prediction performances of equal weight subsampled random forest ensemble model (AWSRFE), equal weight random forest ensemble model with Fuzzy C-means cluster-based subsampling (FCM-SRFE), optimal weight subsampled random forest ensemble model (OWSRFE) and FCM-OWSRFE model, respectively. For both Guangzhou test set and Hubei test set, FCM-OWSRFE model performs best, where RMSE, MAE and MAPE are 1.0385, 0.5834, 1.45% for Guangzhou test set, 1.2035, 0.6718 and 1.83% for Hubei test set. Moreover, compared the results of AWSRFE model and the ones of FCM-AWSRFE model, the results of OWSRFE model and the ones of FCM-OWSRFE model, we can see that Fuzzy C-means clustering improves the prediction effect owing to the promtion of data representativeness, irrespective of Guangzhou dataset or Hubei dataset. Similarly, compared the results of AWSRFE model and the ones of OWSRFE model, the results of FCM-AWSRFE model and FCM-OWSRFE model, Optimal weight strategy adopted in this paper can greatly enhance the prediction power with the same subsamples.
Performance of five subsampled ensemble models on test set
Performance of five subsampled ensemble models on test set
To further demonstrate the efficacy of the optimal weight scheme, some other weight strategies are considered. Li, Che and Yang [16] choose a strategy of equal weights in the subsampled support vector regression ensemble model for power load forecasting, which is the same as the weighted strategy of AWSRFE model and FCM-AWSRFE model. Huang et al. [24] utilize the entropy weight scheme to determine the weights of multiple linear regression (MLR), artificial neural network (ANN) and support vector machine (SVM) in the combination model for predicting the normalized difference vegetation index in the Yellow River basin. If the entropy weight scheme is adopted in subsampled random forest ensemble model with Fuzzy C-means cluster-based subsampling, then FCM-EWSRFE model is derived. Fig. 6 illustrates the prediction results of FCM-AWSRFE model, FCM-EWSRFE model and FCM-OWSRFE model for both Guangzhou dataset and Hubei dataset. It can see that the FCM-OWSRFE model efficiently produces the most accurate results, which shows that the optimal weight scheme has the best performance. Fig. 9(a) and Fig. 9(b) depict the real data and forecasted data of three different weight methods for Guangzhou dataset and Hubei dataset, respectively. As we can see, although all the three models approximate the original data well, the FCM-OWSRFE model performs best near the peak and valley, which shows the efficacy of the FCM-OWSRFE model in reconstructing the features of carbon price.
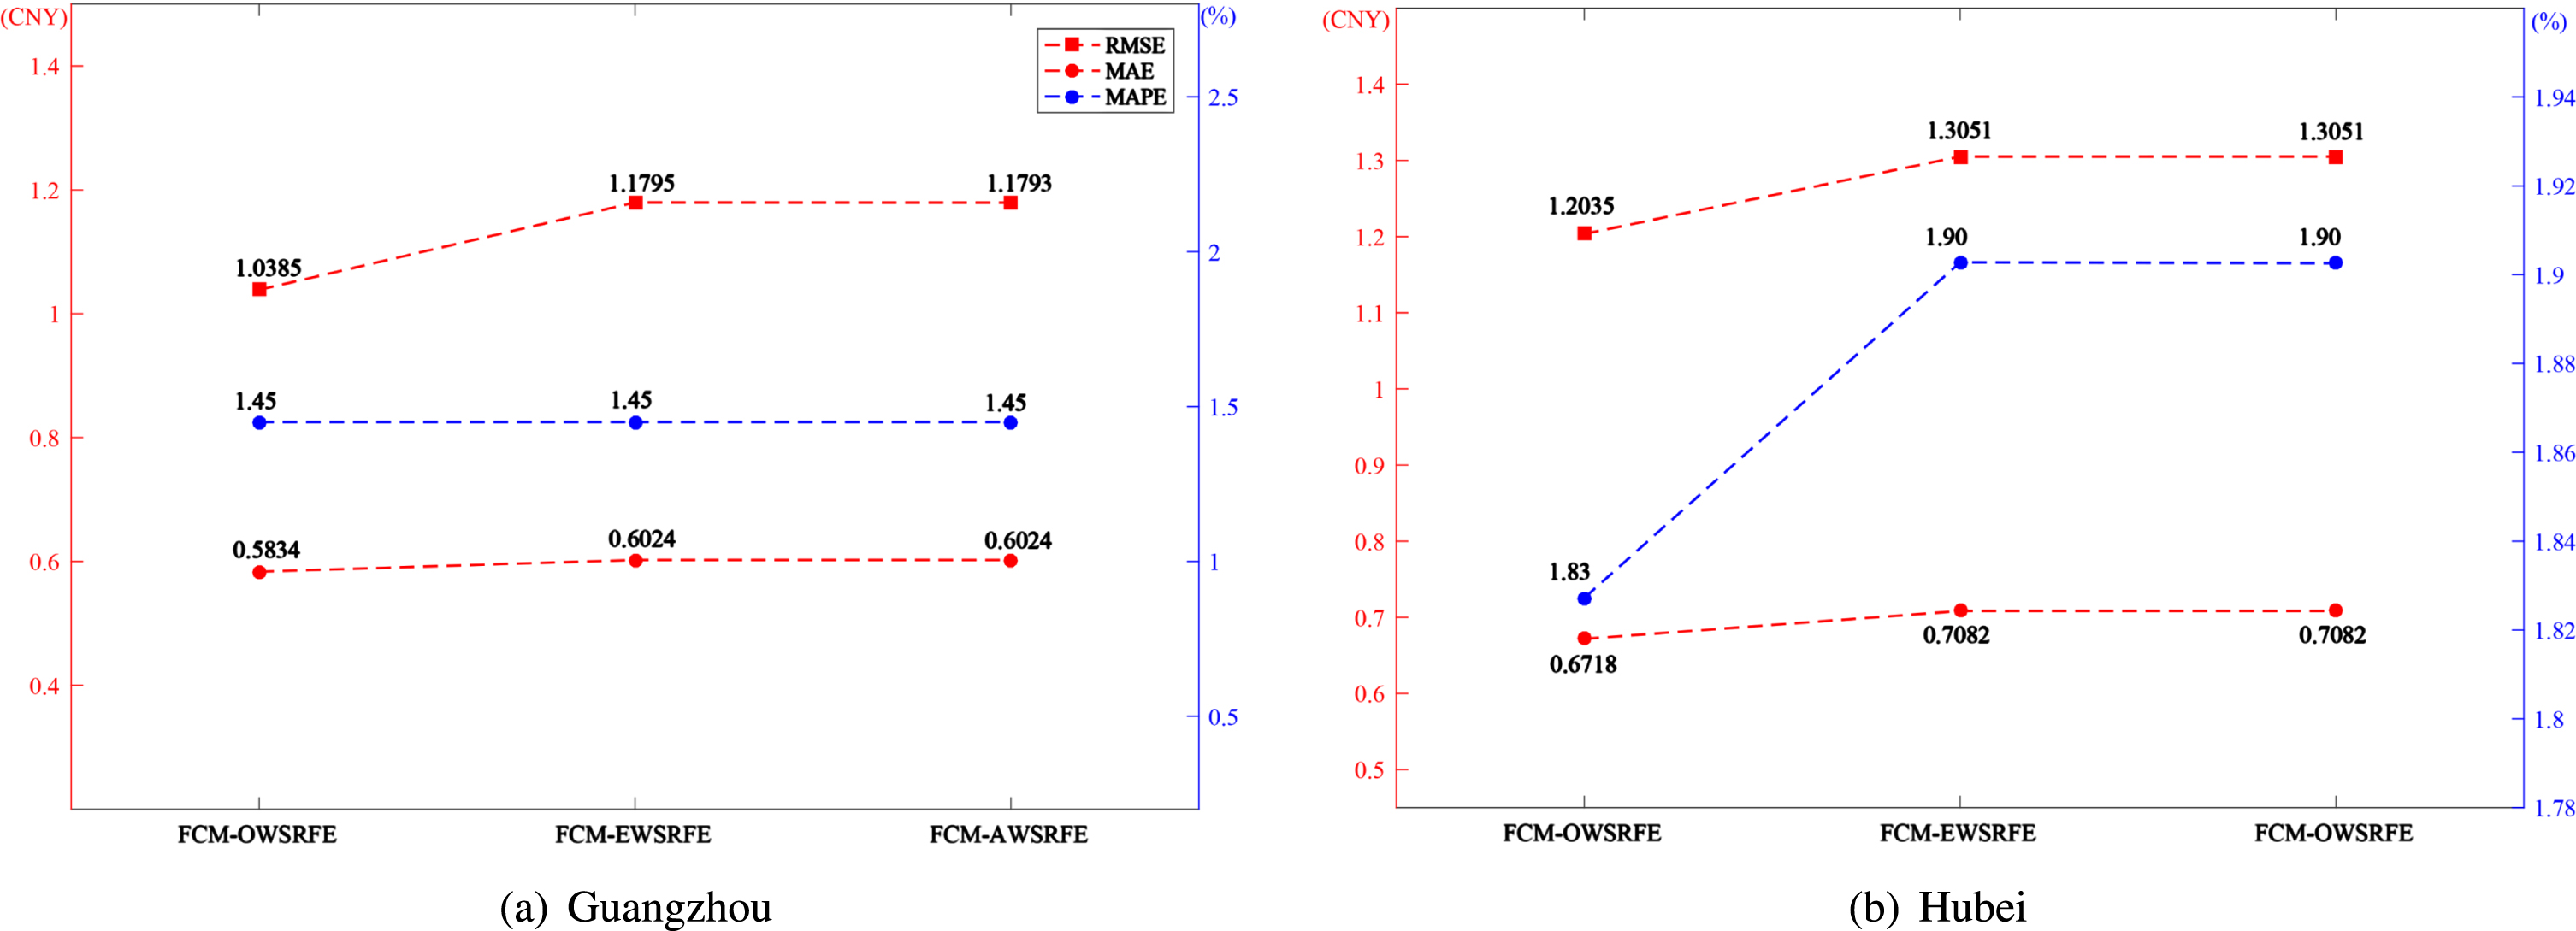
Error analysis of the model under three kinds of weight calculation.
The real value and the predicted value under the calculation of three kinds of weights.
Random forest model has a strong generalization ability and hence is widely used in various fields. In this study, a new random forest ensemble model, FCM-OWSRFE, developed for forecasting the non-stationary carbon price. This model mainly improves the performance of random forest model mainly from cluster-based subsampling and optimal weighted combination of sub-models. Firstly, Fuzzy C-means clustering is utilized to divide the population into several clusters, objects of which have the similar features. Secondly, subsampling based on clustering results is carried out to form subsamples with data representativeness to construct a series of subsampled random forest models. Finally, optimal weight strategy is applied to the subsampled random forest models to derive the final ensemble model. To demonstrate the efficacy of FCM-OWSRFE model, we utilize the ensemble model to forecast the carbon price data of Guangzhou Carbon Emission Exchange and Hubei Carbon Emission Exchange, respectively. The results show that the model with the Fuzzy C-means cluster-based subsampling and the optimal weighted combination strategy is effective in predicting the non-stationary and nonlinear carbon price series.
General speaking, our model is not optimal and can be improved in some aspects. For example, the parameters, such as clustering number, sample size and ensemble number are optimized step by step and hence are local optima. Therefore, a global optimization approach should be sought for globally optimal parameters. However, the parameters determined in this paper can be used for good initial parameters to speed up the convergence of global optimization. In addition, the model proposed in this study mainly provides a solution to improve the prediction performance. Although some decomposition techniques, such as popular EMD, VMD, or other decomposition technique, can be utilized to further improve the predicting effects [25], they are not incorporated into this study. We would like to improve the framework from parameter optimization and data decomposition in the near future.
Footnotes
Acknowledgment
The work is partially supported by the Jiangxi Provincial Humanities and Social Sciences Research Project (Grant No. JJ21215), National Natural Science Foundation of China (Grant No. 12361096, 71971105, 12161058).