
Abstract
The relative entropy fuzzy c-means (REFCM) clustering algorithm improves the robustness of the fuzzy c-means (FCM) algorithm against noise. However, its increased complexity results in slower convergence. To address this issue, we have proposed a suppressed REFCM (SREFCM) algorithm, in which a constant suppression rate, α, is selected. However, in cases where external factors, such as changes in the data structure, are present, relying on a fixed α value may result in a decline in algorithm performance, which is clearly unsuitable. Therefore, the adaptive selection of parameters is a critical step. Based on the data structure itself, this paper proposes an algorithm for adaptive parameter selection utilizing partition entropy coefficient and alternating modified partition coefficient, and compares it to six parameter selection algorithms based on generalized rules: θ′ type, ρ type, β type, τ type, σ type and ξ type. Empirical findings indicate that adapting parameters can enhance the partitioning capability of the algorithm while ensuring a rapid convergence rate.
Keywords
Introduction
Pattern recognition theory is a computer-based approach used for data analysis with a primary focus on the investigation of sample data. The two main methods of this approach consist of supervised clustering and unsupervised clustering. Furthermore, unsupervised classification may be more efficient for practical purposes than supervised classification. There have been numerous proposed clustering methods aimed at identifying natural groupings within samples.
Zadeh proficiently utilized the concept of fuzzy logic in the cluster analysis process to address uncertainty, thus enabling the classification of observed values into various discrete clusters. In actuality, the theory of fuzzy sets seeks to formalize two essential human abilities: the capacity to make precise decisions in an imprecise environment, and the ability to perform diverse physical and mental tasks without necessitating extensive measurements or calculations [1]. Based on this, Bezdek proposed the alternating optimization (AO) algorithm for fuzzy clustering, known as the fuzzy c-means (FCM) clustering algorithm [2]. By increasing the membership degree from {0, 1} to [0, 1], the partitioning effectiveness of the hard c-means clustering (HCM) clustering algorithm is enhanced. Currently, FCM stands out as one of the most commonly used clustering algorithms.
However, in the FCM algorithm, the computation of the membership degree can present notable difficulties when the observed data contains noise. This is mainly due to the algorithm’s failure to consider the presence of noise when dividing the observed values. It is widely acknowledged that the incorporation of noise interference in data can adversely influence the efficacy of clustering algorithms [3].
Relative entropy is a measure of the distance between two probability distributions. Due to its convexity, it can serve as a regularization parameter within the objective function of FCM. Zarindal and co-authors incorporated the utilization of relative entropy as a means of regularization in the objective function of FCM. This led to the creation of the relative entropy fuzzy c-means clustering algorithm (REFCM) [4]. This method has been applied by many researchers, including Z. Hao et al. [5], J. Bonilla et al. [6] and F. Salehi et al. [7].
An analysis of Reference [8] suggests that although fuzzy set theory offers superior partition quality, it has the drawback of slow convergence. In order to enhance the computational efficiency of FCM, Reference [9] proposed the suppressed fuzzy c-means (S-FCM) algorithm, which preserves the high classification accuracy of FCM while also expediting its rate of convergence. When implementing the S-FCM algorithm in practical applications, the proper selection of a suppression rate is crucial. The performance of the clustering algorithm can be negatively impacted by the incorrect choice of parameters. Targeting the issue of predetermined suppression factor, Jiulun Fan and colleagues suggested a selection approach based on the structure of the dataset [10]. In their work, Fan et al. [11] conducted a comprehensive review of the research on this topic. Additionally, Huang et al. [12] introduced an enhanced version of the fuzzy c-means algorithm, named MS-FCM, which utilizes type-driven learning to determine the parameter α and updates this parameter after each iteration. Subsequently, numerous scholars endeavored to identify an appropriate parameter value, utilizing a variety of methods. These include S. Zhou’s formula for parameter calculation using triangular inequalities [13], A. Mousa’s proposition for parameter selection based on temporal information [14], Q. Wang’s approach for parameter selection utilizing cluster size imbalance metrics [15], Saad’s novel parameter for evaluating the cleanliness of pixels in relation to classes [8], and Szilágyi et al.’s parameter selection methodology based on generalized rules [17]. Additionally, we offer two parameter selection strategies based on fuzzy partition entropy and partition coefficient [16]. It is evident that the suppression strategy has yielded significant outcomes in enhancing the algorithm’s efficacy and has been the subject of study by numerous scholars. Therefore, to ensure that the REFCM algorithm continues to uphold its noise detection performance and effectively allocate the appropriate degree of membership in a timely manner, we have incorporated a suppression strategy, resulting in the proposed suppression relative entropy fuzzy c-means (SREFCM) algorithm. When selecting the suppression rate, the SREFCM algorithm uses a fixed value. However, this approach overlooks the impact of each iteration’s results on the suppression rate. As such, this paper proposes the adaptive selection of parameter α based on the data structure itself. Specifically, we introduce two variations of the suppressed REFCM algorithm: one based on the partition entropy coefficient and the other based on the alternating modified partition coefficient. Meanwhile, we are also implementing the generalized rule-based parameter selection technique suggested by Szilágyi et al. [17] to the suppressed REFCM algorithm, in order to deliver a context-sensitive and precise parameter selection approach for every input data.
The remainder of this paper is structured as follows: Sections 2 and 3 introduce FCM, PCM clustering algorithm, and REFFCM clustering algorithm respectively. Sections 4 and 5 present the SREFCM algorithm and the proposed method. Section 6 conducts an analysis of the performance of the proposed algorithm. Finally, Section 7 presents the conclusions.
Preliminaries
Fuzzy c-means clustering algorithm
Being one of the most widely adopted clustering algorithms, the objective function of the FCM algorithm [18]:
Where u ij is the membership degree of jth observation in ith cluster, d ij is the Euclidian distance of jth observation from ith cluster center, m is the degree of fuzziness, and c and N are numbers of clusters and observations, respectively.
In 1993, J. Keller et al. merged the possibilistic theory and developed the possibilistic c-means (PCM) clustering algorithm by loosening the constraints of FCM [19]. It only needs
Where t ij is the possibilistic value of jth observation in ith cluster, and η i is a positive number or a penalty factor. And other parameters have the same definitions as before.
In 2014, Zarinbal et al. incorporated relative entropy as a regularization function into the objective function of the FCM algorithm and proposed the relative entropy fuzzy c-means (REFCM) clustering algorithm. Relative entropy is a measure of the difference between two probability distributions, i.e. the difference between clusters. As such, the REFCM algorithm minimizes the intra-class distance while maximizing inter-class separation, addressing the limitations of the FCM algorithm in the presence of noise. The model is expressed as [5]:
Where θ represents the positive coefficient of the relative entropy term, which determines the extent of its influence. All other parameters retain the same definitions as previously stated.
The first component of the objective function in Equation (4) seeks to minimize the distance between the observed value and the cluster center, whereas the second component aims to maximize the distinction between the membership functions of the ith and kth clusters. Consequently, the second term precludes the occurrence of clusters that are in close proximity or overlap [5].
Considering W0 (•) as the principle branch of the Lambert-W function, the degree of membership of this observation in ith cluster, u
ij
, and the center point of ith cluster, v
i
, are obtained by Equations (5) and (6), respectively [4]:
Where λ
j
, j = 1, …… , N is the Lagrange multiplier, its formula is shown in Equation (7), and the definitions of other parameters are the same as before.
In 2003, Jiulun Fan and colleagues proposed the suppressed fuzzy c-means (S-FCM) clustering algorithm [9], which aims to enhance the convergence speed of FCM while maintaining its high classification accuracy. Zarinbal and team presented the REFCM algorithm, which addresses the inferior partition performance of FCM when confronted with noise and the clustering overlapping issue of PCM algorithm. However, this adversely affects the convergence pace of the REFCM algorithm. To tackle the issue of slow convergence, Fan et al. have introduced a variant algorithm called the suppressed REFCM (SREFCM), which integrates a competitive learning mechanism for updating membership values throughout each iteration [9]. Considering x
j
, if the degree of membership of x
j
belongs to wth cluster is the biggest of all the clusters, the value is noted as u
wj
. The changes are as follows:
Then, the fuzzy membership is modified by multiplying the suppression rate α (0 ⩽ α ⩽ 1) to reduce all non-winner values and increase the winner membership accordingly. This modification satisfies the probability constraints specified in Equation (8). When α = 0, SREFCM is similar to HCM, whereas SREFCM is akin to REFCM when α = 1.
In this section, we propose three enhanced SREFCM clustering algorithms and determined the suppression rate α based on different criteria. These algorithms include the SREFCM algorithm based on generalized rules, which selects α based on context sensitivity, the SREFCM algorithm based on partition entropy coefficient, and the SREFCM algorithm based on alternating correction partition coefficient, both of which select α based on the data structure itself.
The selection of suppression rate based on generalized rules
Szilágyi et al. introduced the Quasi Learning Rate (QLR) as a metric for evaluating the performance of the winning cluster, which is analogous to the learning rate used in traditional competitive algorithms. They also derived a formula for calculating the QLR [20]:
Where w denotes the index of the winner class, for any input vector x k and its winner class with index w, there exists a virtually reduced distance δ wk < d wk , u wk stands for the winner fuzzy membership value of vector x k , obtained without suppression.
To expedite the convergence speed of the algorithm, Szilágyi et al. did not contemplate modifying the suppression rules within each iteration. The determination of suppression rules is predicated on two distinct protocols [20]:
The first generalization scheme is determined by the learning rate as a function of the winner’s fuzzy membership u wk as: η = f (u wk ), where f : [0, 1] → [0, 1] is a continuous function. Using Equation (9), the context dependent suppression rate generally becomes:
The second generalization scheme can be defined by the fuzzy membership values before and after suppression as μ
wk
= g (u
wk
) with g : [0, 1] → [0, 1] and g (x) ⩾ x, ∀ x ∈ [1/ - c, 1]. Using Equation (9), the context dependent suppression rate generally becomes:
Based on the aforementioned protocols, Szilágyi et al. proposed six generalized suppression rules, as outlined in Table 1. Each rule is regulated by a suppression parameter, capable of adopting an infinite number of values [20]. This paper applies these six special generalization rules to the SREFCM algorithm, resulting in the generalized suppression relative entropy fuzzy C-means (GS-REFCM) clustering algorithm, as detailed in Table 1. The objective is to enhance the performance of the SREFCM algorithm in terms of its convergence speed, by identifying the optimal suppression rate, α.
The definition of α k rewarding term for GS-REFCM algorithm variants
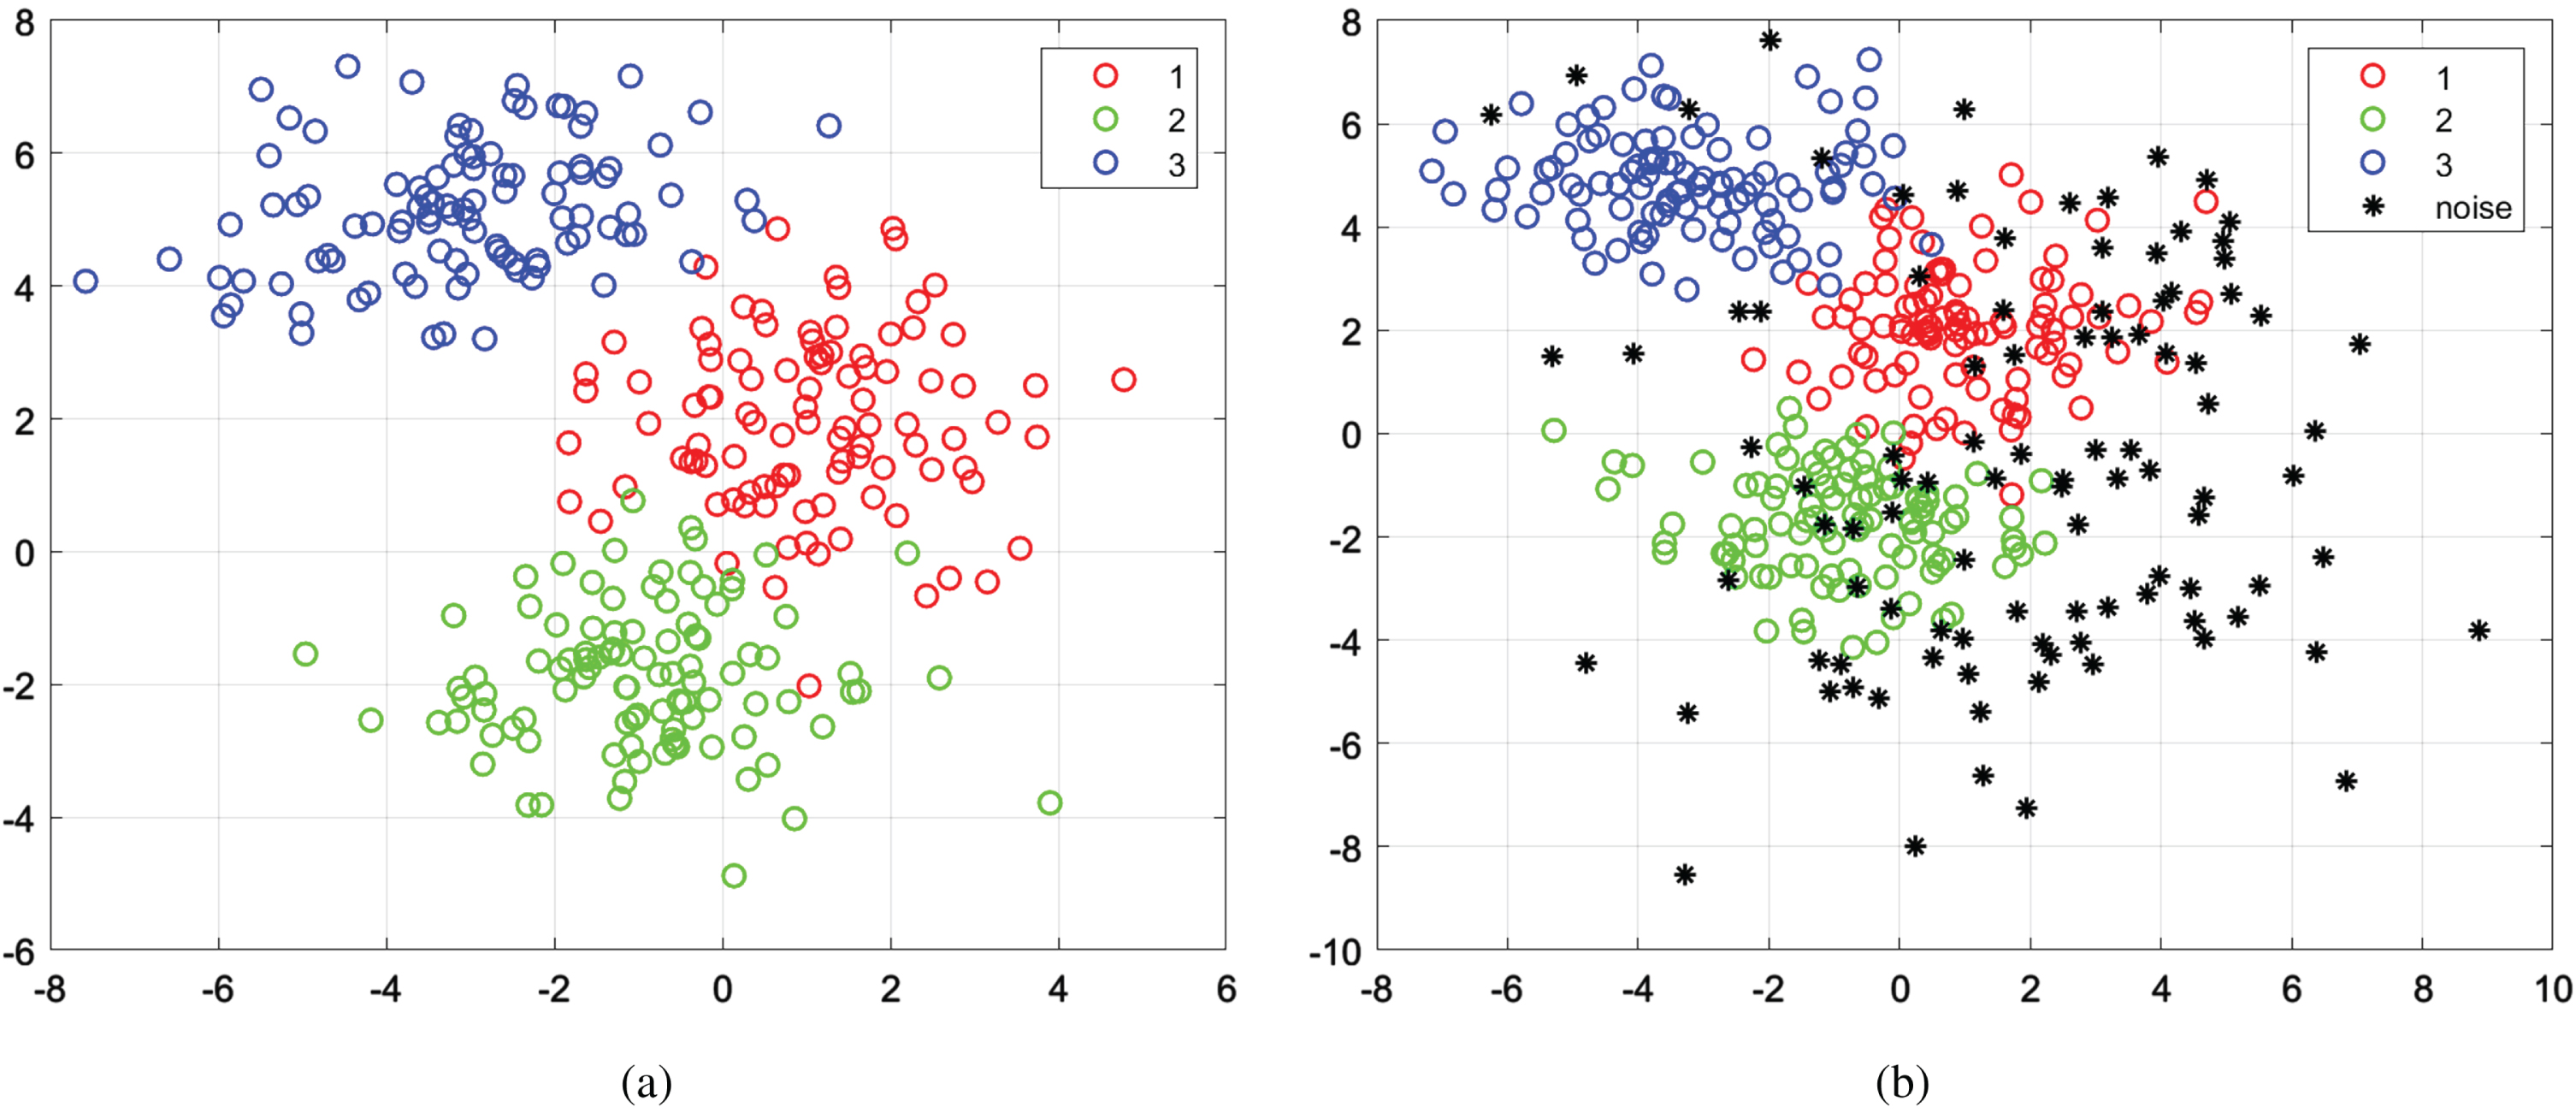
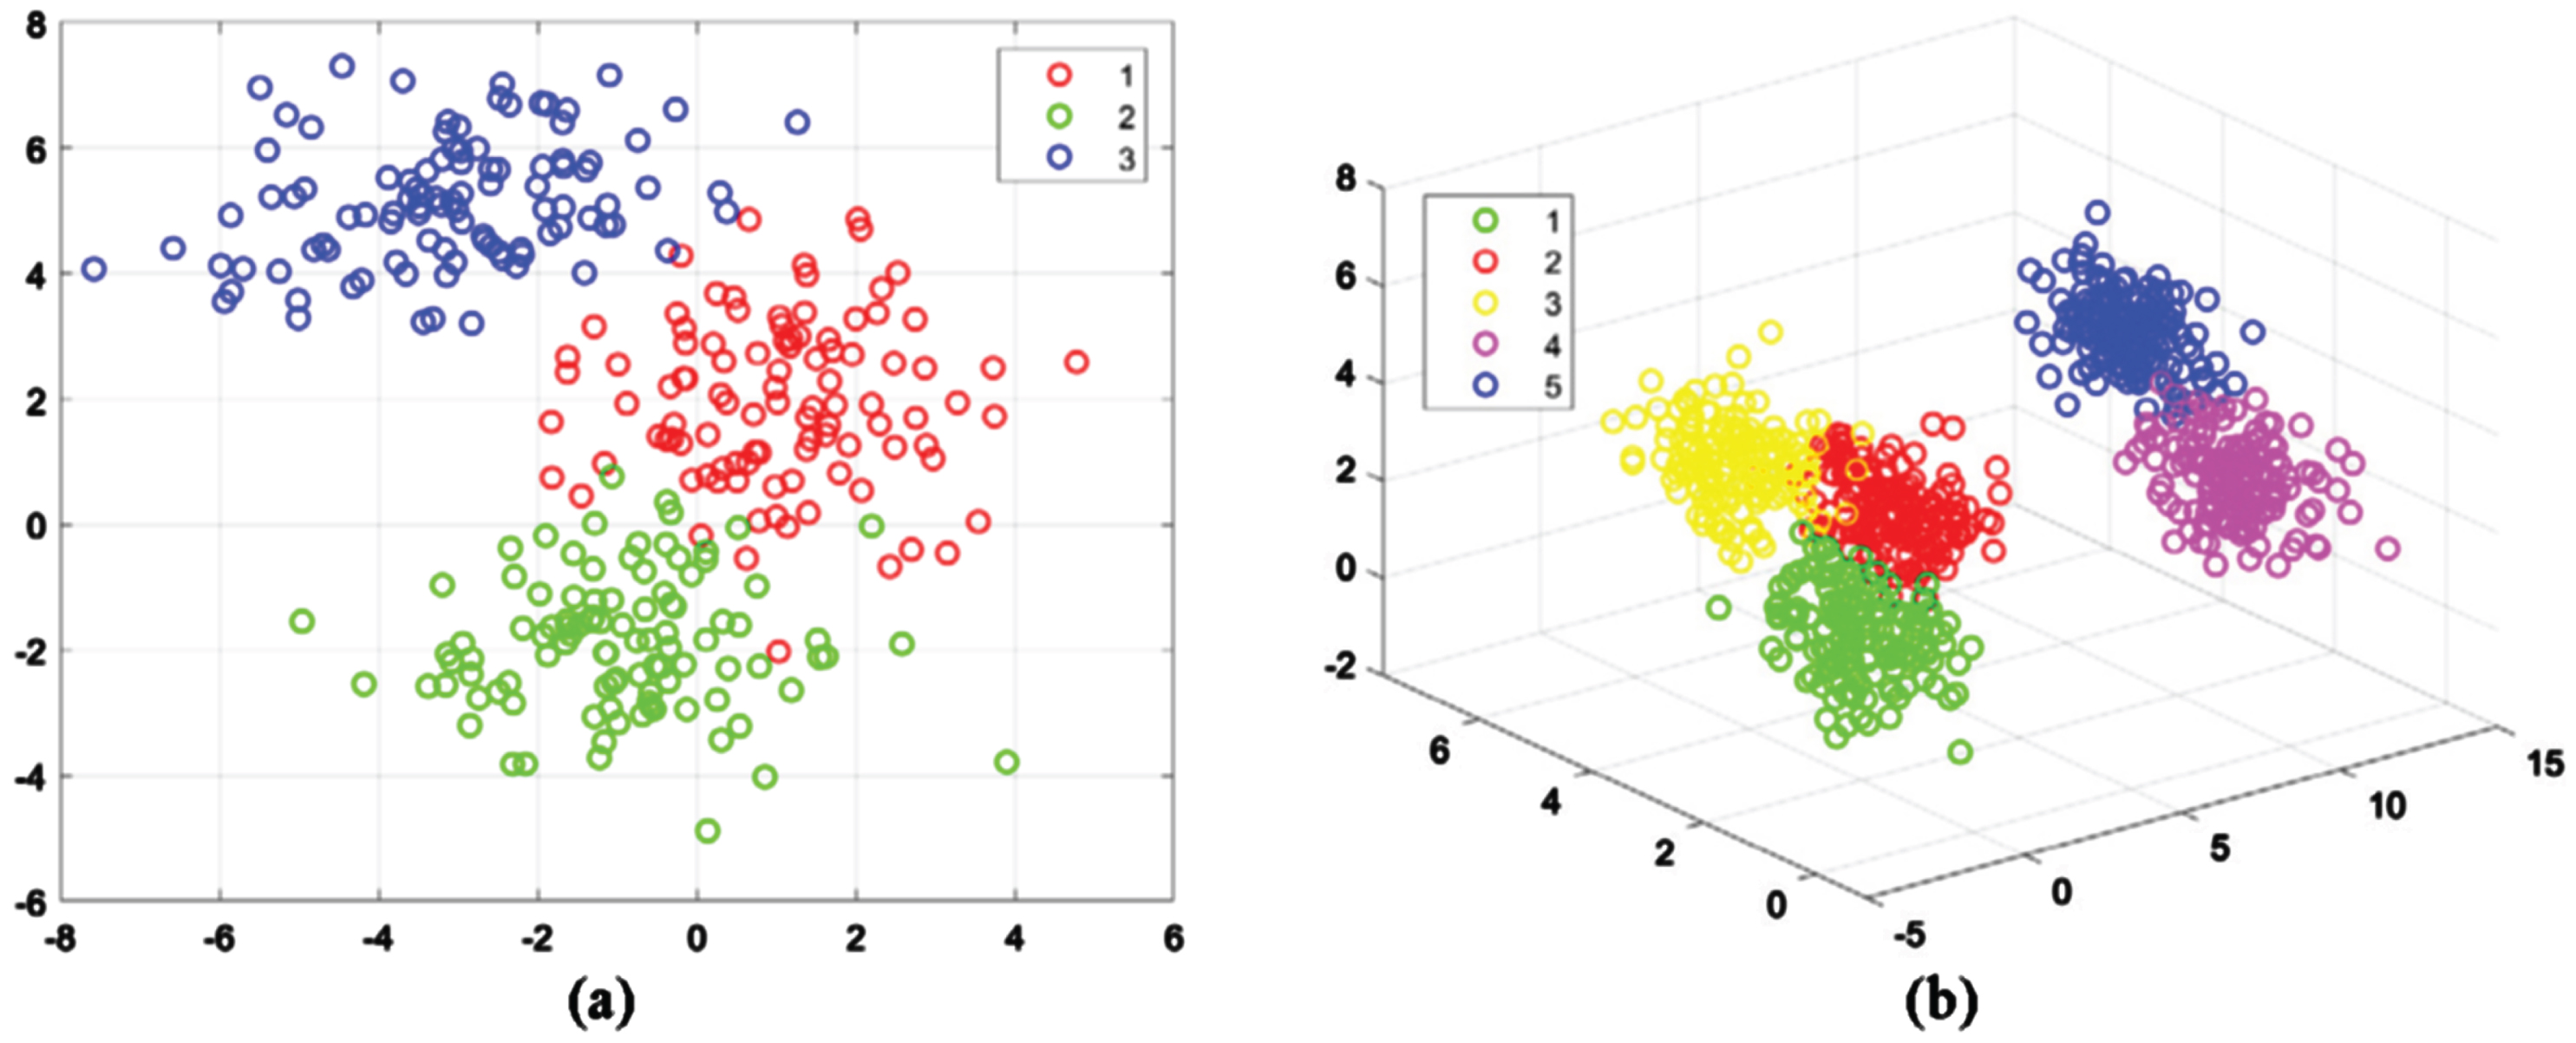
(a) Original two-dimensional synthetic dataset and (b) two-dimensional synthetic dataset with 100 noise points.
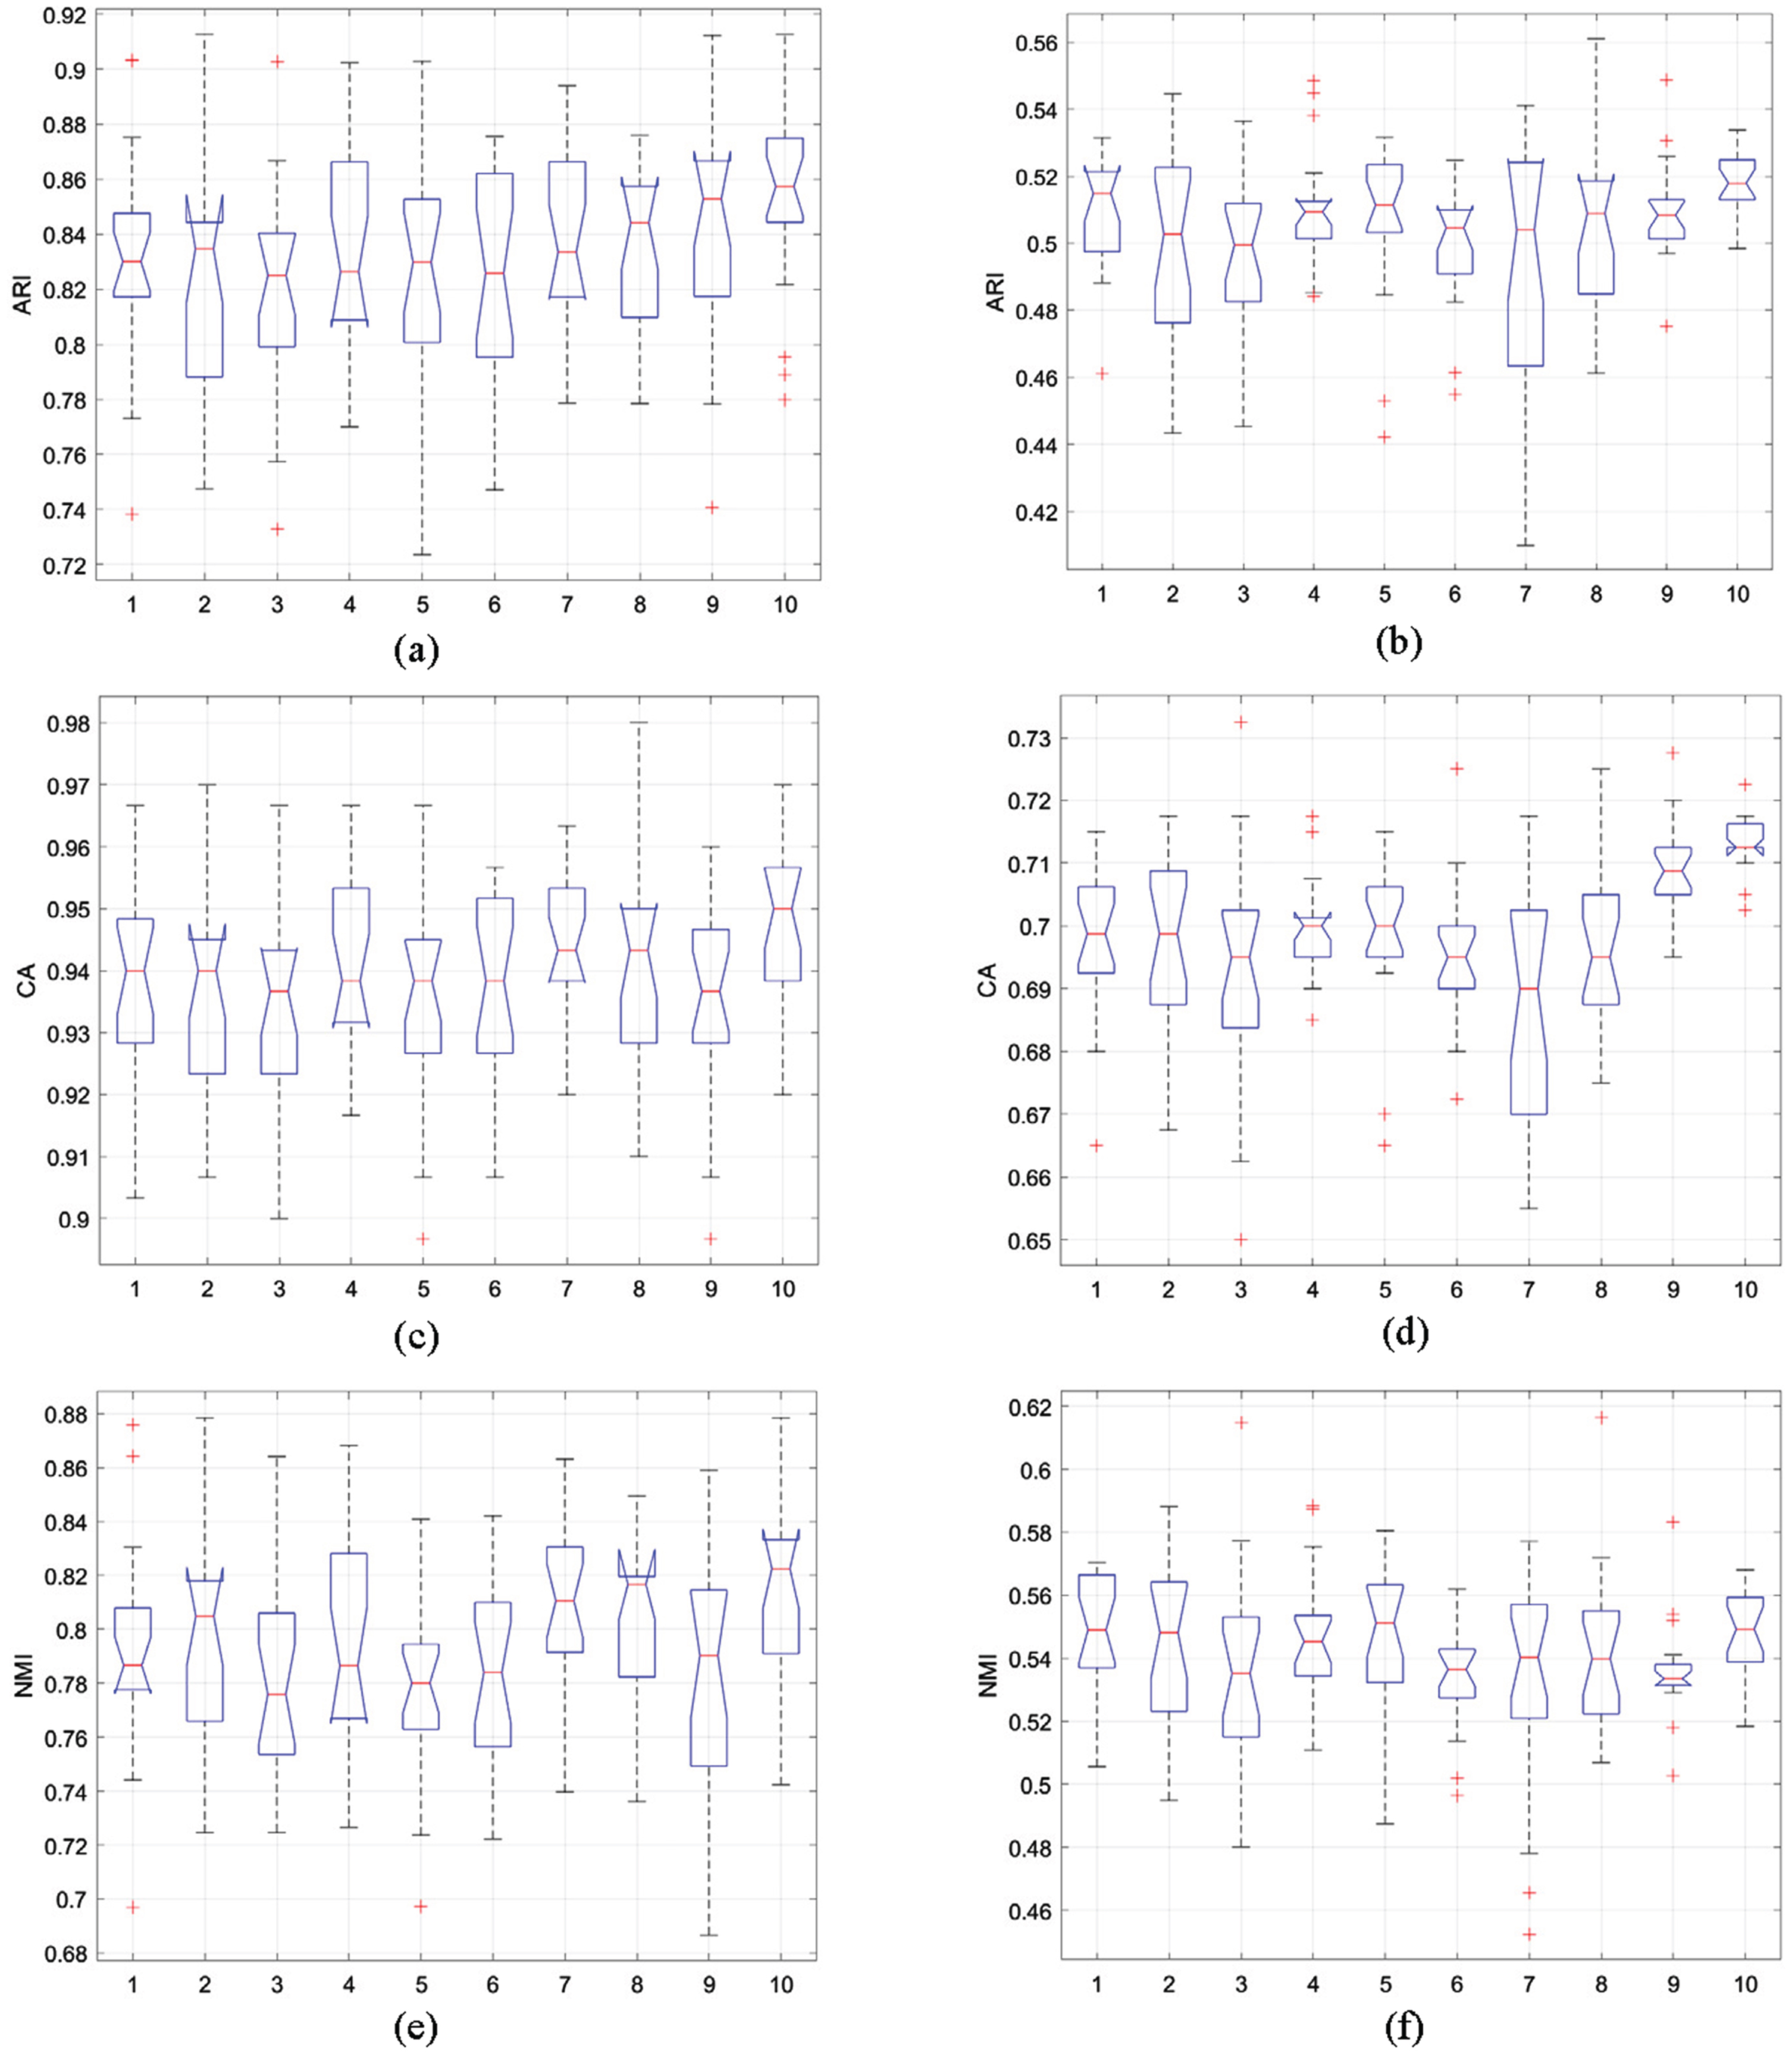
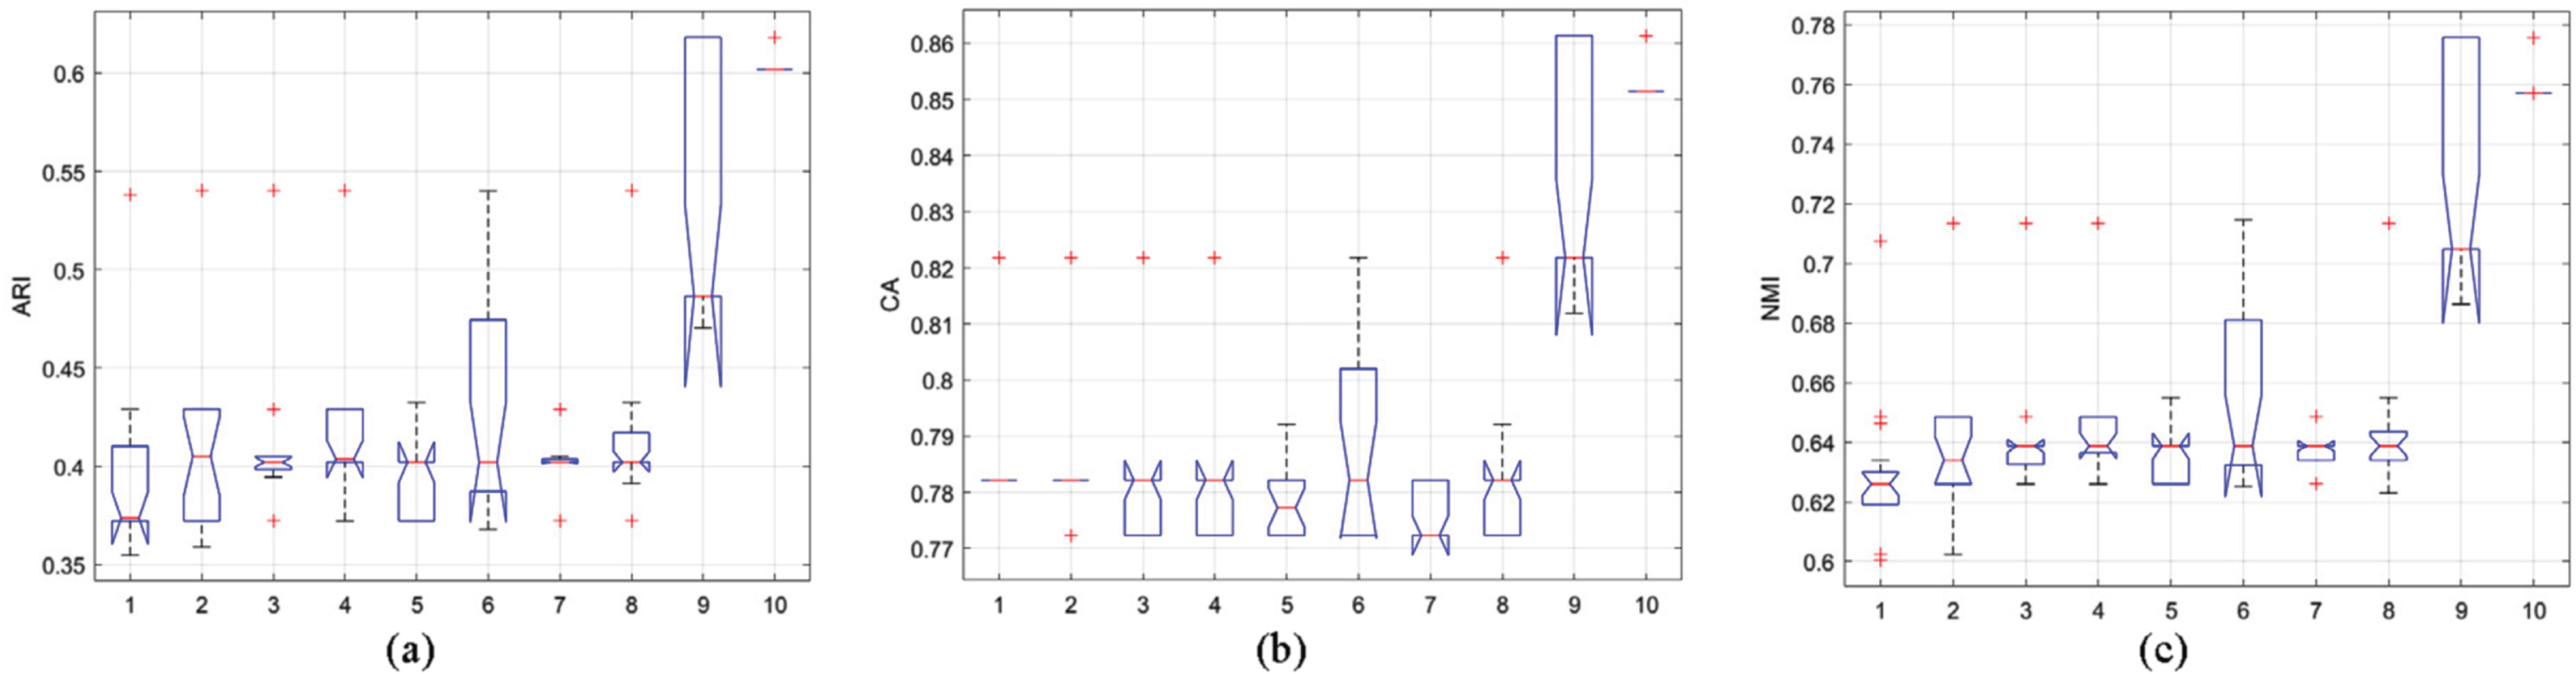
(a) ARI statistics, (c) CA statistics, (e) NMI statistics in the original two-dimensional synthetic dataset and (b)ARI statistics, (d) CA statistics, (f) NMI statistics in the noisy two-dimensional synthetic dataset.
The steps of the GS-REFCM algorithm are summarized as follows:
In the algorithm, determining the optimal parameter is a crucial step. It is advisable to select a suitable parameter α based on the distribution of the data structure.
For the data set X ={ x1, ⋯ , x
n
}, when the data is classification by fuzzy clustering, fuzzy partition entropy
According to the partition entropy formula, we can conclude that 0 ⩽ v
PE
(c) ⩽ log c. We considered the suppression rate α as an increasing function of the partition entropy v
PE
(c), proposed to modify the partition entropy, obtained a new measure, are defined the suppressed rate α as:
And then, Dave proposed a modification of PC, using a linear transformation, to eliminate that dependency of v
PC
on c. He refers to the new measure thus obtained as modified partition coefficient (MPC) [23], which is expressed as
We use the above two methods to select the suppression rate α based on the data distribution structure, where α ∈ [0, 1], and define them as the SREFCM algorithm based on partition entropy (MShREFCM) and the SREFCM algorithm based on alternative correction partition coefficient (MPCSREFCM).
Taking into account the impact of outliers on clustering outcomes, the MShREFCM and MPCSREFCM algorithms now incorporate the average intra-cluster distance. The central concept is that a data point is considered part of the cluster core and rewarded if its distance from the cluster center is below the mean intra-class distance measure of the sample and its center. If the distance from a data point to its cluster center exceeds K times the mean intra-class distance between the sample and its cluster center, the sample is not part of the cluster core and incurs a suppression penalty. The formula of the average intra-class distance measure is as follows:
Where d
ij
represents the distance between sample x
j
and cluster center i, U represents the membership degree between sample x
j
and cluster center i, and
The algorithm steps are summarized as follows:
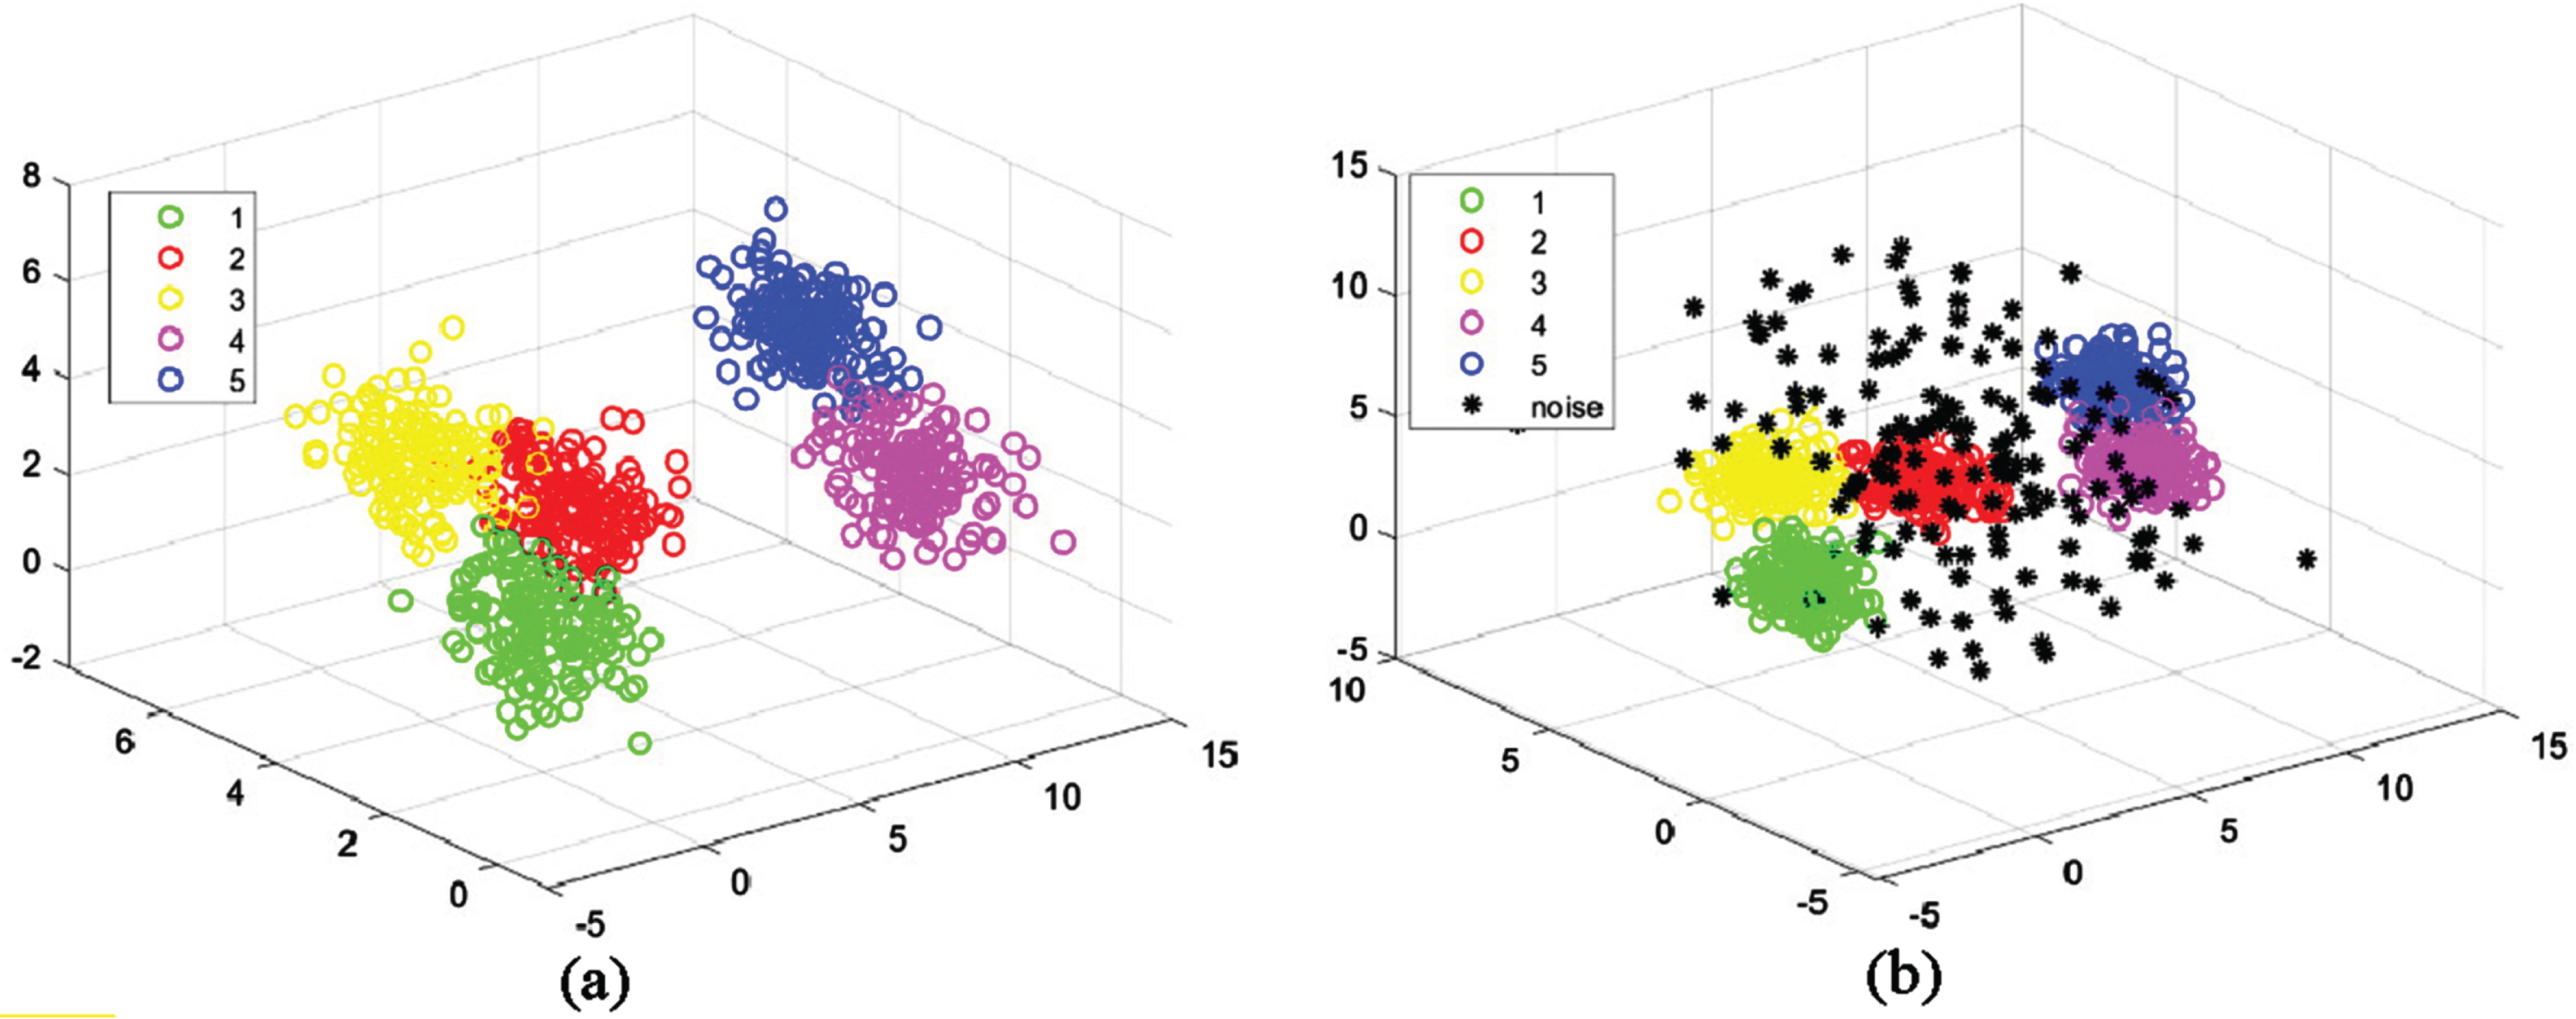
(a) Original three-dimensional synthetic dataset and (b) three-dimensional synthetic dataset with 150 noise points.
In this section, we evaluate the performance of FCM, PCM, REFCM, SREFCM, MShREFCM, MPCSREFCM, and six specialized REFCM algorithms for generalized suppression, using synthetic datasets and UCI datasets. To measure and compare algorithm performance, we utilize Kwon validity measure V
k
(c) [24], XieBen index [16], Separation coefficient V
SC
[25], Partition coefficient and exponential separation V
PCAEC
[26], Clustering Accuracy (CA) [17], as well as the Iteration times and Computing time. Boxplots display the statistical results for CA, Adjusted Rand Index (ARI), and Normalized Mutual Information (NMI) [27]. The formula of V
k
(c), XieBen index, V
SC
, V
PCAEC
, ARI, and NMI are shown in Equations (15–20).
Where c is the number of clusters, n is the total number of samples, u
ij
is the membership degree of jth observation in ith cluster,
The proposed algorithm’s efficacy was initially gauged using conventional two-dimensional synthetic data in the experiment. This was followed by evaluating the algorithm’s performance on intricate data utilizing artificially generated three-dimensional datasets. Furthermore, to determine how well the algorithm performs in the real-world, it was evaluated utilizing UCI datasets. The parameters of each algorithm are set as follows: (1) FCM, m = 2 (2) PCM, m = 2.5 (3) REFCM, m = 2.5, θ = 1.5 (4) SREFCM, m = 2.5, θ = 1.5, α = 1.5 (5) GS θ -REFCM, m = 2.5, θ = 1.5, θ′ = 0.5 (6) GS ρ -REFCM, m = 2.5, θ = 1.5, ρ = 0.5 (7) GS β-REFCM, m = 2.5, θ = 1.5, β = 0.5 (8) GS τ -REFCM, m = 2.5, θ = 1.5, τ = 0.5 (9) GS σ -REFCM, m = 2.5, θ = 1.5, σ = 0.5 (10) GS ξ -REFCM, m = 2.5, θ = 1.5, ξ = 0.5 (11) MShREFCM, m = 2.5, θ = 1.5 (12) MPCSREFCM, m = 2.5, θ = 1.5. We are using Chernoff’s measure [28] for a fixed value of the exponent parameter r = 0.1, K-1 = (1 - r) log(c).
To simplify the expression, we use the Arabic numerals 1–10 to denote REFCM, SREFCM, GS θ -REFCM, GS ρ -REFCM, GS β-REFCM, GS τ -REFCM, GS σ -REFCM, GS ξ -REFCM, MShREFCM and MPCSREFCM, respectively.
Experiment 1 involved generating a two-dimensional dataset comprising three distinct groups using a normal distribution. Each group was comprised of 100 data points, and 100 additional random noise points were included in the dataset. The resulting scatter chart can be viewed in Fig. 1. The parameters used for data set are: μ1 = [1, 2],
Figure 2(a-f) displays box plots that present the statistical outcomes of ARI, CA and NMI for a two-dimensional artificial dataset, with and without the inclusion of 100 random noises. The results reveal that the MPCSREFCM algorithm outperforms other algorithms significantly, both on the original dataset and when noise points are present. These findings suggest that the MPCSREFCM algorithm can produce dependable and superior results for clustering tasks on two-dimensional synthetic dataset. The REFCM algorithm is comparably stable with other algorithms, however not as stable compared to the MPCSREFCM algorithm. The box plot observing other algorithms is notably wide, which suggests that such algorithms lack stability. Additionally, a comparative evaluation is carried out between the original data and the statistical outcomes achieved when noise is incorporated. Higher values reflecting ARI, CA, and NMI indicate optimal algorithm performance. Through analyzing Fig. 2(b), (d), and (f), multiple outliers appear in the statistical findings upon considering the noise point set. Among these algorithms, the MShREFCM and MPCSREFCM algorithms exhibit significant advantages for noisy point sets.
According to Tables 2(a)-(b), it is apparent that the relative entropy algorithm achieves the best results, while SREFCM shows a faster convergence rate. However, this comes at the cost of weakening the clustering outcomes. The MShREFCM technique not only enhances convergence rate but also improves clustering accuracy. MShREFCM and MPCSREFCM outperform six SREFCM algorithms based on generalized rules, exhibiting significantly better performance and higher accuracy.
Performance comparison of FCM, PCM, REFCM, SREFCM, MShEFCM and MPCSREFCM methods on two-dimensional noisy dataset
Performance comparison of FCM, PCM, REFCM, SREFCM, MShEFCM and MPCSREFCM methods on two-dimensional noisy dataset
Performance comparison of GS θ -REFCM, GS ρ -REFCM,
In this experiment, five sets of three-dimensional data were generated using a standard normal distribution. Each dataset comprised 150 data points, to which 150 randomly generated noise points were added. The distribution of the data is illustrated in Fig. 3. The parameters used for data set are: μ1 = [0, 2, 1], μ2 = [8, 6, 0], μ3 = [3, 6, 2], μ4 = [10, 1, 3], μ5 = [12, 4, 4],
Figure 4 (a-f) depicts the box plots of the statistical results for ARI, CA, and NMI of each algorithm on the three-dimensional synthetic dataset. The analysis of the original three-dimensional data box plots suggests that multiple algorithms demonstrate high levels of effectiveness, accompanied by high stability. However, upon comparing the original and the noise-added three-dimensional datasets, it became clear that the statistical results box plots for the three indicators had significantly widened, with an increase in the number of outliers. This finding suggests that the algorithms’ stability has been adversely affected by noise. Notably, the MShREFCM and MPCSRFCM algorithms proposed in this study exhibited narrower box plots than other algorithms and demonstrated greater stability. As depicted in Fig. 4(d), the proposed algorithm showcased higher clustering accuracy and stronger stability.
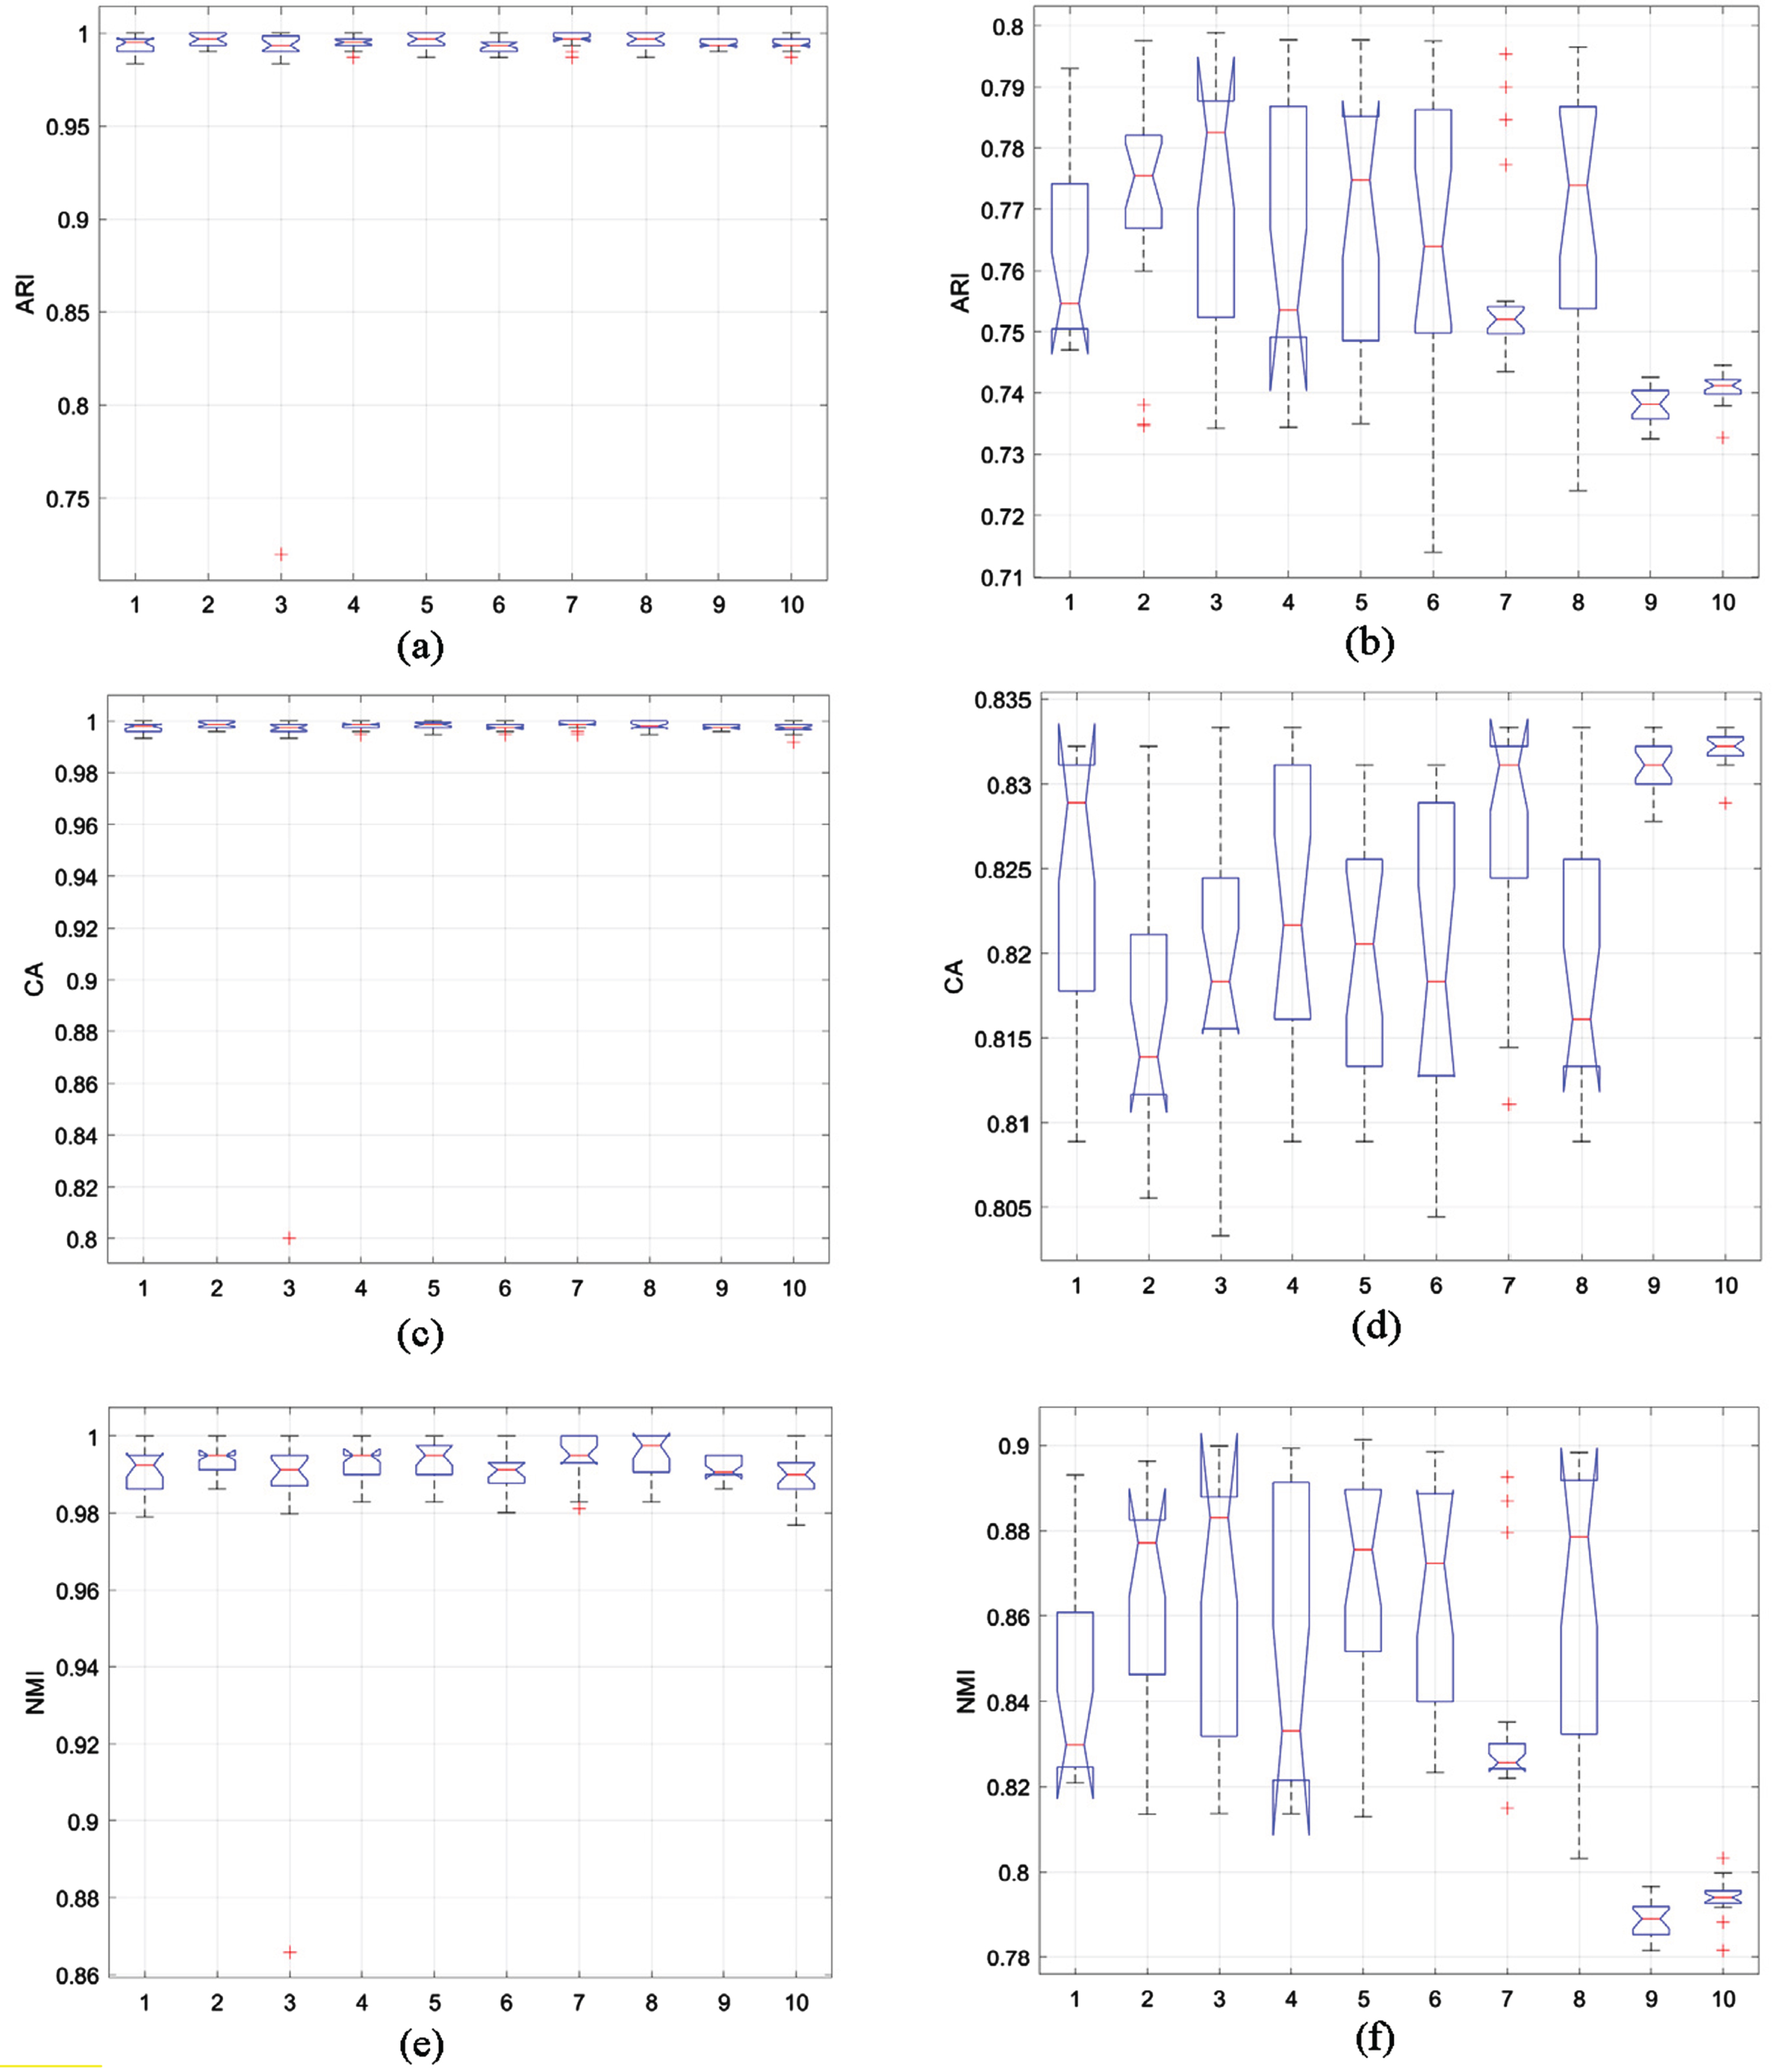
(a) ARI statistics, (c) CA statistics, (e) NMI statistics in the original three-dimensional synthetic dataset and (b) ARI statistics, (d) CA statistics, (f) NMI statistics in the noisy three-dimensional synthetic dataset.
In Tables 3(a)-(b), we compare the evaluation metrics of different algorithms. The tables indicate that the MShREFCM and MPCSREFCM algorithms are superior to others in the three-dimensional noisy dataset due to their improved convergence speed and accuracy. Notably, both methods require fewer iterations than the SREFCM algorithm while achieving better clustering accuracy.
Performance comparison of FCM, PCM, REFCM, SREFCM, MShEFCM and MPCSREFCM methods on three-dimensional noisy dataset
Performance comparison of GS θ -REFCM, GS ρ -REFCM, GS β-REFCM, GS τ -REFCM, GS σ -REFCM, GS ξ -REFCM, MShREFCM, and MPCSREFCM methods on three-dimensional noisy dataset
In experiment 3, we use the Zoo dataset in the UCI repository to prove the effectiveness of the proposed algorithm in the real dataset. The dataset consists of 101 vectors of 16 dimensions, including 3 different classes. Figure 5 shows the box plot of the statistical results of the three evaluation indicators ARI, CA and NMI under the Zoo dataset.
As depicted in Fig. 5, the MPCSREFCM algorithm exhibits superior evaluation index outcomes and remarkable stability on the Zoo dataset. In comparison to other algorithms, the distribution of the box plot for the MShREFCM algorithm is broader, and stability is lower. Nonetheless, the mean performance of its evaluation indicators is relatively high.
Statistical values of (a) ARI, (b) CA and (c)NMI on Zoo dataset.
Tables 4(a)-(b) present the statistical analysis of algorithmic performance using various evaluation metrics on the Zoo dataset. The results demonstrate that the MPCSREFCM algorithm improves both clustering accuracy and convergence speed significantly. Based on these indicators, the algorithms presented in this paper exhibit superior performance and faster convergence rates.
Performance comparison of FCM, PCM, REFCM, SREFCM, MShEFCM and MPCSREFCM methods on Zoo dataset
Performance comparison of GS θ -REFCM, GS ρ -REFCM, GS β-REFCM, GS τ -REFCM, GS σ -REFCM, GS ξ -REFCM, MShREFCM, and MPCSREFCM methods on Zoo dataset
In Experiment 4, we utilized the Glass dataset from the UCI database. The dataset comprises 214 vectors, with each vector having 9 dimensions and being categorized into 6 distinct groups. Figure 6 presents the statistical outcomes of ARI, CA, and NMI metrics for each algorithm employed in the Glass dataset.
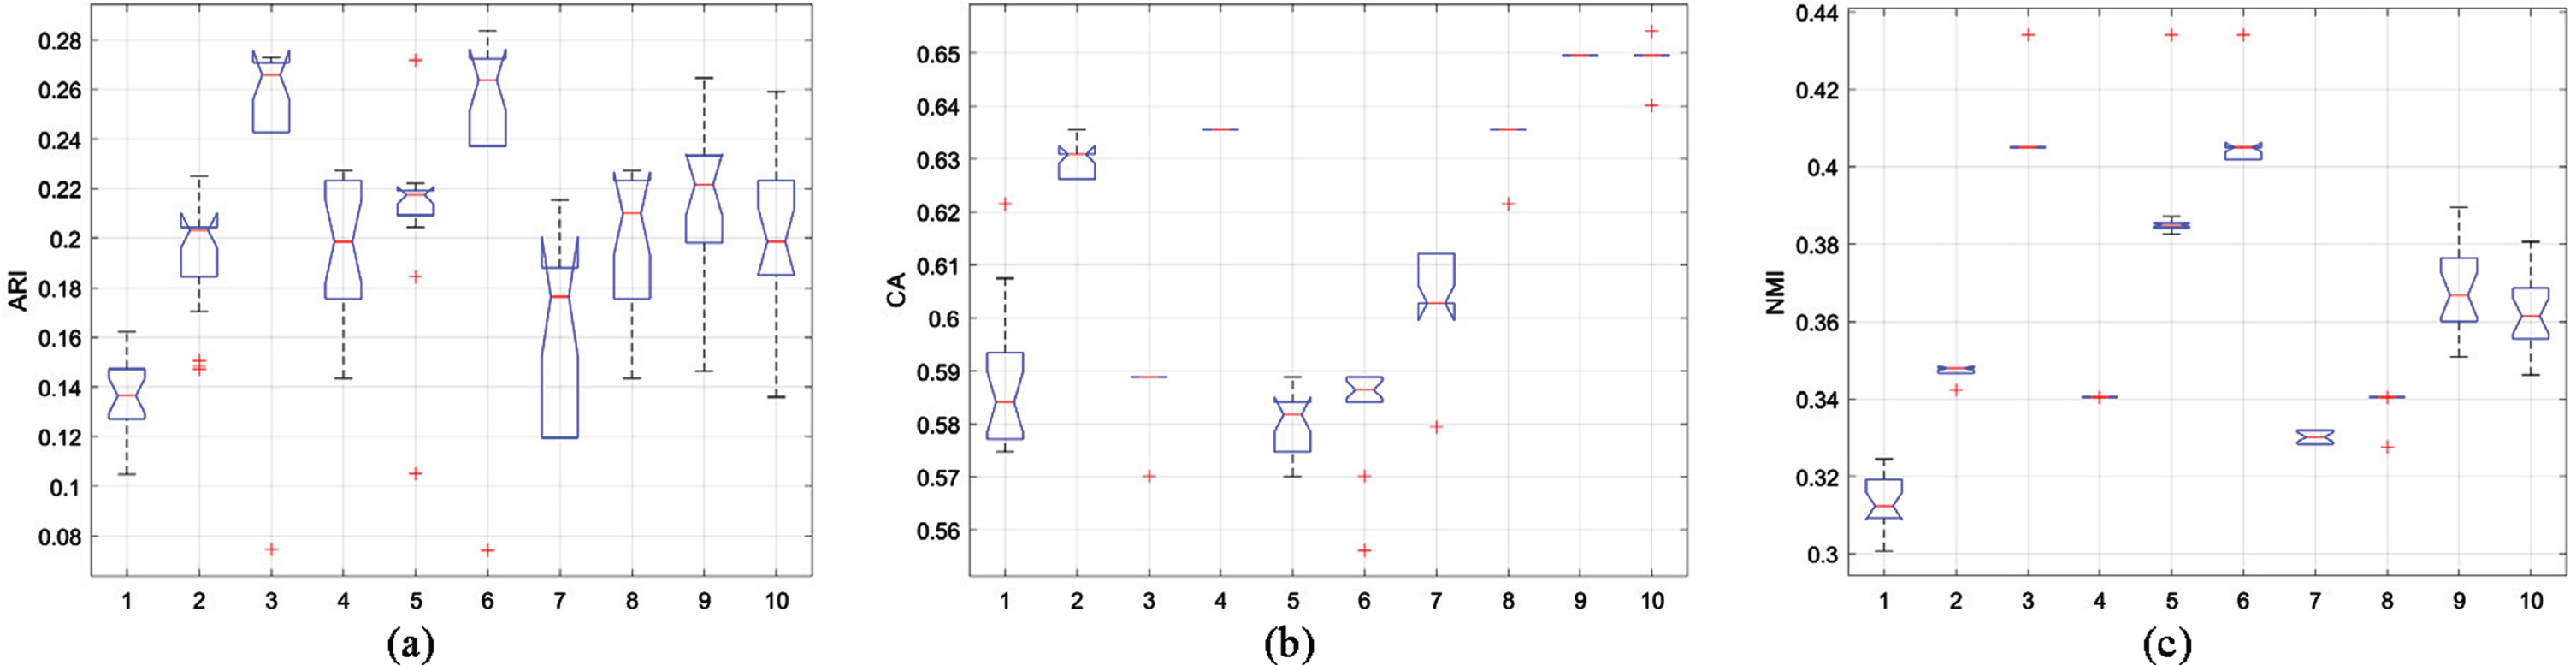
Statistical values of (a)ARI, (b)CA and (c)NMI on Glass dataset.
As shown in Fig. 6, both the MShREFCM and MPCSREFCM algorithms exhibit higher accuracy than other algorithms when applied to the Glass dataset, and are also characterized by more stable classification. While the ARI and NMI box plots generated by these algorithms may be somewhat broad, outliers are minimized. It should be noted that across the board, the performance of each algorithm in this particular dataset is generally poor, and ultimately resulted in relatively low accuracy.
The results displayed in Tables 5(a)-(b) indicate that both the MShREFCM and MPCSREFCM algorithms exhibit higher levels of accuracy when compared to other algorithms in the Glass dataset. Additionally, the table presents clear evidence that the algorithm proposed in this paper accelerates the convergence rate, resulting in significant reductions in processing time.
Performance comparison of FCM, PCM, REFCM, SREFCM, MShEFCM and MPCSREFCM methods on Glass dataset
Performance comparison of GS θ -REFCM, GS ρ -REFCM,
For Experiment 5, we used the Wine dataset from the UCI repository. The dataset consists of 178 vectors in 13 dimensions, distributed across 3 distinct classes.
Figure 7 shows the statistical results of ARI, CA and NMI of each algorithm under the Wine dataset. In Experiment 5, the statistical results show that the MPCSREFCM algorithm shows significantly higher CA and NMI values than other algorithms, and the results are also more consistent and reliable. The statistical boxplot of ARI values for the MPCSREFCM algorithm shows a wide distribution. However, compared to other algorithms, its value is relatively high, suggesting that the algorithm performs better than others.
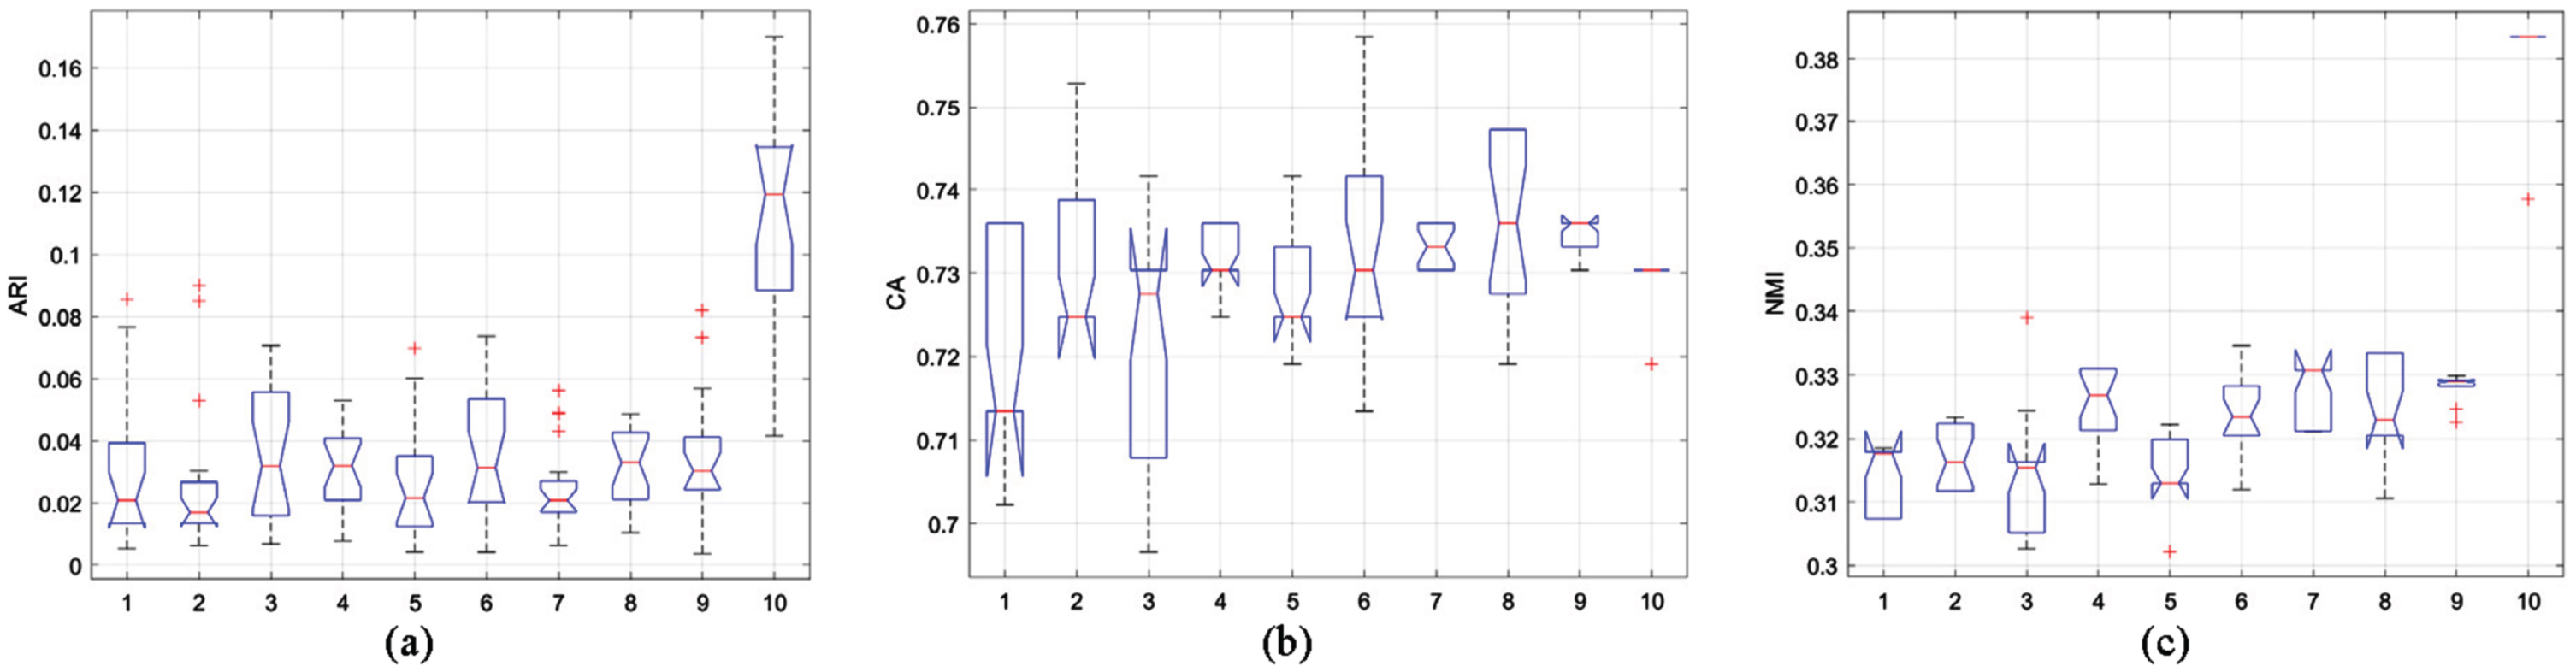
Statistical values of (a) ARI, (b) CA and (c) NMI on Wine dataset.
Tables 6(a)-(b) depict the statistical outcomes of diverse evaluation indices for each algorithm applied to the Wine dataset. The tabulated data highlights that the MPCSREFCM algorithm remarkably enhances convergence speed and diminishes runtime in contrast to alternative algorithms, while upholding accuracy.
Performance comparison of FCM, PCM, REFCM, SREFCM, MShEFCM and MPCSREFCM methods on Wine dataset
Performance comparison of GS θ -REFCM, GS ρ -REFCM,
In this paper, we have mentioned two important parameters, the exponential parameter r and the normalization factor K of the divergence between the membership vectors. In the above experiments, the properties of MPCSREFCM algorithm are considered to be r = 0.1, K-1 = (1 - r) log(c) which is the same for all experiments.
Here, we will discuss the optimal value of the exponential parameter r through two synthetic data sets (see Fig. 8). It is worth noting that during the experiment, we found that when the value of r exceeds 0.5, the value of suppression rate
Synthetic data sets (a) two-dimensional, (b) three-dimensional.
The MPCSREFCM algorithm is evaluated by the seven effectiveness indexes of XieBen index, Accuracy, V k (c), V PEAEC , V SC , ARI and NMI when taking the value of different index parameter r. The results are shown in Table 7.
As shown in Tables 7(a)-(b) The performance of the MPCSRFCM algorithm decreases as the exponential parameter r increases based on the validity metric, regardless of whether it is a simple two-dimensional dataset or a complex three-dimensional dataset. Although there are some abnormal indicator values, they do not affect the overall results. That is, when the exponential parameter r = 0.1, the performance of the MPCSREFCM algorithm is optimal. Therefore, in the experimental results Section 5 of this paper, MPCSREFCM with r = 0.1 is used for the test.
XieBen index, Accuracy, V k (c), V PEAEC , V SC , ARI and NMI of different parameter r values under two-dimensional synthetic dataset
XieBen index, Accuracy, V k (c), V PEAEC , V SC , ARI and NMI of different parameter r values under three-dimensional synthetic data set
The relative entropy fuzzy c-means clustering algorithm adds the relative entropy as a regularization function to the objective function of the FCM algorithm, aiming to enhance class differentiation and mitigate the influence of noise that FCM algorithm may encounter. In this paper, we propose the MPCSREFCM algorithm, which utilizes the data structure to iteratively modify the distribution coefficient for selecting the suppression factor. In contrast to the SREFCM algorithm, which employs a fixed suppression factor throughout, our method dynamically selects the suppression rate based on the characteristics of the data structure. Furthermore, it utilizes an average intra-class distance metric to reduce the impact of noise points on cluster centers. Empirical studies demonstrate that this approach improves convergence while maintaining algorithmic accuracy, and effectively boosts the algorithm’s ability to mitigate noise.
Funding statement
This work is supported by the National Natural Science Foundation of China (Grant Nos. (62071378, 62071379 and 62106196)), the Natural Science Basic Research Plan in Shaanxi Province of China (Grant No.2021JM-461), ‘the Youth Innovation Team of Shaanxi Universities’ and ‘New Star Team of Xi’an University of Posts and Telecommunications, China’, (Grant No. xyt2016-01).