
Abstract
This research proposes a dynamic reconfiguration model (DRM) and method for the distribution network, considering wind power, photovoltaic distributed generation (DG), and demand-side response. The reconfiguration goal is to minimize the total operating cost of the distribution network. The electricity purchase costs, DG operation costs, participation in demand response programs, network losses, and voltage deviations are selected to construct the optimization function. The DRM is established by clustered load data segments. An improved backtracking search algorithm incorporating a differential evolution learning strategy and adaptive chaotic elite search strategy is adopted to solve the DRM. The viability of the proposed method is validated by an IEEE 30-node simulation distributed system.
Keywords
Introduction
The active distribution network (ADN) can optimize the flow of the distribution network by enhancing the network topology and controlling distributed power sources, energy storage devices, and controllable loads, which leads to improved capacity for renewable energy consumption and enhanced energy utilization efficiency [1]. Distribution network reconfiguration (DNR) is recognized as one of the simplest and most cost-effective control methods [2]. However, static restructuring within a single period fails to meet the actual operational requirements of the distribution network system. Therefore, it is imperative to conduct research on active network reconfiguration in order to optimize the distribution network based on load time characteristics [3].
The research on DNR primarily focuses on addressing optimization problems, such as minimizing network loss and improving node voltage. Reference [4] proposes an assessment of the capacity of the distribution network to carry new energy, considering demand-side management and network reconfiguration. Reference [5] develops a mathematical model for network reconfiguration to minimize daily network loss, improve system voltage distribution, and increase reliability. Reference [6] establishes a connection between active demand response and sequential and random network reconfiguration of the distribution network. Reference [7] constructs a unified model for active distribution network island partitioning and network reconfiguration, incorporating distributed power sources and energy storage devices. Reference [8] primarily focuses on applying network reconfiguration to address the uncertainties caused by distributed power sources. Reference [9] develops a network reconfiguration model aimed at minimizing network losses while ensuring the safe operation of the distribution network. Reference [10] proposes a static reconfiguration of the active distribution network to increase the maximum capacity of distributed power sources. Reference [11] considers the application of network reconfiguration to accommodate new energy sources. Reference [12] establishes an optimization model to minimize the distribution network’s comprehensive operating cost. Reference [13] solely addresses issues related to voltage quality during the network restructuring process. Reference [14] establishes a distribution network restructuring model to reduce network losses. However, existing literature primarily focuses on pure network restructuring or solely considers studies on distributed power sources or demand-side responses. Given the increasing integration of distributed power sources into the distribution network and the growing involvement of users in regulating the distribution network, there is an urgent need for studies that comprehensively consider the impact of distributed power sources and demand-side responses on the distribution network.
Thus, this study proposes a dynamic reconfiguration model for the distribution network that comprehensively incorporates network reconfiguration, distributed power sources, and demand-side responses. The model combines daily load curves, wind/solar power generation curves, and various other measures to divide load periods into peak, valley, and flat periods, enabling dynamic network reconfiguration. Furthermore, in order to overcome the issues of limited population diversity and search capacity in the Backtracking Search algorithm (BSA), this study introduces the differential evolution learning strategy and adaptive chaotic elite search strategy to enhance the algorithm. The improved backtracking search algorithm is adopted to solve the model. Compared to existing methods, the objective function of this model considers the modeling of demand-side responses and distributed power sources in active distribution networks. The study results demonstrate that the proposed strategy significantly enhances the performance of the distribution network, provides valuable insights for the actual operation of active distribution networks, and enables the improved algorithm to identify global optimal solutions rapidly.
The main contributions of this paper are as follows: Different from previous static DNR methods, this paper develops a dynamic reconfiguration method for distribution networks by dividing them into peak, valley, and flat load periods based on the daily load curve and wind/solar power generation curve. Different from the previous optimization goal of focusing on power quality in distribution networks, this paper constructs a dynamic reconfiguration model for distribution networks, taking into account the influence of distributed power sources, network structure, and controllable loads, as well as network reconfiguration, distributed power sources, and demand-side response. To address the issue of insufficient population diversity and search capability within the BSA algorithm, this paper introduces the differential evolution learning strategy and adaptive chaotic elite search strategy to enhance the algorithm.
Active distribution network optimization control method
The active distribution network is based on the control concept of prediction, state awareness, optimization, and coordination. Under the premise of direct load control and non-direct load control strategies, various types of distributed resources are comprehensively monitored and integrated [15], including user-controllable resources, grid-side switches, voltage regulators, and energy storage facilities [16]. These resources are combined with predictive methods to achieve coordinated control of the “source-network-load” in the ADN [17]. Among these control methods, network reconfiguration, implemented by controlling grid-side switches, is the simplest and most economical method for quickly distributing and managing loads [18].
Network reconstruction is a primary measure for optimizing the operation of distribution networks. For continuously changing loads, dynamic reconstruction based on adjusting the network topology within time intervals is more practical. Currently, there are two methods for solving dynamic reconstruction: the first method involves sequentially conducting static reconstructions within unit time intervals according to the scheduling plan, dividing the intervals based on the characteristics of the network structure or setting dynamic parameters such as loss reduction and voltage, which can be a cumbersome process; the second method, which is currently widely used, simplifies the dynamic reconstruction problem into multiple static reconstruction problems by dividing the time intervals based on predicted load curves. This paper utilizes load similarity to perform clustering and then employs an adaptive aggregation algorithm that reflects the fluctuation characteristics of equivalent daily load curves, thereby obtaining reasonable time interval divisions.
This paper’s first step in real-time reconfiguration is to determine the need for reconfiguration within a specified time period to avoid equipment aging caused by frequent switch operations. The strategy used involves segmenting the load curve based on different load conditions throughout the day, as shown in Fig. 1. Initially, the typical load curve (Fig. 1a) is approximated by a step-like curve (Fig. 1b). If the number of segments is too large, direct reconfiguration would require multiple switch operations, which is uneconomical and reduces the lifespan of the switches. To address this issue, clustering is employed to group similar segments together (Fig. 1c). The clustering results are then adjusted by replacing the clustering maximum value with the maximum value of each segment’s curve (Fig. 1d). This adjustment is necessary because the clustering center of the clustering algorithm is typically the average value, which may result in topological problems where the voltage requirements are not met after reconfiguration during heavy loads.
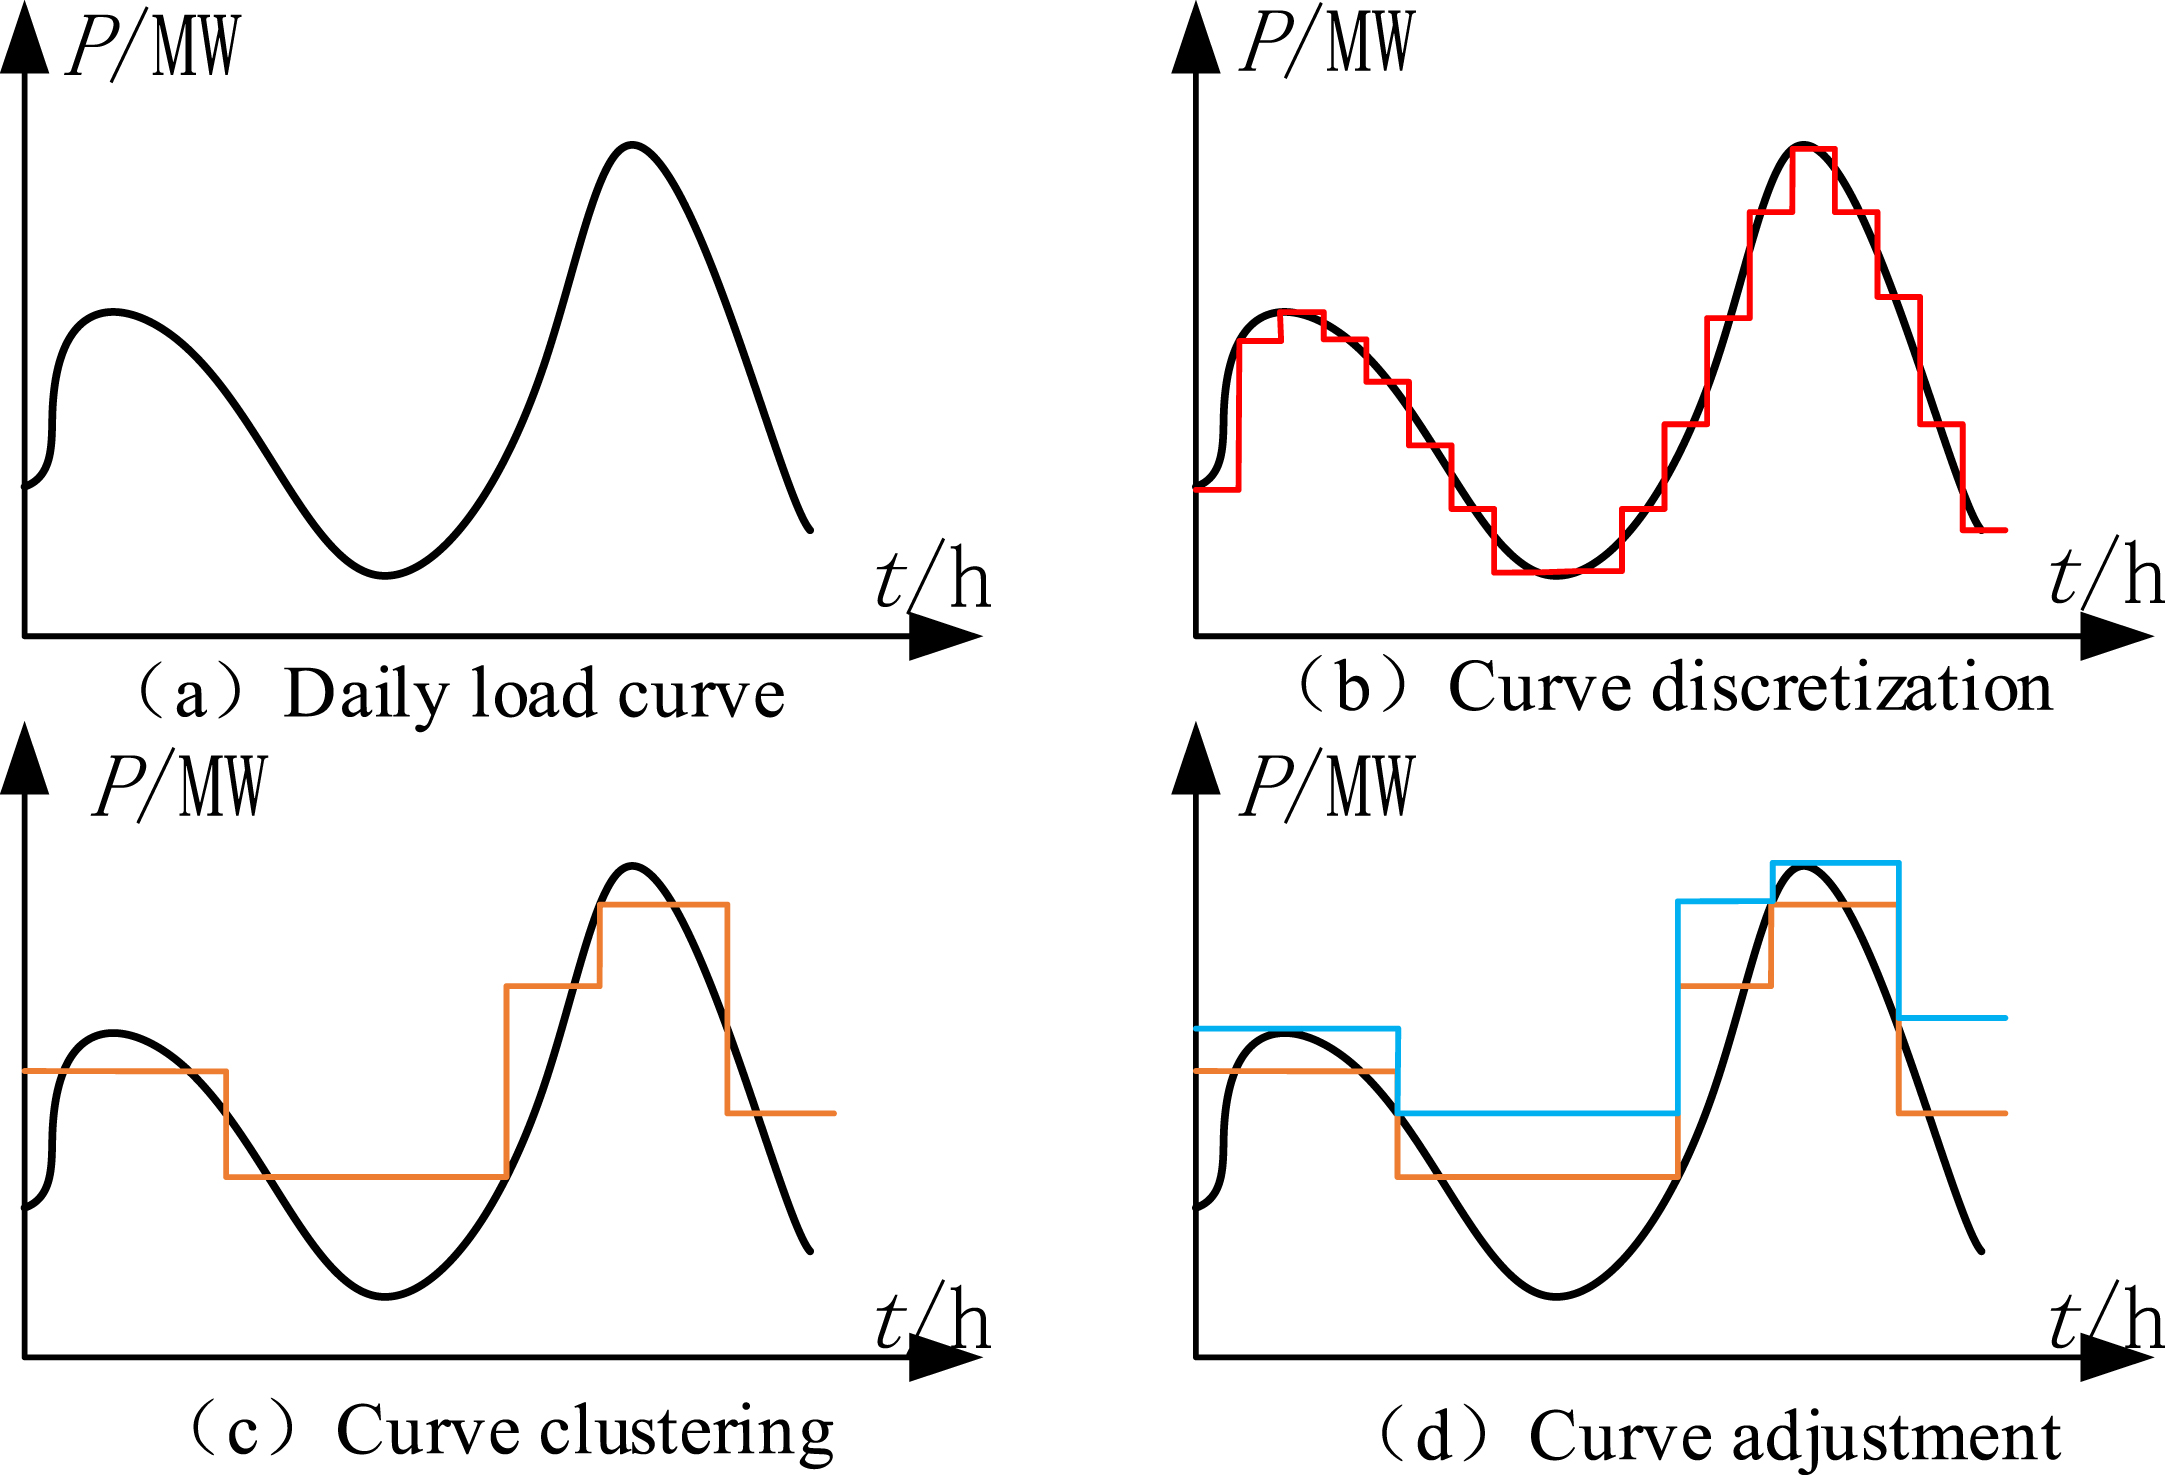
Schematic of segmentation and clustering method.
According to the data analysis in Table 1, we can draw the following conclusions: The unclustered model has a maximum relative error of 22.1%, while the clustered model is only 6.18%. This means that the clustered model has a smaller error compared to the unclustered model.
Comparison of error results
Furthermore, the average relative error of the unclustered model is 6.46%, while the clustered model is only 2.14%. This further demonstrates that the clustered model generally exhibits smaller errors compared to the unclustered model.
In conclusion, by using the clustered model, we can obtain more accurate prediction results. The clustered model has smaller prediction errors compared to the unclustered model.
Subsection
The distribution network reconfiguration involves making changes to the topology of the network, such as opening or closing switches, to optimize the overall cost. The objective is to find the configuration that minimizes the total cost while satisfying certain constraints, such as load demand and network capacity.
To achieve this, various optimization techniques can be used, such as genetic algorithms, particle swarm optimization, or mixed-integer programming. These techniques consider the constraints and the objective function, and search for the optimal network configuration that minimizes the overall cost.
In addition to optimizing the cost, distribution network reconfiguration also aims to improve the system’s reliability and minimize power interruptions. By reconfiguring the network, the power flow can be improved, leading to reduced losses and better voltage regulation.
Overall, distribution network reconfiguration is an important task for electricity distribution companies to ensure efficient and reliable power supply while minimizing costs. It requires careful analysis, modeling, and optimization to find the optimal configuration that balances different objectives and constraints.
Where the first term represents the cost of purchasing electricity. The distribution network operator procures the necessary electricity from the power market or different power generation companies, which incurs a cost for the operator. It primarily considers the cost of purchasing active power
The following constraints are listed for each time period:
1. Flow equation constraint:
2. Node voltage constraint:
3. Feeder current constraint:
4. DG operation constraint: These constraints keep the active and reactive power of the DG within their rated capacity:
5. RL constraint:
6. Radiation constraint:
Where N ts is the number of tie switches, N br is the total number of feeder lines, N bus is the number of bus nodes, and N s is the number of power sources.
Backtracking search algorithm
Backtracking Search Algorithm (BSA) is a metaheuristic algorithm that has been widely used for optimization problems. It is known for its strong global search ability, making it a popular choice among researchers and practitioners.
The algorithm mainly consists of five basic operations: Initializing the population, Selection I, Mutation, Crossover, Selection II.
By repeating these five operations iteratively, BSA explores the search space and gradually converges towards the optimal or near-optimal solution. This algorithm outperforms traditional algorithms in terms of global search ability, meaning it has a higher chance of finding the global optimum rather than getting stuck in local optima. [19, 20]
Solution process
The specific steps of the BSA optimization algorithm are as follows:
Initialize the population.
To ensure the radial structure of the network, the number of disconnected feeder lines should match the number of tie switches and basic loops during the network reconfiguration process. This requirement ensures a proper distribution of power within the network. Consequently, the BSA algorithm includes the states of switches as variables to determine the number of switches that need to be opened after reconfiguration.
To optimize the search for feasible solutions, this paper adopts a switch encoding method based on basic loops, as depicted in Fig. 2. This method helps reduce the search space and facilitates efficient identification of potential solutions.
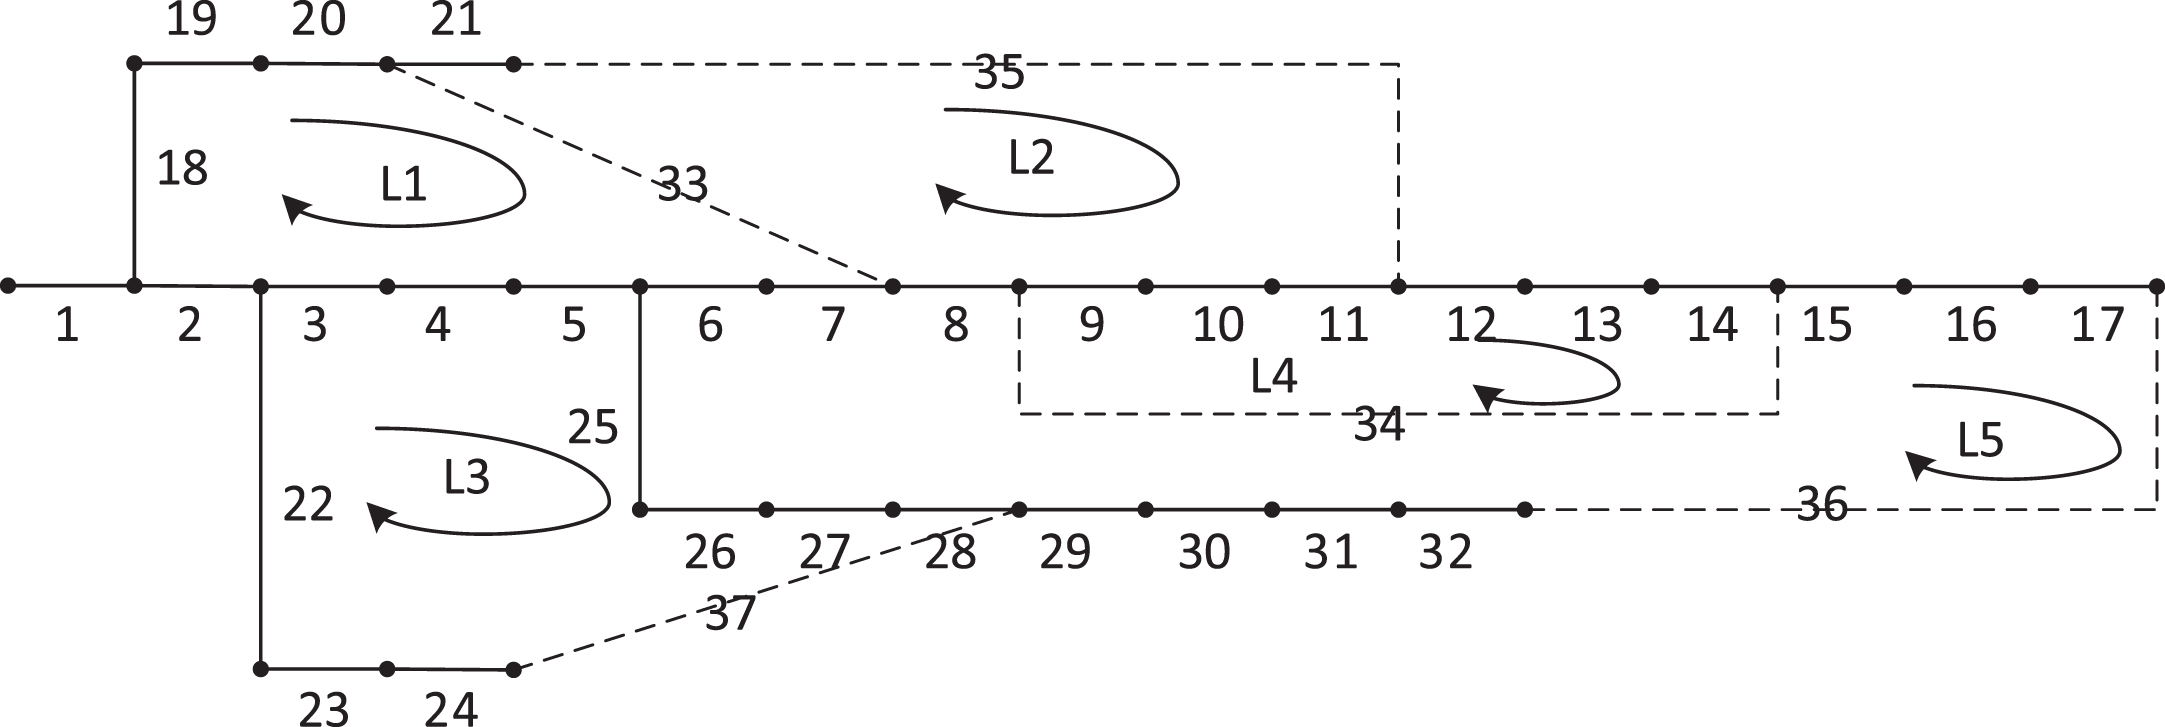
BSA coding chart.
During the network reconfiguration process using the BSA algorithm, each topology individual representing a radial structure is treated as a solution vector. This solution vector encompasses the state and configuration of switches within the network. This approach allows for evaluating the network’s performance based on the selected solution.
Where N represents the population size, N
ts
represents the dimension of the problem. Each
Where SW i represents the switches that need to be opened to satisfy the Equation (10) during the network reconfiguration process.
Based on the initially generated individuals, the Newton-Raphson power flow algorithm is employed to calculate the power flow within the distribution network. The fitness of each individual is subsequently determined based on the obtained power flow results.
The Backtracking Search Algorithm (BSA) is a dual-population algorithm that utilizes both the current and historical populations. To calculate the search direction matrix, a random selection from the past population is remembered and considered for determining the direction [21].
In this particular step, the BSA algorithm generates a historical population called “oldp,” which serves as the basis for the search direction. Before commencing each iteration, the historical population is redefined by comparing two random numbers. This process ensures that the new population is derived from the previous generation’s randomly selected populations. Once the population is selected, the individuals within “oldp” need to be randomly sorted.
Mutation
The BSA mutation process generates the initial form of the experimental population through the following formula:
Where F is the mutation scale coefficient used to control the magnitude of population mutation. As the mutation process utilizes the previous generation of the population, a portion of the previous generation’s superiority is attained when generating the experimental population. To determine the mutation proportion factor, a random number following the Maxwell-Boltzmann distribution is utilized.
The crossover process in the BSA algorithm is utilized to generate the final form of the experimental population. The initial value of the experimental population is derived from the Mutant generated during the mutation process. Individuals within the experimental population that exhibit better fitness to the objective function will evolve towards the target individual.
The crossover process in the BSA algorithm consists of two steps. Firstly, a one-dimensional binary integer matrix (referred to as the “map") is generated. There are two ways to define this map. The first approach involves randomly sorting individuals in the population and utilizing a crossover length determined by the crossover probability parameter. The second approach allows only one randomly selected individual to undergo mutation in each experiment [22].
During the crossover process, it is possible for individuals to exceed the search space. Therefore, it is necessary to evaluate and improve the individuals generated after crossover to maintain their validity. In order to enhance population diversity, the algorithm incorporates the differential evolution learning strategy to enhance the existing population [23, 24]. The formula for this strategy is shown as follows:
Where npop is the new individual generated; p1, p2, and p3 are randomly selected three different individuals in the current population; F1 is the adaptive mutation coefficient, calculated as follows:
Where e is the base of natural logarithms, max T is the maximum number of function evaluations, T is the current number of function evaluations, and F0 is the scaling factor, usually taken as 0.6.
In the second selection phase of the BSA, it is crucial to evaluate the decision variable of the crossover-generated population and ensure that it conforms to the radial topology of the power grid. The operating cost function, given by formula (1), is then calculated for the evaluated decision variable. If the evaluated decision variable proves to be superior to the corresponding solution in the population (denoted as “pop"), the population is updated, and the inferior solution is replaced.
To enhance the overall quality of the population, the BSA algorithm incorporates a self-adaptive chaotic elitist search strategy. This strategy aims to discover new solutions in the vicinity of the current optimal solution, which in turn replaces the worst solution in the population. The chaotic sequence necessary for this search strategy is obtained using the logistic map, as depicted in formula (14).
The proposed BSA method in this study employs a specific stopping criterion based on the maximum number of iterations. Once the number of iterations reaches the predetermined maximum value, the algorithm is terminated. Figure 3 illustrates the flowchart of the BSA algorithm designed for DNR (Distribution Network Reconfiguration) problems.
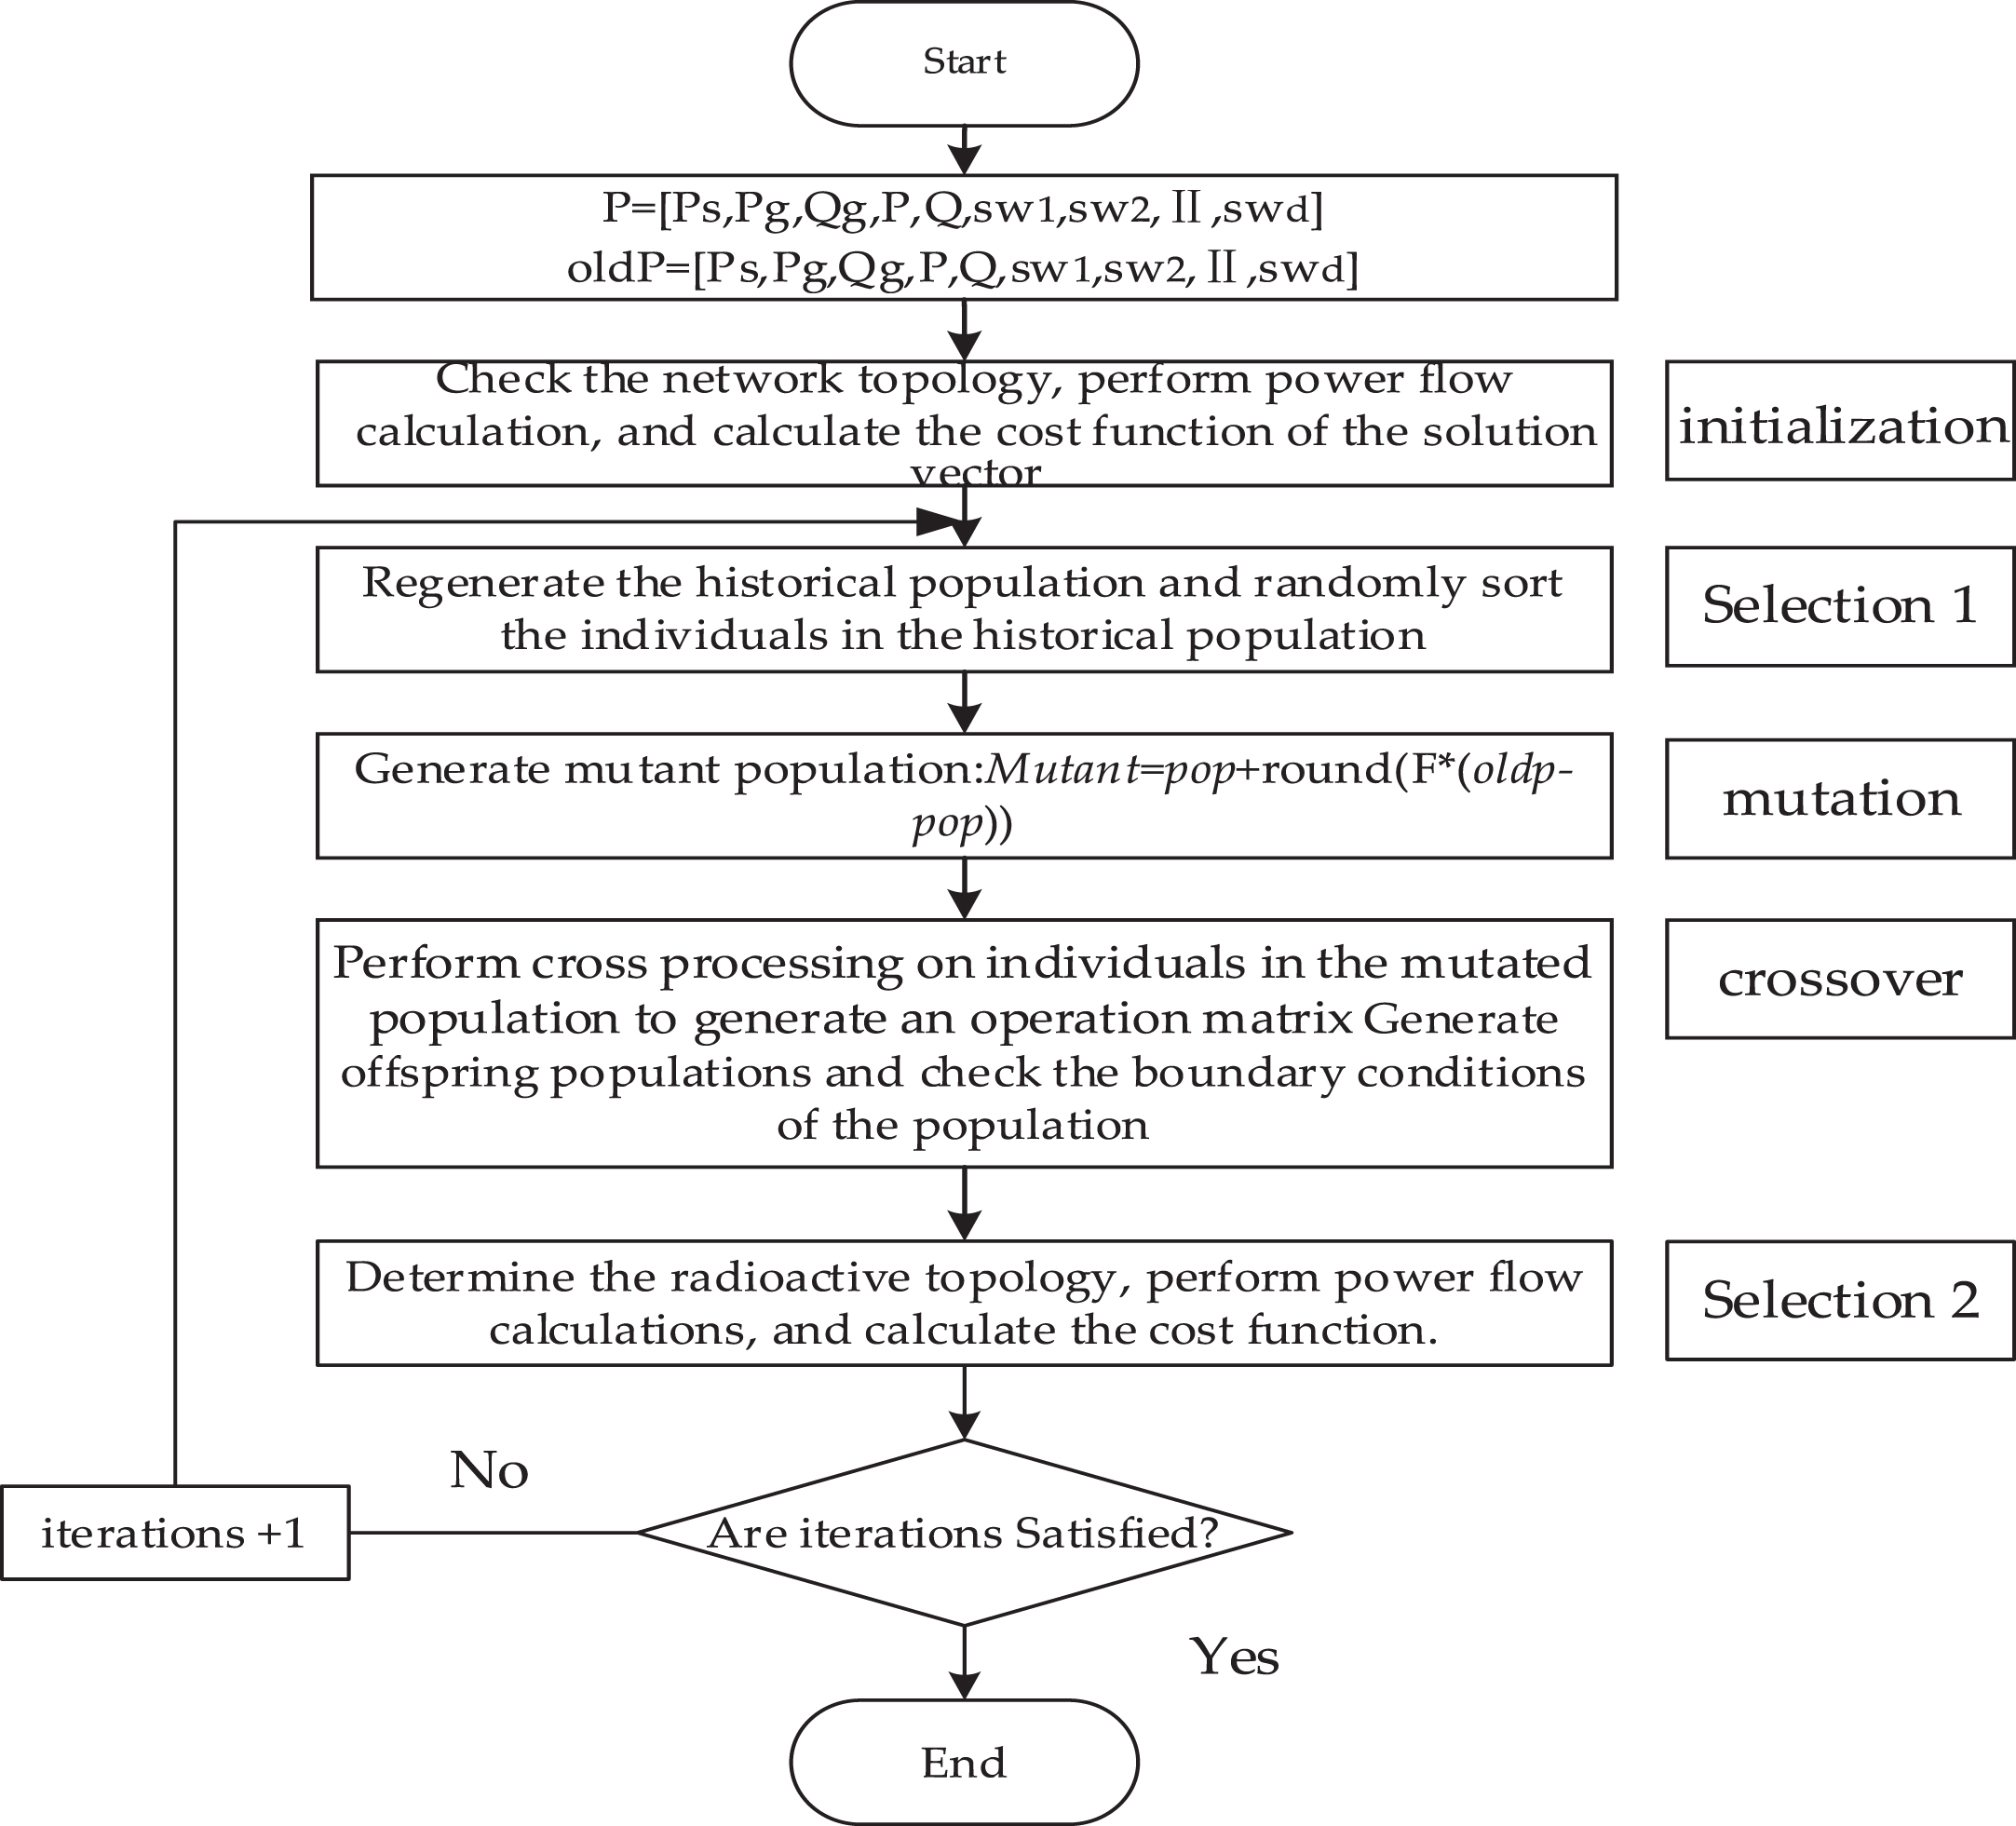
BSA algorithm flow chart.
Experiment description
In this study, the simulation and analysis are performed using the IEEE 33 node distribution system. The data for one day is divided into 24 time periods, assuming a constant load for each period. Specifically, wind power generators, photovoltaic generators, and responsive loads are connected to nodes 30, 16, and 32, respectively [25–27]. The system configuration diagram is provided in Fig. 4, with the following specific parameters:
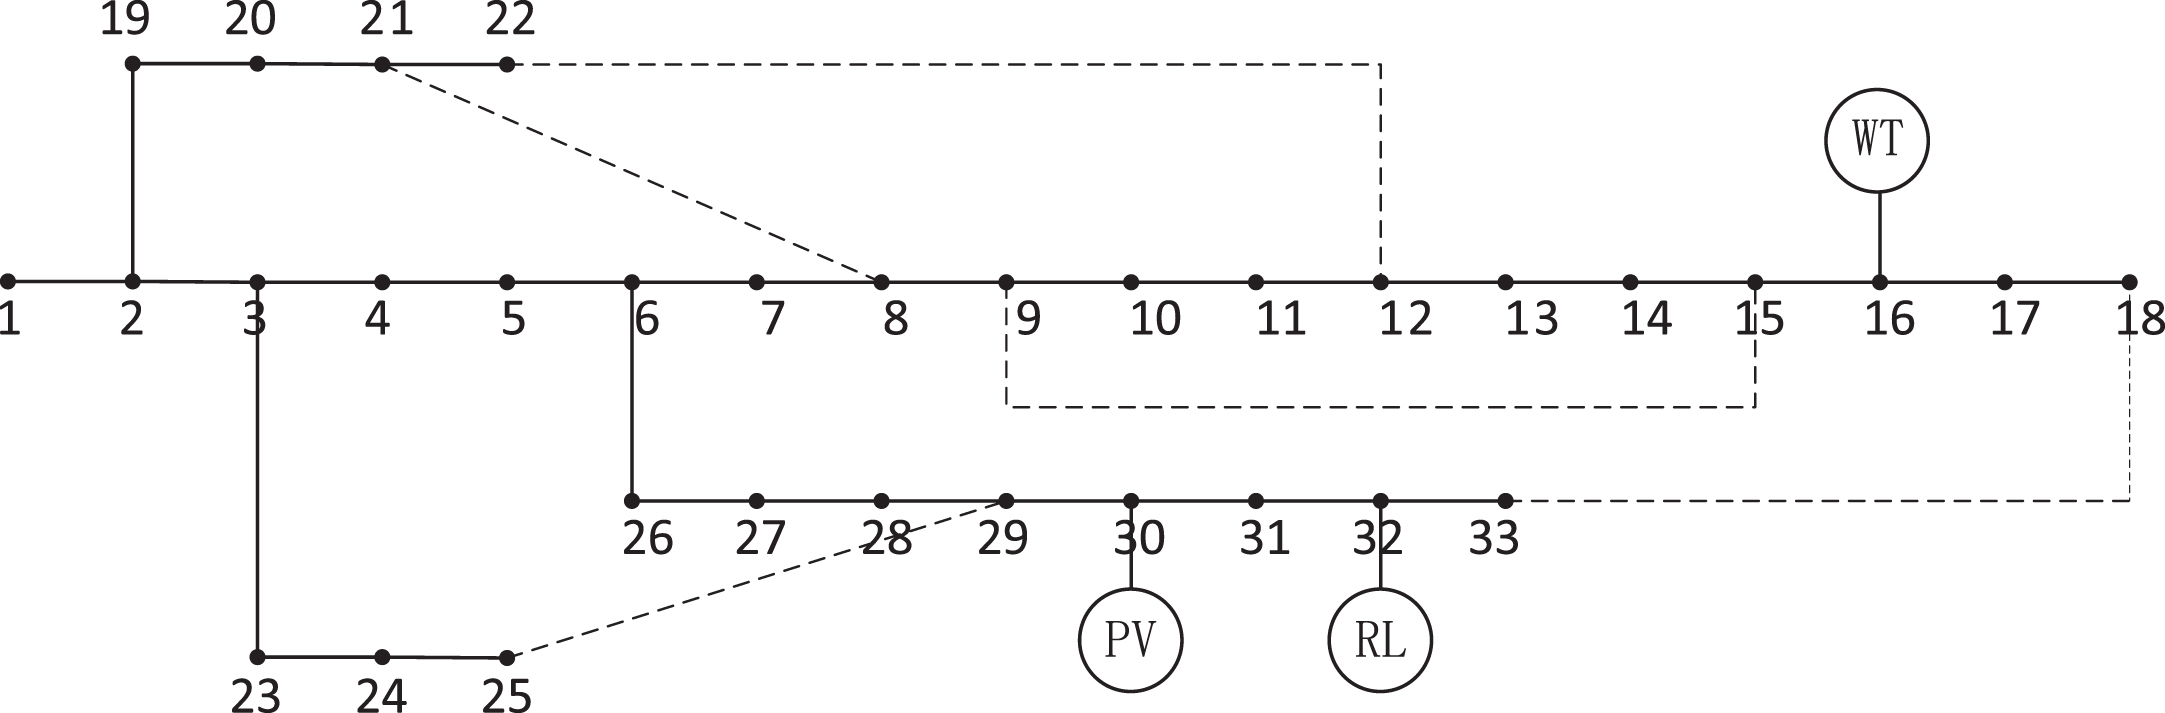
Improved IEEE 33 node system diagram.
The photovoltaic generator has a capacity of 1.5 MW. From 0:00 to 6:00 and from 21:00 to 24:00, the average power output is zero. During the period from 17:00 to 21:00, the output is gradually reduced until it reaches zero [28, 29]. Figure 5 depicts the power output curve for a typical sunny day.
The wind turbine has a rated power of PN = 0.8 MW, a rated wind speed of vN = 14 m/s, a cut-in wind speed of vin = 4 m/s, and a cut-out wind speed of vout = 24 m/s [27]. As illustrated in Fig. 6, the typical wind power generation curve is calculated.
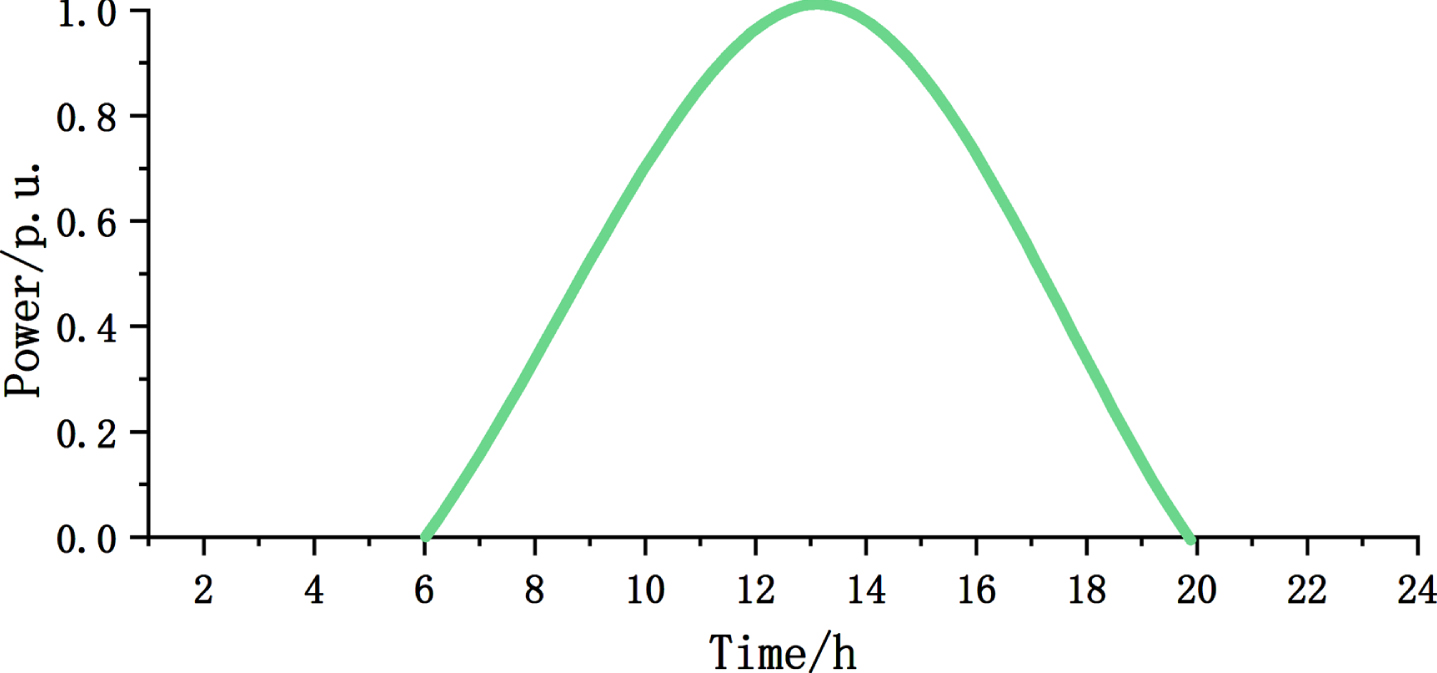
Solar PV-type DG generation curve.
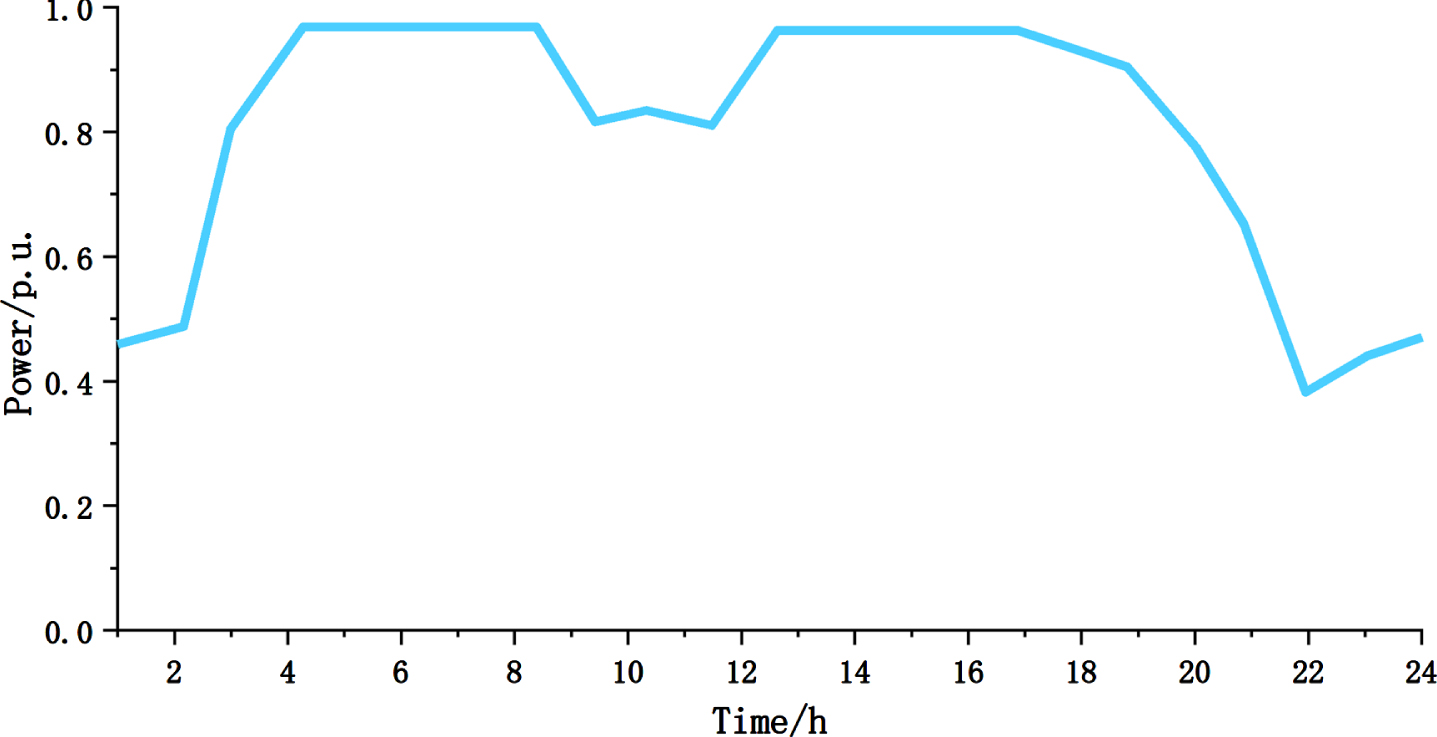
Wind-type DG generation curve.
This study employs two different schemes to evaluate the effectiveness of the segment-based algorithm: Scheme 1: - Does not consider network reconfiguration. - Controls distributed generation (DG) and responsive loads (RL). Scheme 2: - Considers network reconfiguration. - Involves controlling remote switches to improve the network topology. - Controls DG scheduling, incorporating the use of RL.
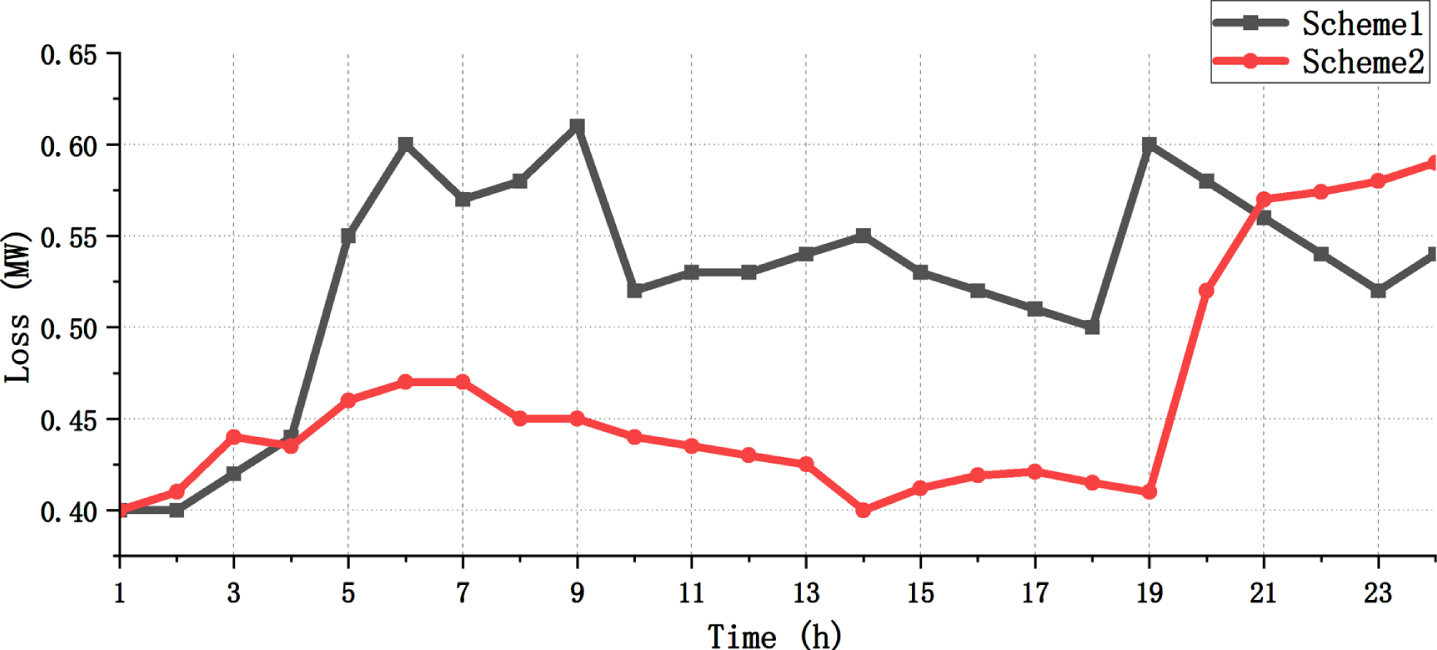
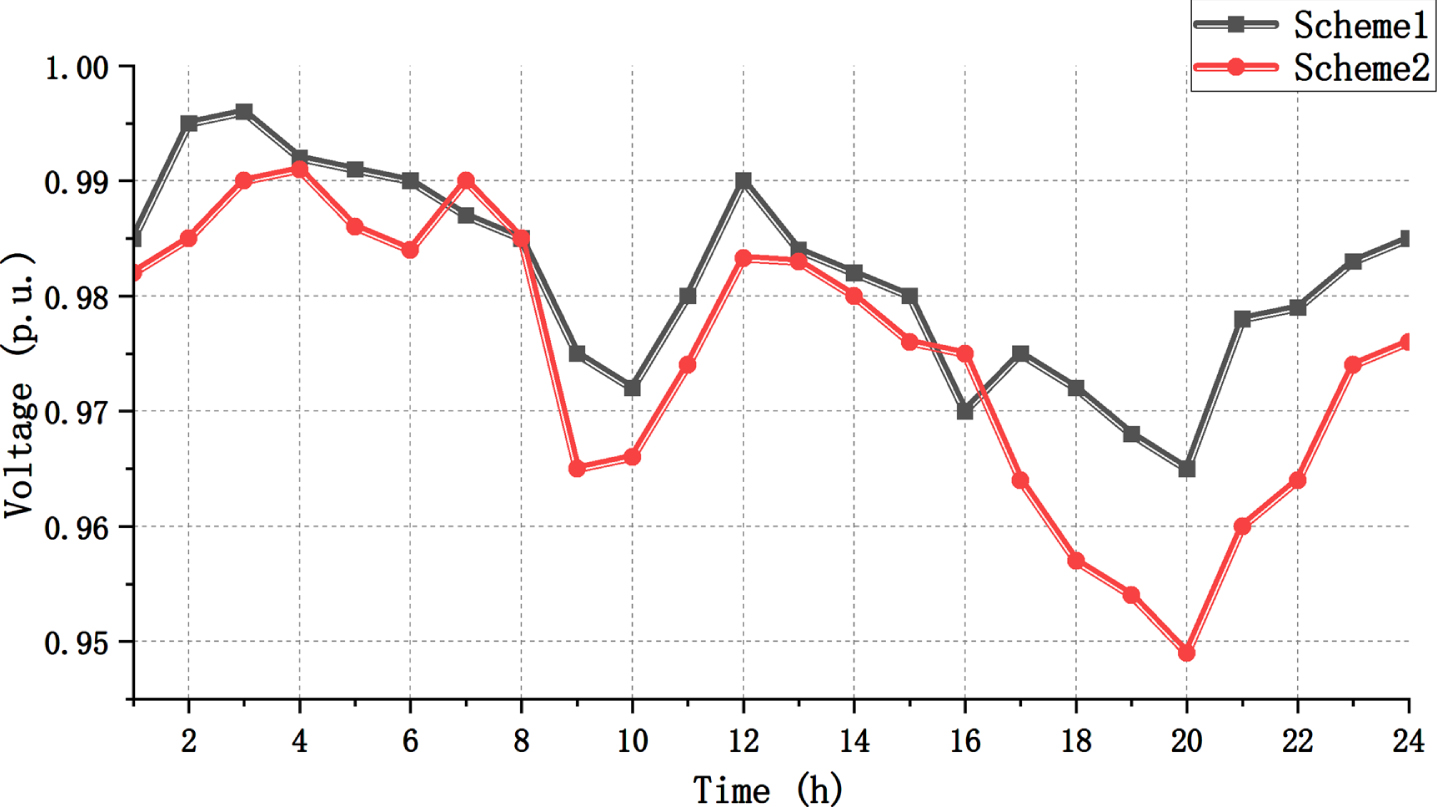
By comparing the two schemes in Table 1, it is evident that the incorporation of network reconfiguration in Scheme 2 leads to a more optimal power factor for DG. This indicates that network reconfiguration has a positive impact on enhancing the performance of the distribution network. Figures 7 and 8 illustrate that Scheme 2 generally exhibits lower overall network losses compared to Scheme 1, along with improved bus voltage conditions.
The results from Fig. 9 demonstrate the involvement of RL in real-time scheduling. In Scheme 2, it is apparent that the time and power required for RL’s participation are relatively lower. Upon calculation, it was found that network reconfiguration in Scheme 2 has led to a reduction of 24.76% in power consumption.
Total active power losses in the network.
Minimum bus voltage curve.
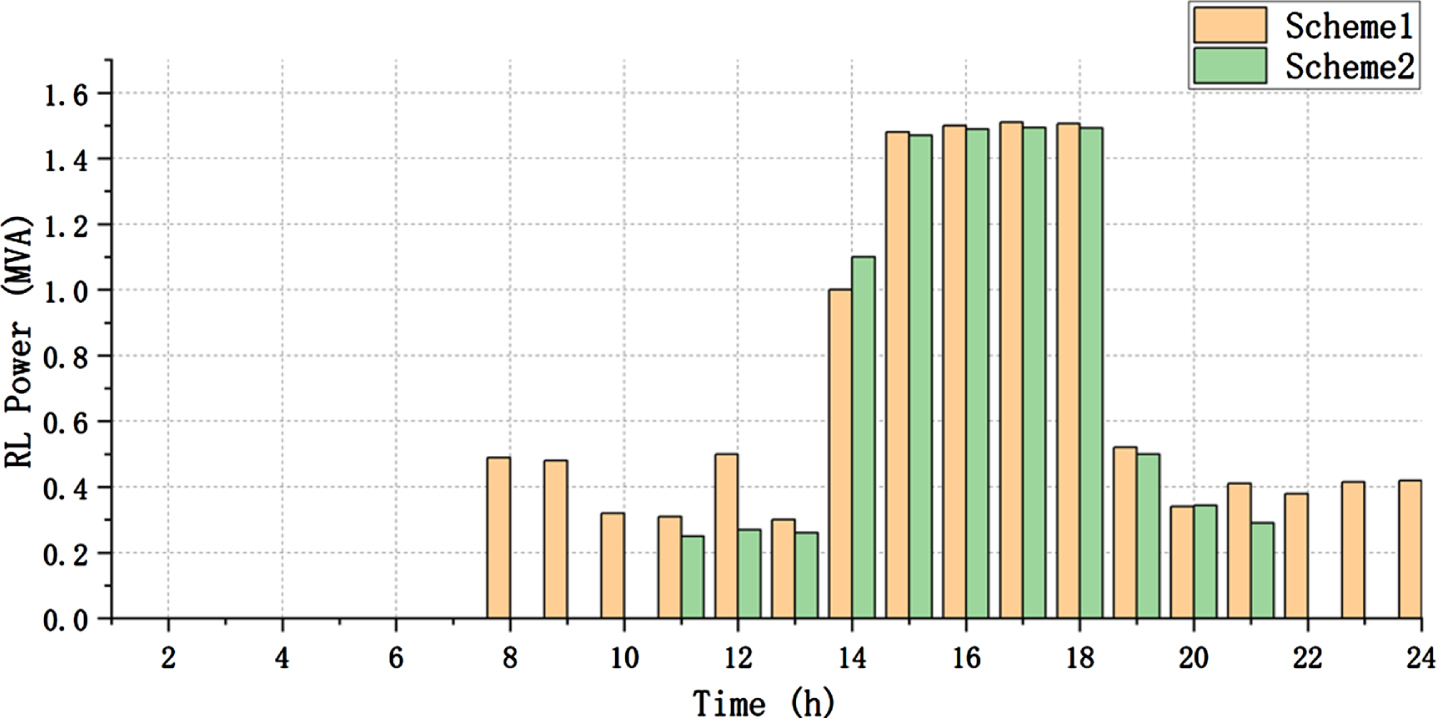
Apparent power reduction by RLs.
Figure 10 exhibits the enhancement in power quality achieved through network reconstruction. The improved power supply load of the line can be observed in Fig. 11. Additionally, network reconfiguration has increased the power supply margin for certain lines, thereby enhancing reliability.
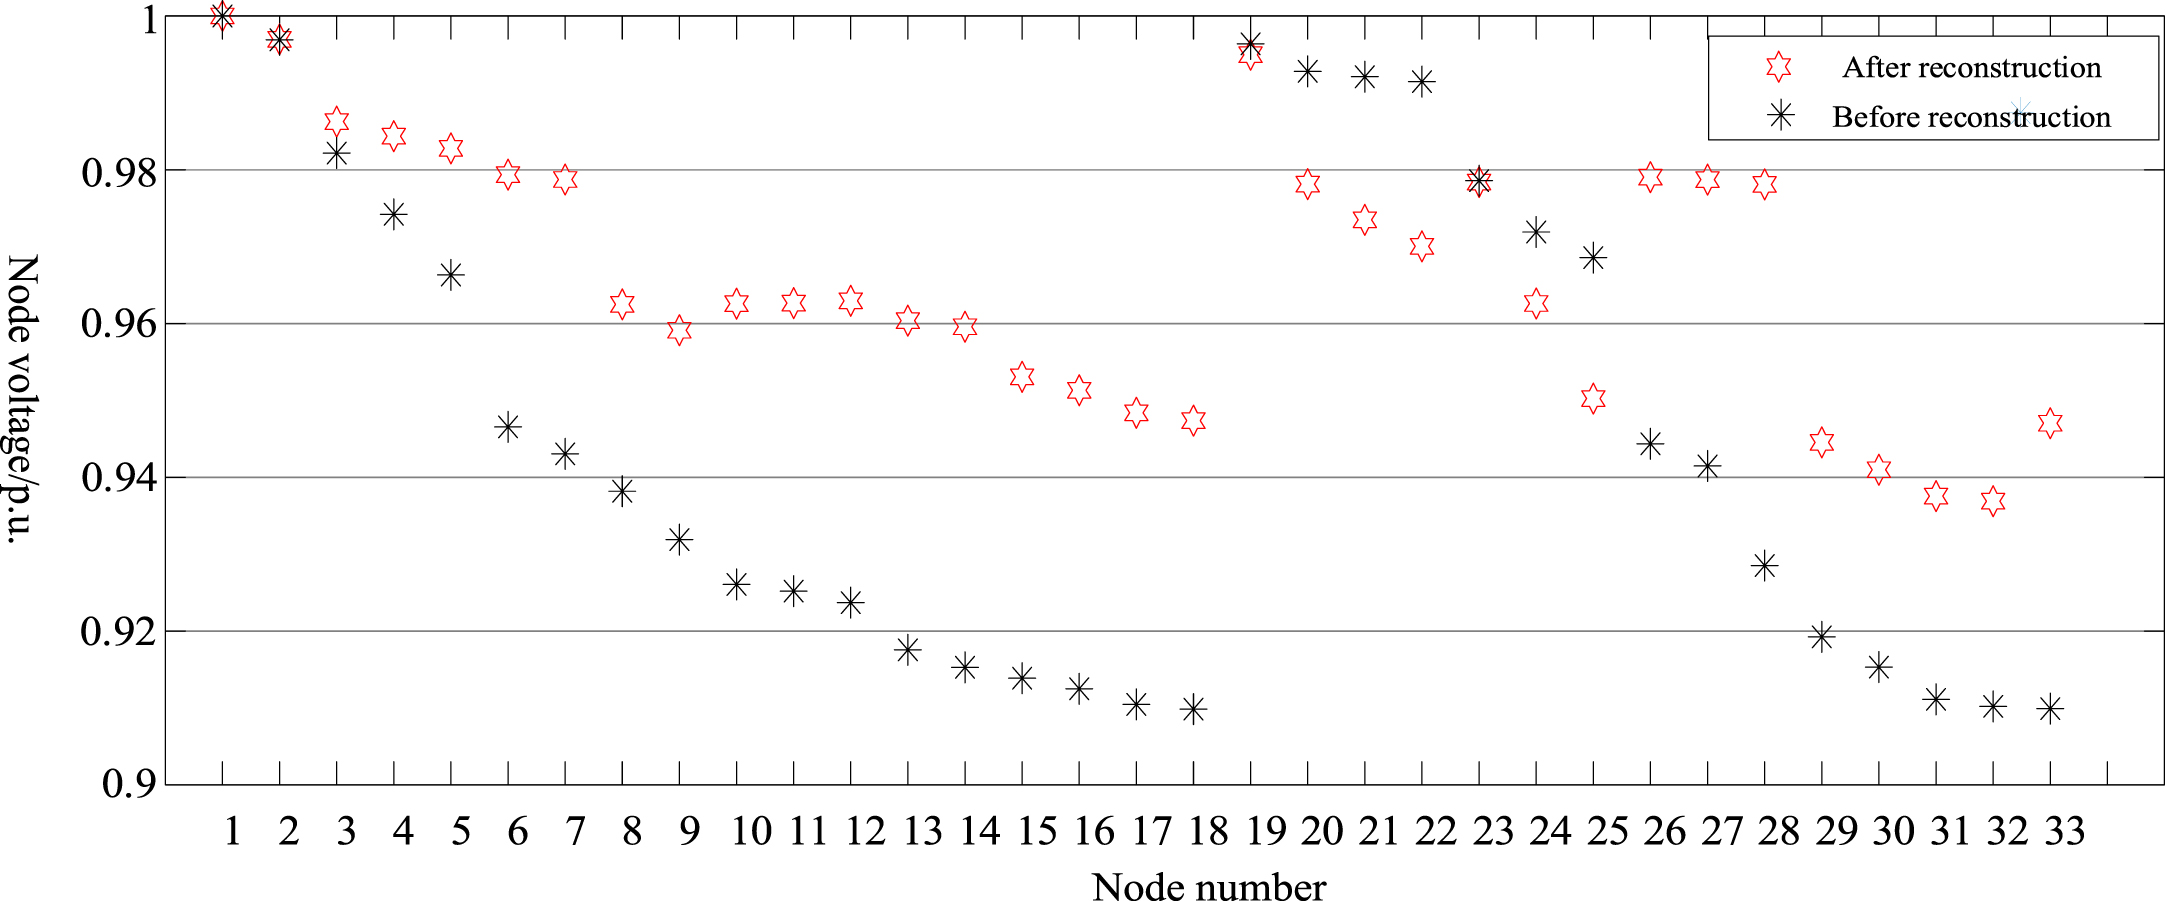
Comparison of node voltage distribution before and after reconstruction.
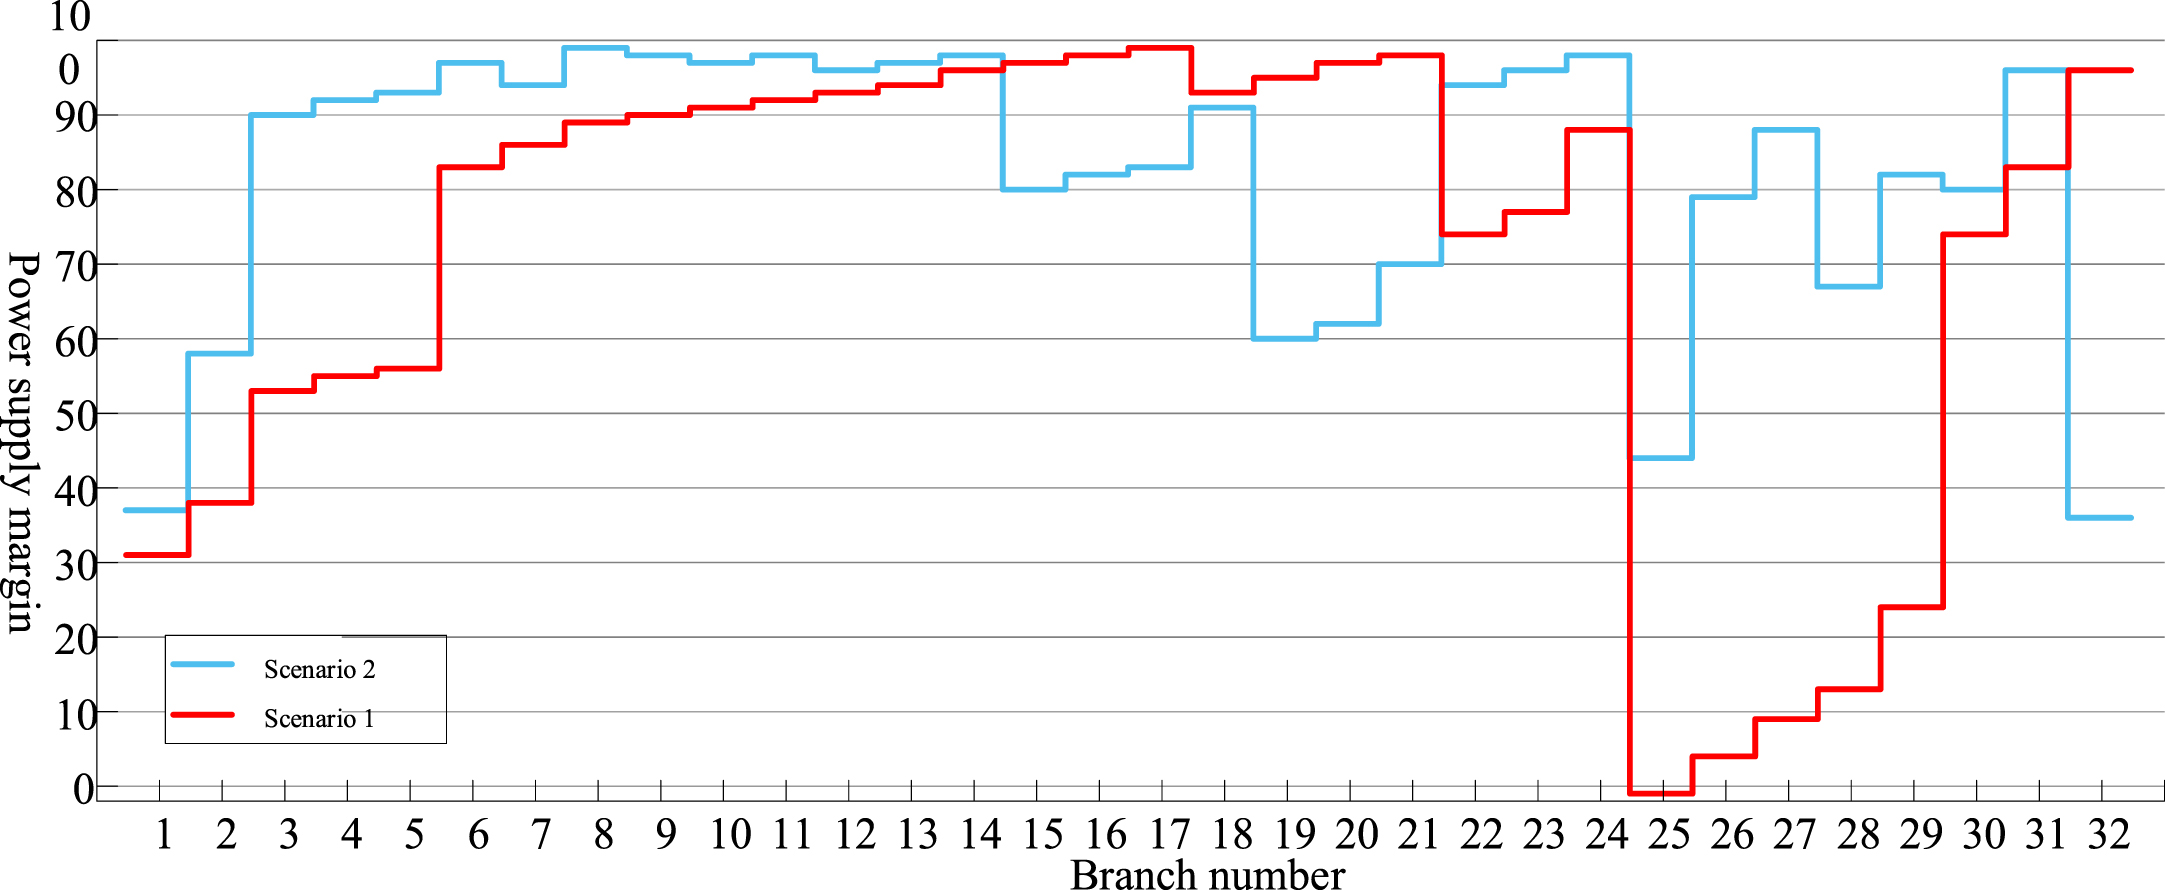
Line power supply margin after reconstruction.
Table 2 presents the optimized operation costs of the distribution network for various time periods. By implementing real-time network reconfiguration, cost savings can be achieved across all six time periods, particularly during periods of high electricity usage. Upon calculation, it has been determined that by applying network reconfiguration to the active operation and scheduling of the distribution network (in Scheme 2) compared to Scheme 1, the total operation cost will decrease by 5.53%.
The comparison of DGs power factor and RL participation for cases 1 and 2
To validate the effectiveness of the enhanced backtracking search algorithm (BSA) based on the basic circuit code proposed in this study, the BSA algorithm is employed to conduct static reconfiguration on the standard IEEE 69 node system. The objective is to minimize network loss and voltage deviation. The resulting calculations are compared with other intelligent algorithms and commercial solvers such as cplex, as presented in Table 3.
Comparisons of different algorithms’ results
Comparisons of different algorithms’ results
From Table 3, it is evident that the network loss and voltage deviation obtained through the Improved BSA (IBSA) method are significantly lower. This indicates that the IBSA method is more efficient in finding the global optimal solution, making it more favorable for achieving minimized network loss and voltage deviation.
Figure 12 illustrates the convergence curves of the different algorithms. It is apparent that, with the same number of iterations, the enhanced BSA algorithm is capable of converging to the global optimal solution faster. Furthermore, the final function value achieved by the improved algorithm is considerably better compared to the unimproved algorithm. These results indicate the effectiveness of the proposed enhancement strategy.
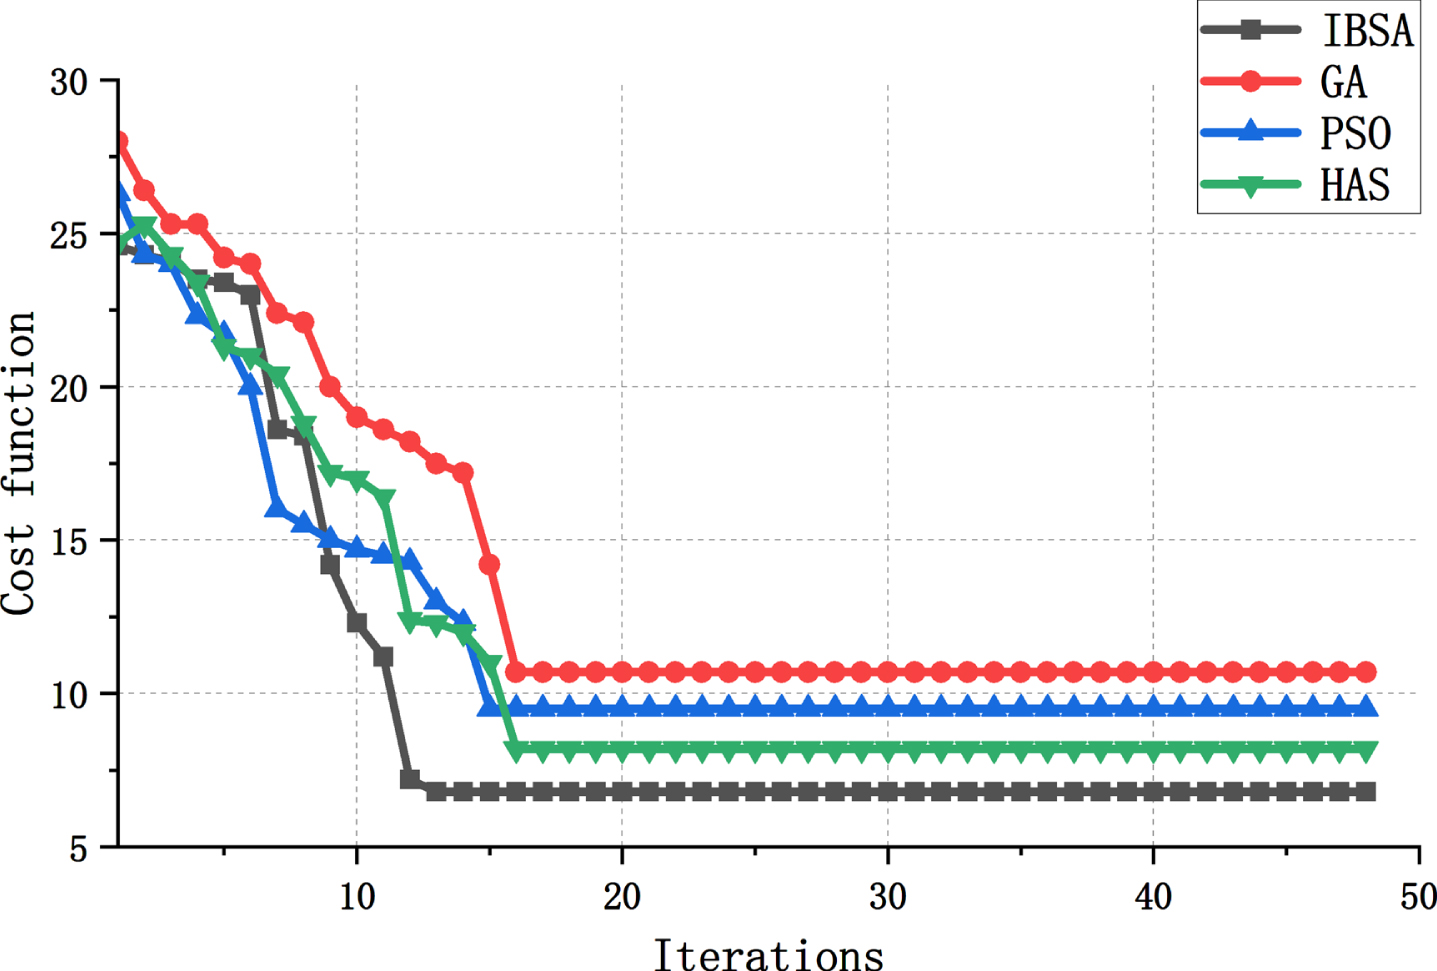
Contrast diagram of iterative process before and after improvement.
Standard test functions were selected, F1 to F7 representing the sphere, schwefel12, rosenbrock, griewank, ackley, rastrigin, and schwefel functions, respectively. Each of them has its own characteristics, with F1 to F3 being unimodal functions and F4 to F7 being multimodal functions.
The stopping criteria and parameter selection are as follows: a) Stop when the absolute difference between the obtained result and the known optimal solution of the benchmark test function is less than eps, i.e., 2.204×e-16; b) Stop if the optimal solution remains unchanged after 500 generations; c) Stop if the maximum evolution generation of 50000 is reached. Any one of these conditions being met will trigger the stopping of the algorithm.
The experiments were conducted using uniformly selected 30-dimensional problems, with the population size set to 30, consistent with the dimensionality of the test problems. The crossover probability for BSA and improved BSA is set to 1. Comparisons were made based on the best value, worst value, variance, average running time, average number of iterations, and success rate from 30 runs, as shown in Table 4. From the test results of F1 to F7, it can be observed that the improved BSA has significantly fewer evolution generations compared to BSA. Compared to other algorithms, the improved BSA has a higher search success rate and performs well in terms of search time. This is because BSA and improved BSA adopt a simple mutation strategy, where only one mutation scale factor is generated for the entire population in each generation, and different individuals are not deliberately sought to generate differential quantities, thereby saving a considerable amount of time. Overall, the improved BSA is a time-efficient and highly effective evolutionary algorithm.
Mean, standard deviation, mean number of iterations, average running time (Rtime/s), and success rate (srate) of 30 test results
Mean, standard deviation, mean number of iterations, average running time (Rtime/s), and success rate (srate) of 30 test results
In order to further test the stability of IBSA’s global convergence performance, the number of experiments was increased to 50 and 100 respectively. The mean, variance, and success rate of the test results were calculated and compared with the results obtained from 30 experiments. The test results are shown in Table 5.
Comparison of mean, variance, and success rate of test results for different numbers of experiments (30, 50, and 100)
It can be observed that in the unimodal functions F1 and F2, IBSA can converge to the set accuracy smoothly. However, in the unimodal function F3, due to the pathological nature of the function itself, it is difficult to obtain the global optimal solution. In the 100 tests, premature convergence was observed in IBSA only once. In the multimodal functions F4 to F7, the mean and variance of the experimental results for different test numbers remained relatively stable or varied slightly. This suggests that the convergence results of IBSA have strong stability.
This paper addresses the dynamic reconfiguration problem in active distribution networks involving wind power, photovoltaic DG, and load response. It proposes a dynamic reconfiguration method based on the BSA algorithm. The simulation results demonstrate the following findings: The proposed method effectively reduces the operating cost of the system and improves the operation of the distribution network. The improved BSA algorithm can successfully solve the dynamic reconfiguration problem in active distribution networks and quickly identify the global optimal solution.
For future research, the paper suggests the following areas of investigation: Comprehensive consideration of reactive power control strategy for DG and load response in order to further optimize system performance in dynamic reconfiguration. Exploration of additional algorithms and models to better address the dynamic reconfiguration problem in active distribution networks. Inclusion of more node types in the study to comprehensively examine the optimization of operational issues in connecting distributed power sources to distribution networks.
Footnotes
Acknowledgments
This research was funded by Science-Technology Innovation Platform and Talents Program of Hunan Province, China, grant number 2019TP1053.