
Abstract
Timely detection of building damage after a disaster can provide support and help in saving lives and reducing losses. The emergence of transfer learning can solve the problem of difficulty in obtaining several labeled samples to train deep models. However, some degree of differences exists among different scenarios, which may affect the transfer performance. Furthermore, in reality, data can be collected from multiple historical scenarios but cannot be directly combined using single-source domain adaptation methods. Therefore, this study proposes a multi-source variational domain adaptation (MVDA) method to complete the task of post-disaster building assessment. The MVDA method consists of two stages: first, the distributions of each pair of source and target domains in specific feature spaces are aligned separately; second, the outputs of the pre-trained classifiers are aligned using domain-specific decision boundaries. This method maximizes the relevant information in the historical scene, solves the problem of inconsistent image classification in the current scene, and improves the migration efficiency from the history to the current disaster scene. The proposed approach is validated by two challenging multi-source transfer tasks using the post-disaster hurricane datasets. The average accuracy rate of 83.3% for the two tasks is achieved, obtaining an improvement of 0.9% compared with the state-of-the-art methods.
Keywords
Introduction
Since the 21st century, natural disasters have claimed many lives and caused damage to many people worldwide [1]. The large damage caused by disasters is mainly manifested in the damage to buildings. The relevant information on buildings can evaluate the location and quantity distribution of the affected population and can guide rescuers to where they need to be in a short time [2]. The traditional damage assessment of buildings requires professional field surveys [3]. This process is time-consuming and labor-intensive, which is not desirable. However, the remote sensing data obtained by electronic equipment, such as radar, are very useful. Electronic equipment can obtain accurate images of building damage in a short time and has the characteristics of low cost and wide field of view [4]. Hence, the automatic identification of damaged buildings based on remote sensing data is the current mainstream method [5, 6].
Owing to its powerful feature learning ability, deep learning has gradually become a research hotspot in remote sensing image classification [7]. In addition, the detection of building damage after a disaster has gradually transitioned from handcrafted features combined with shallow machine learning methods to those based on convolutional neural networks (CNN) methods. Cao et al. [8] used a Lenet-5-inspired CNN to classify the images of post-hurricane buildings extracted from satellite images into two categories, damaged or undamaged. Ji et al. [9] optimized the data balancing strategy, using CNN to improve the overall accuracy of detecting collapsed buildings from satellite images. Duarte et al. [10] also improved the overall satellite image classification accuracy of damaged buildings using convolutional residual connections with extended receptive fields. However, CNN-based deep learning models have complex structures and large-scale parameters and require several labeled samples to ensure good performance [11]. However, in the post-disaster detection of damaged buildings, the image content is complex, and the buildings are in various forms. Generating several labeled samples containing various situations only from the current post-disaster images is difficult and cannot meet the training requirements [12].
The emergence of transfer learning can overcome the above difficulties. Researchers have made preliminary explorations and attempts by using post-disaster images of historical scenes to make up for the shortage of training samples during current disasters. Although these methods [10, 14] have made some progress, they fail to consider the differences among different post-disaster scenarios, greatly affecting the transfer efficiency. This study solves this problem by using a domain adaptation method to reduce the differences among domains. In addition, many historical post-disaster scenarios data are available [15], which can help transfer learning. Multi-source processing is a common and straightforward approach to merge all-source domains into one source domain and align the distributions, such as the traditional single-source domain adaptation method. However, owing to data expansion, these methods do not improve performance significantly [16]. Therefore, finding a great way to fully utilize multiple source domains is necessary.
This study proposes a multi-source variational domain adaptation (MVDA) method to address the above problems. The first stage is to align domain-specific distributions, map each pair of source and target domains to different feature spaces, and align domain-specific distributions to learn multiple domain-invariant representations. Then, domain-specific classifiers are trained using multiple domain-invariant representations. The second stage is to align domain-specific classifiers. The target samples near the domain-specific decision boundary predicted by different classifiers may get different labels [17]. Therefore, the classifier outputs of the target samples are aligned with domain-specific decision boundaries.
The research contributions of this study are summarized as follows: (1) An unsupervised MVDA method is proposed. This method utilizes a Variational AutoEncoder (VAE) to model the target domain and aligns the feature distributions of the target domain and each source domain separately. In addition, the method exploits a Gaussian mixture model and the Bayesian formula to obtain the decision boundary of the target domain samples and weight the output of each source domain classifier to obtain the prediction of the target domain samples. (2) The MVDA method is applied to post-disaster building damage detection, and relevant experiments are carried out on the hurricane data set to verify the effectiveness of the model.
Related work
Traditional domain adaptation methods mainly focus on a single-source scenario, assuming that the labeled source data come from the same distribution. In practice, however, labeled data can be collected from multiple source domains with different distributions. However, as varying degrees of inter-domain differences also exist, the above domain adaptation method cannot be used simply by combining all-source domains into a single-source domain. Early multi-source domain adaptation (MDA) methods mainly focus on shallow models [31], learn latent feature spaces from different domains [32], or combine pre-trained source classifiers [33]. More recently, the focus of MDA has shifted to deep learning architectures. Mansour et al. [34] assumed that the target distribution can be approximated by mixing source distributions. Hence, weighted combinations of source classifiers are widely used for MDA. Furthermore, tight cross-domain generalization bounds and precise domain dissimilarity measures can provide an intuitive basis for deriving efficient MDA algorithms. Reference [35] derived a new bound using DC programming and computed precise combined weights. Reference [36] extended the generalization of the pioneering theoretical model to multiple sources in the classification and regression setting. In addition to the domain difference between the target and each source, Li et al. [37] also considered the relationship between paired sources and derived a tight bound on the weighted multi-source difference, based on which one can pick additional relevant source domains. The above works focused on extracting common domain invariant representations for all domains; however, this learning style is difficult.
Training a deep model with good performance is difficult owing to the small number of labeled samples after the disaster. Hence, the idea of transfer learning can be used to solve the problem, that is, using the post-disaster images taken in the history to train the model and then perform the classification task under the current disaster to complete the damage to the building assessment of the situation. For example, Andugula et al. [13] used pre-disaster images to pre-train the classifier and then used a small number of post-disaster labeled samples to fine-tune the classifier to improve the classification accuracy. However, such a migration strategy does not consider the differences among different scenarios and does not take measures to reduce the differences, resulting in unsatisfactory classification accuracy. The above-mentioned domain adaptation method brings inspiration to solve this problem and can be used as an effective means to reduce the differences among various fields. Furthermore, traditional domain adaptation methods mainly focus on single-source scenarios, assuming that the labeled source data come from the same distribution. However, in practical post-disaster scenarios, labeled data can be collected from multiple source domains with different distributions. Simply combining multiple source domains into a single-source domain and directly using a domain adaptation method with a single-source domain may lead to suboptimal solutions because data from different sources interfere with one another during learning. Therefore, this study chooses the extended MDA method and improves its current shortcomings. The study proposes the MVDA algorithm to finally complete the post-disaster building damage detection. The method is divided into two stages. First, each pair of source and target domains are mapped to different feature spaces to extract multiple domain-invariant representations; then, the output of each source classifier for the target sample is analyzed by using the decision boundary of a specific domain.
Methodology
In the multi-source unsupervised domain adaptation method, N different source distributions are included, denoted as
The MVDA algorithm proposed in this study makes up for the shortcomings of the above MDA methods. This algorithm extracts domain-invariant representations for each pair of source and target domains. Then, the MVDA algorithm uses the decision boundary of a specific domain to align the label predictions of the source classifiers for the target samples. Specifically, this algorithm consists of two stages, and Fig. 1 shows its frame structure.
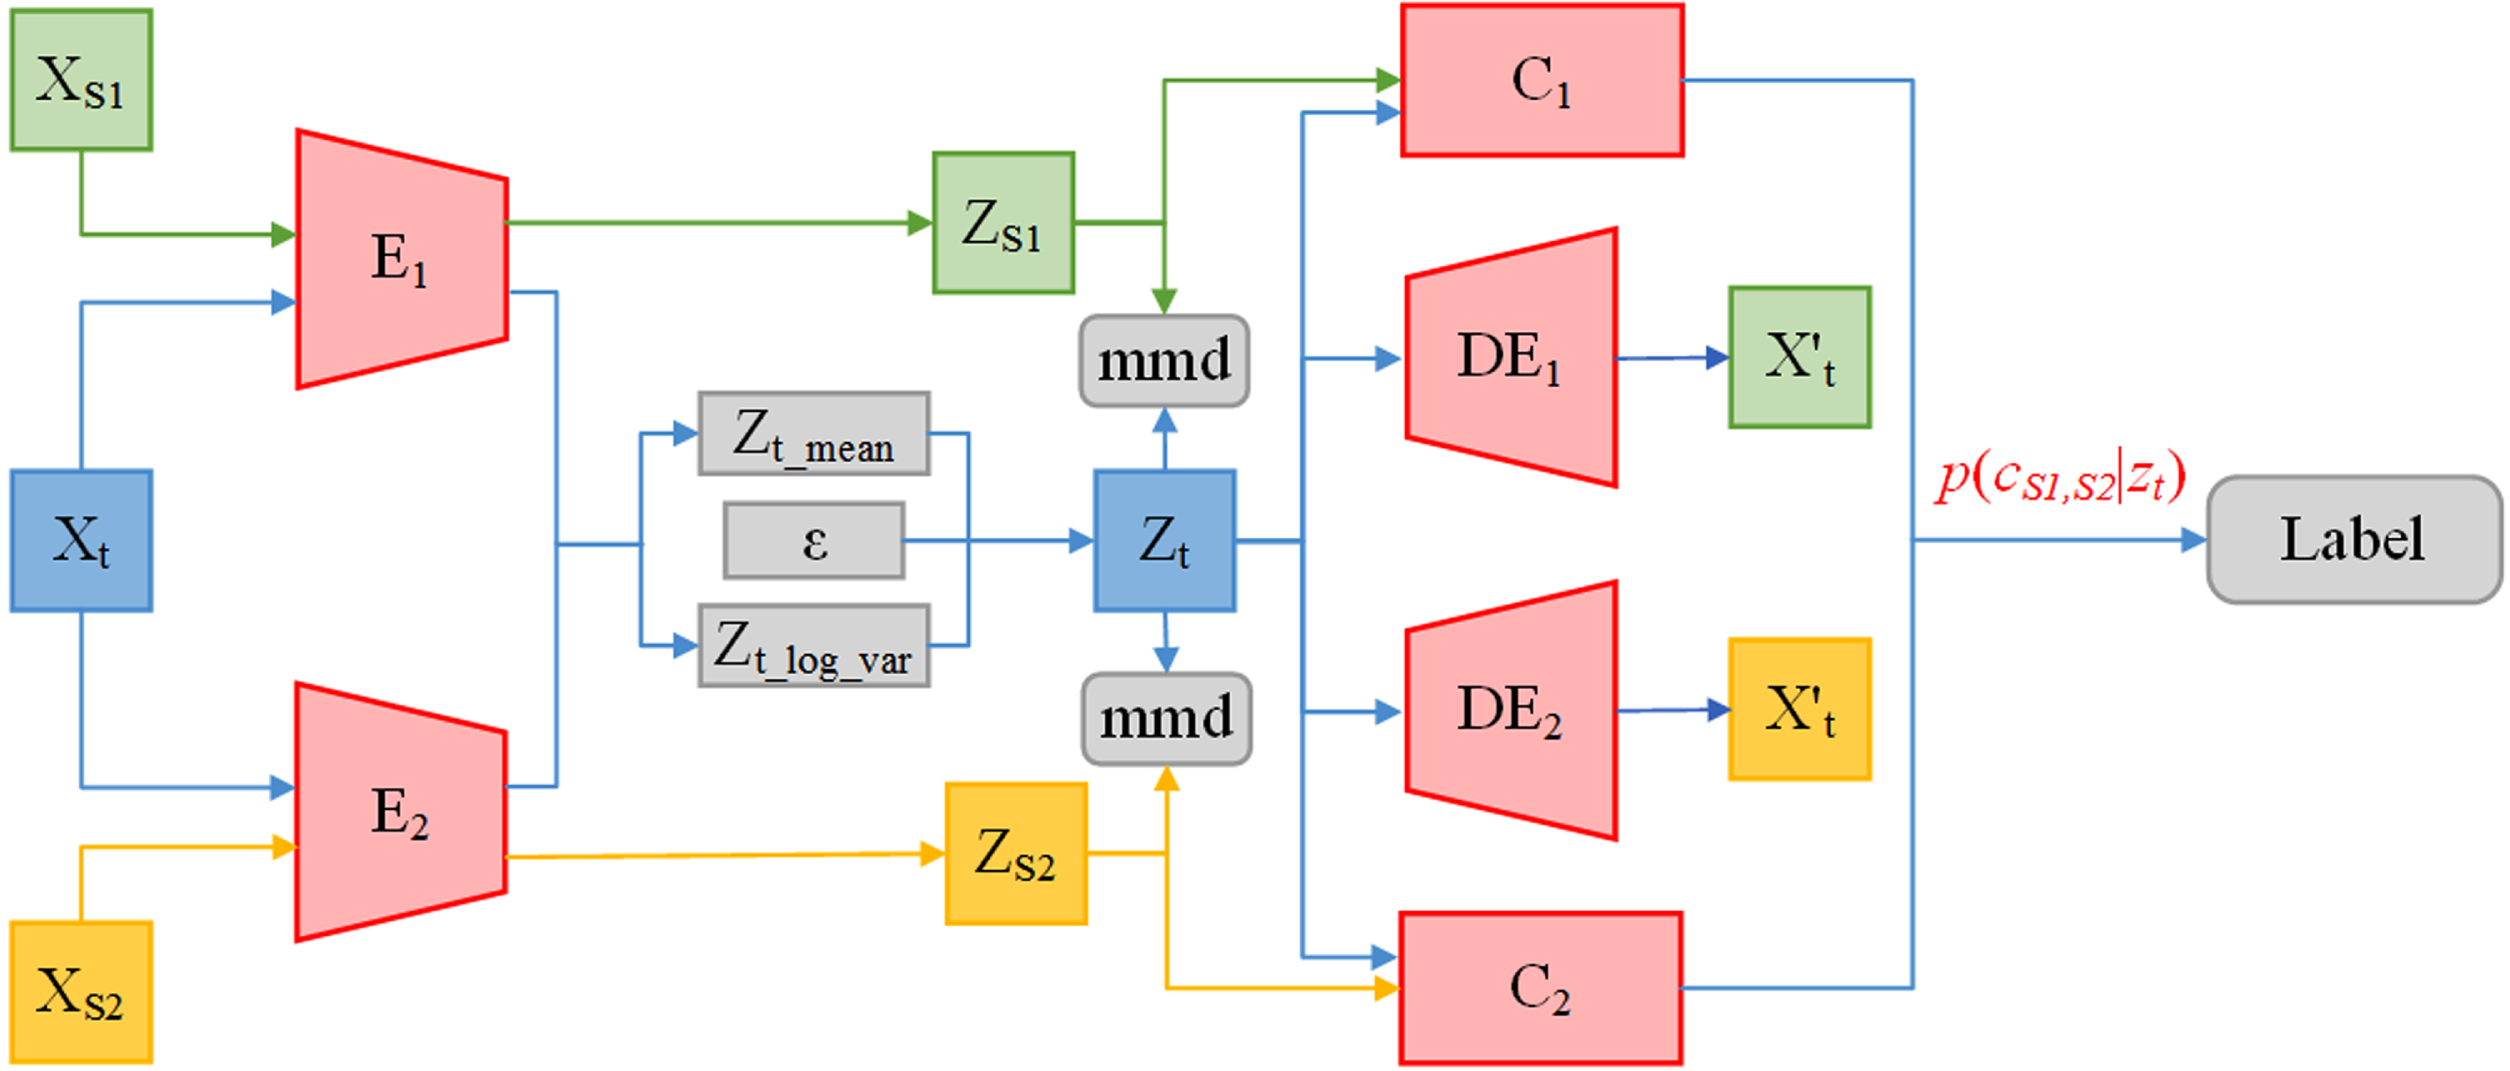
MVDA algorithm architecture. In the first stage, encoder E is constantly affected by classification loss, maximum mean difference loss, and reconstruction loss during the training process. Ultimately, the source domain feature Zs extracted by encoder E and the mean Z t _ mean and variance Z t _ log _ var output that can represent the distribution of target domain features will become increasingly accurate. In the second stage, the results of two classifiers are combined with the weight p (cS1,S2|z t ) to output the final label.
As shown in Fig. 1, E1 and E2 are encoders for source domains 1 and 2, respectively, to extract deep features of the image. Zs1 and Zs2 are the features extracted by the encoder. C1 and C2 are classifiers for two source domains, respectively, to classify images in source domains 1 and 2. DE1 and DE2 are decoders for two source domains used to reconstruct images with different source domain styles for target domain samples.
The first stage mainly aligns the domain-specific distributions of each pair of source and target domains. Usually, multiple domain-invariant representations for each pair of source and target domains are extracted by mapping each of them to a specific feature space and matching its distribution. To achieve this, weights are not shared between these networks. Furthermore, we use a VAE to reconstruct target domain features to learn domain-invariant representations to align each pair of source and target domains, which can also provide more useful information for cross-domain target recognition.
Each source learns a domain-specific classifier. The output of domain-specific classifiers is aligned in the second stage to ensure consistent label information predicted by different classifiers for target samples close to the domain-specific decision boundary. However, most of the current methods are highly complicated for this step. In this study, the probability distribution of the target sample is calculated using the Bayesian formula to determine the weight applied to the classifier, which effectively solves the above problem.
In this study, a common network E k (·) is used to extract common representations for all domains, mapping images from the original feature space to a common feature space. Furthermore, each pair of source and target domain data needs to be mapped into their respective common feature spaces. Given batch image x sk from the source domain (X sk , Y sk ) and batch image x t from target domain X t , source domain features E k (x sk ) and target domain features E k (x t ) are extracted through N non-shared domain-specific networks.
For the processing of target domain data, this study introduces a VAE model. We consider E
k
(·) as an inference network, infer the variational inference of the target domain data x
t
, and then generate the variational probability distribution q
φ
(z
t
|x
t
) of the latent variable Z
t
. Here, q
φ
(z
t
|x
t
) satisfies the Gaussian distribution, so the mean Z
t
_ mean and variance z
t
_ log _ var of the Gaussian distribution are the real output of the E
k
(·) network. Through the re-parameterization technique, formula (3-1) is used to obtain the hidden variable z
t
, where ɛ is the standard Gaussian distribution.
The generative network DE
k
(·) takes the latent variable Z
t
as the input, and the output is the probability distribution p
θ
(x
t
|z
t
) of the target data. The generated data are similar to the input data only when q
φ
(z
t
|x
t
) is close to the real posterior probability p
θ
(z
t
|x
t
), that is, the reconstruction loss
This study also chooses MMD as the criterion to measure the distance between two domains to reduce the inter-domain distribution differences to achieve the alignment of domain-specific distributions in the first stage. MMD is a two-sample test that rejects or accepts the null hypothesis p = q based on the observed sample. The basic idea is that if the generating distributions are the same, then all statistics are the same. Formally, MMD is defined as follows:
A domain-invariant representation for each pair of source and target can be learned by minimizing
The classifier C consists of N source domain predictors
The source domain data can be accurately classified by minimizing
In the second stage of the proposed MVDA algorithm, the target samples near the class boundary are easily misclassified by the classifier learned from the source samples. Classifiers are trained on different source domains. Thus, their predictions on target samples, particularly those near class boundaries, may diverge. In theory, the same target samples predicted by different classifiers should obtain consistent results. Therefore, the goal of the second alignment stage is to minimize the differences among all classifiers, as shown in Fig. 2.
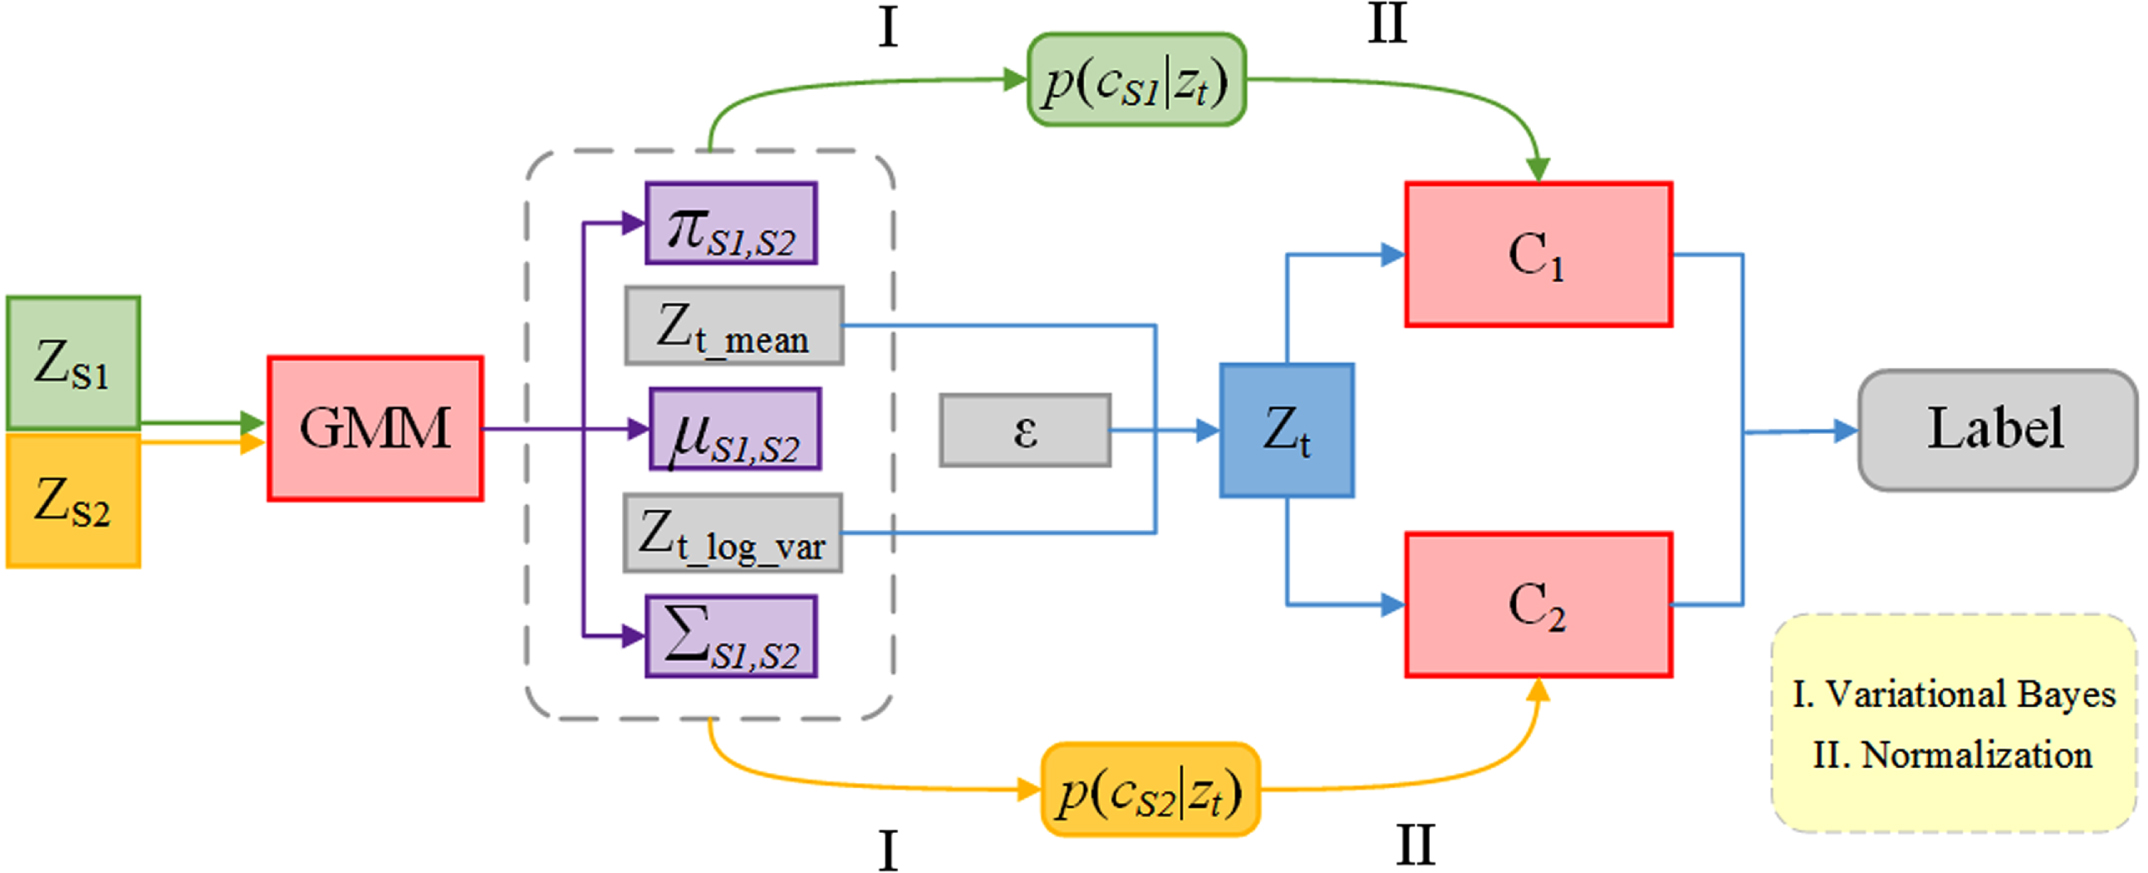
Schematic diagram of the classifier alignment stage. The final prediction result is output by combining the predicted results of two classifiers C1 and C2 with the weights obtained from GMM.
As shown in Fig. 2, ZS1 and ZS2 are the output results of E1 and E2 extracted from the source domain in Fig. 1. After modeling with a Gaussian mixture model, weights πs1, s2, means μs1, s2, and variances rmSigmas1, s2 can be obtained. The mean zt_mean and variance zt_var are obtained by extracting features from the target domain using encoders 1 and 2 trained in the first stage. We use Gaussian mixture models (GMM) for the two source domains, combined with the mean zt_mean and variance zt_var of the target domain features extracted by encoders 1 and 2, according to the Bayesian formula (3-6) to calculate the probability distribution that the target domain samples belong to a certain source domain:
After p (cS1|z
t
) and p (cS2|z
t
) are obtained, they are respectively applied as weights to the classification results of the two classifiers to determine the final category of the target domain samples. The probability value P of the final category is obtained from formula (3-7), where C1 and P2 are the probability values predicted by classifiers C1 and C2 for the target domain samples.
The loss function of our proposed algorithm consists of three parts: classification loss
Datasets
The post-disaster building damage assessment includes two stages: image segmentation and image classification. In the first stage, the original image is segmented to generate training and test samples. In the second stage, the MVDA model is trained using the training samples, and then, the test samples are divided into different classes. This section uses the hurricane Sandy, Irma, and Maria datasets to verify the classification performance of the proposed method. In 2012, Hurricane Sandy [38] caused varying degrees of damage to buildings in most parts of the United States. Shortly after Hurricane Sandy, a team from Drexel University used an aerial camera to capture 10,000 RGB images of the New Jersey coastline at their original size of 1920×1080 pixels. In September 2017, when Hurricanes Irma [39] and Maria [40] hit Florida and Puerto Rico, respectively, NOAA collected post-disaster aerial images with an original size of 18681×18681 pixels. The Sandy, Irma, and Maria dataset images were converted into 200×200 pixel image patches using a Simple Linear Iterative Clustering (SLIC) [41] algorithm. In the following experiments, two experimental tasks were established using different combinations of three datasets: (1) using datasets Sandy and Irma as the source domain and dataset Maria as the target domain; (2) using dataset Sandy and Maria as the source domain, using the dataset Irma as the target domain.
Each dataset contains 10,000 initial aerial images, which are processed into 200×200 pixel blocks using the SLIC algorithm. Each dataset includes the same three categories: undamaged buildings, damaged buildings, and other objects. The undamaged category represents buildings that have not changed in appearance after the disaster. The damaged category includes buildings that are completely or partially damaged. The last category is the images that do not include buildings, most of which are roads, trees, or other objects. Figure 3 shows parts of the samples from the three datasets.
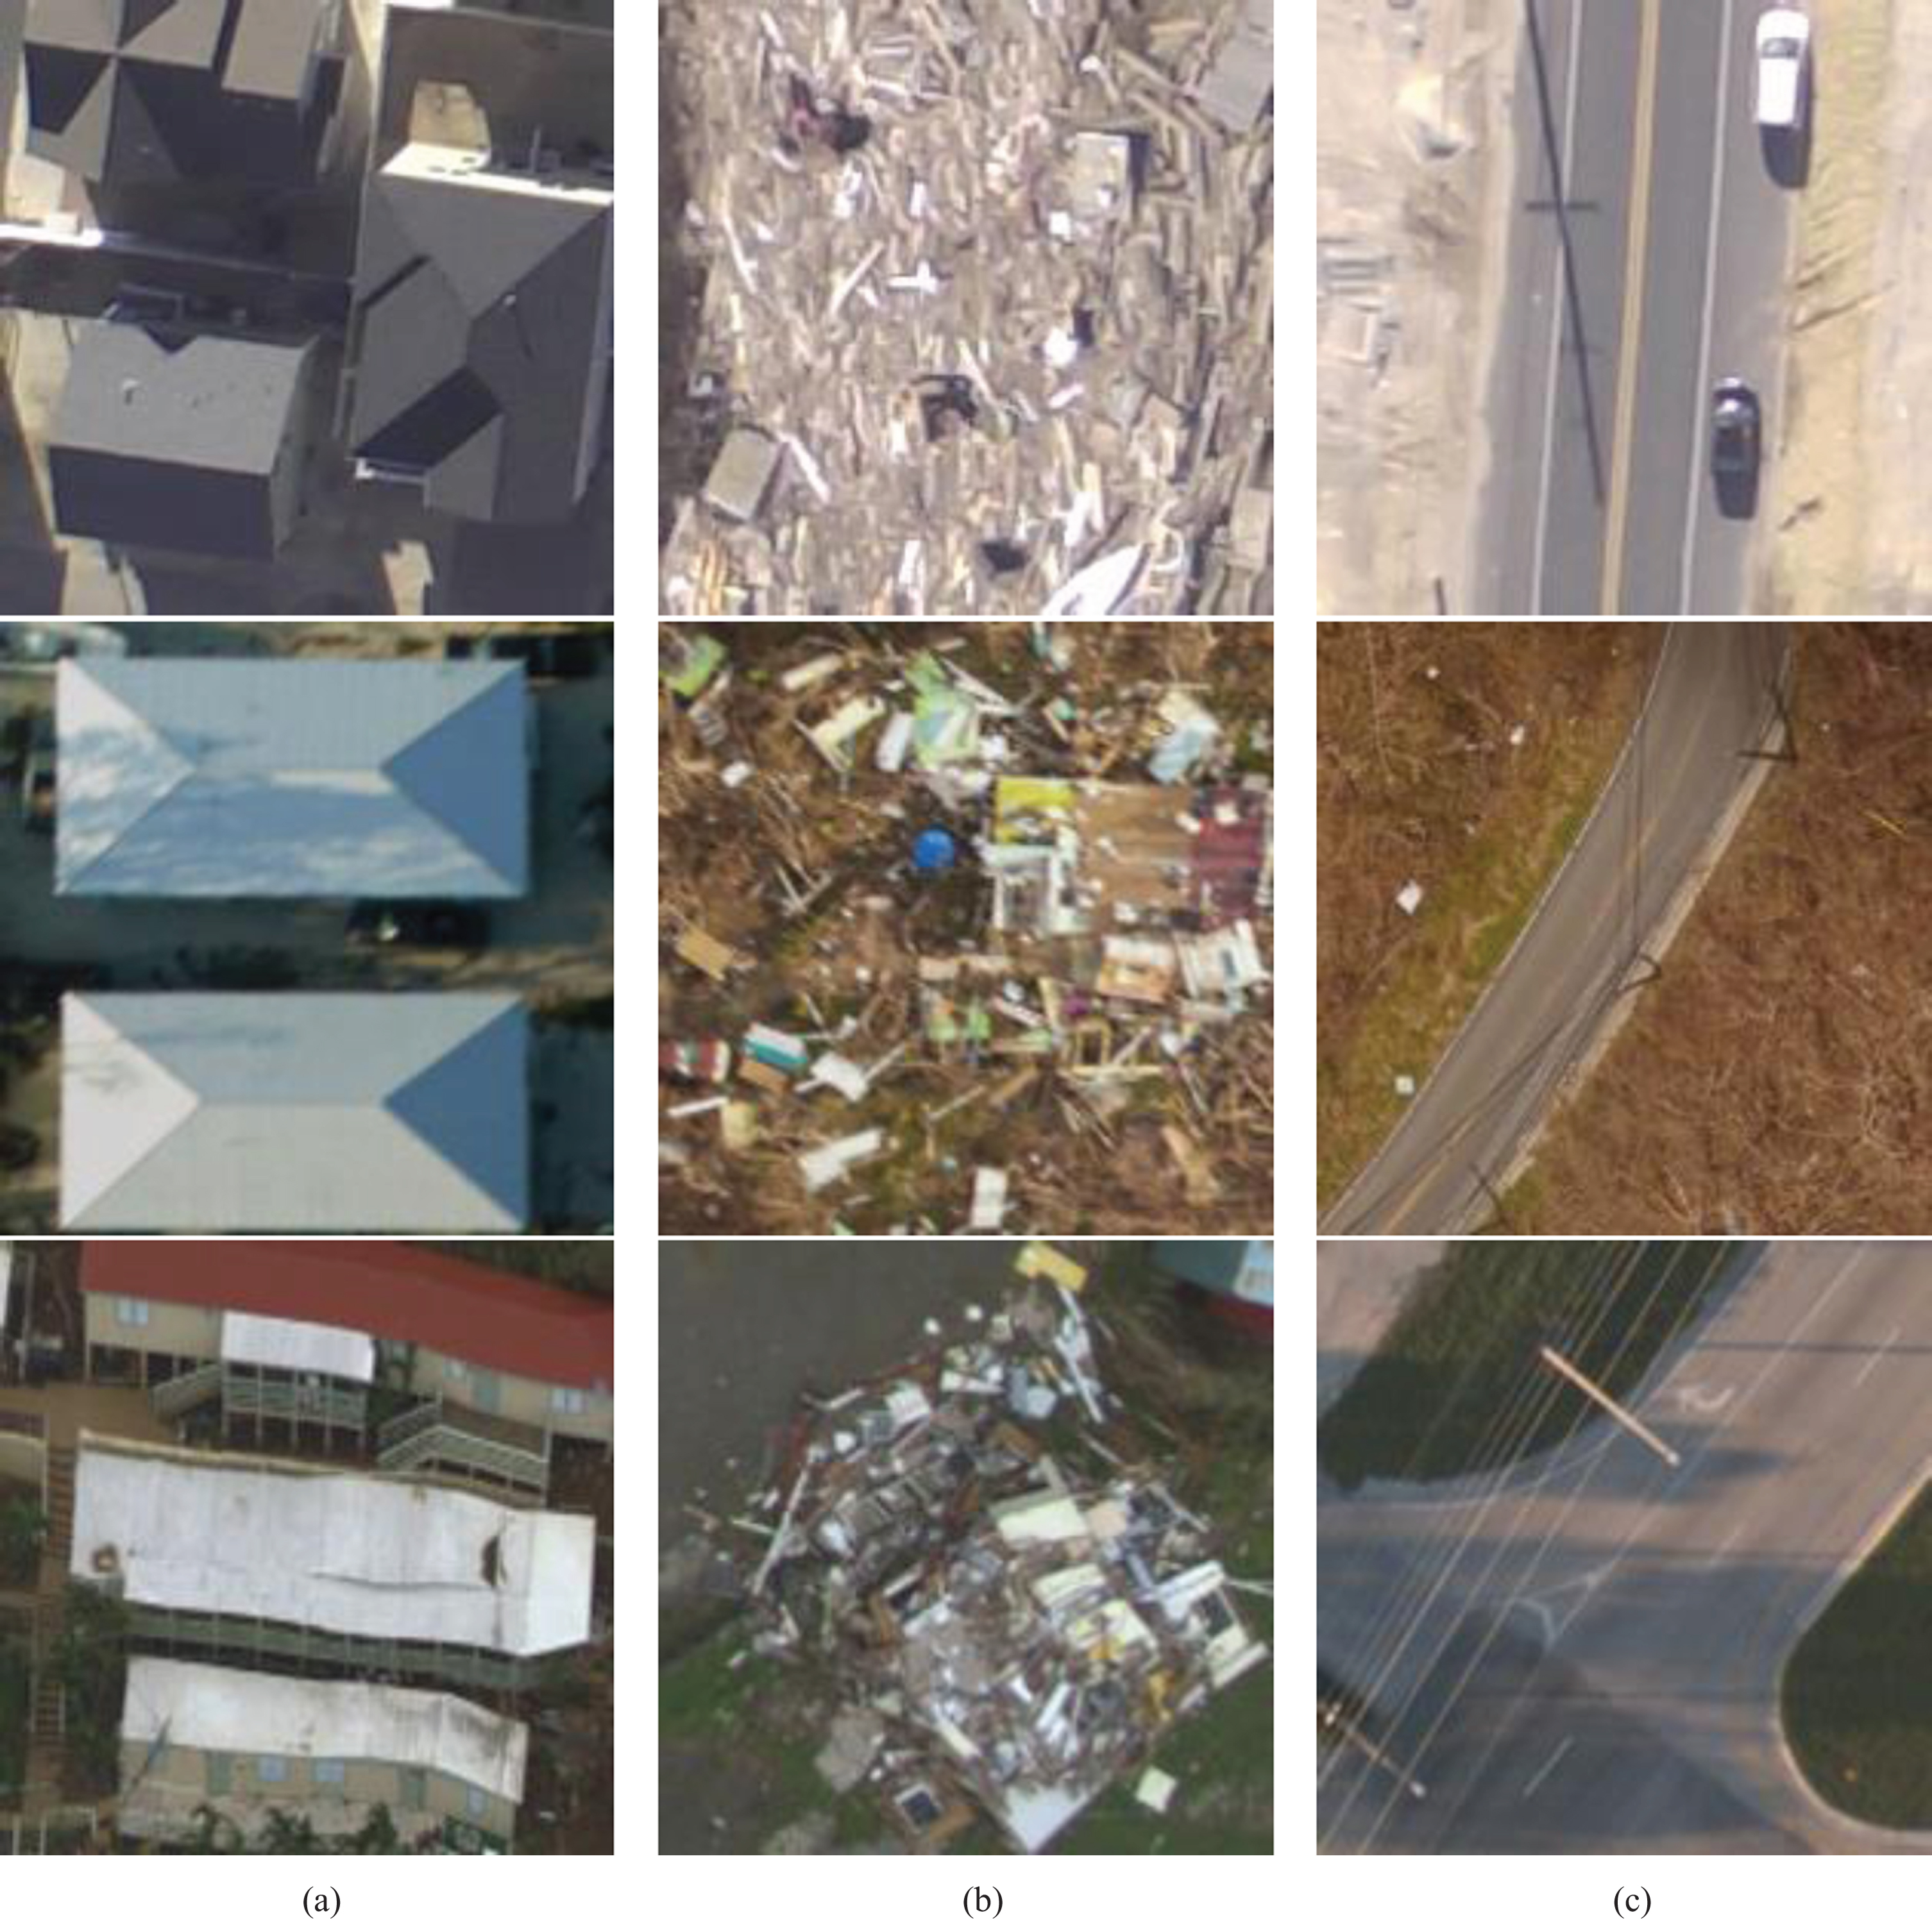
Sample examples from three datasets. (a) undamaged, (b) damaged, (c) other objects.
In this study, all experiments are conducted using Python 0.4.1 on the Windows system, and the graphics card is NVIDIA GTX 1080.
Our goal is to train a classifier that can accurately predict the target domain only through image data from the source domain. Therefore, we use all labeled source domain data and all unlabeled target domain data. Our task, network architecture, and parameters for training are summarized below.
For all tasks, we use ResNet-50 [47] as the backbone network. The domain adaptation process consists of two stages. In stage 1, the training encoder, classifier, and decoder output the mean zt_mean and the variance zt_log_var using Formula (3–7) to classify target domain images in stage 2.
Stage 1: The structure of the two lines in source domains 1 and 2, as shown in Fig. 1, is the same, but they do not share weights. Train encoders can extract common features from source and target domains, classifiers can accurately classify source domain features, and decoders can use target domain features to reconstruct target domain images. The encoders all use the original Resnet-50 structure as the backbone network, which is used to extract image features. After the Resnet-50 structure in the encoder, two linear structures do not change the size of the dimensions. One linear is used to output the mean representing the probability distribution of target domain features, and the other linear is used to output the variance representing the probability distribution of target domain features. Figure 4 shows a classifier for three classification tasks and a decoder after the encoder structure. Among them, the classifier classifies the source domain image based on the source domain features extracted from the backbone network. The decoder uses the target domain image features extracted by the backbone network to reconstruct the target domain. The entire model uses the Adam optimizer. Although source domains 1 and 2 do not share weights, the parameter settings of the optimizer are the same. The learning rate is 0.0001, and in the optimizer, the value of β1 is 0.5, the value of β2 is 0.999, and the batch size is 8.
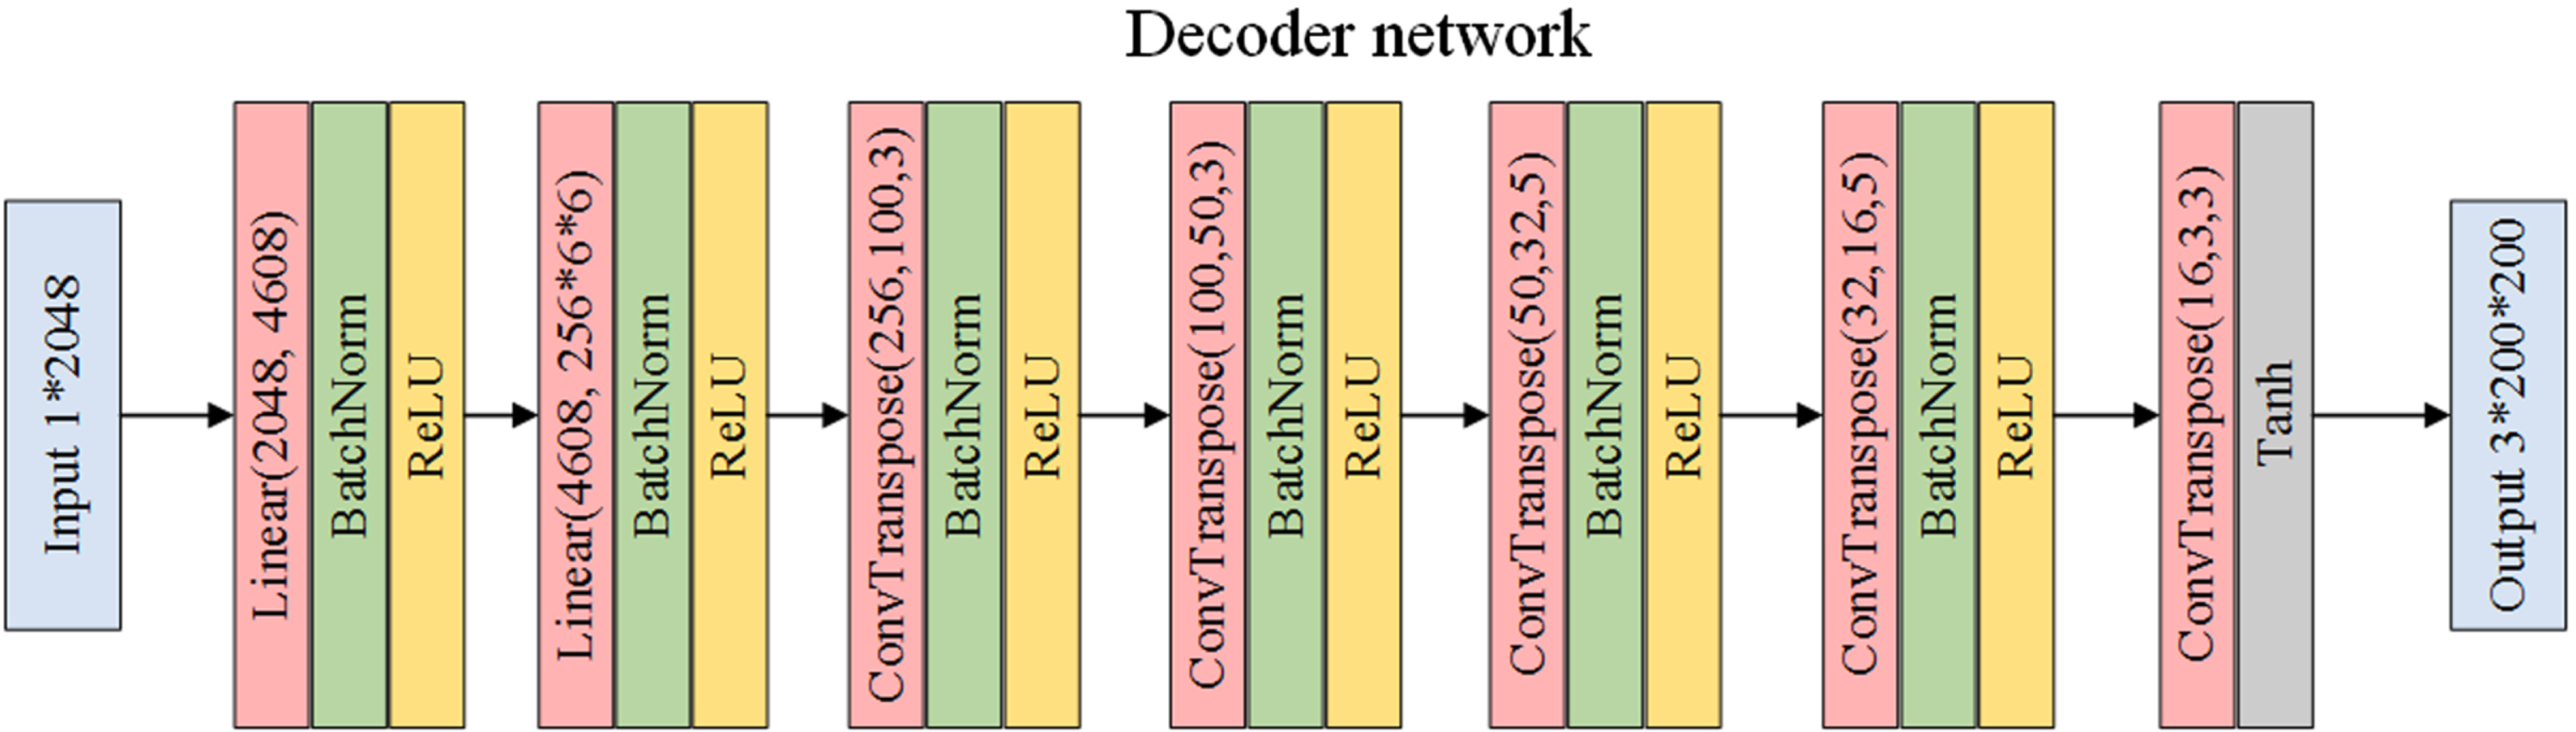
Network structure of decoders 1 and 2.
Stage 2: The images of the three categories (i.e., undamaged, damaged, and others) of the source domain dataset are mixed, and the two source domains are regarded as different categories. Then, we calculate the class probability p (cS1|z t ) and p (cS2|z t ) of the target domain feature belonging to the two source domains according to the Bayesian formula (3–7) to determine the weight of each classifier.
In the following experiments, two experimental tasks were established using different combinations of three datasets: (1) using dataset Sandy and Irma as the source domain and dataset Maria as the target domain; (2) using dataset Sandy and Maria as the source domain, using the datasets Irma as the target domain.
Only a small amount of MDA work exists in post-disaster building damage detection. Five recently proposed MDA methods, namely, DCTN, MDMN, MDAN, M3SDA, and MADAN, were compared in this experiment to demonstrate the effectiveness of the proposed MVDA method. The DCTN method utilizes a classifier combined with confusion scores to first label the target sample with false labels and then update the encoder and classifier together with the target sample with false labels and the source domain sample. MDMN embeds all data into a shared feature space while learning which domains share strong statistical relationships. MDAN achieves domain adaptation by optimizing task-adaptive generalization boundaries. The M3SDA method utilizes moment matching for multi-source domain transfer learning, completing the MDA task by aligning the source domain with the target domain and simultaneously aligning the source domains with each other. MADAN attempts to solve the pixel-level alignment between sources and targets or the misalignment across different sources by using dynamic semantic information. These five methods all performed with an average accuracy of 84% in MDA tasks on the office dataset.
In addition, we introduced three single-source domain methods, namely, DAN [25], DRCN [30], and ADDA [29], for comparison to further demonstrate the effectiveness of the multi-source domain method. DAN measures the distance between two domains through maximum mean difference loss; DRCN verifies whether the model can correctly extract common features among different sources by reconstructing the target domain image; ADDA is a domain adaptation classical method that introduces adversarial thinking. These three methods all performed well on the domain-adapted classic dataset Office-31, with ADDA performing the best, reaching an average level of 83.0% among all single-source migration tasks in Office-31. Due to the execution of these methods in a single-source setting, we need to verify whether the multi-source method is superior to the single-source method. Therefore, we have introduced three MDA criteria: (1) single best: displays the best single-source migration results across multiple source domains; (2) source combine: all-source domains are combined to form the traditional single-source domain and target domain settings; (3) multi-source: the results of the MDA method. The first criterion proves whether multiple source domains are valuable. Then, the second criterion evaluates whether the best single-source domain method can be further improved by introducing other source domains. The third criterion demonstrates the effectiveness of the proposed MVDA method.
Experimental results and analysis
This study uses the above hurricane data sets to conduct MVDA and each reference experiment and sets up two migration tasks. Table 1 shows the final experimental results.
Comparison of the accuracy (%) between MVDA and the current mainstream\\ domain adaptation algorithms
Comparison of the accuracy (%) between MVDA and the current mainstream\\ domain adaptation algorithms
Resnet-50 is the base network used by each method in Table 1. Among them, DAN, DRCN, and ADDA are the domain adaptation methods for single-source and target domains. In multi-source domain tasks, owing to the different collection methods among different sources, significant differences exist in the sample data distribution among different sources. During the training process, data of the same type with significant differences in data distribution will interfere with one another. Therefore, single-source domain methods are generally not as effective as multi-source domain methods in tasks with multiple sources.
Table 1 shows the following: (1) The result of source combine is better than single best, which indicates that combining all-source domains into a single-source domain is helpful for most transfer tasks owing to abundant data; (2) Comparing MVDA with DAN (source combine), the only difference is that MVDA extracts multiple domain-invariant representations in multiple feature spaces, whereas DAN extracts common domain-invariant representations in a common feature space. The results of MVDA outperform DAN, indicating that extracting a common domain-invariant representation for all domains is difficult. (3) MVDA outperforms all comparison methods in most multi-source transfer tasks, which verifies that considering domain-specific class boundaries to narrow the gap among all classifiers can help each classifier learn knowledge from other classifiers.
Figures 5 and 6 show the reconstructed image of the target domain obtained by decoding and reconstructing the target domain features after domain adaptation in the experiment of task 2 (Sandy+Maria⟶Irma). Among them, the reconstructed image of the target domain corresponds to the label of the original image one-to-one, and the style is similar to that of the source domain image. The reason is that the target domain features have already approached the source domain features after domain adaptation, and the classifiers pre-trained in the source domain can be used to perform image classification tasks in the target domain.
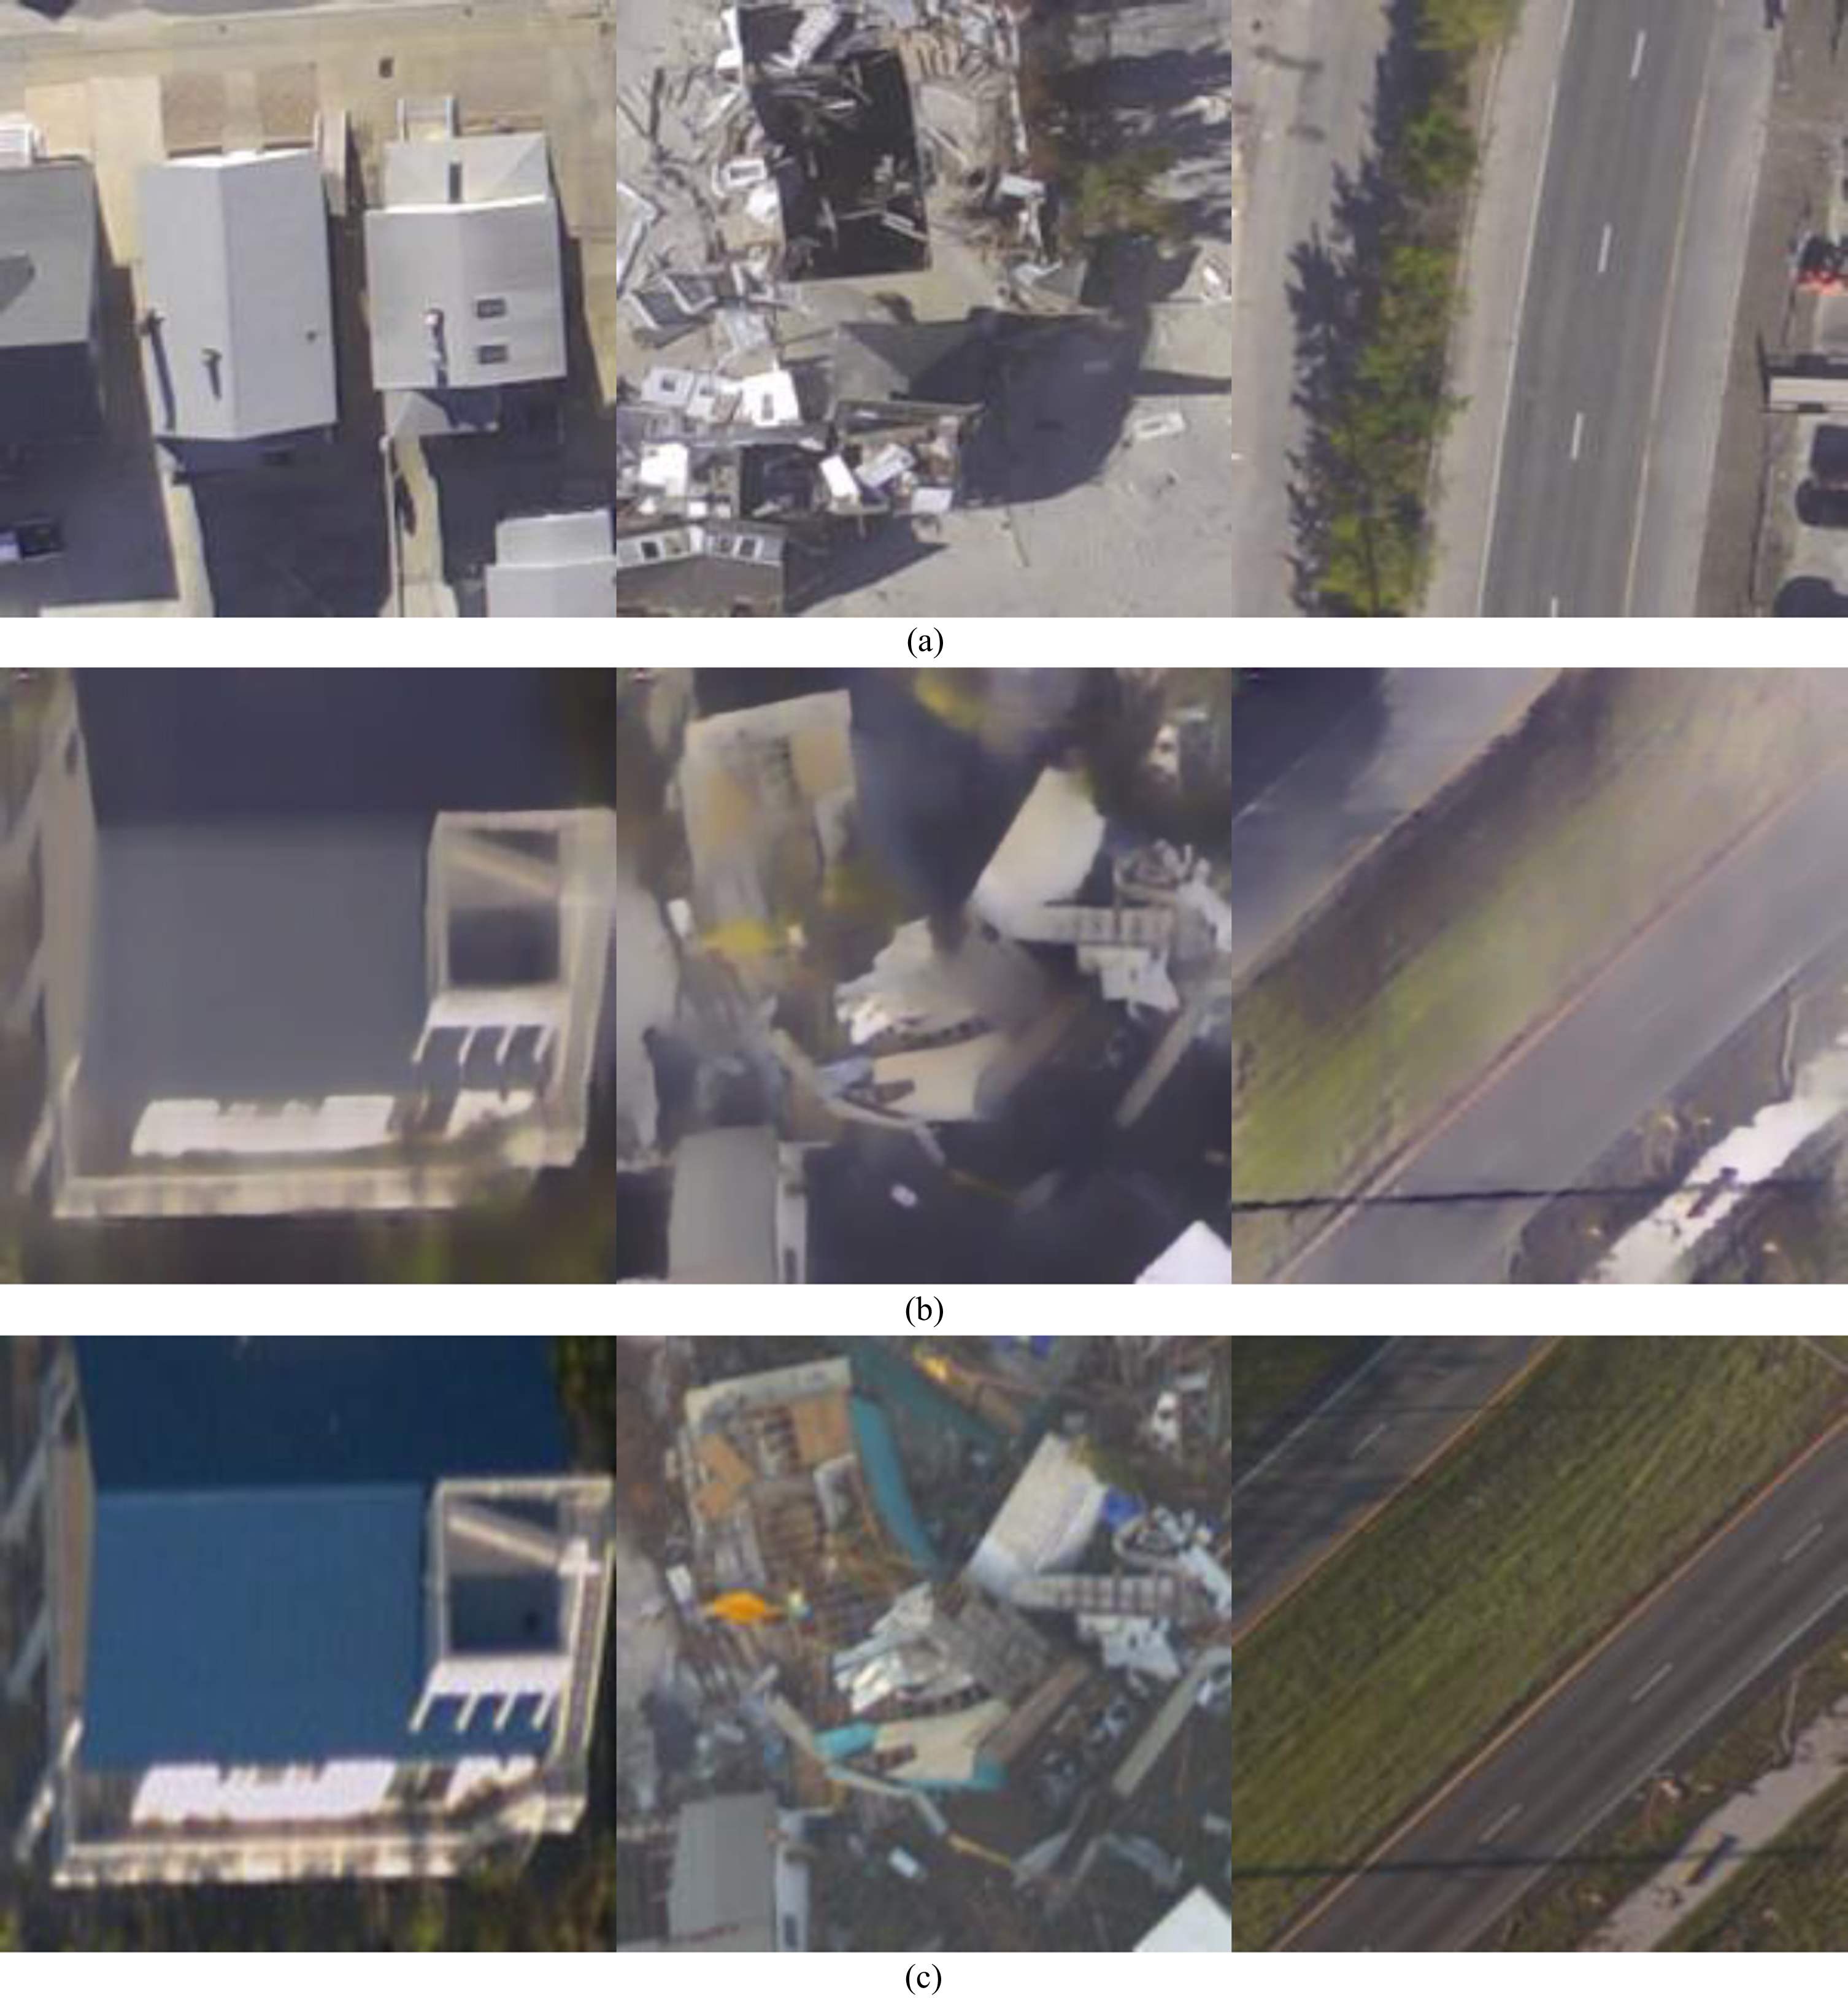
Comparison of source domain, target domain, and reconstructed images. Panel (a) shows the source domain Sandy image, (b) shows the target domain Irma reconstruction image, and (c) shows the target domain Irma image.
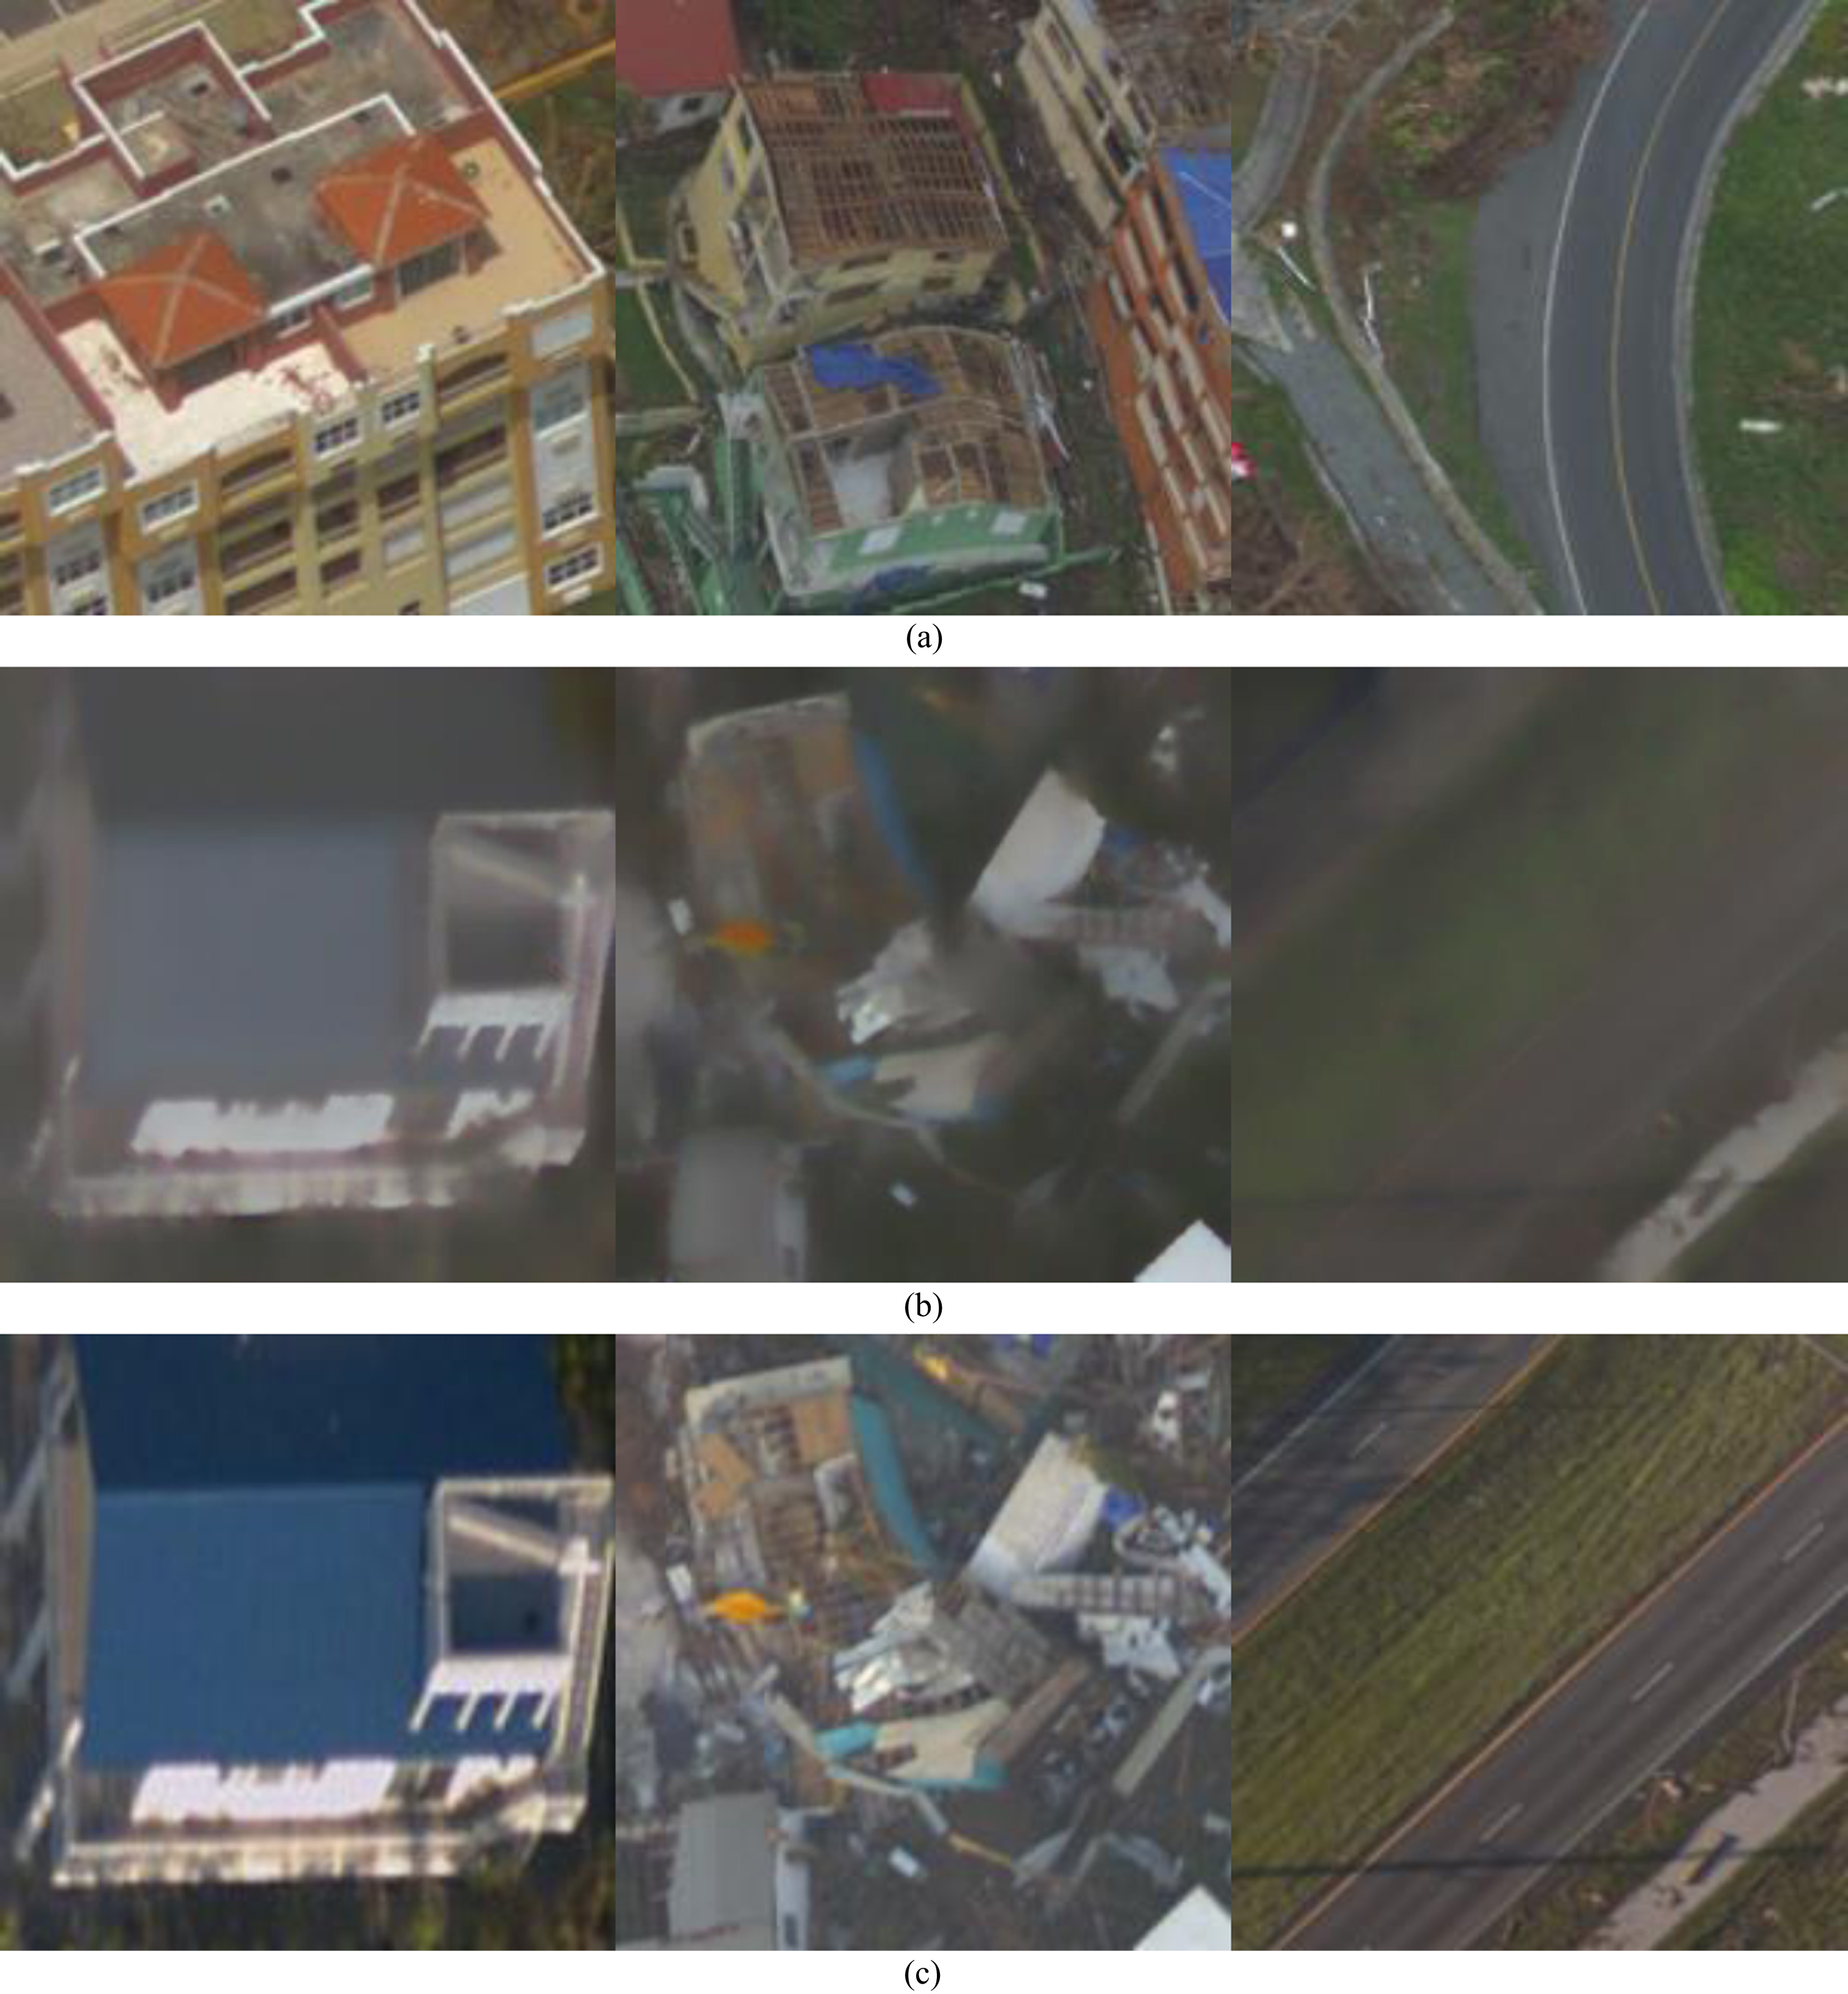
Comparison of source domain, target domain, and reconstructed images. Panel (a) shows the source domain Maria image, (b) shows the target domain Irma reconstructed image, and (c) shows the target domain Irma image.
In addition, this section conducts the following ablation experiments to evaluate several variants of the MVDA algorithm: (1) MVDAcls, which preserves the classifier loss and does not consider the MMD loss; (2) MVDAmmd, which preserves the MMD loss and does not consider the classifier loss; (3) MVDA, which considers classifier loss and MMD loss. Table 2 shows the comparison results. Experimental results show that MVDA outperforms all compared methods on multi-source transfer tasks, showing that multiple domain-invariant representations for each pair of source and target domains should be learned and domain-specific class boundaries must be considered.
Comparison of the accuracy (%) of the MVDA algorithm and its variants
Comparison of the accuracy (%) of the MVDA algorithm and its variants
This group of comparative experiments was set up to further verify the effectiveness of the MVDA classification method: (1) MVDAmmd + S1cls: Regardless of the classifier loss, the classifier pre-trained in the source domain is directly used to classify the target domain data after domain adaptation; (2) MVDAmmd + S2cls: The classifier loss is not considered, and the classifier pre-trained in the source domain is directly used to classify the target domain data after domain adaptation; (3) MVDA: The classifier loss is introduced while considering the MMD loss. Table 3 shows the comparison results. The experimental results show that the accuracy of using pre-trained classifier 1 or 2 as the target domain data classification is not as good as MVDA, and even a large gap exists. Introducing classifier loss can effectively narrow the gap among all classifiers to achieve classifier alignment.
Comparison of MVDA algorithm accuracy (%) with and without classifier loss
Relying solely on the data in Table 3 can only prove that our classification method is overall superior to a single classifier, but a good classifier should meet the standard of having a high true positive rate under the same false positive rate. The receiver operating characteristic and area under the curve (ROC-AUC) [48] line chart precisely reflects this standard, so we draw ROC line charts for three classification methods under two tasks to further validate the effectiveness of our method. As shown in Fig. 7, the red line represents the final classification results of our proposed MVDA method, the green line corresponds to the results of MVDAmmd + S1cls in Table 3, and the blue line corresponds to the results of MVDAmmd + S2cls in Table 3.
The results in Fig. 7 indicate that our classification method is effective.
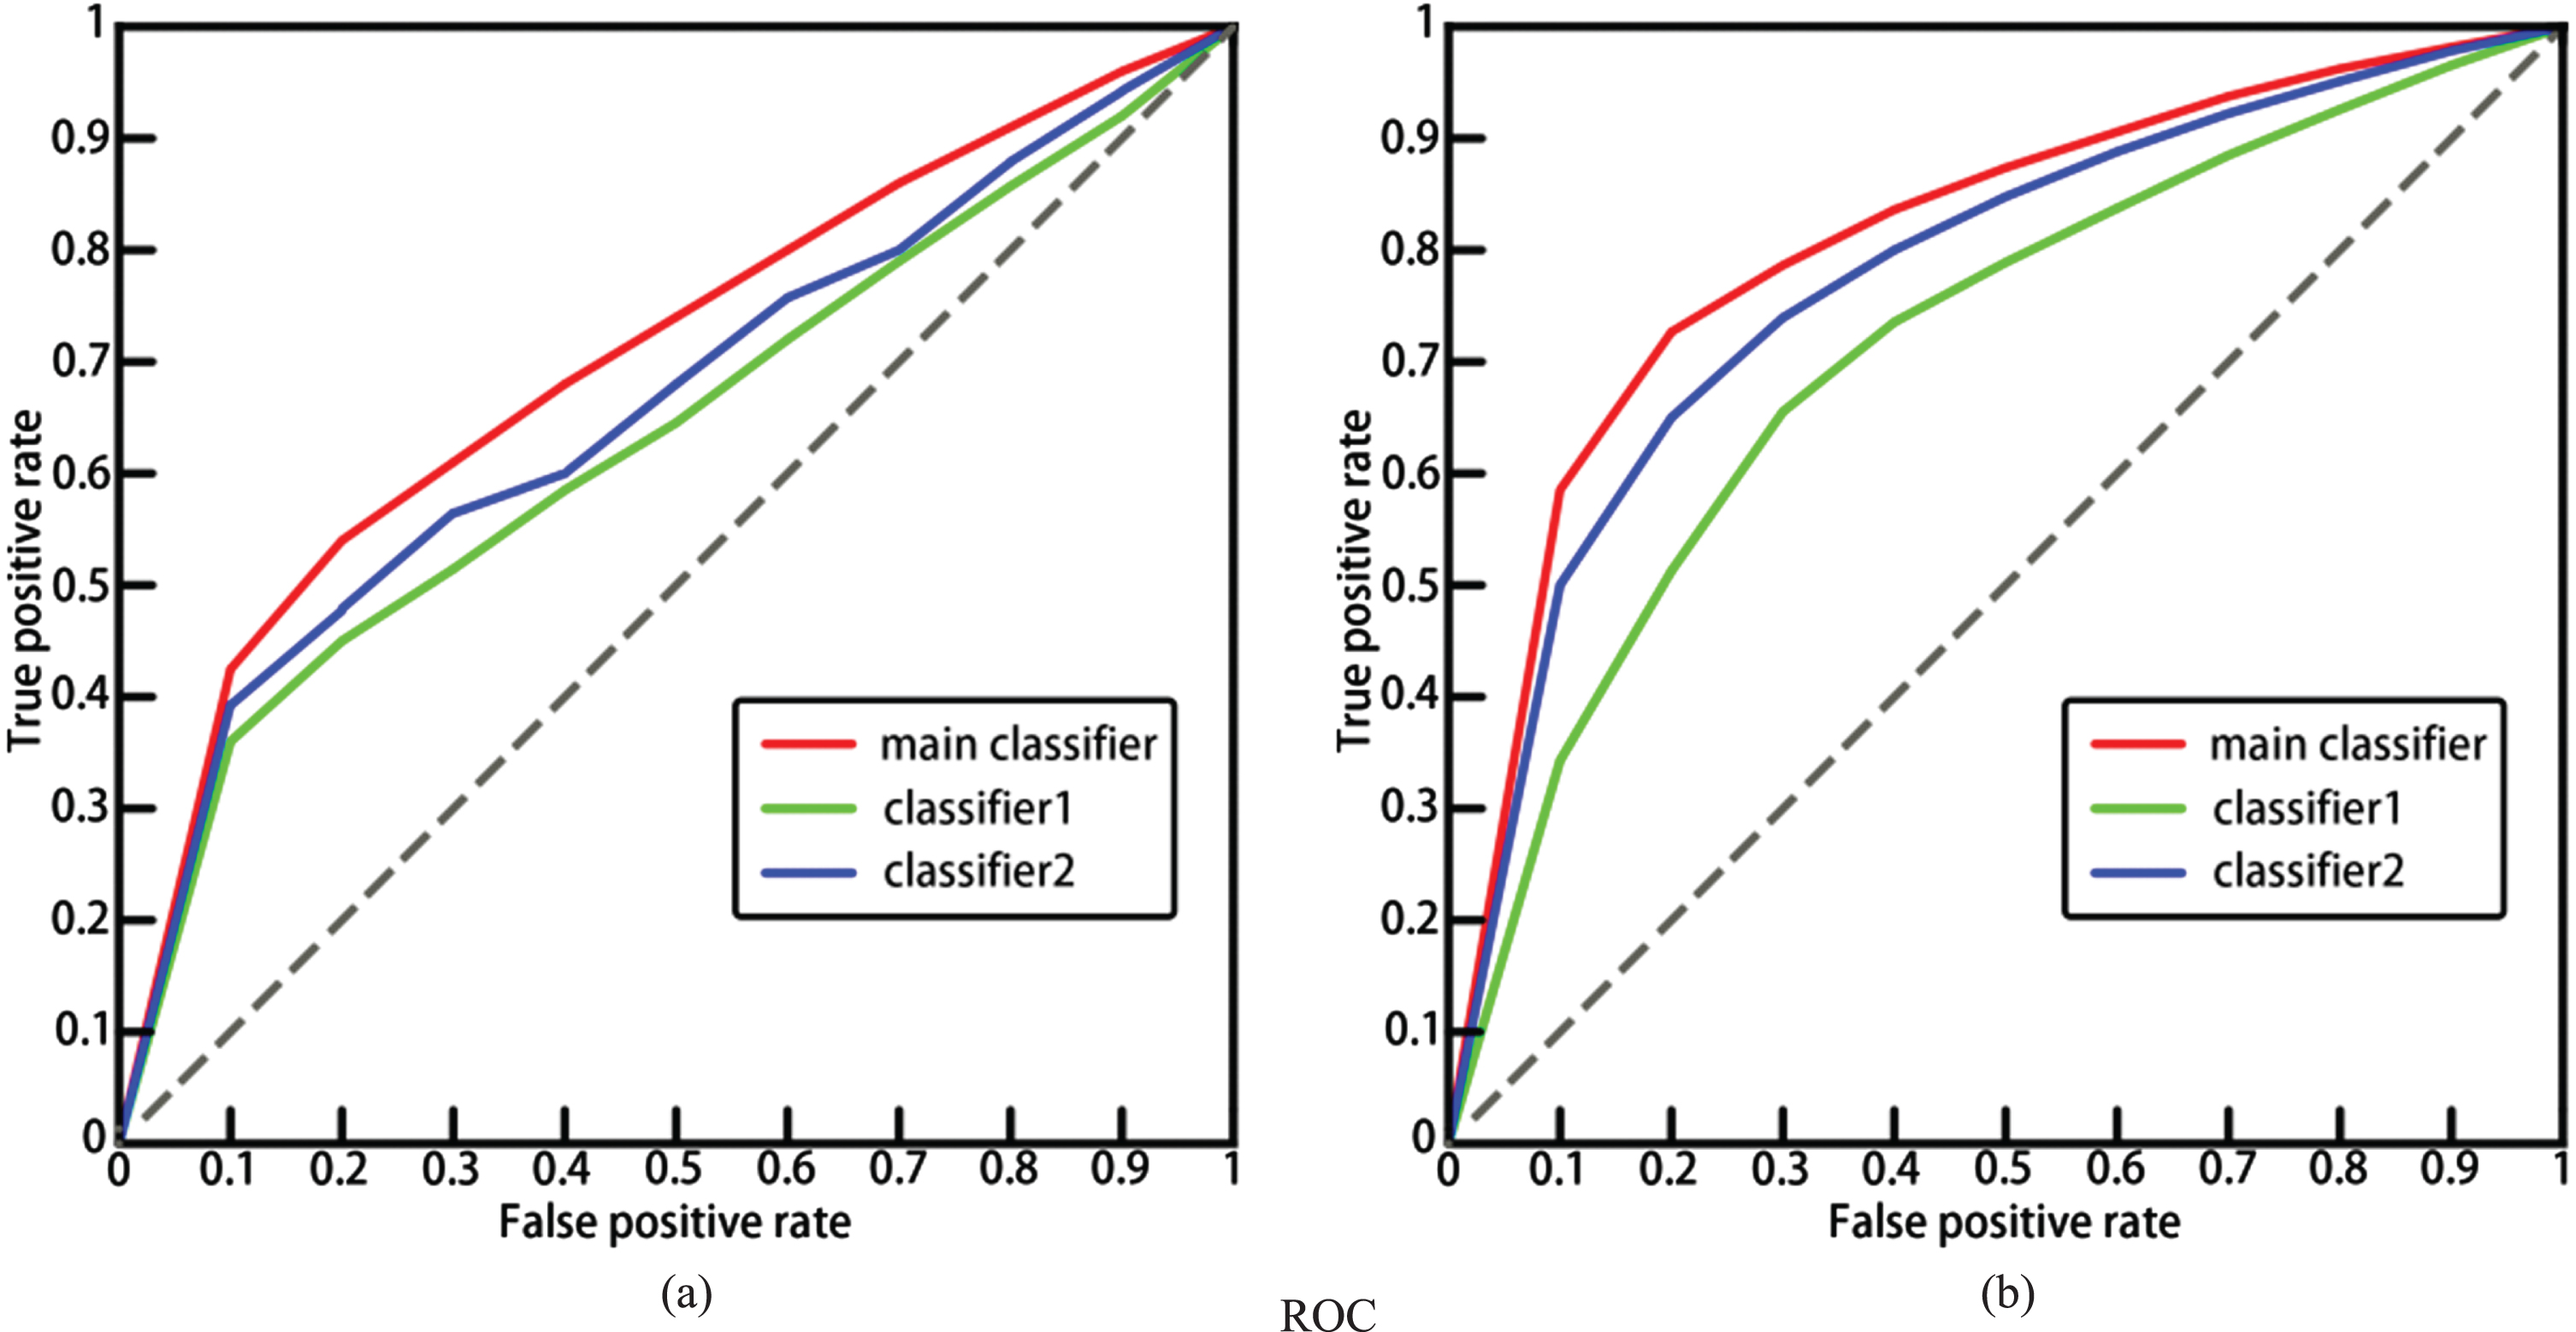
Performance of three classifiers. (a) task 1, (b) task 2.
We set up this group of comparative experiments to further explore the MMD loss imposed in the domain adaptation stage: (1) MVDA: calculate the MMD loss between the source domain S1 and the target domain and between the source domain S2 and the target domain, and add them up; (2) MVDA+S1S2mmd: based on the MMD loss in MVDA, the MMD loss is also calculated between the two source domains so that the three are added together to participate in the optimization of the model. Table 4 shows the comparison results.
Comparison of MVDA algorithm accuracy (%) with MMD loss between passive domains
The experimental results show that introducing MMD loss between source domains S1 and S2 did not bring better results, and the final classification accuracy was not even as good as the MVDA method. This may be because reducing the distance between S1 and target domains, as well as between S2 and target domains, and then reducing the distance between S1 and S2, actually increases the distance between the two source domains and target domains, affecting the learning of encoder 1 and encoder 2, resulting in negative migration compared to the MVDA method. Therefore, in the related experiments of MVDA, the distance between two source domains is no longer considered.
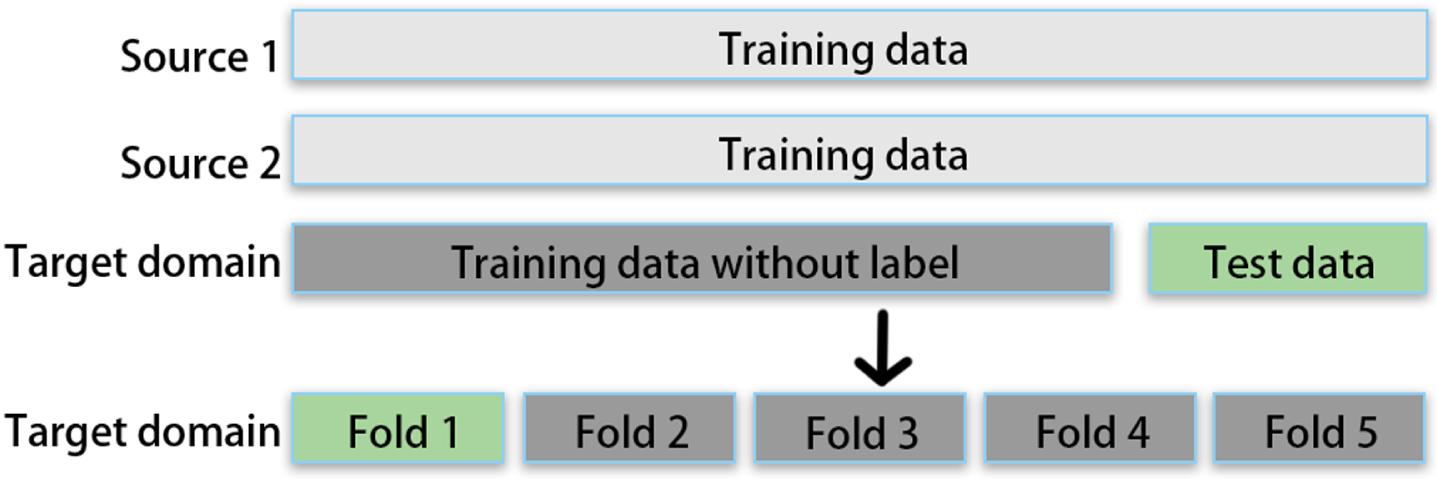
The K-fold cross validation is a statistical method used to evaluate the performance of machine learning models, which relies on statistical analysis results to evaluate whether the model can be extended to independent datasets. In practical applications, the images to be predicted often have significant differences from the training datasets. The MVDA method proposed in this article simulates training on labeled source domain datasets and making predictions on unlabeled target domain datasets. Although the target domain image is unlabeled, it is still used for training. Therefore, using K-fold cross-validation on the target domain is to avoid over-fitting during training on the target domain.
The deployment of K-fold cross validation experiments is shown in Fig. 8. All gray parts in Fig. 8 are training data, among which the dark gray parts are data that participated in the training but did not have labels. The green part serves as the part of the validation datasets.
Deployment of K-fold cross validation experiments.
The K-fold cross-validation experiments are set as follows: (1) For each task, divide each category of the target domain equally into five parts. For the Maria datasets, each section contains 684 undamaged building category images, 616 undamaged building category images, and 700 other object category images; For the Irma datasets, each section contains 600 undamaged building category images, 600 damaged building category images, and 800 other object category images. (2) For each task, use all source domains as the training set, a part of the target domain as the validation set (not participating in training, only testing), and the remaining four parts as the domain adaptation test set (the images of the four parts are trained without labels). (3) The results of using each part of the target domain as a validation set are shown in Table 5.
K-fold cross-validation results for each part
The experiment shows that our method has an error of no more than 0.9% in cross validation and can be used in independent datasets.
For the post-disaster building damage assessment task, this paper proposes the MVDA algorithm. The method consists of two stages: domain-specific distribution alignment and classifier alignment. By learning multiple domain-invariant representations and outputs from multiple source classifiers, and simultaneously aligning domain-specific distributions for each pair of source and target domains, the domain is reduced the difference between them improves the transfer performance. Extensive experiments on the hurricane datasets demonstrate the effectiveness of the proposed MVDA method, and the classification accuracy is superior to other current competing methods. After the disaster occurs, the remote sensing images captured by the satellite are simply processed, and the damaged buildings can be quickly and accurately identified through the trained MVDA model. This will help the government’s emergency management and disaster reduction and rescue departments to formulate more effective rescue plans and help rescuers find specific locations, which will significantly improve the speed of post-disaster rescue and reduce the loss of people’s lives and properties. In future work, we can try to use GAN to align each pair of source and target domains to improve feature alignment.
Footnotes
Acknowledgments
This research was supported by National Natural Science Foundation of China (Grant #62071006).