
Abstract
To achieve the carbon neutrality goal, enterprises should consider not only the development of new low-carbon emission projects but also the adjustment of the existing high-carbon emission projects. This paper discusses a multi-period project adjustment and selection (MPPAS) problem under the carbon tax and carbon quota policies. First, we propose an uncertain mean-chance MPPAS model for maximizing the profit of the project portfolio under the carbon tax and carbon quota policies. Then, we provide the deterministic equivalent of the proposed model and conduct the theoretical analysis of the impact of carbon tax and carbon quota policies. Next, we propose an improved adaptive genetic algorithm to solve the proposed model. Finally, we give numerical experiments to verify the proposed algorithm’s performance and show the proposed model’s applicability. Research has shown that the government can achieve the carbon neutrality goal by determining reasonable carbon tax and carbon quota policies, and companies can make the optimal investment decisions for the project portfolio by the proposed model. In addition, the proposed algorithm has good performances in robustness, convergence speed, and global convergence.
Introduction
The project portfolio refers to projects or project sets combined to facilitate effective management and achieve strategic objectives. The low-carbonization of industrial structures is one of the important tasks to reduce carbon emissions and is a long-term strategy that cannot be achieved in the short term. To achieve the low-carbonization of industrial structures, the government should formulate reasonable carbon emission policies and enterprises should adjust existing high-carbon emission projects while developing new low-carbon emission projects. Therefore, the project portfolio with the strategic objective of carbon emissions reduction is described as a multi-period project adjustment and selection (MPPAS) problem. At present, many governments are formulating various policies to reduce carbon emissions. Among them, carbon cap-and-trade and carbon tax policies are the most widely used policies [30]. The carbon cap-and-trade and carbon tax aim to promote enterprises’ carbon emissions reduction through economic means [6]. Recently, many scholars have studied the mixed low-carbon policy combining various carbon emission reduction policies. Shen and Zhao [28] showed that the “carbon trading-carbon tax" mixed policy is more conducive to improving the macro-economy and welfare than a single carbon emission reduction policy. Under the background of the mixed low-carbon policy (carbon tax and carbon trading), Zhao et al. [38] constructed a duopoly game model between supply chains and analyzed the complexity of competition decisions. Shen et al. [29] constructed a supply chain game model under a mixed low-carbon policy that embraced carbon cap-and-trade and carbon tax and discussed the possibility of low-carbon transformation for high-carbon manufacturers. Han et al. [7] explored the incentive effect of revenue-sharing and cost-sharing with subsidy offered by a retailer in the low-carbon supply chain under the carbon tax policy. Theoretical analysis and numerical experiments show that the government should impose the highest-possible carbon tax under the revenue-sharing and the medium-level carbon tax under the cost-sharing with subsidy. Zhu et al. [39] took the automobile manufacturing industry as the research object and identified the effective green manufacturing mode under the carbon tax and carbon quota policies.
Most existing research on the project portfolio problem considers the selection of new projects and ignores the adjustment of existing projects [1, 4, 8, 16, 24, 26, 32]. To maintain competitiveness, enterprises should consider not only the development of new projects but also the adjustment of the existing projects. Some scholars have studied the project portfolio problem considering the selection and adjustment of projects. Huang and Zhao [13] proposed a project selection and adjustment model with consideration of the cost overrun risk. Li et al. [17] proposed an uncertain mean-variance model for project selection and adjustment problems with divisibility. However, the MPPAS problem considering carbon emission reduction has not yet been studied.
In the research of the project portfolio, how to deal with indeterminate parameters is a significant problem. Traditionally, scholars have used probability theory to deal with indeterminate parameters. Probability theory is very effective for handling indeterminate parameters. The premise of using probability theory is that the probability distribution estimated from historical data should be very close to the actual frequency. However, some parameters sometimes have nothing or insufficient available data. For example, unexpected events (such as the COVID-19 outbreak or the outbreak of a trade war) invalidate historical data. Yang et al. [33] and Zhang et al. [36] revealed that using people’s belief levels as probabilities to make investment decisions can lead to counterintuitive results when the economic and social environments change significantly. In addition to probability theory, various theories are proposed to deal with indeterminate parameters, such as fuzzy theory, grey theory, and uncertainty theory. Uncertainty theory proposed by Liu [19] is a new tool for modeling indeterminate parameters. No paradox arises when dealing with people’s inaccurate estimates by uncertainty theory [21]. To deal with people’s inaccurate estimates, many scholars have applied uncertainty theory to study decision-making problems [3, 5, 11, 12, 18, 22, 25, 34, 37]. Huang studied the application of uncertainty theory in the project portfolio problem [10, 14]. This paper discusses the MPPAS problem under the carbon tax and carbon quota policies in the framework of uncertainty theory.
Optimization algorithm is essential to find the exact solution of the proposed model in logical time. In the research of project portfolio problems, heuristic algorithms have become a powerful tool for finding optimal solutions to large-scale problems, and there are many types, such as Genetic Algorithm [23], Ant Colony Optimization Algorithm [2], Gravitational Search Algorithm [27], and Hybrid TLBO-TS Algorithm [15]. Genetic Algorithm (GA) is the most widely used heuristic algorithm. In GA, the proper selection of parameters has a decisive effect on the performance of GA. For example, if the crossover probability is large, the genetic structure of the individual with high fitness is easily damaged. If the crossover probability is small, the convergence speed to the optimal individual is slow. Therefore, many scholars discuss the adaptive genetic algorithm (AGA) to preserve the highly adaptable individuals and population’s diversity [35]. Hu et al. [9] discussed the adaptive crossover probability and adaptive mutation probability to preserve the diversity of the population and highly adaptable individuals. Tang et al. [31] presented an AGA using adaptive crossover and mutation probability to optimize the train timetable, showing that the proposed algorithm quickly yields the good quality solution. This paper proposes an improved AGA. In the proposed algorithm, we present a feasibility repair operation to improve the search efficiency of the feasible solutions.
Table 1 lists the recent work related to our study. From Table 1, it can be seen that most research on reducing carbon emissions is related to the impact of low-carbon policies. Moreover, most existing research on the project portfolio problem focuses on the selection of new projects and ignores the adjustment of existing projects. This paper studies the uncertain multi-period project portfolio problem considering the adjustment of existing projects and the impact of low-carbon policies. In addition, this paper proposes an improved AGA to effectively solve the proposed model.
Recent work related to our study
Recent work related to our study
The structure of the paper is as follows: Section 2 proposes the uncertain mean-chance MPPAS model under the carbon tax and carbon quota policies. Section 3 provides the deterministic equivalent and the analytical results of the proposed model, and Section 4 proposes an improved AGA to solve the proposed model. Section 5 presents the numerical experiments to illustrate the proposed algorithm’s efficiency and the proposed model’s applicability. Section 6 concludes the paper.
Notations
To discuss the MPPAS problem under the carbon tax and carbon quota policies, we use the following notations:
n : the number of existing projects;
k : the number of new candidate projects;
Q it : the output of existing project i in t-th period. The t-th period indicates from time t to t + 1;
IC it : the income per unit output of existing project i in t-th period;
F b : after carbon neutralization, the allowable carbon emission per period for project portfolio;
F t : the allowable carbon emission of project portfolio in t-th period;
B t : the investment budget in t-th period;
q : the carbon tax per unit carbon emission;
M it : the income from selling production lines or facilities of existing project i when existing project i is abandoned at time point t;
r : the discount rate.
x i : the abandonment decision variable for existing project i,
z j : the selection decision variable of the new project j,
Uncertain mean-chance multi-period project adjustment and selection (MPPAS) model with carbon emissions constraint
The enterprise aims to maximize profit while satisfying the government’s carbon emission requirements by adjusting existing projects and selecting new projects. To simplify things, we assume that: each project has no salvage value at the end of its lifetime. When the existing project i is abandoned at the time point t, the enterprise obtains a net income of
Throughout this paper, the profit of projects expresses as the net present value (NPV), considering the time value of money. If the existing project i is kept, the profit of existing project i is
Cash flows when the existing project i is upgraded.
For the existing project i, since the decisions to keep, abandon, and upgrade are mutually exclusive, the total profit of the existing project portfolio is
If the new project j is selected at time point

Cash flows when the new project j is selected.
Thus, the profit of the new project portfolio is
When the existing projects are not adjusted, the future net cash flow of existing projects is the opportunity cost, and it is as follows (see [17]).
Therefore, the total profit of the project portfolio considering the opportunity cost is
Because the total profit of the project portfolio contains uncertain variables, the enterprise aims to maximize the expected
The enterprise has a limited budget. In the t-th period, the outlay
The enterprise also needs to consider the carbon emission of the project portfolio.
If the existing project i is kept, i.e., {x i = 0, y i = 0}, the carbon emission of the existing project i in the t-th period is
If the existing project i is upgraded at time point b i , i.e., {x i = 0, y i = 1}, the carbon emission of existing project i in the t-th period is
If the new project j is selected at time point
Thus, the carbon emission of the project portfolio in the t-th period is
Therefore, the uncertain mean-chance MPPAS model with carbon emissions constraint is as follows:
If the carbon emissions of the project portfolio in the t-th period exceed the allowable carbon emissions F t , the enterprise must pay the carbon tax according to the excess carbon emission. The excess carbon emissions EF t are
Therefore, the uncertain mean-chance MPPAS model without carbon emissions constraint is as follows:
Deterministic equivalent of the proposed model
Since models (6) and (7) contains uncertain variables, it cannot be directly calculated. To solve models (6) and (7), we use the knowledge of uncertainty theory. Firstly, we introduce some definitions and theorems of uncertainty theory.
(i) (Normality axiom)
(ii) (Duality axiom)
(iii) (Subadditivity axiom) For every countable sequence of events {Λ i }, we have
When the uncertain variables are represented by uncertainty distributions, the operational law is given by [19] as follows:
Let the uncertainty distribution of uncertain variables
According to the duality property of uncertainty measure (Definition 1 (ii)), the budget risk constraint Equation (1) transforms as
According to the monotonicity of the uncertain measure and the operational law (Theorem 2), we have
where
According to the objective function of model (12) is a strictly decreasing function with respect to q and Proposition 3, Proposition 4 is easy to prove.
Proposition 3 shows that there is a carbon tax q* at which the optimal profits of the project portfolio with and without carbon emission constraints are equal. Proposition 4 shows that if the carbon tax is less than q*, the enterprise does not consider the government’s carbon emission reduction requirement when making the investment decision. It is because the purpose of investment is to maximize profits. Therefore, if the carbon tax is less than q*, the carbon neutrality goal cannot achieve, i.e., the carbon tax policy is invalid. If the carbon tax is equal to or higher than q*, the enterprise does consider the government’s carbon emission reduction requirement when making the investment decision and ultimately achieves the carbon neutrality goal. However, the higher the carbon tax, the lower the profit of the enterprise. It will reduce the investment desire of the enterprise. Therefore, when the carbon tax is q*, it can minimize the losses of the enterprise and achieve the carbon neutrality goal simultaneously.
Improved adaptive genetic algorithm
Representation structure
The proposed model has 3n + 2k decision variables. To represent the solution of the proposed model, we use the integer vector G = (g1, g2, ⋯ , g3n+2k) as the individual chromosome, where g i (i = 1, 2, ⋯ , 2n + k) are 0 or 1 and g i (i = 2n + k + 1, ⋯ , 3n + 2k) are the non-negative integer numbers. Table 2 shows the corresponding representation structure between the individual and the decision variables.
Corresponding representation structure between the individual chromosome and the decision variables
Corresponding representation structure between the individual chromosome and the decision variables
We perform the genetic operation about the decision variables x
i
, y
i
, and z
j
. The decision variables b
i
and
To improve the efficiency of obtaining the feasible solution of the proposed model, we introduce the feasibility repair operation. In model (11), we refer to constraints Equations (3)-(5) as “Constraint
Generation of the initial population
The generation process of the initial population is as follows.
Step 1. Set i = 1.
Step 2. The genes {g1, g2, ⋯ , g2n+k} in the individual G i = {g1, g2, ⋯ , g3n+2k} are randomly generated from the set {0, 1}.
Step 3. The genes {g2n+k+1, g2n+k+2, ⋯ , g3n+2k} are generated by feasibility repair operation I.
Step 4. Check the feasibility of the individual G
i
. If the individual G
i
satisfies “Constraint
Step 5. If i < m, then i = i + 1, go to Step 2, where m is the population size.
Step 6. Return the generated initial population.
Evaluation of individual
The individual G
i
generated by the feasibility repair operation satisfies “Constraint
Selection operation
The selection operation is performed by the roulette wheel. The specific process is as follows:
Step 1. Based on the fitness values of each individual G i (i = 1, 2, ⋯ , m), the selection probability P s and the cumulative selection probability P cs are calculated by
Step 3. Generate a uniformly distributed random number R in (0, 1).
Step 4. Select the G i satisfying P cs (Gi-1) < R ≤ P cs (G i ) as the j-th individual of the new population.
Step 5. If j < m, let j = j + 1, and go to Step 3.
Step 6. Return the new population.
Adaptive crossover operation
We use the adaptive crossover probability to improve the performance of GA. Based on the fitness values of individuals G j and Gj+1, the adaptive crossover probability is determined by
Step 1. Set a basic crossover probability P c and j = 1.
Step 2. Generate a uniformly distributed random number R c in (0, 1), and calculate the adaptive crossover probability P ac (G j , Gj+1) for individuals G j and Gj+1 by Equation (13).
Step 3. If R c > P ac (G j , Gj+1), keep the individuals G j and Gj+1 and go to Step 5.
Step 4. If R
c
≤ P
ac
(G
j
, Gj+1), then the offspring individuals
Step 6. Return the new population.
The specific process of the mutation operation is as follows:
Step 1. Set j = 1 and the mutation probability P m .
Step 2. Generate a uniformly distributed random number R m in (0, 1).
Step 3. If R m > P m , keep the individual G j and go to Step 5.
Step 4. If R m ≤ P m , randomly select a mutation position i (1 ≤ i ≤ 2n + k). If the i-th gene of the individual G j is 0, it converts to 1. Otherwise, it converts to 0.
Step 5. If j < m, set j = j + 1 and go to Step 2.
Step 6. Return a new population.
Algorithm procedure
Figure 3 shows the procedure of the proposed algorithm. In Figure 3, “Set Parameters" includes population size (m), basic crossover probability (P c ), mutation probability (P m ), and termination generation number. According to Figure 3, the specific step of the proposed algorithm is as follows:
The procedure of the proposed algorithm.
Step 1. Set parameters.
Step 2. Generation of the initial population (please see Section 4.3 for the specific process).
Step 3. Evaluate the fitness of each individual (please see Section 4.4 for the specific process).
Step 4. Record the best individual according to the elitism preservation strategy.
Step 5. Update the population through selection, adaptive crossover, and mutation operations (please see Sections 4.5–4.7 for the specific process).
Step 6. Repeat Steps 3-5 until satisfying the termination condition.
Step 7. Report the best individual as the optimal solution for the model.
The steel industry is a typical high-carbon emission industry, and steel enterprises’ crude steel production mainly depends on blast furnace steelmaking. These steelmaking projects have high energy consumption and carbon emission intensity, which is not suitable for the sustainable development strategy of the steel industry under the background of the low-carbon emission policy. The upgrading of the steelmaking process via technologies such as energy efficiency improvement and CCUS (carbon capture, utilization and storage) is a method to reduce carbon emissions in the steel industry. However, the efficiency of reducing carbon emissions via these technologies is limited under the process structure and technology of current steel production. Ultra-low CO2 steelmaking (ULCOS) is a new project for carbon neutralization in the steel industry.
This section discusses the technological improvement of existing blast furnace steelmaking (adjustment of existing high-carbon projects) and the establishment of new ULCOS (selection of new low-carbon projects) for a steel enterprise under the context of carbon tax and carbon quota policies. The data used in the numerical simulation is based on information from China Metallurgical News (https://www.csteelnews.com/).
Problem description
Consider a steel enterprise that produces crude steel based on five steelmaking processes. Under the background of the carbon tax and carbon quota policies, the enterprise plans to adjust existing projects and establish new ULCOS projects. The enterprise is considering the typical non-focusing smelting reduction steelmaking HIsmelt process as a new ULCOS project. For the convenience of calculation, the outputs per period of each project are all Q=100,000 (ton), the available investment budget for each period is B=250 million dollars, and the discount rate is r=0.08. The enterprise requires that the chance of the investment capital exceeding the budget in each investment period should be less than 5%. According to the expert evaluation, the upgrade cost of the existing blast furnace process, the investment cost and the income per unit output of the HIsmelt projects estimate as uncertain variables with the linear distribution. The information on the existing blast furnace projects and the HIsmelt projects are shown in Tables 3 and 4, respectively.
Parameters of the existing blast furnace projects
Parameters of the existing blast furnace projects
Parameters of the HIsmelt projects
In this case, the objective function of model (11) is
According to Definition 2, the budget risk constraint Equation (10) is
The government’s carbon emission requirements include the following: Before the T′=4th period, the carbon emissions per period of the enterprise shall not exceed the carbon emission of the current period. After the 4th period, the carbon emissions of the enterprise linearly reduce in each period, and the carbon emission before the T=15th period (carbon neutrality) must be less than F b = 5 ×10⁵ (ton). From Table 3, the current carbon emission of the existing project portfolio is as follows:
Thus, model (11) is transformed as
This section provides the results of numerical experiments to evaluate the performance of the proposed algorithm. In the numerical experiments, we use the PC with the Intel Core i3-5005U CPU 2.00GHz and 8GB RAM.
To verify the robustness of our proposed algorithm, we use the data from Section 5.1 and change the parameter values, such as population size, P c , P m , and maximum generation number. We perform the proposed algorithm 20 times for each set of parameter settings and report the best results. Table 5 shows the computation results on model (17). In Table 5, Relative error is calculated as
Computation results on model (17)
Computation results on model (17)
From Tables 5, we obtain the following: For each set of parameter settings, the generation numbers to the first appearance of the optimal solution are different, but the optimal values are the same as the optimal value obtained by the enumeration method when the population size is equal to or greater than 100. The enumeration method takes a long time to find the optimal solution, but our algorithm can find the optimal solution of the proposed model in a short time. The crossover and mutation probabilities of the algorithm have little effect on the proposed algorithm’s spent time. However, the population size affects the spent time of the proposed algorithm. From Tables 5, it can be seen that the reasonable parameter values to solve the proposed model are Pop _ size = 100, P
c
= 0.9, and P
m
= 0.1.
Next, to evaluate the performance of our proposed algorithm for the large-scale problem, we obtain the optimal solutions of model (17) when the number of the existing and new projects is 5, 10, and 20, respectively. Then we compare them with the calculation results by the proposed algorithm (Standard genetic algorithm: SGA) in Ref. [13] and the proposed algorithm (adaptive genetic algorithm: AGA) in Ref. [31]. All algorithms are coded in MATLAB R2019a. The used parameters are as follows: The maximum generation number is 1000, the population size is m = 100, the crossover probability is P c = 0.9, and the mutation probability is P m = 0.1. For each problem, the algorithms repeat twenty times, and compare the performances of each algorithm by the average value.
We evaluate the algorithm’s performance by using the following three metrics.
1) Convergence Speed metric (CS) : CS is a metric to evaluate the convergence speed of the given algorithm. CS is measured by
2) Optimal Value (OV) : OV is a metric to evaluate the quality of the optimal solution obtained by the given algorithm. OV is the maximum of the optimal values obtained by repeating twenty times for the given algorithm. The higher the OV, the better the optimal solution quality for the given algorithm.
3) Solution Uniformity metric (SU) : SU is a metric to evaluate the uniformity of the optimal solution obtained by the given algorithm. SU is measured by
Table 6 shows the performance metric values of each algorithm, and Table 7 shows the average spent time ( Comparing the CS values in Table 6, our algorithm gives better results than the other algorithms. As shown in Table 7, our algorithm’s spent time per generation is longer than the SGA and the AGA because of the feasibility repair operation in our algorithm. However, the GN values of our algorithm are smaller than the SGA and the AGA. Comprehensively considering the ST and GN values, we know that the convergence speed of our algorithm is faster than the SGA and the AGA. Comparing the OV values in Table 6, all algorithms provide the same optimal solution when the problem size is small (n = 5, k = 5). However, when the problem size is large, our algorithm provides the optimal solution with better quality than SGA and AGA. This shows that our algorithm overcomes premature convergence and has good global convergence. Comparing the SU values in Table 6, we know that the SU value of our algorithm is smaller than the SGA and AGA. This means that our algorithm can obtain a more uniform optimal solution.
Performance metrics of the algorithms
The average generation number (
Overall, our algorithm is better than the proposed SGA and AGA in terms of robustness, convergence speed, and global convergence.
To illustrate the application of the proposed model, we discuss the MPPAS problem of the iron and steel enterprise based on the data introduced in Section 5.1. Table 8 shows the optimal project portfolio of model (17).
Optimal project portfolio of model (17)
Optimal project portfolio of model (17)
In Table 8, x (12) means that it is abandoned at time point 12, y (1) means that it is upgraded at time point 1, and z (1) means that it is selected at time point 1. As shown in Table 8, to obtain maximum profits, the enterprise upgrade the existing blast furnace projects P1, P2, and P3 at time points 1, 5, and 1, respectively. The existing blast furnace projects P4 and P5 abandon at time points 12 and 7, respectively. For the new HIsmelt projects,
Figure 4 shows the carbon emissions of the optimal project portfolio and the allowable carbon emissions in each period.
The carbon emissions of the project portfolio and the allowable carbon emissions in each period.
As shown in Figure 4, the carbon emission of the project portfolio in the 4th period is F4=951,300 (ton). From the 12th period, the carbon emissions per period are 463,437 (ton), less than the allowable carbon emission F b =500,000 (ton).
The objective function of model (12) without the carbon emissions constraint is
The optimal project portfolio and the carbon emission in the 15th period by model (19)
Figure 5 shows the allowable carbon emissions and the carbon emissions of the optimal project portfolio in each period. The carbon emission of the project portfolio in the 15th period is 1.0913 ×10⁶ (ton), less than the allowable carbon emission F b =500,000 (ton).
The allowable carbon emissions and the carbon emissions of the optimal project portfolio by model (19).
Figure 6 shows the expected NPV of the optimal project portfolio with respect to the carbon tax by model (19). In Figure 6, the dashed line indicates the expected NPV of the optimal project portfolio of model (17), and q* is the carbon tax at which the expected NPV of the optimal project portfolio of model (17) and model (19) are the same.
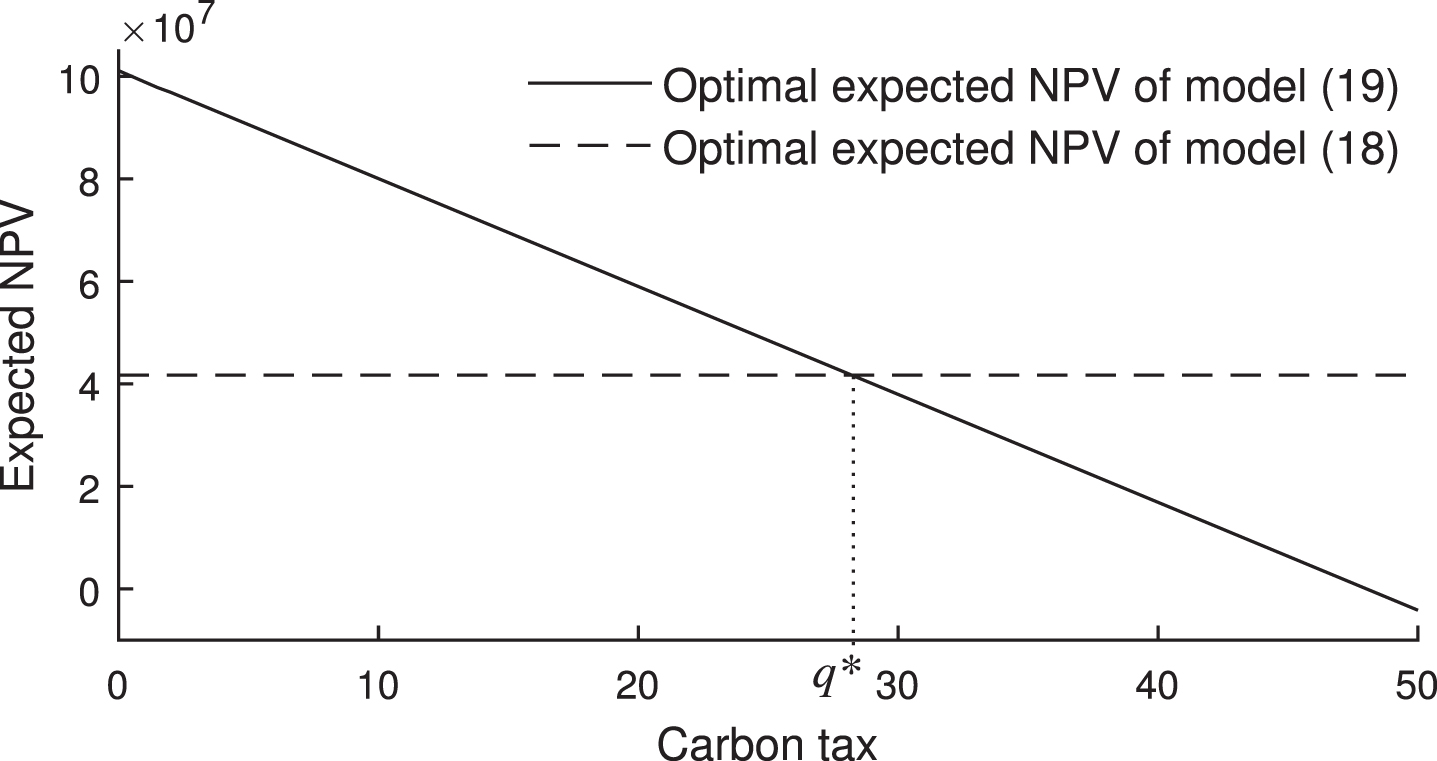
The expected NPV of the optimal project portfolio with respect to the carbon tax.
As shown in Figure 6, the higher the carbon tax, the smaller the expected NPV of the project portfolio. When the carbon tax is smaller than q*, the expected NPV of the optimal project portfolio of model (19) is larger than that of model (17). This show that the enterprise will make the investment decision without considering the government’s carbon emission requirements when the carbon tax is smaller than q* because the enterprise’s purpose is to maximize profits. Then the government cannot achieve the carbon neutralization goal. In other words, the carbon tax policy is invalid when the carbon tax is smaller than q*. When the carbon tax is larger than q*, the expected NPV of the optimal project portfolio of model (19) is smaller than the expected NPV of the optimal project portfolio of model (17). This show that the enterprise will make an investment decision that satisfies the government’s carbon emission requirements when the carbon tax is larger than q*. This is consistent with the result of Proposition 4.
This paper discusses the multi-period project adjustment and selection problem under the carbon tax and carbon quota policies. The main contributions of the paper are as follows. Firstly, this paper proposes the uncertain mean-chance model to solve the multi-period project adjustment and selection (MPPAS) problem under the background of the carbon tax and carbon quota policies. Secondly, this paper proposes the deterministic equivalent of the proposed model and conducts the theoretical analysis of the impact of carbon tax and carbon quota policies. Thirdly, this paper develops an improved adaptive genetic algorithm to solve the proposed model. Fourthly, through a case study of steel enterprises with high carbon emissions, the performance of the proposed algorithm and the applicability of the proposed model are proved.
This paper considers a project portfolio problem under the carbon tax and carbon quota policies but does not consider other low-carbon policies such as the carbon trading policy. In addition, this paper uses the uncertain mean-chance model as an evaluation model for project portfolios. Further research may focus on two aspects. One is to consider more real-life environments, such as various policies to reduce carbon emissions and the interdependence between projects, and how to use uncertain dominance criterion to select the portfolio. The other is developing effective programming algorithms to solve the proposed model.
Footnotes
Conflict of interest
No conflict of interest exists.
Acknowledgements
Our research have been supported by the National Social Science Foundation of China (17BGL052).