
Abstract
Accurate forecasting of the load of electric vehicle (EV) charging stations is critical for EV users to choose the optimal charging stations and ensure the safe and efficient operation of the power grid. The charging load of different charging stations in the same area is interrelated. However, forecasting the charging load of individual charging station using traditional time series methods is insufficient. To fully consider the spatial-temporal correlation between charging stations, this paper proposes a new charging load forecasting framework based on the Adaptive Spatial-temporal Graph Neural Network with Transformer (ASTNet-T). First, an adaptive graph is constructed based on the spatial relationship and historical information between charging stations, and the local spatial-temporal dependencies hidden therein are captured by the spatio-temporal convolutional network. Then, a Transformer network is introduced to capture the global spatial-temporal dependencies of charging loads and predict the future multilevel charging loads of charging stations. Finally, extensive experiments are conducted on two real-world charging load datasets. The effectiveness and robustness of the proposed algorithm are verified by experiments. In the Dundee City dataset, the MAE, MAPE, and RMSE values of the proposed model are improved by approximately 71%, 90%, and 67%, respectively, compared to the suboptimal baseline model, demonstrating that the proposed algorithm significantly improves the accuracy of load forecasting.
Keywords
Introduction
Motivation
With global climate change and increasing pollution, the energy-efficient and environmentally friendly electric vehicles (EVs) are a highly concerned vehicle worldwide. However, in the wake of the rapid growth in market share, large-scale uncoordinated charging of EVs will pose a significant threat to the safety and stability of the power system. Based on the forecast results, the operator of the EV charging station can better manage the charging process [1], smooth the load curve of the distribution transformers [2], and mitigate the negative effects of uncontrolled charging of EVs[3]. Therefore, it is necessary to accurately forecast the charging load of EV charging stations. In addition, coordinating the charging/discharging process of large-scale EVs enables some auxiliary service tasks for the power system by vehicle-to-grid, for instance, frequency regulation and spinning reserve.
The results of EV charging load forecasting of charging stations can be used to guide EV charging, and it can reduce traffic congestion caused by charging aggregation. However, the problem of predicting the load of EVs at charging stations is more complex than other time series prediction problems due to the complex spatial and temporal dependencies among EV charging stations and the influence of external factors [4]. For example, if a charging station is operating at total capacity or there is a traffic congestion near the charging station, EVs with charging demands would to find other charging stations while also considering the load of the adjacent charging stations. Therefore, achieving accurate predictions of EV charging loads is a big challenge since considering both spatial correlation and temporal dependence between the EV charging stations and the influence of external factors.
Literature review
Traditional methods always model charging load forecasting as a time series forecasting problem, mainly using statistical learning and machine learning to make forecasting. For statistical learning methods, Autoregressive Moving Average (ARMA) [5, 6], Kalman Filter [7], and Monte Carlo [8] are widely used. In [9], a charging load forecasting model based on the probability of charging time is presented using probability statistics and Monte Carlo simulation. The EV charging load demand model is based on the Monte Carlo method established in [10], considering the charging time of EV, the types of charging, the initial charge state, etc. In [11], the authors propose a probabilistic travel model for different users based on statistics such as charging preference, charging power, and charging location. However, the performance of these algorithms is influenced by sophisticated factors such as weather, holidays and user behavior characteristics. Statistical learning-based methods make it difficult to provide higher prediction accuracy for the forecasting model by fully considering these factors. To this end, machine learning-based methods, such as Linear Regression (LR) [12], Support Vector Regression (SVR) [13], and Random Forest Regression (RFR) [14], are applied to charging load prediction. In [15], the authors propose a short-term load forecasting model based on random forests to handle complex load information and improve the forecasting accuracy of the model.
Deep Neural Network (DNN) [16] prediction models become increasingly popular in the forecasting of charging load of EVs due to their strong time series feature extraction ability, especially Convolutional Neural Network (CNN) and Long-Short-Term Memory (LSTM) with better prediction performance. Reference [17] combined Bayesian probability theory and the LSTM model to predict the charging load of an EV charging station, and the results showed that the LSTM model has higher accuracy in short-term load prediction. Gated Recurrent Unit (GRU) is a variant of LSTM with a much simpler architecture, and it is also widely used in EV charging load forecasting. A GRU-based EV charging load forecasting model is proposed in [18], which provides a method with higher accuracy in short-term EV load forecasting. In [19], the authors build a LSTM-based load forecasting model with a novel gating mechanism. A short-term EV load prediction model based on multi-channel CNN and time-series convolutional network is proposed in [20], and good prediction performance is obtained. The aforementioned research works only considered the time dependence on the charging load. However, the complex spatial correlation of EV charging loads in different charging stations within the same area is ignored. Therefore, the simultaneously consideration of spatial correlation and time dependence in different EV charging stations is very important to improve the performance of EV charging load forecasting algorithms.
In the former studies, travel chain theory and origin-destination (OD) matrix are widely used to build the prediction model of EV charging load spatial-temporal distribution. The charging loads of EVs with spatial-temporal characteristics are simulated using transportation system models and travel chains in [21]. In [22], the authors build an EV charging load forecasting model based on the travel chain theory and the OD matrix, which systematically considered the real-time traffic flow, and the dynamic energy consumption of EVs, the price, etc. EV charging load forecasting methods based on the OD matrix have high accuracy. However, when the number of EVs and the scale of the road network is large, the OD matrix would increase dramatically, making it difficult to adapt to large-scale applications. In addition, the methods based on the travel chain theory and OD matrix have the following shortcomings: first, both the construction of the travel chain and the allocation of the origin and destination points in the OD matrix depends on the division of the driving destinations, and the spatial granularity of the forecasting results are large; second, it is usually assumed that the travel time of users, battery state-of-charge, and the types of different travel chains meet a specific distribution or proportion, and these assumptions are very subjective.
To adequately capture the spatial structural relationships between EV charging stations, the researchers initially propose the Raster-map method [23], in which the entire investigated area is divided into different grids in the same size, and each grid corresponds to a specific spatial location within the area. On the basis of the divided grids, CNN is used to capture the spatial correlation of the charging load; then, the temporal features are learned using a recursive deep learning layer. The performance of spatial feature extraction is heavily dependent on the grid size. When the grid size is small, CNN can capture the spatial feature very well at the cost of a massive computation; otherwise, if the grid is too large, the model cannot efficiently capture the spatial feature. Research shows that the method of Raster-map+CNN cannot effectively address the problem of predicting the charging load of charging stations with graph structure [24]. The Raster-map+CNN based on spatial modeling can only handle images and networks with Euclidean data. However, the non-Euclidean data structure formed by the connection between charging stations and the relationship of traffic is not possible to extract the non-Euclidean structural information by the CNN size with fixed convolutional kernel. Therefore, the Raster-map cannot effectively represent the topological relationships between charging stations.
In recent years, Graph Neural Networks (GNN) have presented interactions between prediction tasks as graph-structured data-related representations and have achieved better results in capturing spatial node interactions in the network and optimizing the representation of any spatial relationship. In particular, as an emerging model, Graph Convolutional Network (GCN) introduces a convolution operator to non-Euclidean space, which can simultaneously learn both the node feature and structure information of the graph and efficiently capture the spatial dependence between nodes. GCN has been widely used in wind speed prediction [25], traffic prediction [26], mobile cellular traffic prediction [27], and traffic demand prediction [28]. However, GNN-based load forecasting in the power system is in its initial stage. To address the short-term residential load forecasting problem, the authors of [29] propose a GNN-based forecasting framework that captures the spatial-temporal dependencies of different houses. In [4], the authors propose an EV charging station availability forecasting model named Attribute-Augmented Spatial-Temporal Graph Informer by combining the GCN and Informer layer. To alleviate the waiting time at charging stations for EV users, the authors of [30] combine GCN and GRU and proposed a prediction model for the operating status of EV charging stations. To the best of our knowledge, [31] is the first paper to make spatial-temporal charging load forecasting for EV charging stations, and the framework they used is the Graph WaveNet. Inspired by the aforementioned works, we can argue that effectively capturing the spatial correlation of different EV charging stations and the temporal correlation hidden in the historical charging load can improve the accuracy of the prediction of the EV charging load.
Contribution of the paper
Accurate spatial-temporal charging load forecasting for EV charging stations is of great significance. To improve the performance of the forecasting model, the temporal and spatial dependence between the charging station loads and the influence of external factors should be considered simultaneously. In this paper, inspired by the work of [32], we propose a spatial-temporal charging load forecasting framework for EV charging stations based on an improved adaptive spatial-temporal graph neural network with Transformer, which is named ASTNet-T.
The external factors that influence the prediction of the charging load of the EV charging station contain many uncertainties. Considering that the impact of these external factors on the prediction of the charging load of the charging station is intuitive in numerical representation, the fluctuation of the charging load of the EV charging station can be used to analyze whether it is affected. In this paper, when constructing information about the graph structure, a micrograph structure is introduced that can describe the short-term fluctuations in the spatial relationship of EV charging stations, and the fluctuations in time series are studied and analyzed through the aggregation function. Taking into account the long-term spatial relationship between EV charging stations from a macro perspective, the adjacency matrix suitable for its characteristics is constructed to describe the spatial relationship.
The complex spatial correlation and temporal dependence hidden in the historical charging data are difficult to capture. Most existing spatial-temporal prediction models use the combination of GCN and dilated causal convolution to capture spatial-temporal dependencies. However, convolution operations in convolutional neural networks can only capture local information, and the model also has limitations for accurate load prediction at EV charging stations. The neural network realizes input adaptation and captures global sequence information through self-attention operation. This paper uses GCN and Temporal Convolutional Networks (TCN) to capture the local spatial and temporal dependence of charging loads at EV charging stations. Then a transformer network is integrated to extract the global spatial-temporal feature of charging loads. The contributions of this work can be summarized as follows: An adaptive time-varying GNN model is presented to capture the spatial correlations between different EV charging stations. The optimal node graph is derived by a dedicated structure learning algorithm from the perspectives of both long-term and short-term. A spatial-temporal convolutional network is built to forecast the future charging load of EV charging stations during multiple periods. The spatial-temporal convolutional network can effectively capture the spatial correlation and time dependence between the load information of the EV charging station for prediction. A Transformer network based on the multi-head attention mechanism is introduced to extract the global spatial-temporal feature information and further improve the accuracy of the EV charging load forecasting.
Organization of the paper
The remainder of this paper is organized as follows. Section 2 describes the formalization of the load forecasting problem. Section 3 presents the ASTNet-T model-based load forecasting for EV charging stations. Section 4 evaluates the performance of the ASTNet-T model and compares the results with other methods. Section 5 concludes the paper.
Problem formulation
Given the historical charging load data of N EV charging stations, the task of EV charging load forecasting is to predict the future charging load of each charging station. To describe the correlations between different EV charging stations, we model the N charging stations as a directed graph
The problem with charging load forecasting is defined as learning a function f based on historical S-step charging load
In this section, we first present the overall framework of ASTNet-T that we proposed for load forecasting of EV charging stations and then describe the structure and function of each component in detail.
Overall framework
The spatial-temporal charging load forecasting framework for EV charging stations based on ASTNet-T proposed in this paper is presented in Figure 1. The whole framework is made up of two parts: an adaptive optimal node graph learning module and a multistep spatial-temporal EV charging load forecasting module. The adaptive optimal node graph learning module constructs an optimal node graph by considering node attributes from the long and short-term aspects, which can capture complex and hidden spatial relationships in the charging load information of different charging stations. The learned optimal node graph and historical charging load information are input to the multi-step EV charging load prediction module to predict future T-step EV charging loads at charging stations. This multi-step EV charging load prediction module can be further divided into three small components: stacked spatial-temporal blocks, a Transformer network, and a fully connected layer. Multiple spatial-temporal blocks are stacked together to capture the spatial correlations and temporal dependencies hidden in historical charging records. Each spatial-temporal layer contains two TCNs and two GCNs. The outputs of stacked spatial-temporal blocks are fed to the Transformer layer by skip connection to extract the global spatial-temporal features. Finally, the future multi-step EV charging load is forecasted by the fully connected layer based on the output of the Transformer layer.
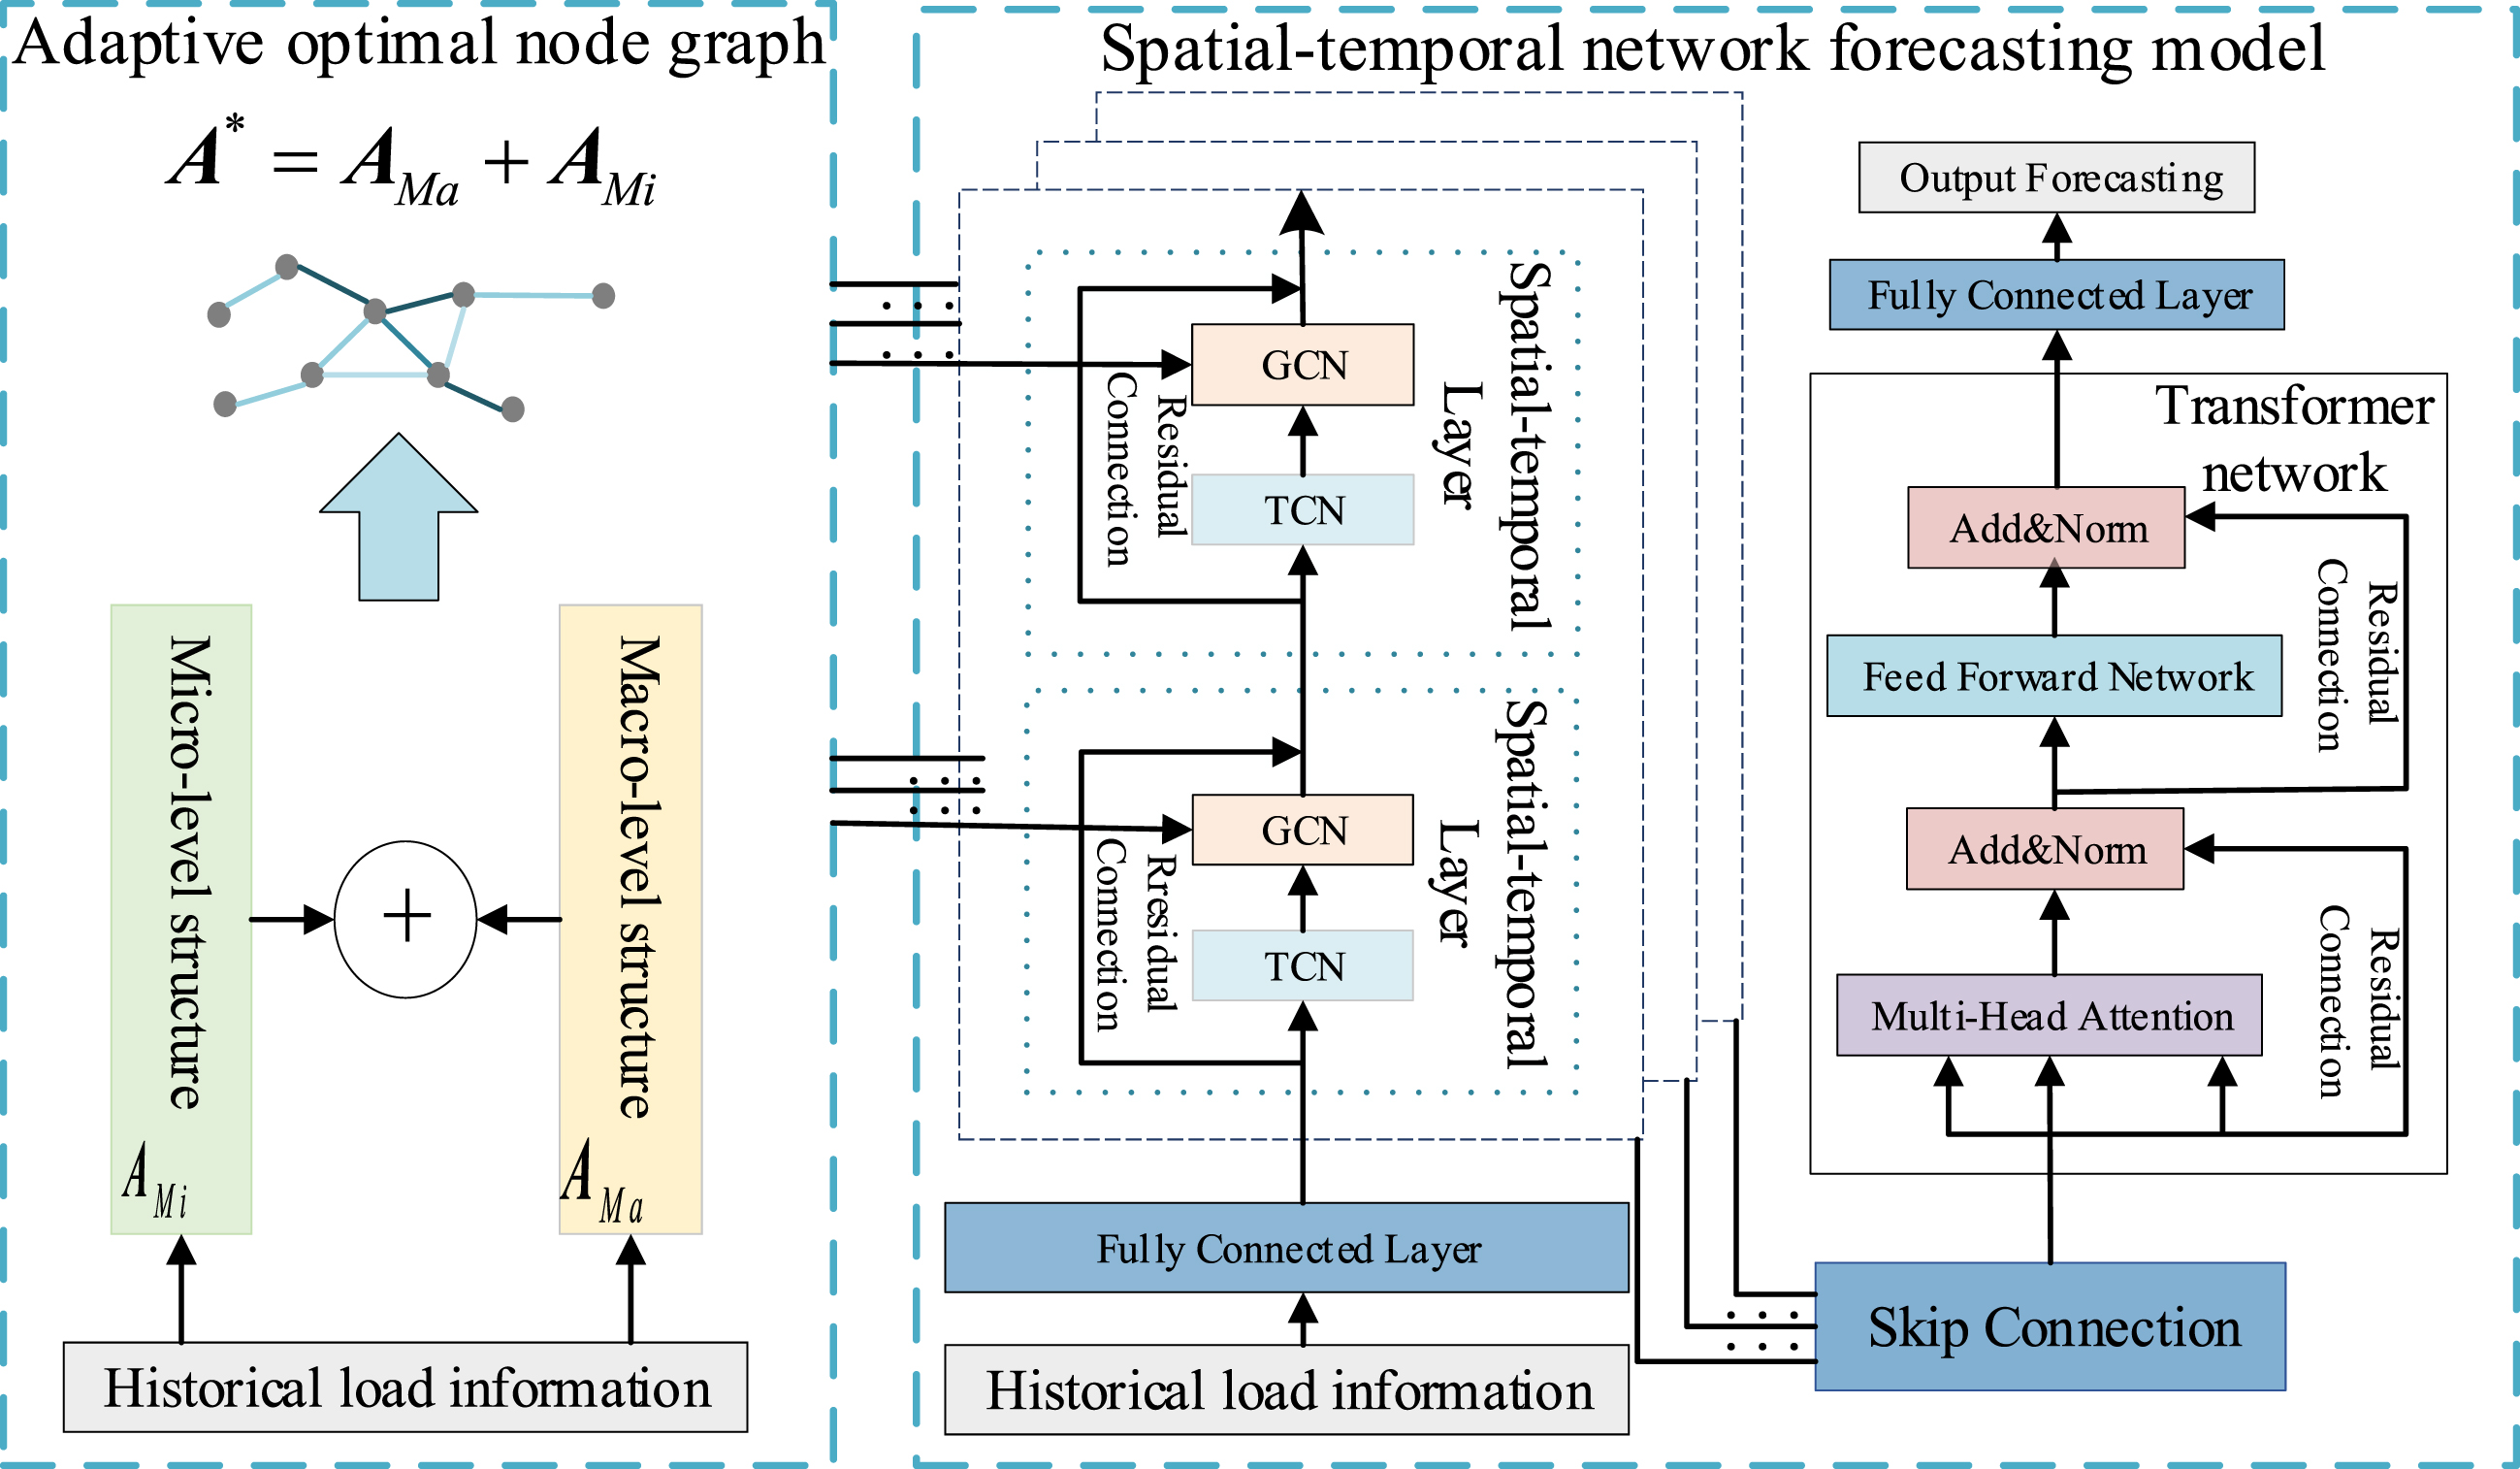
The framework for charging load forecasting based on ASTNet-T. GCN: Graph Convolutional Network; TCN: Temporal Convolutional Network
Mathematically, for the adaptive optimal node graph learning component, let g (
In the same way, the multistep spatial-temporal EV charging load forecasting module can be denoted by Eq.(3), where the optimal node graph
To adaptively generate the optimal node graph for EV charging stations, we borrowed the idea proposed in [32], which is presented in Figure 2. The module is made up of two small modules: the macro-level graph structure construction module and the micro-level graph structure construction module.
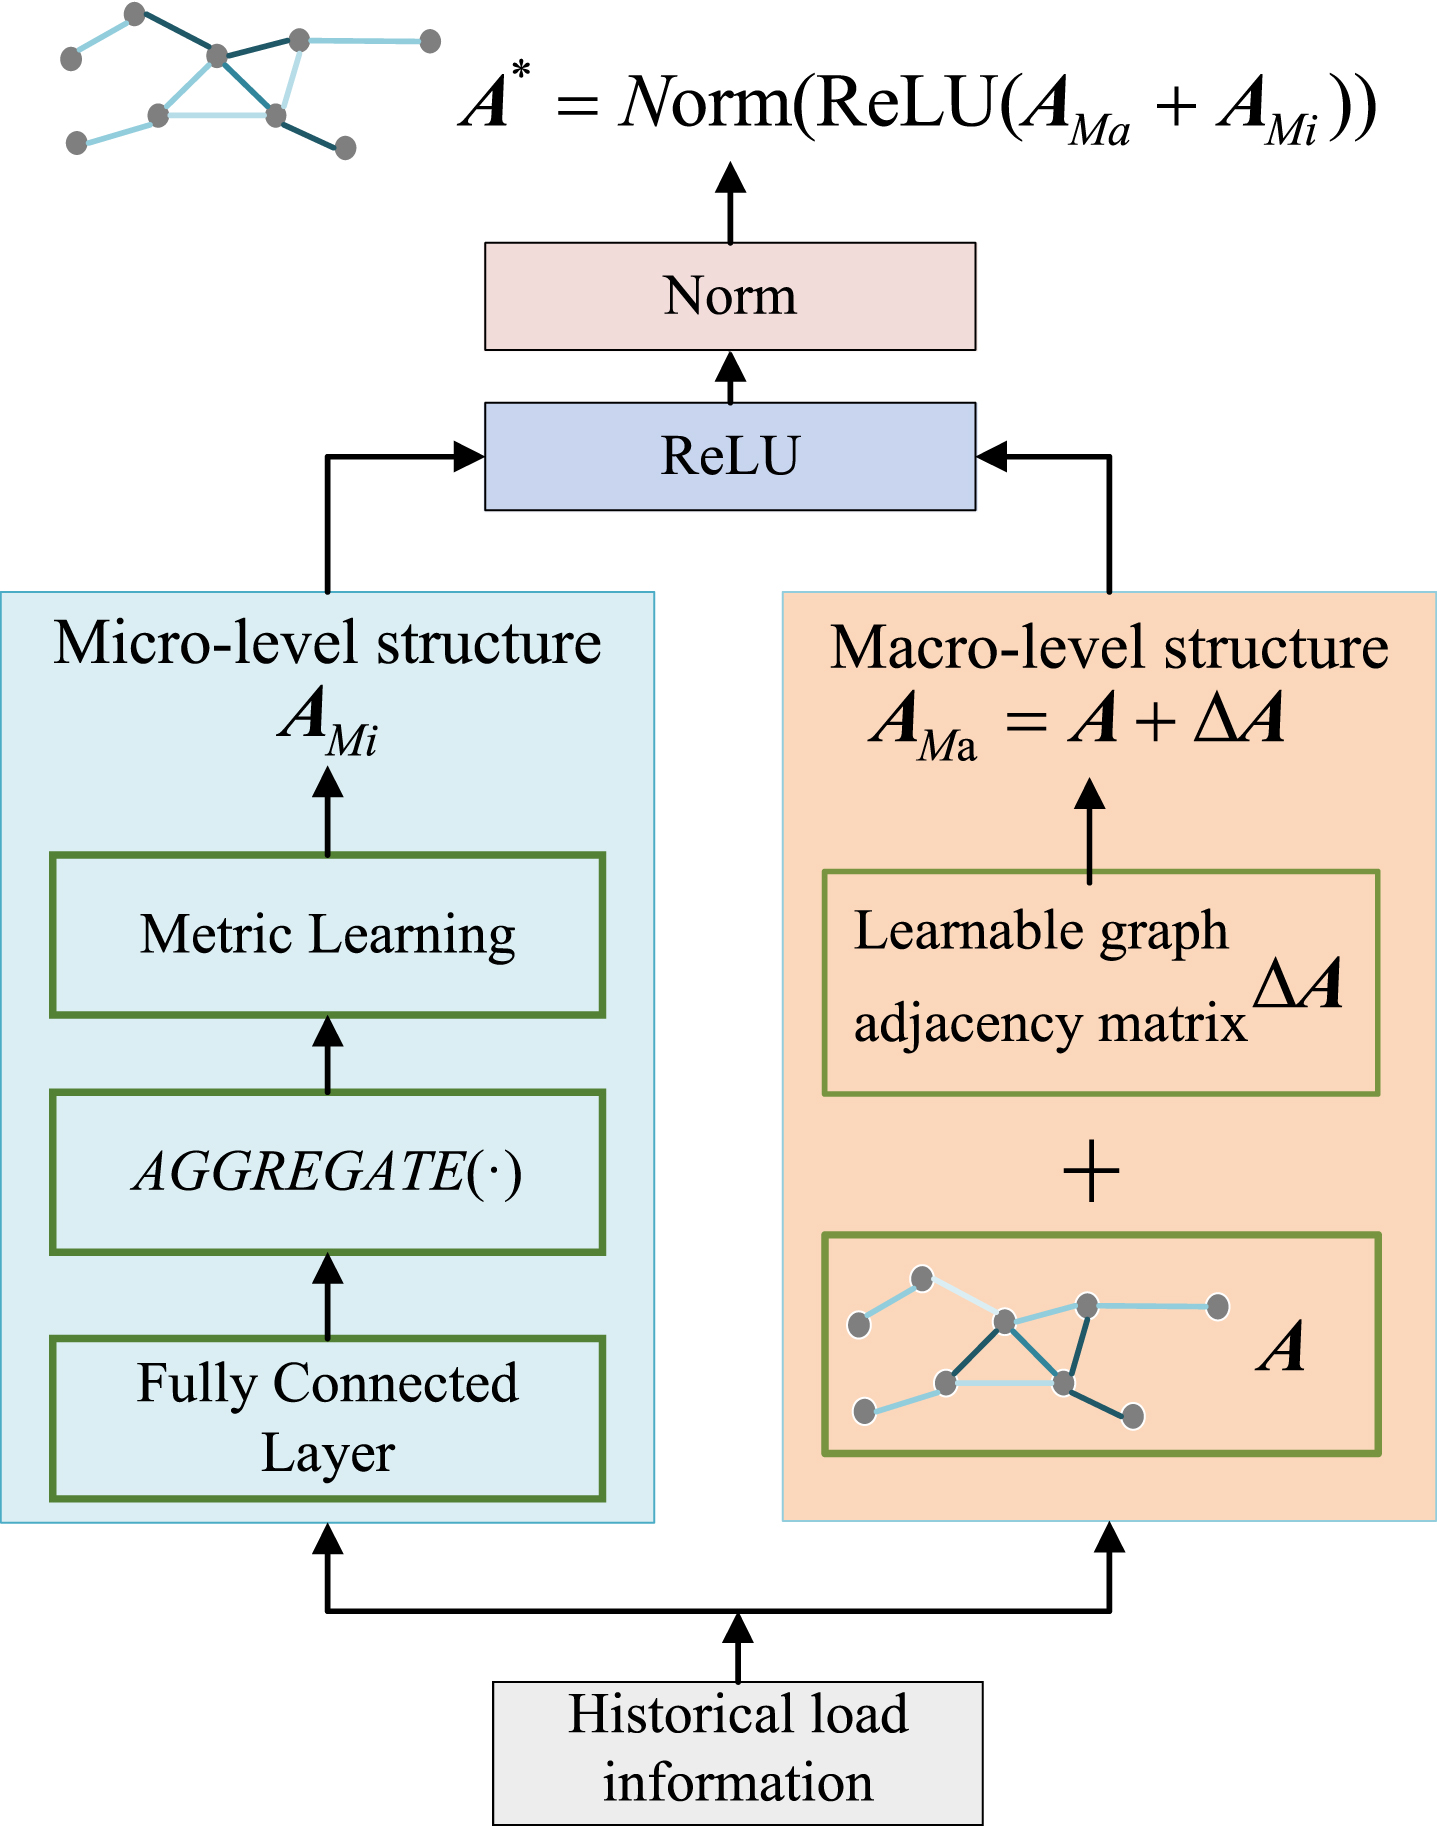
The structure of adaptive optimal node graph learning module [32].
The geographical distance between different EV charging stations remains the same; therefore, it is reasonable to assume that the spatial correlation between different EV charging stations at the macro-level is stable and can be described by an adjacency matrix called
Although the spatial correlation of EV charging stations is stable in the long term, in the short term, a wide variety of external factors influence the spatial relationship of EV charging stations. Unexpected conditions or natural factors such as charging station failures, traffic congestion, bad weather, and reduced renewable energy output power can cause dramatic fluctuation in charging load. Take traffic accidents as an example; if an accident happened near an EV charging station and caused a traffic jam, then some EV users would change their charging plan and turn to other nearby charging stations. As a result, the spatial-temporal distribution of the EV charging load in this region would change. However, after the traffic accident is handled, the effect would disappear. Additionally, it is impossible to predict when and where the next traffic accident will occur. To this end, a micro-graph structure is introduced to represent these fluctuations in spatial relationships of EV charging stations. The micro-graph structure is learned by a dedicated module.
First, given the node feature matrix of the EV charging stations
After aggregating the EV load sequence information, each node will obtain a new node feature matrix. The temporary spatial relationships between every two nodes can be calculated on the basis of these new attributes. For instance, the relationship between node i and node j can be computed as follows:
To facilitate the EV charging load forecasting task, we should simultaneously capture the spatial correlations between EV charging stations both from the perspectives of long-term and short-term. Therefore, we combine the learned macro-graph adjacency matrix
The detailed structure of the multistep spatial-temporal EV charging load forecasting component is shown in Figure 3, which consists of three main parts: stacked spatial-temporal blocks, a Transformer network, and a fully connected layer. The historical charging load records of the charging stations and the learned optimal node graph are the inputs of stacked spatial-temporal blocks, and the local spatial relationships and the time dependences are captured by the TCN and the GCN, respectively. The global spatial-temporal dependency characteristics is captured through the Transformer network.
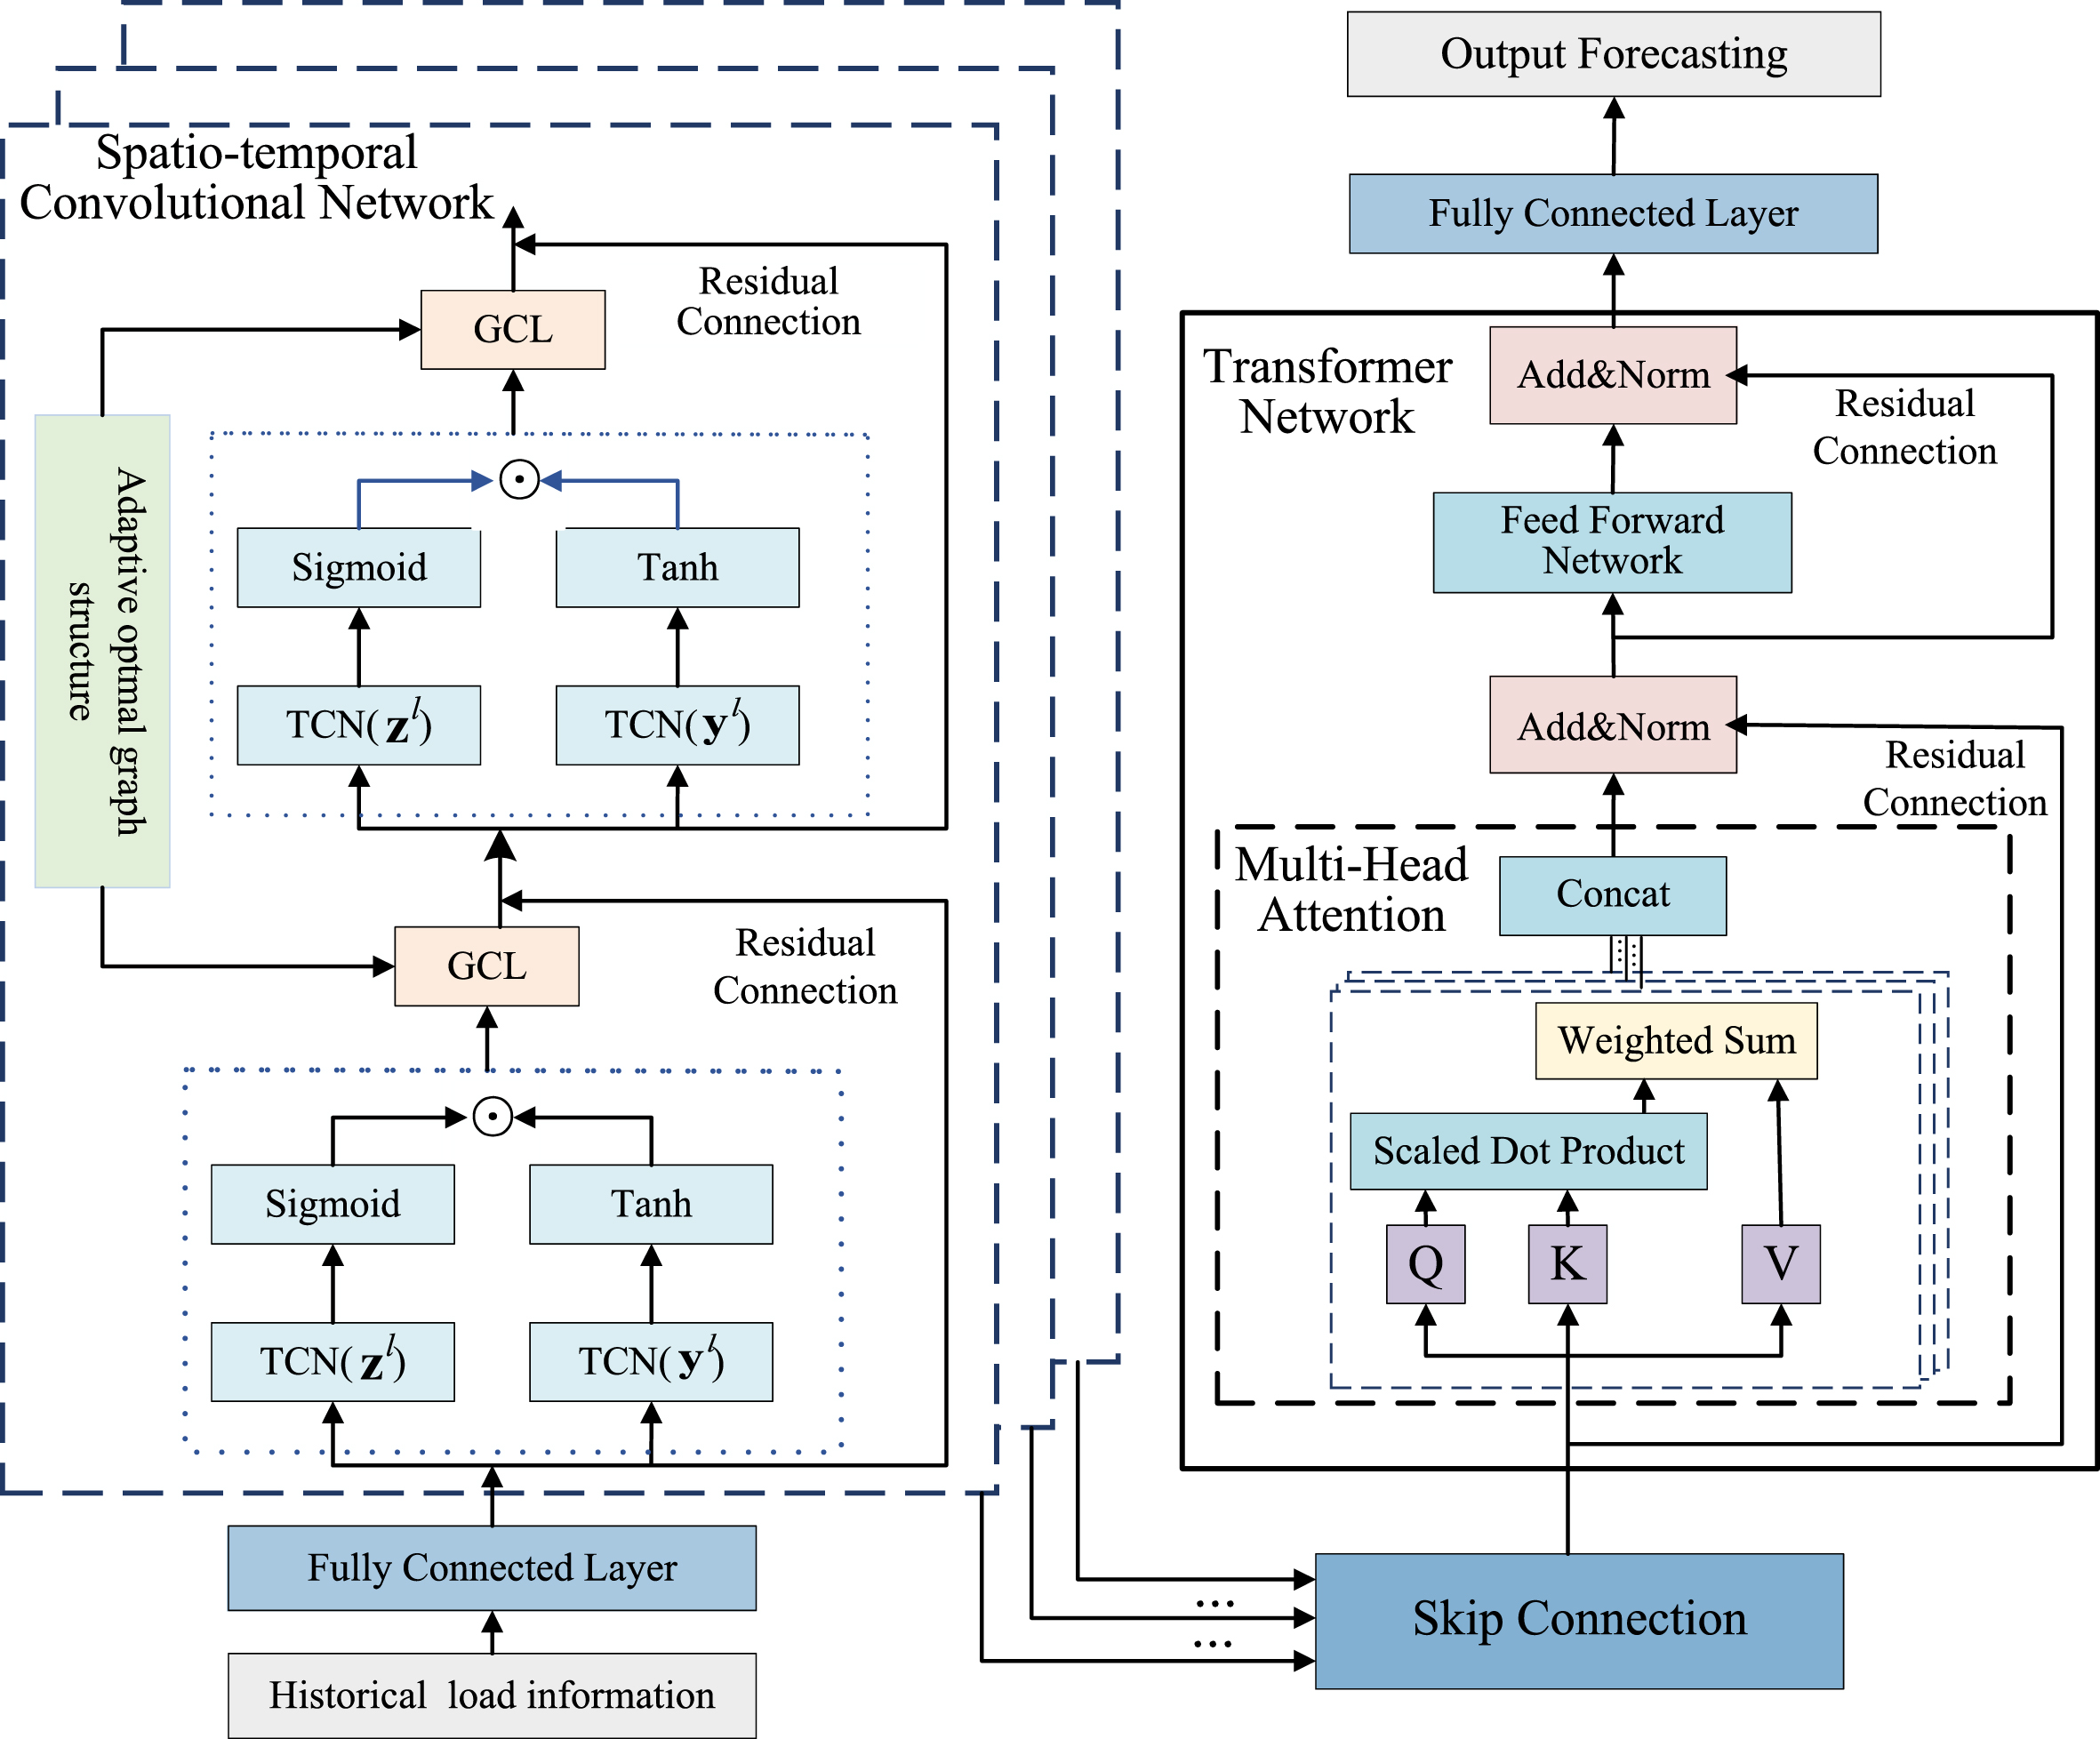
Multi-step spatial-temporal EV charging load forecasting module.
1) Temporal Convolutional Network: Recurrent Neural Network (RNN) and its variants are commonly used to capture the temporal dependencies of sequence data. However, due to the disappearance or explosion of the gradient, the RNN-based model cannot effectively deal with the long time series information on the EV charging station load. To this end, the Dilated Causal Convolutional Network [33] (DCCN) has become increasingly popular lately due to its efficiency in extracting the temporal dependencies of long sequences. By controlling the expansion factor of DCCN, the receptive field can be exponentially increased by increasing the depth of the hidden layer. Owing to this characteristic, DCCN can efficiently handle longer sequences in fewer layers. Therefore, DCNN is used as the temporal convolutional layer to extract the temporal features of the EV charging station load.
The process of extracting temporal dependencies in the load information of the EV charging station is described as follows. First, the attribute dimension of the historical charging load of the charging stations with S time steps is expanded by a fully connected network, which is described by
To further improve the performance of the TCN, a gating mechanism is introduced to control the flow of information through adjacent layers of the TCN. For this reason, the outputs
2) Graph Convolutional Network: GCN extends the convolution operation from Euclidean to non-Euclidean spaces. The GCN operation can be done in spectral and spatial space. Spectral-based approaches treat the convolution operation as a filtering process using a specially designed filter; however, this method is limited to undirected graphs and cannot process the directed graph constructed by the load information of EV charging stations. Spatial-based approaches formulate the convolution operation as a process of gathering feature information from the neighbors of the target node, aggregating this feature information with its own node features, then the target node gets the new feature information. In addition, compared to spectral-based approaches, spatial-based approaches are more intuitive interpretations and have been widely used due to their high efficiency in spatial-temporal modeling.
The authors of [34] proposed a diffusion convolutional network to construct spatial correlations between nodes in directed graphs and considered that graph convolution is a diffusion process in which the information between adjacent nodes in the graph is transferred with a certain probability. The characteristic information of the directed graph of the EV charging station load is modeled by the K-step diffusion process, and the diffusion convolution is generalized as follows:
In this paper, after capturing the temporal dependence of EV charging station loads using a TCN, the output result
3) Transformer Network: To further enhance the ability to capture global feature information of the load forecasting model, a Transformer Network [35] is integrated into the model. The Transformer network is composed of two main elements: the multi-head attention module and the feedforward network. In the Transformer model, each set of calculations takes query
The multi-head attention mechanism can simultaneously pay attention to the spatial information of multiple different locations, capture the strong correlation between information and extract important features [35]. To this end, the queries, keys, and values are projected h times linearly with the different learnable linear projections. After each projection, the attention value is calculated. In practice, different attention values are calculated in parallel. These attention values are concatenated for linear projection, and finally, new attention values are calculated. This process can be described as follows:
where
The multi-head attention layer is connected to the feedforward network, which is composed of two linear transformations and has a ReLU activation function in the middle; the formula is as follows:
The Mean Absolute Error (MAE) is used as the training objective, and the loss for multi-step EV charging load forecasting is optimized. Therefore, the loss function can be defined as:
In this section, to evaluate the effectiveness of the ASTNet-T model, we performed experiments on two real-world datasets and compared our method with other traditional and state-of-the-art approaches.
Datasets
The datasets we used are historical charging load records of two EV charging stations that located in Palo Alto, USA [36] and Dundee, Scotland [37]. The datasets contain various metadata about charging transactions, such as the geographic location of charging stations, the charging time, energy consumption, charging amount, etc.
Datasets summary information
Datasets summary information
Palo Alto dataset: This dataset includes the historical EV charging records of 53 charging stations in the city of Palo Alto, USA, from 2011 to 2020. Considering the number of charging stations varies over a long time interval, which needs a dynamic graph to capture the evolution of spatial correlations of EV charging stations, which is the future work beyond the scope of this paper, we select the historical data from January 1, 2018, to December 31, 2020, to train and evaluate the proposed model and assume that the number of EV charging stations remained unchanged during this period. During the data preprocessing phase, some charging stations missing a large amount of metadata are filtered out. Finally, 35 EV charging stations in the dataset are retained as nodes in the graph. The original adjacency matrix on the node graph is built by using the latitude and longitude of the geographical location of each charging station. Historical charging records for each charging station are aggregated into 1-day steps.
Dundee dataset: This dataset contains the historical EV charging records of 57 charging stations in the city of Dundee, Scotland, from 2017 to 2018, and the charging records of 50 charging stations from September 1, 2017, to September 6, 2018, are selected. To visually show the charging load characteristics of the EV charging stations, three charging stations are randomly selected, and their charging load curves are shown in Figure 4. As shown in this figure, the EV charging load curve has significant periodicity for every charging station in both the Palo Alto and Dundee datasets. The periodicity is related to the cycles of people’s weekdays and weekends.
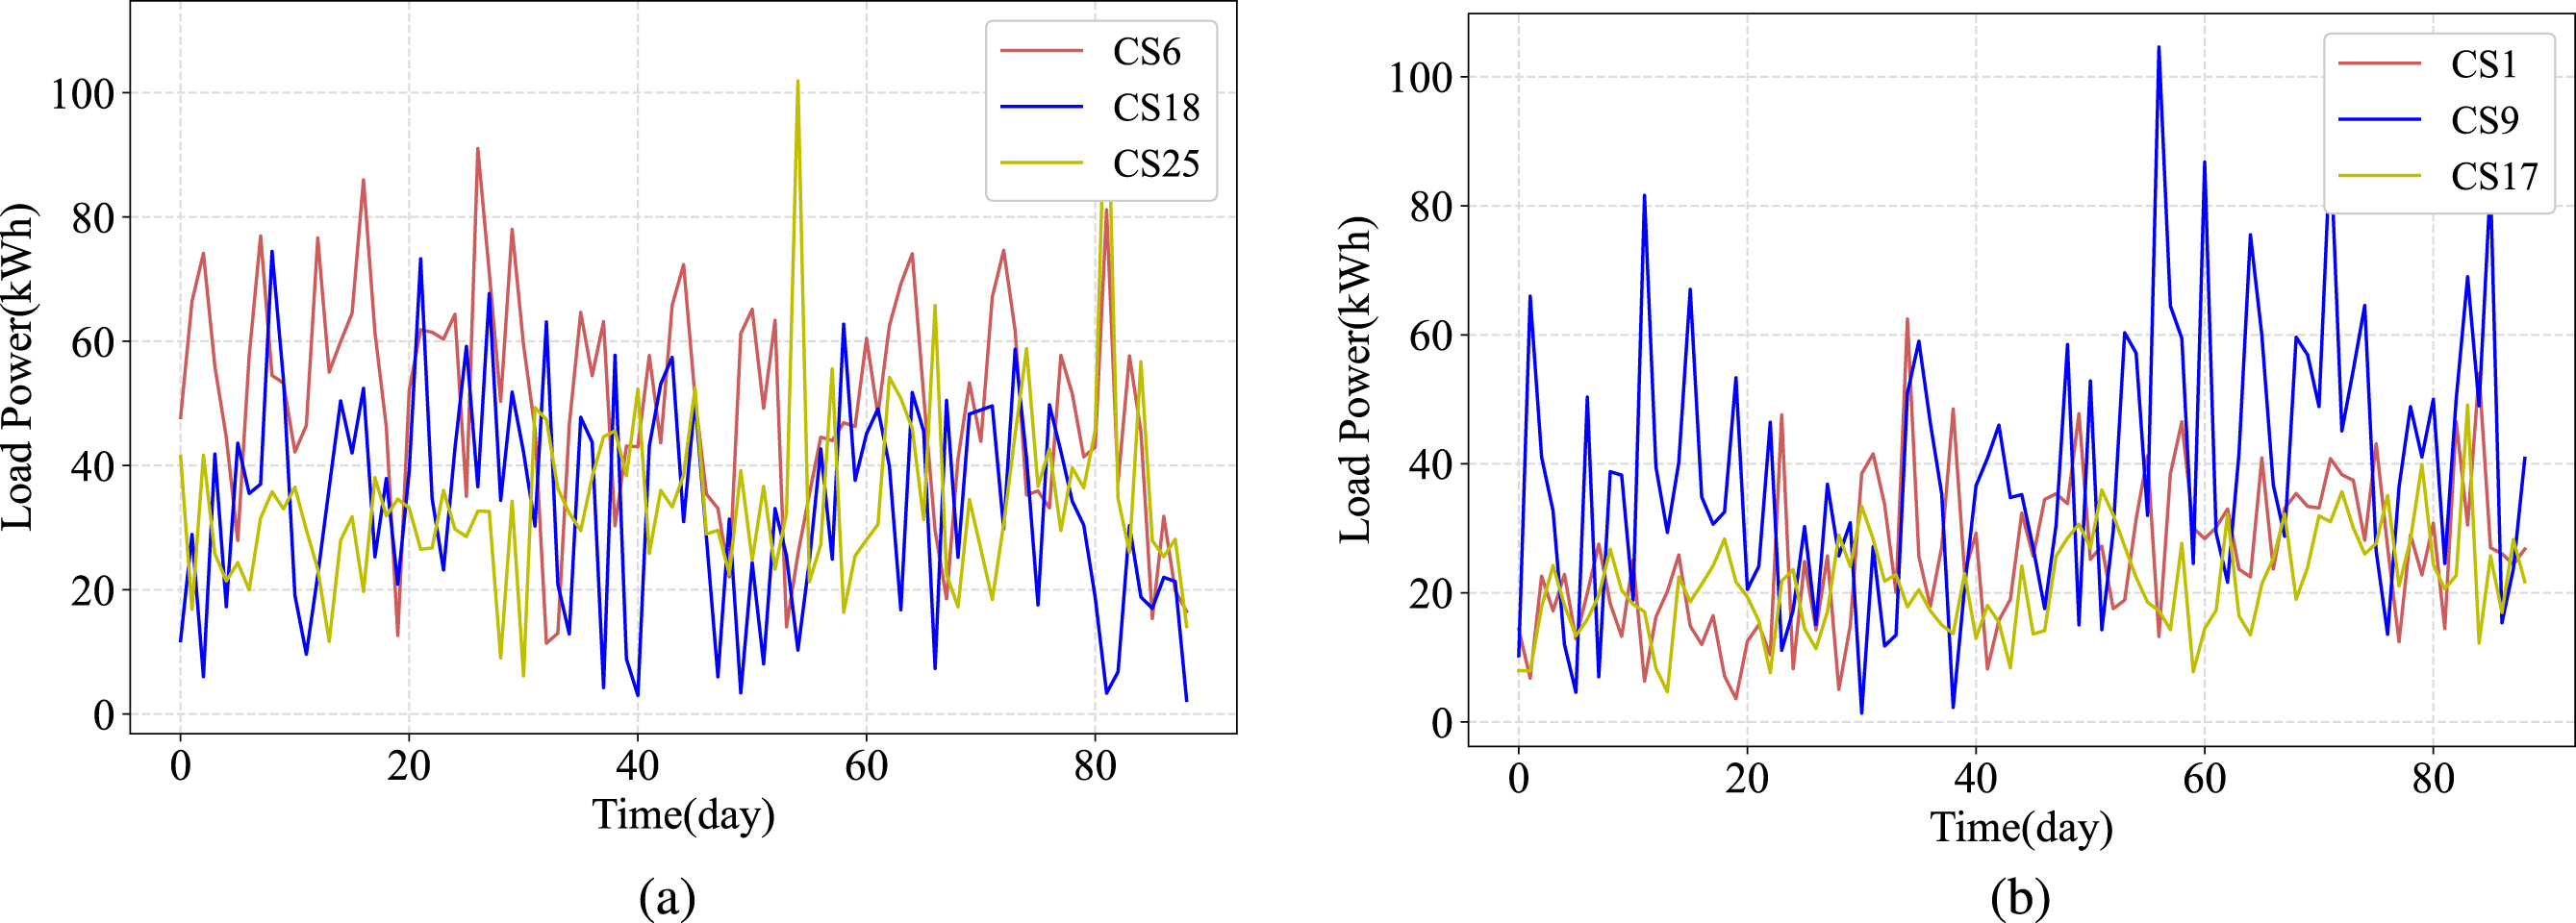
Charging load curves of charging stations.(
Both datasets are chronologically divided, of which 70% is used for training, 10% for validation, and 20% for testing.
All programs are coded using Python language on a computer with Windows 10, a 64-bit operating system, and a CPU with 11th Gen Intel (R) Core (TM) i9-11900K @ 3.50GHz. All experiments use the data on the EV charging load in the last 12 time steps to forecast the EV charging loads over 3, 6, and 12 time steps in the future, respectively, i.e., S = 12 and T = 3,6,12. For the Palo Alto dataset, the Adam optimizer is used to train our model; the initial learning rate is 0.0001, weight decay is 0.0001, and batch size is 32. To alleviate overfitting and achieve regularization, the dropout is set to 0.3. For the Dundee dataset, the optimizer, weight decay, and batch size are the same as the Palo Alto dataset, the initial learning rate is 0.001, and the dropout is 0.5. All experimental hyperparameters, including the baseline model, are adjusted based on the performance of the model validation dataset [38, 39]. All models are trained independently on two datasets. For each dataset, the training dataset is used to train models, the best models are selected based on the performance on the validation dataset, and finally, these models are tested on the test dataset; the results are reported and compared to other traditional approaches and state-of-the-art approaches.
The main parameters in ASTNet-T model
The main parameters in ASTNet-T model
There are many learnable parameters in our model, and using the end-to-end method to train our model is inefficient. Therefore, our model was trained according to the two-stage-training strategy proposed in [32]. Specifically, in the first stage, the macro-level graph structure was optimized; in the second stage, the whole model ASTNet-T was trained based on the well-trained macro-level graph structure. If readers are interested in this training strategy, they can refer to [32] for a detailed description.
To evaluate the performance of the ASTNet-T model and facilitate comparison to other methods, three metrics commonly used in EV charging load prediction are chose, including mean absolute error (MAE), mean absolute percentage error (MAPE), and root mean square error (RMSE). These metrics are defined as follows:
To comprehensively evaluate the performance of our prediction methods, several different prediction methods are selected as baseline comparison models, including traditional approaches and state-of-the-art approaches.
• Historical Average (HA) method [40]: The method models the EV charging load to be a periodic process and calculates the average of the prior periods as the predicted result.
• Vector Autoregressive model (VAR) [41]: It is a classical and easy-to-use model for the analysis of multivariate time series. It is an extension of the univariate autoregressive model.
• Diffusion Convolutional Recurrent Neural Network (DCRNN) [42]: A model that captures the spatial correlation by means of bidirectional random walks on graph and extracts the timing information using an encoder-decoder architecture.
• Graph WaveNet [43]: It combines diffusion convolutions and adaptive adjacency matrices to extract spatial dependencies and uses dilated causal convolutions to handle temporal dependencies.
• Ada-STNet [32]: It adaptively derives the optimal node graph with fully considering node features and captures hidden spatial correlations and complex temporal dependencies by the GCN layer and the dilated causal convolution network, respectively.
Among these baseline models, HA and VAR are traditional approaches, and DCRNN, Graph WaveNet, and Ada-STNet are state-of-the-art approaches. As mentioned above, the model we proposed in this paper is named ASTNet-T.
Result analysis
Table 3 presents the comparison of the proposed ASTNet-T and the five baseline models for 3 days, 6 days, and 12 days ahead of EV charging station load forecasting performance on the Palo Alto and Dundee datasets. As shown in Table 3, ASTNet-T outperforms other baseline models concerning all metrics for all forecasting horizons in two datasets.
Performance comparison of EV charging load forecasting with different models
Performance comparison of EV charging load forecasting with different models
Compared with the traditional approaches, the prediction errors of the state-of-the-art methods are reduced by order of magnitude, except for DCRNN. Even if taking the MAE of HA, VAR, and DCRNN on the Palo Alto dataset as an example, compared to HA and VAR, the MAE of DCRNN is reduced by 53.95% and 47.91%, respectively. The superiority of DCRNN is still very significant. The reason behind this can be attributed to the fact that the state-of-the-art methods consider not only the time dependences but also the spatial correlations between different EV charging stations, whereas the traditional approaches have only considered the time dependences. In other words, simultaneously considering the spatial correlations and the temporal dependences is very beneficial to improving the accuracy of the forecasting model.
Although DCRNN, Graph WaveNet, and Ada-STNet are all state-of-the-art methods, the prediction errors of DCRNN are an order of magnitude larger than that of Graph WaveNet and Ada-STNet. For the MAE metric on the Palo Alto dataset, the MAEs of Graph WaveNet and Ada-STNet are 71.38% and 75.08% smaller than that of DCRNN, respectively. The result remains the same on the Dundee dataset, the MAEs of Graph WavenNet and Ada-STNet are 91.21% and 90.90% smaller than those of DCRNN. All these three models use GCN to capture the spatial correlations of EV charging stations; however, when capturing the temporal dependences, DCRNN uses an encoder-decoder architecture, while Graph WaveNet and Ada-STNet employ dilated causal convolutional network. According to the results of the experiment, we can conclude that in terms of EV charging load forecasting in this paper, the dilated causal convolutional network is more efficient than the encoder-decoder architecture with scheduled sampling.
In addition, we compare the performance of ASTNet-T with several baseline methods. Take the prediction error MAE on the Palo Alto dataset as an example, compared to HA and VAR, the MAE of ASTNet-T is 98.08% and 97.84% lower than these two classical methods. In addition, compared to the state-of-the-art methods DCRNN, Graph WaveNet, and Ada-STNet, the MAE of ASTNet-T on the Palo Alto dataset is 95.85%, 85.48% and 83.33% smaller, respectively. ASTNet-T and Ada-STNet use the same method to derive the optimal node graph, and the spatial correlations and temporal dependencies are all captured by GCN and dilated causal convolutional network, respectively. However, we integrate a Transformer into our model to capture more complex long-term spatial-temporal dependencies. On the basis of the performance comparison, we can conclude that the integrated Transformer is effective.
To observe more clearly the performance of ASTNet-T with DCRNN, Graph Wavenet, and Ada-STNet, Figure 5 shows the predicted values of the four models and the ground truth values for the first 6 and 12 days of the test data. It can be seen that all of the models can reflect the changing trends in the actual charging demand. However, compared to other models, the prediction accuracy of DCRNN is significantly lower due to its failure to efficiently capture the fluctuation of charging demand, while ASTNet-T, Graph WaveNet, and Ada-STNet successfully capture the fluctuation by constructing an adaptive graph structure and get a higher prediction accuracy. Additionally, the prediction accuracy of ASTNet-T is the highest regardless of the length of the prediction horizon and the dataset used. Particularly, taking the 6-days-ahead predicted values of ASTNet-T and Ada-STNet on the Palo Alto dataset as an example, the predicted EV charging load curve by ASTNet-T almost coincides with the ground truth curve, while the difference between the curve predicted by Ada-STNet and the ground truth curve is very significant. Compared to Ada-STNet, the performance improvement of ASTNet-T can be attributed to the integration of the Transformer network, through which the global spatial-temporal dependencies can be efficiently captured.
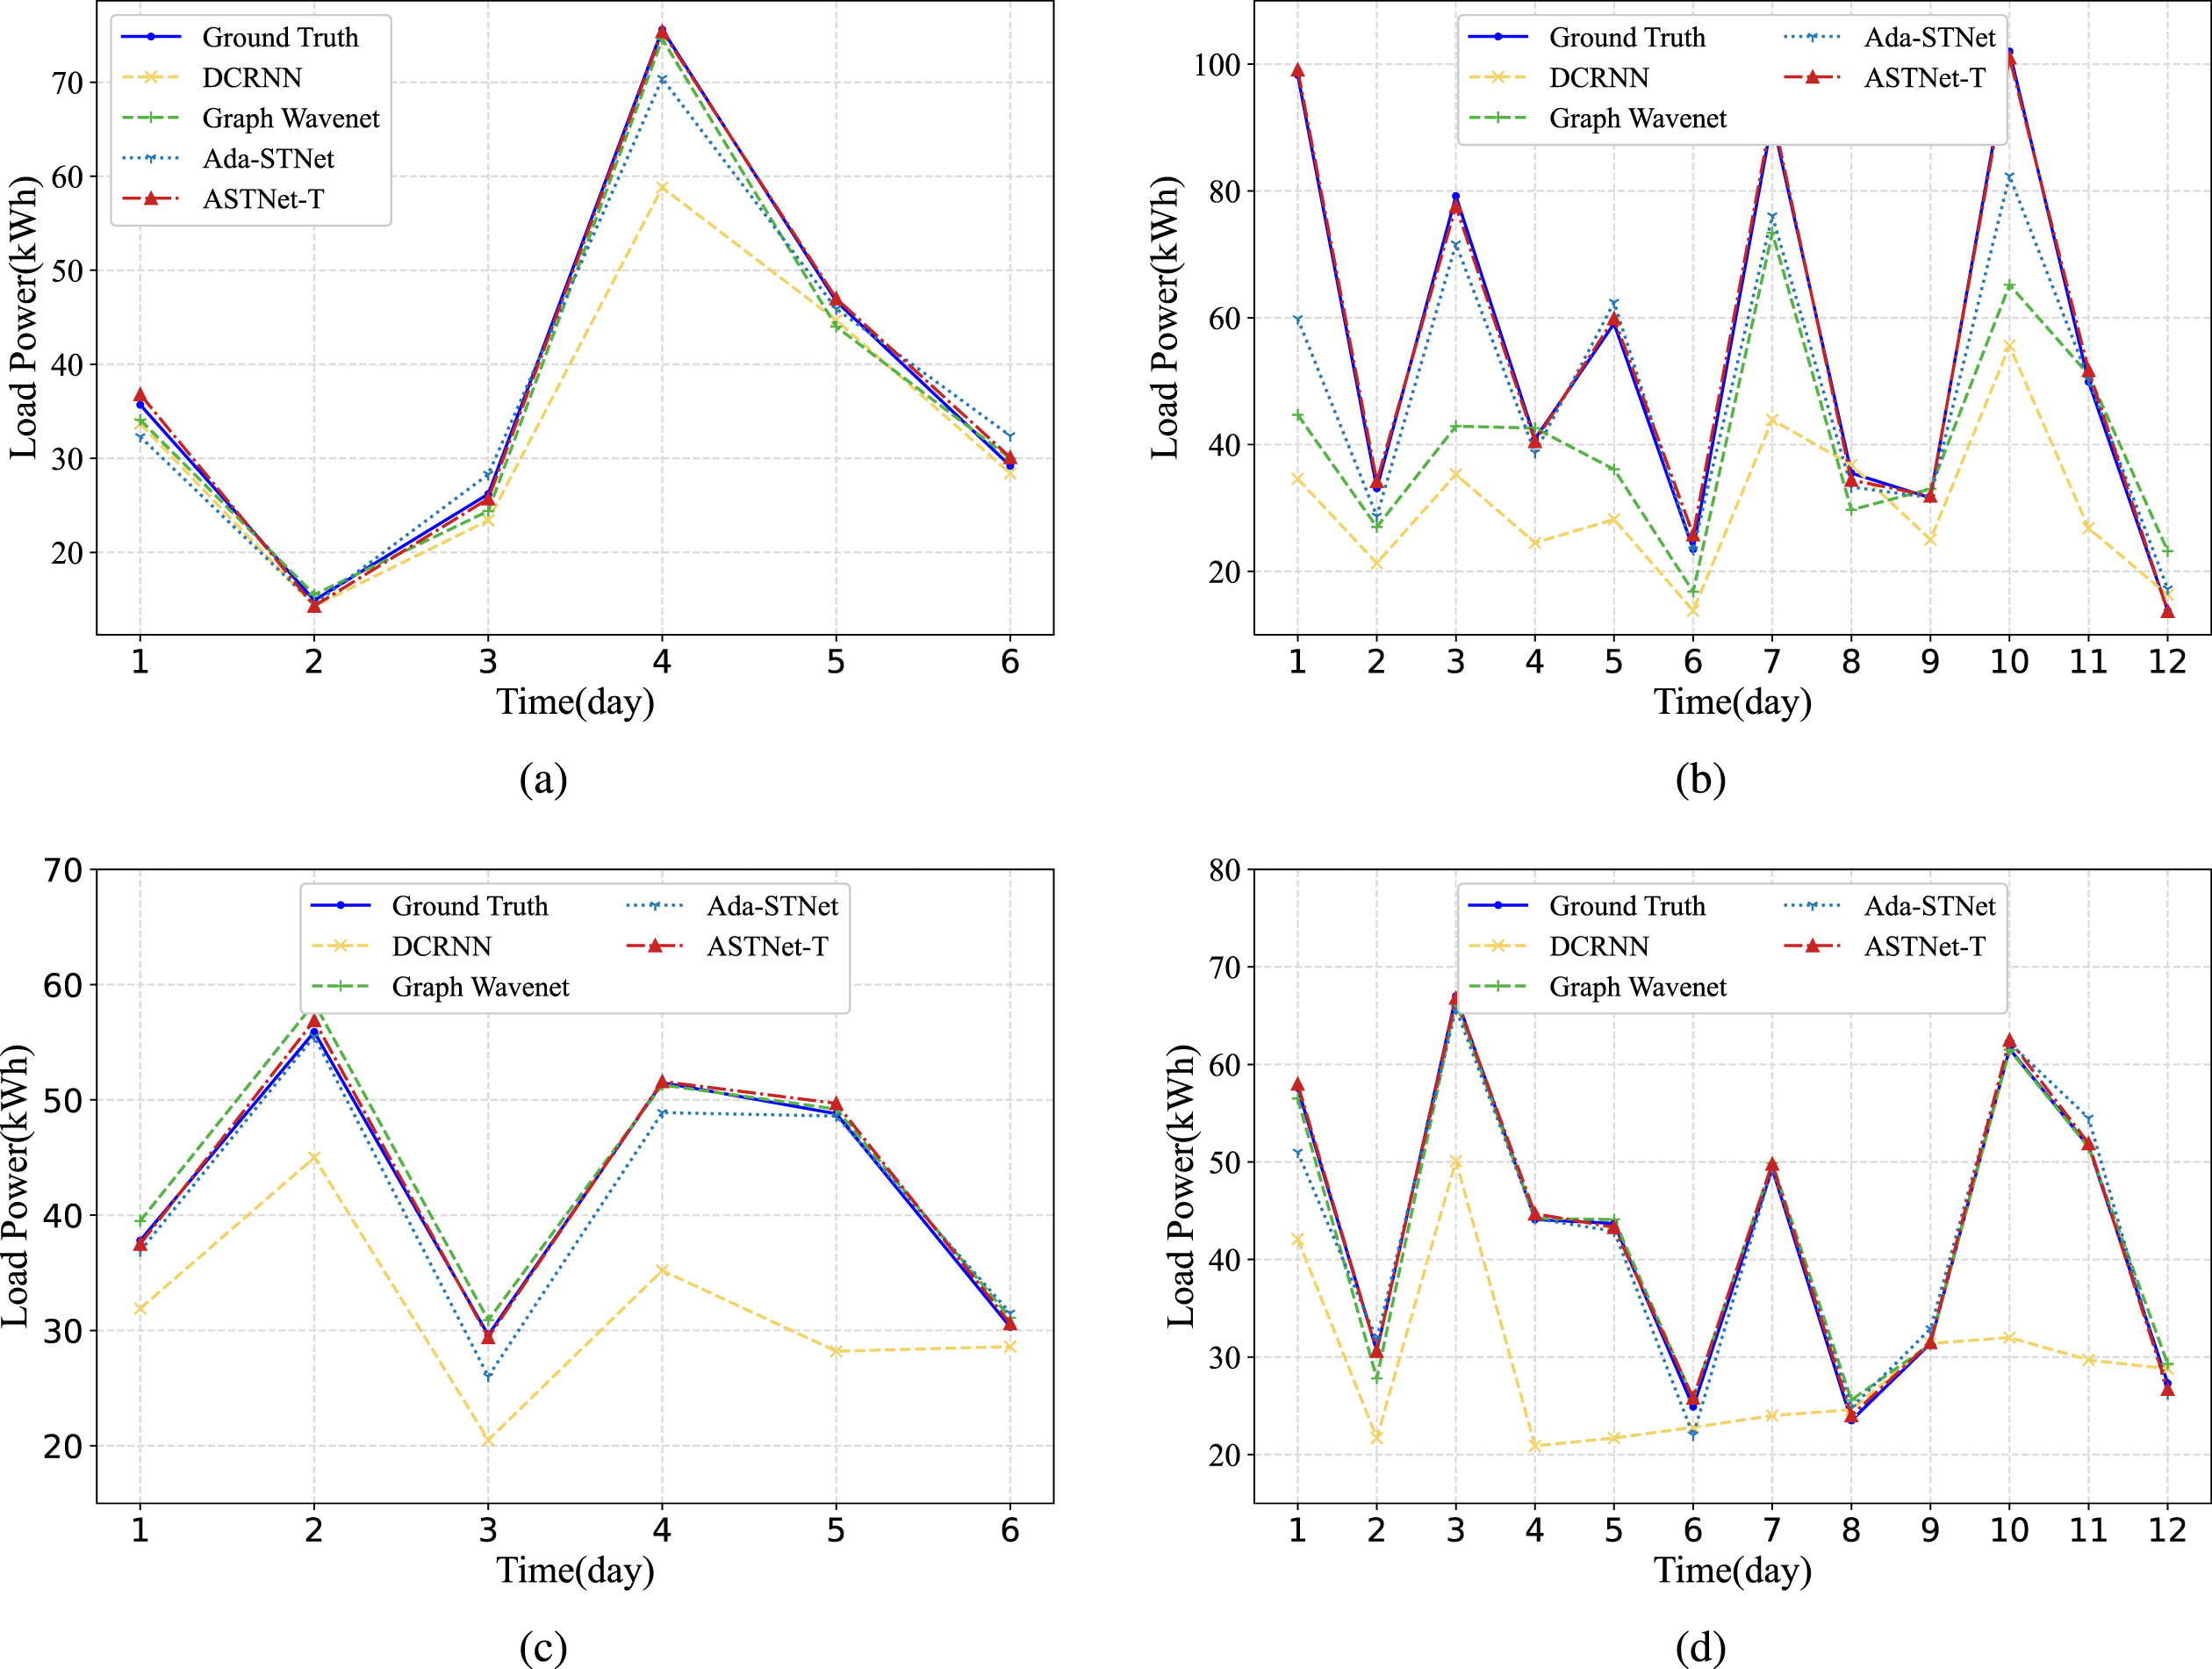
Performance comparison of several methods during different forecasting horizons on Palo Alto and Dundee datasets. (
To verify the effect of each module in the ASTNet-T model on the performance of the experiment, ablation experiments were performed on the Palo Alto dataset. Ma-STNet only considered the macro adjacency matrix when constructing the graph. The difference between Ada-STNet and ASTNet-T is that the former has no Transformer network. The performance comparison of these three different methods is shown in Figure 6. According to Figure 6, ASTNet-T achieved the lowest MAE, MAPE, and RMSE compared to other models, verifying the validity of the ASTNet-T model obtained by fusing all modules. Ma-STNet yielded the largest testing errors due to its failure to capture sudden fluctuations in spatial relationships, indicating that the optimal node graph learning module derived by fusing macroscopic adjacency matrix and microscopic adjacency matrix can capture more complex spatial-temporal characteristics among EV charging station loads, thus significantly improving the model performance. Although Ada-STNet has achieved good prediction performance by fully considering the node characteristics of EV charging stations and constructing the optimal node graph to capture the hidden spatial correlation. Its performance is not as good as that of ASTNet-T, which introduces a Transformer network in multistep spatial-temporal EV charging load forecasting module capable of extracting to global spatial-temporal dependent characteristics. From the ablation study, we conclude that all key components of ASTNet-T are effective and play an integral role in predicting the charging load of EV charging stations.
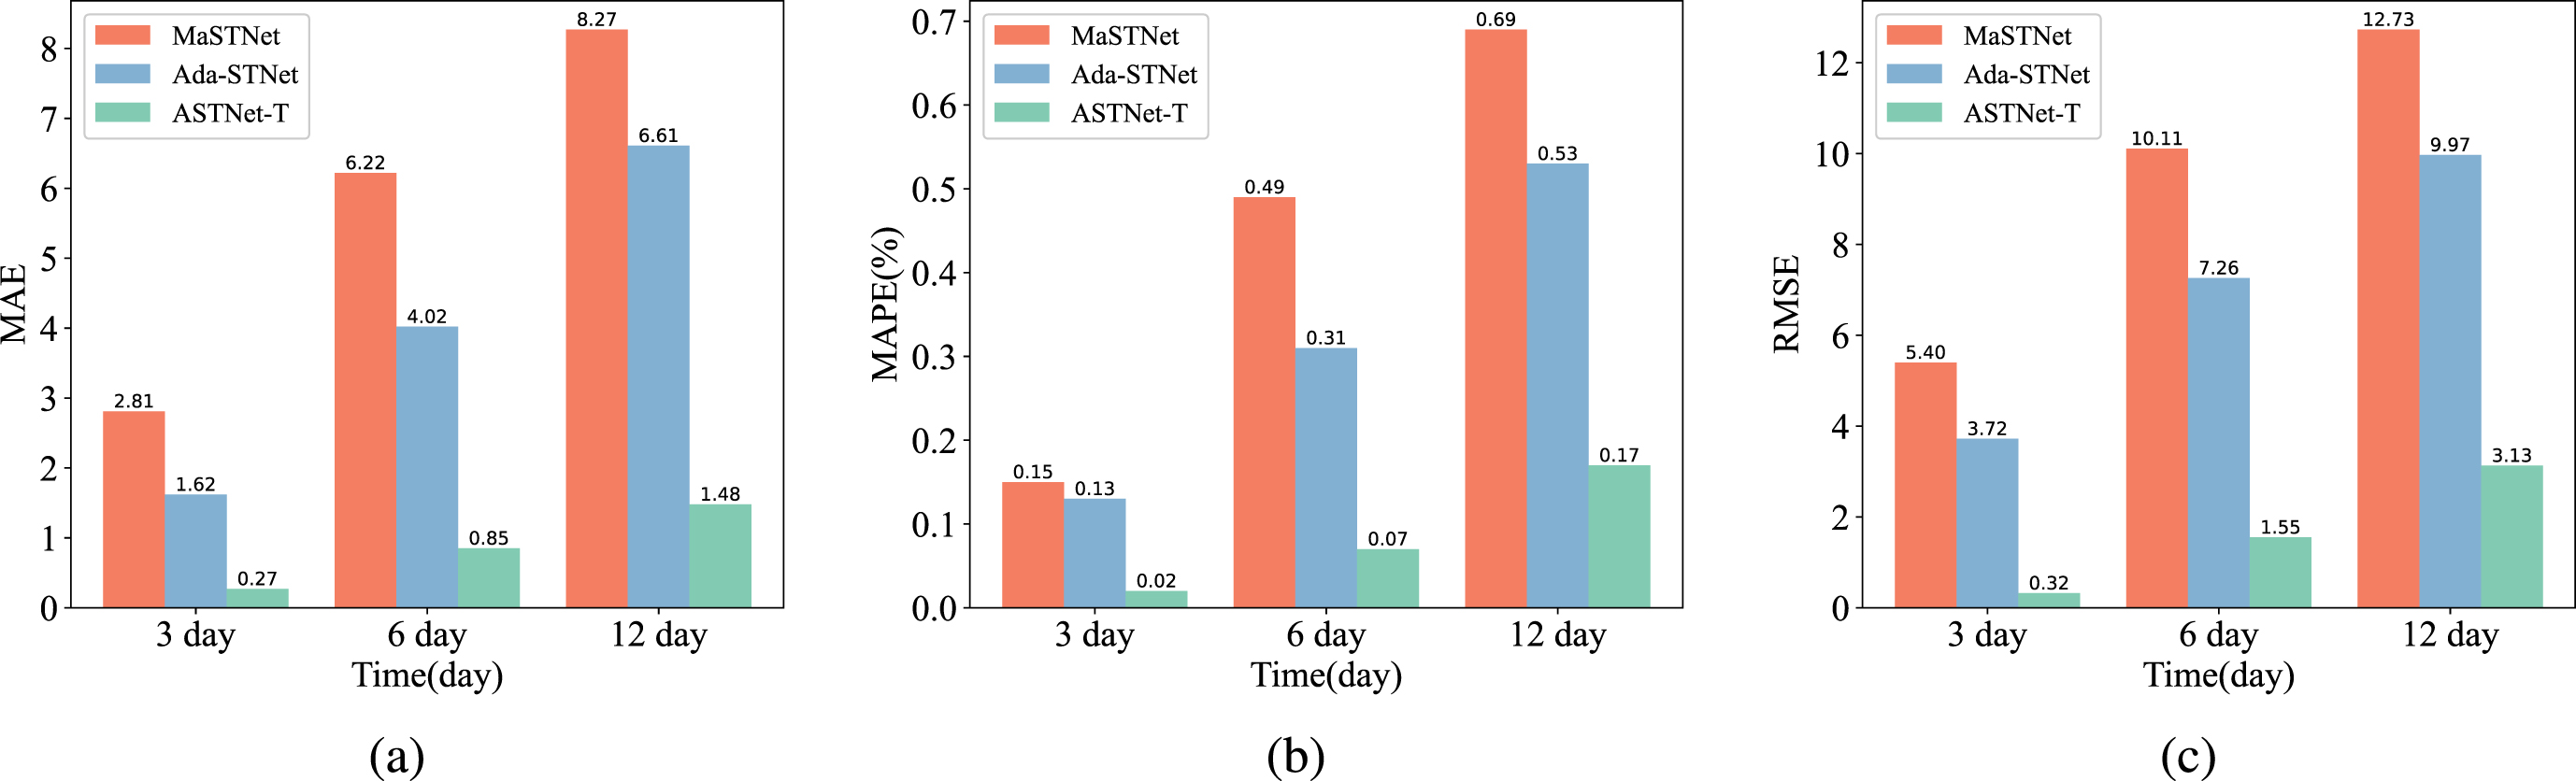
Experimental performance comparison of different modules in the model on the Palo Alto dataset. (
To evaluate the robustness of ASTNet-T, two different Gaussian noises were added to the test data, and the MAE, MAPE and RMSE with different test data are shown in Figure 7. In this figure, ASTNet-T-0.05 and ASTNet-T-0.5 denote the test results that the corresponding test data were added (0,0 . 052) and (0,0 . 52) Gaussian noise, respectively. Figure 7 shows that although two different noises were added to the test data, the test loss did not change significantly in both datasets.Therefore, it can be demonstrated that ASTNet-T has good robustness.
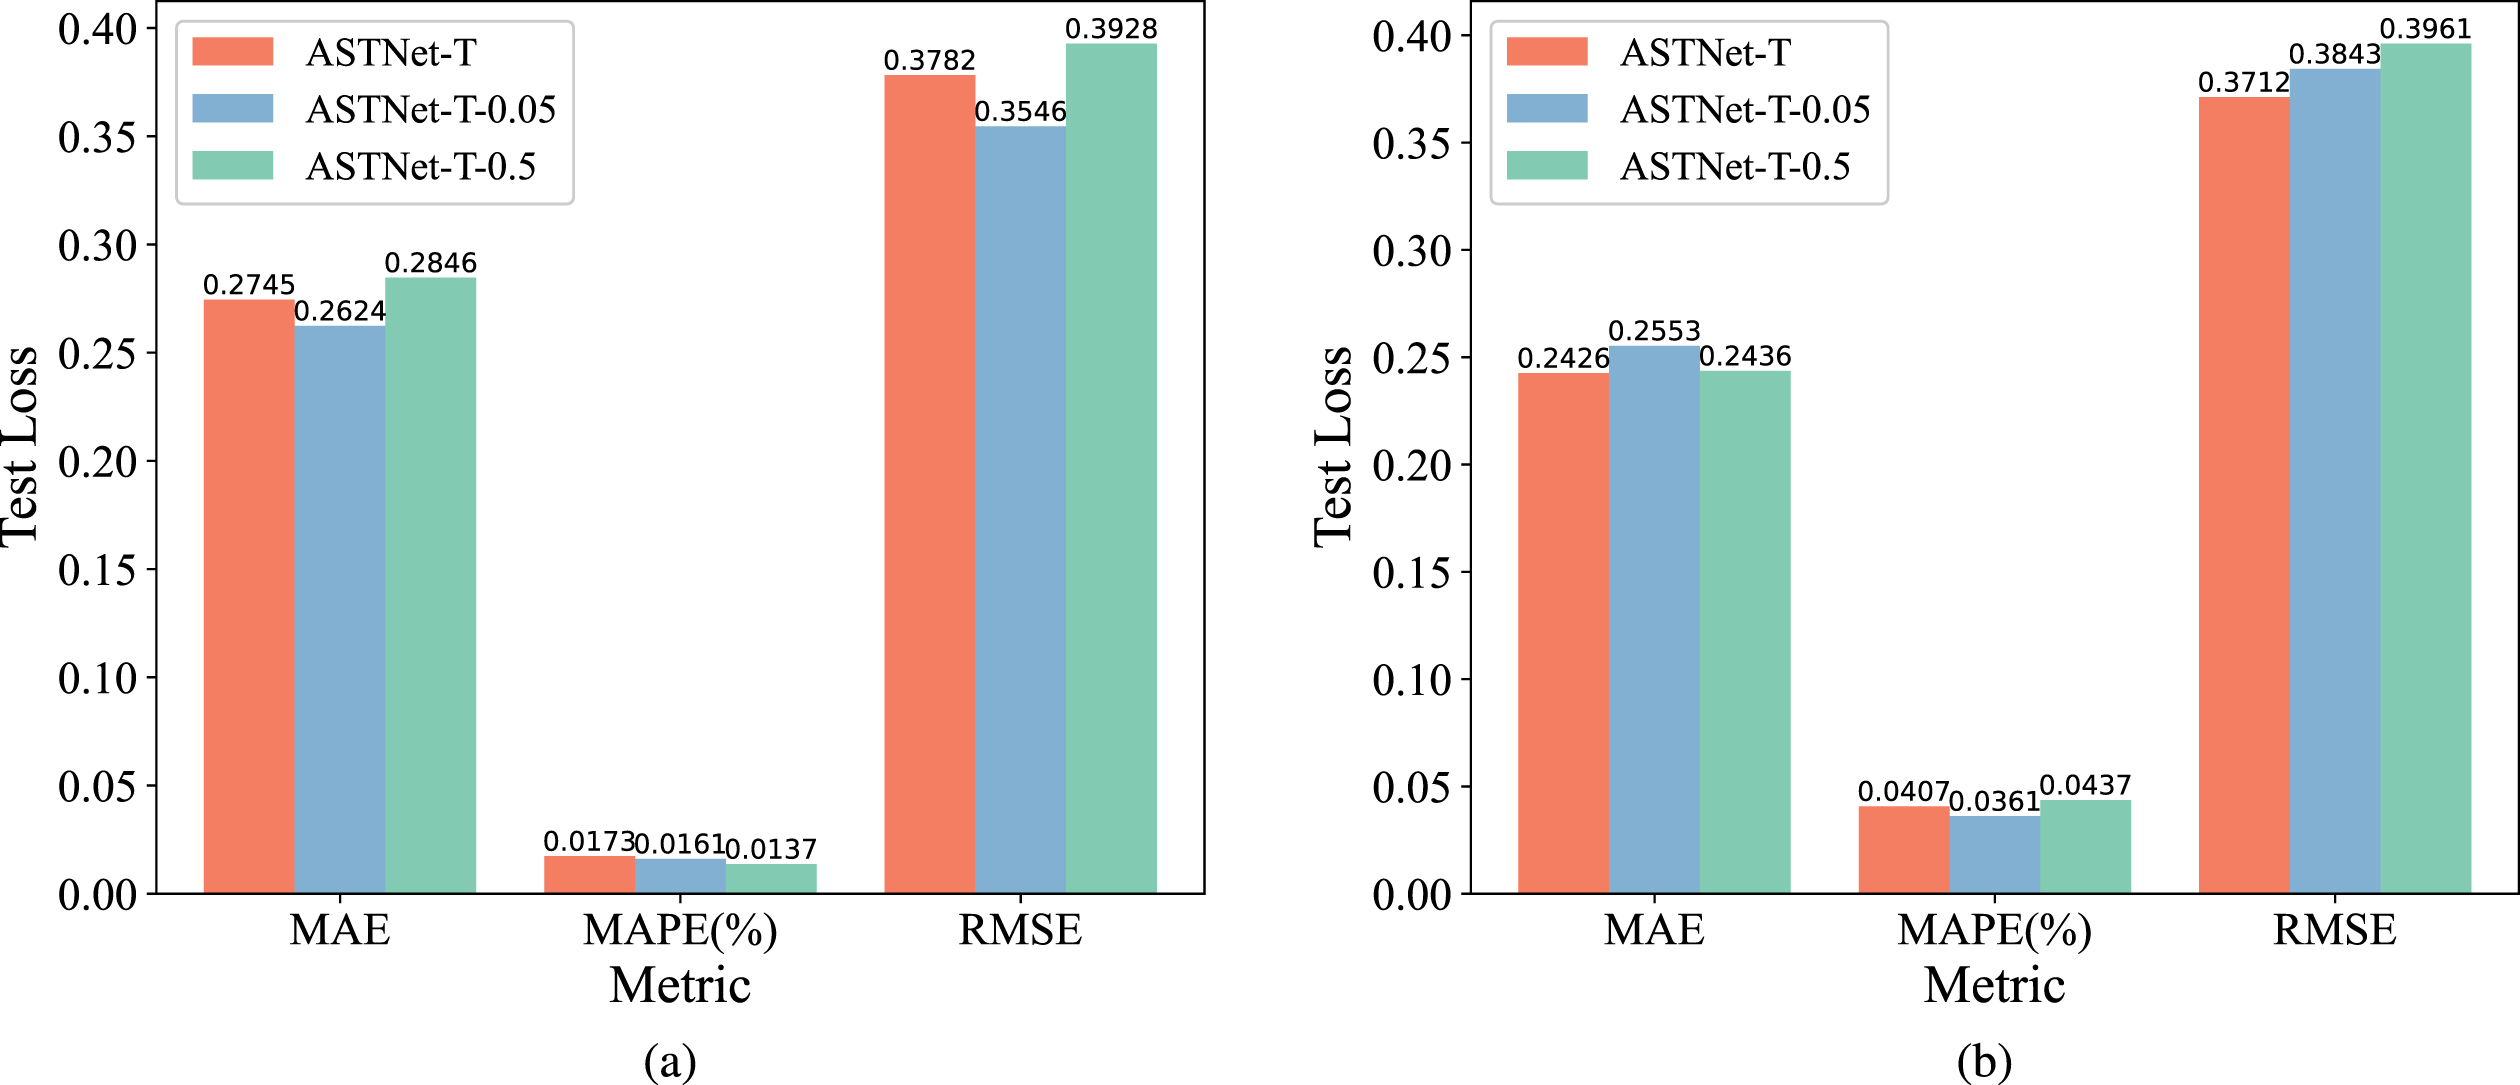
Model training results with different noises in different dataset. (
This paper proposes a load forecasting framework based on ASTNet-T for EV charging stations. To efficiently capture the spatial correlations in charging stations, an optimal node graph was adaptively derived considering both the macro-level and micro-level information. Based on the derived optimal node graph and historical EV charging load data, the spatial correlations and temporal dependences in EV charging stations were captured by stacked spatial-temporal blocks; a Transformer network was utilized to further capture the global spatial-temporal dependencies. Finally, the predicted future multi-step EV charging load was output using a fully connected neural network. The proposed model has been proven to be valid in numerous experiments. 1) ASTNet-T and baseline comparison models are tested and validated in two real-world EV charging station load datasets for 3, 6, and 12 days of prediction results. In the experimental results of the Palo Alto City and Dundee datasets, the MAE value of the proposed model is improved by approximately 83% and 71%, MAPE by approximately 85% and 90%, and RMSE by approximately 90% and 67% compared to the suboptimal baseline model, which verifies the superiority of the proposed method in predicting the charging load of EVs. 2) The ablation experiment verifies that the transformer network in the ASTNet-T model can effectively improve the accuracy of the prediction. In the experimental results of the Palo Alto City dataset, the MAE value of the model with Transformer network in the prediction of 3, 6, and 12 days improved by approximately 83%, 79% and 78%, respectively. 3) The robustness of the ASTNet-T model is verified by adding Gaussian noise to the experimental data.
Footnotes
Acknowledgment
This study has been funded by the Program for Science & Technology Development of Henan Province (222102210067, 232102211034, 232102241021), introduction project of the national postdoc exchange plan (YJ20220262) and National Natural Science Foundation of China (62176088).