
Abstract
Combination forecasting is an effective tool to improve the forecasting rate by combining single forecasting methods. The purpose of this paper is to apply a new combination forecasting model to predicting the BRT crude oil price based on the dispersion degree of two triangular fuzzy numbers with the circumcenter distance and radius of the circumcircle. First, a dispersion degree of two triangular fuzzy numbers is proposed to measure the triangular fuzzy numbers with the circumcenter distance and radius of the circumcircle, which can be used to predict the fluctuating trend and is suitable for crude oil futures price. Second, three single prediction methods (ARIMA, LSSVR and GRNN) are then presented to combine traditional statistical time set prediction with the latest machine learning time prediction methods which can strengthen the advantage and weaken the disadvantage. Finally, the practical example of crude oil price forecasting for London Brent crude futures is employed to illustrate the validity of the proposed forecasting method. The experimental results show that the proposed forecasting method produces much better forecasting performance than some existing triangular fuzzy models. The prediction error is reduced to 2.7 from 3–5 in oil price combination forecasting, in another comparison experiment the error is reduced to 0.0135 from 1. The proposed combination forecasting method, which fully capitalizes on the time sets forecasting model and intelligent algorithm, makes the triangular fuzzy prediction more accurate than before and has effective applicability.
Introduction
Crude oil is a natural liquid fossil fuel found in geological formations beneath the earth’s surface. It has mostly been extracted by oil drilling, which comes after the studies of structural geology, sedimentary basin analysis, and reservoir characterization [1]. Crude oil is one of the most important energy resources on earth. So far, it remains the world’s leading fuel, with nearly one-third of global energy consumption.
There are three major reference crude oil prices in international crude oil market, WTI Crude Oil Futures of NYMEX in America, Brent Crude Oil Futures of Royal Exchange, and Dubai Reference Oil in Middle East, in which, the influence of Brent Reference Oil is the strongest in international market, and about 70% of spot crude oil trading pricing is based on Brent scale [2], so this paper will focus on predicting Brent oil.
The world’s environment is affected by the oil price falling. With the drop of oil prices, the fuel bills are lowered. As a result, consumers are very likely to use more oil and thus increase the carbon emission. In addition, there is less incentive to develop renewable and clean energy resources. On the other hand, sustained low oil prices could lead to a drop in global oil and gas exploration, exploitation activities [3].
Fluctuating oil prices also play an important role in the global economy [4]. The fall in oil prices would result in a modest boost to global economic activity, although the owners of oil sectors suffer income losses. Owing to COVID-19, a considerable drop has been observed in international crude oil markets. Indeed, energy prices have known a declining tendency owing to the fall of energy demand following containment [5, 6]. To sum up, oil price forecasting is of great significance in political, economic and environmental aspects, so further research on oil price forecasting is needed to benefit all parties. Many methods have been developed for oil price prediction. Crude oil price forecasting approaches can be divided into three categories: (1) heuristic approaches; (2) statistical models; and (3) machine learning techniques.
Heuristic approaches for oil price prediction include professional and survey forecasts, which are mainly based on professional knowledge, judgments, opinion and intuition. Another heuristic approach, the so-called no-change forecast, uses the current price of oil as the best prediction of future oil prices. Despite its simplicity, the no-change forecast appears to be a good baseline approach for oil price prediction and is better than other heuristic judgmental approaches[7].
Statistical models are the most widely used approaches for oil price prediction, which include autoregressive moving average (ARMA) models and vector autoregressive (VAR) models, with possibly different input variables [8]. These statistical models provide more accurate prediction than the no-change model at least at some horizons. Recently, a combination forecasting approach is proposed by Baumeister and Kilian [9], which combines 6 different oil price prediction models including both statistical models (such as the VAR model) and the no-change model. It should be noted that most of the statistical models are linear models and are not able to capture the nonlinearity of oil prices. In recent years, deep learning methods have attracted extensive attention owing to their excellent performance in terms of prediction accuracy and stability [6, 10–13]and several machine learning techniques are proposed for oil price prediction, such as artificial neural networks (ANN) [14], and support vector machine (SVM)[15]. These are nonlinear models which may produce more accurate predictions if the oil price data are strongly nonlinear [16]. However, these machine learning techniques, like other traditional machine learning techniques, rely on a fixed set of training data to train a machine learning model and then apply the model to a test set. Such an approach works well if the training data and the test data are generated from a stationary process, but may not be effective for non-stationary time series data such as oil price data. At present, Theerthagiri and Ruby [17] proposed seasonal learning based on ARIMA algorithm for prediction of Brent oil trends, Kim and Jang [18] integrated a convolutional neural network and a recurrent neural network with skip connections to predict petroleum price, Lazcano et al. [19] combined the characteristics of a graph convolutional network (GCN) and a bidirectional long short-term memory (BiLSTM) network to forecast the price of oil. These methods of statistics and machine learning still have the problems mentioned above. In recent years, decomposition-reconstruction methods have been used to predict oil price, Guliyev and Mustafayev [20] proposed some statistical ensemble methods such as adaptive boosting (Adaboost) to predict oil price. Zhang et al. [21] proposed a hybrid GRU neural network based on decomposition-reconstruction methods to predict oil price, Zhao et al. [22] proposed a hybrid wavelet decomposer and ARDL-SVR ensemble model to forecast oil inventory changes with Google trends. These decomposition-reconstruction methods deconstruct the time series and then make the forecast, which makes the original complex data better to forecast. However, these methods forecast the real number but the oil price fluctuates within an interval every day, while the real number forecast has very insufficient information for the futures market.
Figure 1 shows the volatility of BRT oil prices over 10 years. Due to the high volatility of oil prices [23], it remains one of the most challenging forecasting problems. So previous studies conducted on real numbers are not applicable to these data. In the fuzzy environment, triangular fuzzy numbers are a common expression form for uncertain information, which compensate for the lack of real numbers and interval numbers. Thus, it is natural to develop a triangular fuzzy sets forecasting method for the crude oil price forecasting. Zeng et al. [24] proposed a triangular fuzzy sets forecasting method based on the grey model and neural network. However, the essence of grey model is matching the raw sets with an exponential type curve, and its prediction curve is a smooth curve which gives expression to the development trend of the sets, so the grey model cannot predict the fluctuating trend of the sets effectively. Recently, Zhang and Chen [25] used the IOWA operator to build a multi-objective combination forecasting model based on the correlation coefficients of corresponding area sequence and gravity center sequence of triangular fuzzy numbers, and the model is transformed into a single objective programming model by bringing in the importance parameter. However, this method can only be used to deal with symmetric triangle fuzziness, which is a special kind of triangle fuzziness and cannot be adapted to all triangular fuzzy numbers, especially in crude oil price prediction. It cannot be simply found the midpoint of two numbers to become the medium point of triangular fuzzy numbers, because this obviously cannot explain the relationship of membership degree of triangular fuzzy numbers. Thus, an interesting and important issue to be solved is how to establish a model suitable for arbitrary triangular fuzzy numbers. Up to now, there has been no research about this issue.
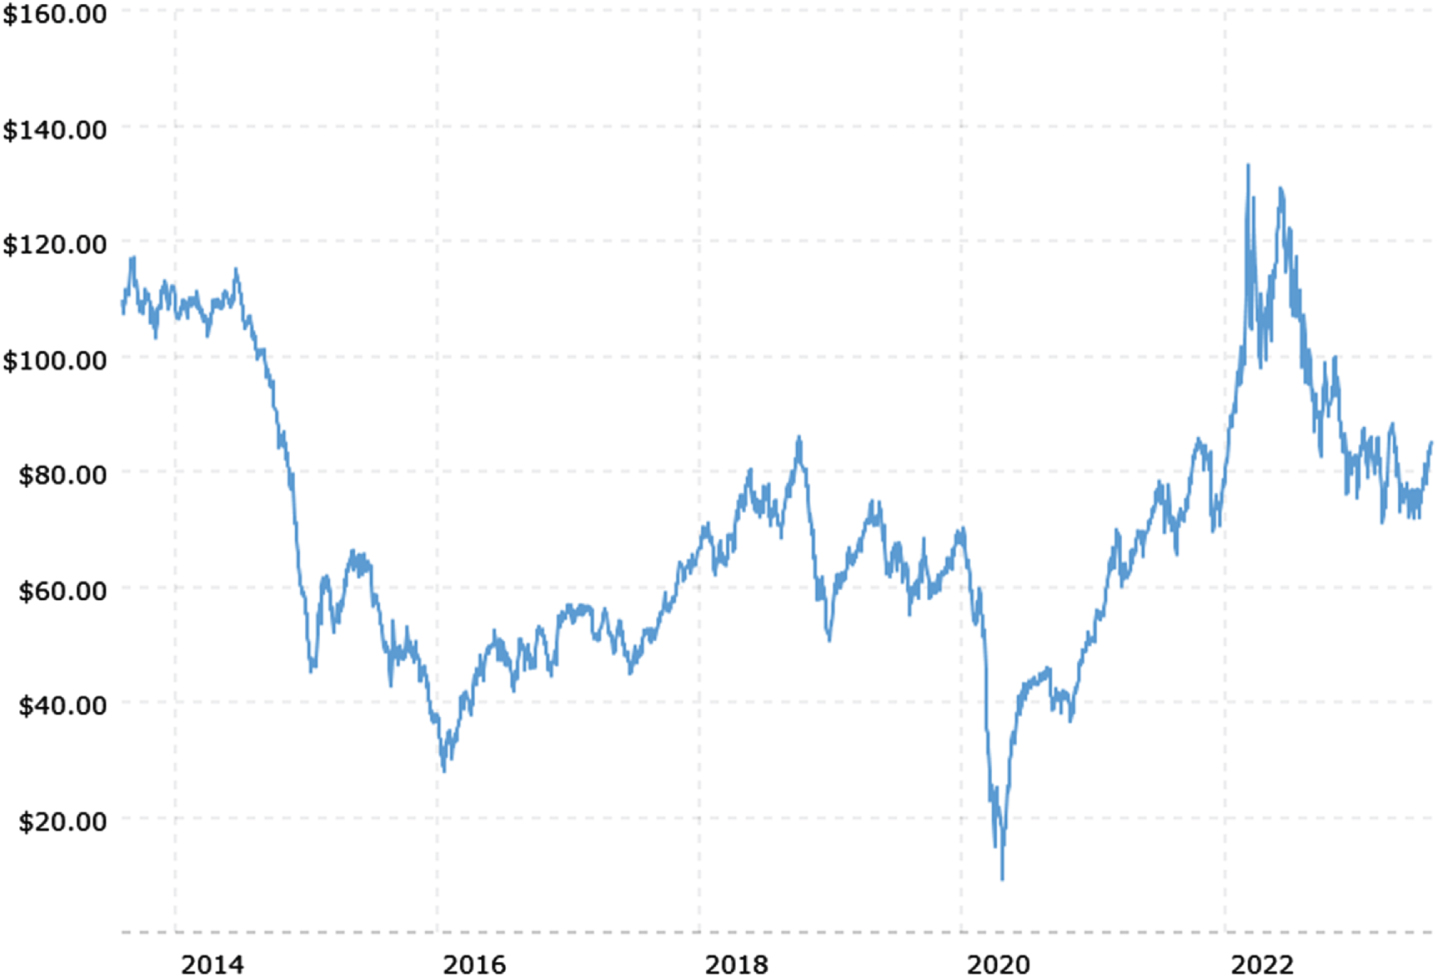
The high volatility of oil prices.
The combination forecasting is proposed by Bates and Granger for the first time in 1969 [26]. It is an appropriate weighted average of single forecasting methods which form the optimal planning problem in one of criterion, arriving at the optimal solution of the original question is the weighting factor, so that we can take full advantage of effective information of various single prediction method, improving the accuracy of prediction and providing a basis for science analysis. Combination forecasting method can overcome the limitation of single method and is widely used [27]. In the field of aviation, Guo et al. [28] used double-level combination approach for demand forecasting of repairable airplane spare parts. In the energy field, Perera M et al. [29] carried on multi-horizon distributed solar PV power forecasting with combination forecasting approach. And in environmental protection, Wang et al. [30] used a combination forecasting model to forecast port pollutant discharge. The key question of combination forecasting method is how to find the weighted average coefficients and increase forecasting precision more effectively [31]. Zhou et al. [32] proposed a model based on CMBCF to dynamically determine weights and Valle Dos Santos et al. [33] used horizon-optimized weights, i.e., weights that may vary over the forecasting horizon. In recent years, time series decomposition has been carried out in combination forecasting to study decomposition integration [34]. With the update of combination forecast, it has developed from real number type to interval type, but triangular fuzzy type is rarely mentioned. This paper also hopes to further popularize triangular combination forecasting.
From the literature review, there is no literature comparing the difference between two triangular fuzzy numbers and building an effective model based on it for application to the best of our knowledge. Second, most combination forecasting models are only applicable to point-valued or interval-valued time series [34] and triangular fuzzy combination forecasting models need to be further developed. Third, according to some existing oil price forecasting models, using a single model is no longer appropriate. The different model has different data characteristics, so it is necessary to adopt more appropriate model assumptions when forecasting it. Therefore, developing a triangular fuzzy combination method based on the difference between two triangular fuzzy numbers and proposing a new triangular-valued oil price combination forecasting model are the main tasks of this research.
In this paper, we will propose a BRT oil price combination forecasting approach based on the dispersion degree of two triangular fuzzy numbers. The dispersion degree of two triangular fuzzy numbers based on the center distance and radius of the circle model will be developed, which can predict the fluctuating trend of the triangular fuzzy sets effectively. Moreover, in order to improve the accuracy of oil price forecasting, we will use three existing efficient individual oil price forecasting methods mentioned above to make a combination forecast. Finally, an illustrated example for forecasting oil price will be used to verify the effectiveness of our proposed method. The proposed method provides a new triangular fuzzy combination forecasting framework to enrich the oil price forecasting. The contributions of this paper and the novelty of the proposed approach are summarized as follows: The distance measure between two triangular fuzzy numbers is improved, which is no longer limited to symmetric triangular fuzzy numbers, but extended to all triangular fuzzy numbers. The circumradius of triangular fuzzy numbers is introduced to construct dispersion degree which can measure the difference between two triangular fuzzy numbers better. A triangular fuzzy combination forecasting model is proposed to predict triangular-valued oil prices accurately and stably. The model is suitable for all triangular oil price data including asymmetric ones which solves the problem that triangular fuzzy numbers are difficult to explain in reality and the problem of triangular fuzzy number combination forecasting with geometry. At the same time, it provides a data processing technique for triangular-valued time series. Considering the linearity and non-linearity characteristics of the triangular-valued oil prices series, both statistical and artificial intelligence methods are involved in oil price forecasting, which can improve the performance of triangular fuzzy forecasting.
The rest of the paper is organized as follows. Section 2 introduces the basic concepts of triangular fuzzy numbers and information integration operators, also three single prediction methods are introduced. The dispersion degree of triangular fuzzy sets is defined in section 3. In section 4, the prediction model of dispersion degree for triangular fuzzy set based on circumcenter and circumradius is established. Section 5 presents two practical examples: power load prediction and Brent oil price prediction. Finally, conclusions are drawn in Section 6.
Fuzzy sets and distance measure of fuzzy sets
The concept of fuzzy set (FS) is first proposed by Zadeh [35], which is widely used in uncertain environment.
Where μ δ (x) : ξ → [0, 1] is the membership function of the fuzzy set δ and μ δ (x) ∈ [0, 1] is the membership of x ∈ ξ in δ.
The distance measures of two FSs usually used are defined as follows [36]:
the Hamming distance d h (δ, σ):
Let δ, σ, ζ be three FSs and d (sbull, sbull) be distance measure, then d (sbull, sbull) satisfies following properties [36]: d (δ, σ) ≥0. d (δ, σ) = d (σ, δ). d (δ, δ) =0. d (δ, σ) + d (σ, ζ) ≥ d (δ, ζ).
Triangular fuzzy number (TF) is a special case of FS, which is defined as follow:
Especially when a l = a m = a u , a degenerates into a real number.
For any two triangular fuzzy numbers a = (a
l
, a
m
, a
u
) and b = (b
l
, b
m
, b
u
), they have operational rules as follow: a = b ⇔ a
l
= b
l
, a
m
= b
m
, a
u
= b
u
. a ± b = (a
l
± b
l
, a
m
± b
m
, a
u
± b
u
). ka = (ka
l
, ka
m
, ka
u
) , k ≥ 0.
Harish and Rani [37] extended the fuzzy distance into the triangular fuzzy set and designed a new distance measure for symmetric FSs. The formula of the circumcenter point of the symmetric triangular fuzzy set is firstly given as follows:
then d cc (a, b) is called the distance of a and b based on circumcenter points.
As it can be seen from formula 8, the distance measure of a and b based on circumcenter points uses Hamming distance, but it is only applicable to the symmetric triangular fuzzy set, so it is needed to improve the distance measure to be applicable to the general triangular fuzzy set. The improved distance measure which is used the characteristic of triangular fuzzy numbers will be described in detail in Section 3.
(1) Autoregressive Integrated Moving Average model
Model ARIMA (p,d,q), Autoregressive Integrated Moving Average model, has the following form:
Stationary test is needed for original time series, while, if the series can’t meet stationarity condition, difference conversion can be used to make it meet the condition, which can receive the value of d in the model. Therefore, the stationarity of the sequence needs to be tested first by unit root test (this paper mainly uses ADF test).
(2) Least square support vector regression model
Least square support vector regression (LSSVR) is Suykens and Vandewalb’s improvement on support vector regression [38, 39]. Based on the standard algorithm, the least squares estimation has been introduced into the SVR algorithm. By converting the inequality constraints in the original algorithm into equality constraints, the solution of quadratic linear programming problem is changed to the solution of linear equations, which can greatly reduce the amount of calculation and improve the efficiency of operation.
There are many choices of kernel function, in this paper, radial basis kernel function.
(3) Generalized Regression Neural Network model
GRNN, Generalized Regression Neural Network is a kind of Radial Basis Function (RBF)neural network. GRNN has strong nonlinear mapping ability, flexible network structure and high fault tolerance and robustness, which is suitable for solving nonlinear problems. GRNN has stronger advantages than RBF network in terms of approximation ability and learning speed. The network finally converges to the optimized regression surface with large sample size accumulation, and the prediction effect is also better when the sample data is small. In addition, the network can handle unstable data [40].
Single prediction methods can be replaced, such as Adaboost Bagging SVR, etc. The specific application of the above three methods will be discussed in detail, and the comparison of other single methods will be carried out in the Section 5.
Information aggregation operators can be used in prediction models, and there are two commonly used operators which first suggested by Yager [41].
For triangular fuzzy numbers, the predicted triangular fuzzy numbers should be closer to the original data, so the difference between the two triangular fuzzy numbers should be minimized. Although Harish and Rani [37] proposed the definition of triangular fuzzy number distance to measure the difference, it is also mentioned above that this definition only applies to symmetric triangular fuzzy numbers. Therefore, this paper is inspired to define a new index to measure the difference of two triangular fuzzy numbers based on the circumcenter of triangular fuzzy numbers to improve the triangular fuzzy combination forecasting. In the prediction, the circumcenter point of the triangular fuzzy numbers represents the center of the triangle fuzzy number, and the radius represents the range, which can be interpreted as the expansion of the middle point radius of the interval combination prediction in the triangle fuzzy numbers. Next, the specific definition and rationality are elaborated.
In geometry, a triangle has one and only one circumcircle. In other word, it can be concluded from Fig. 2 that a circumcircle contains all the information of a triangle.
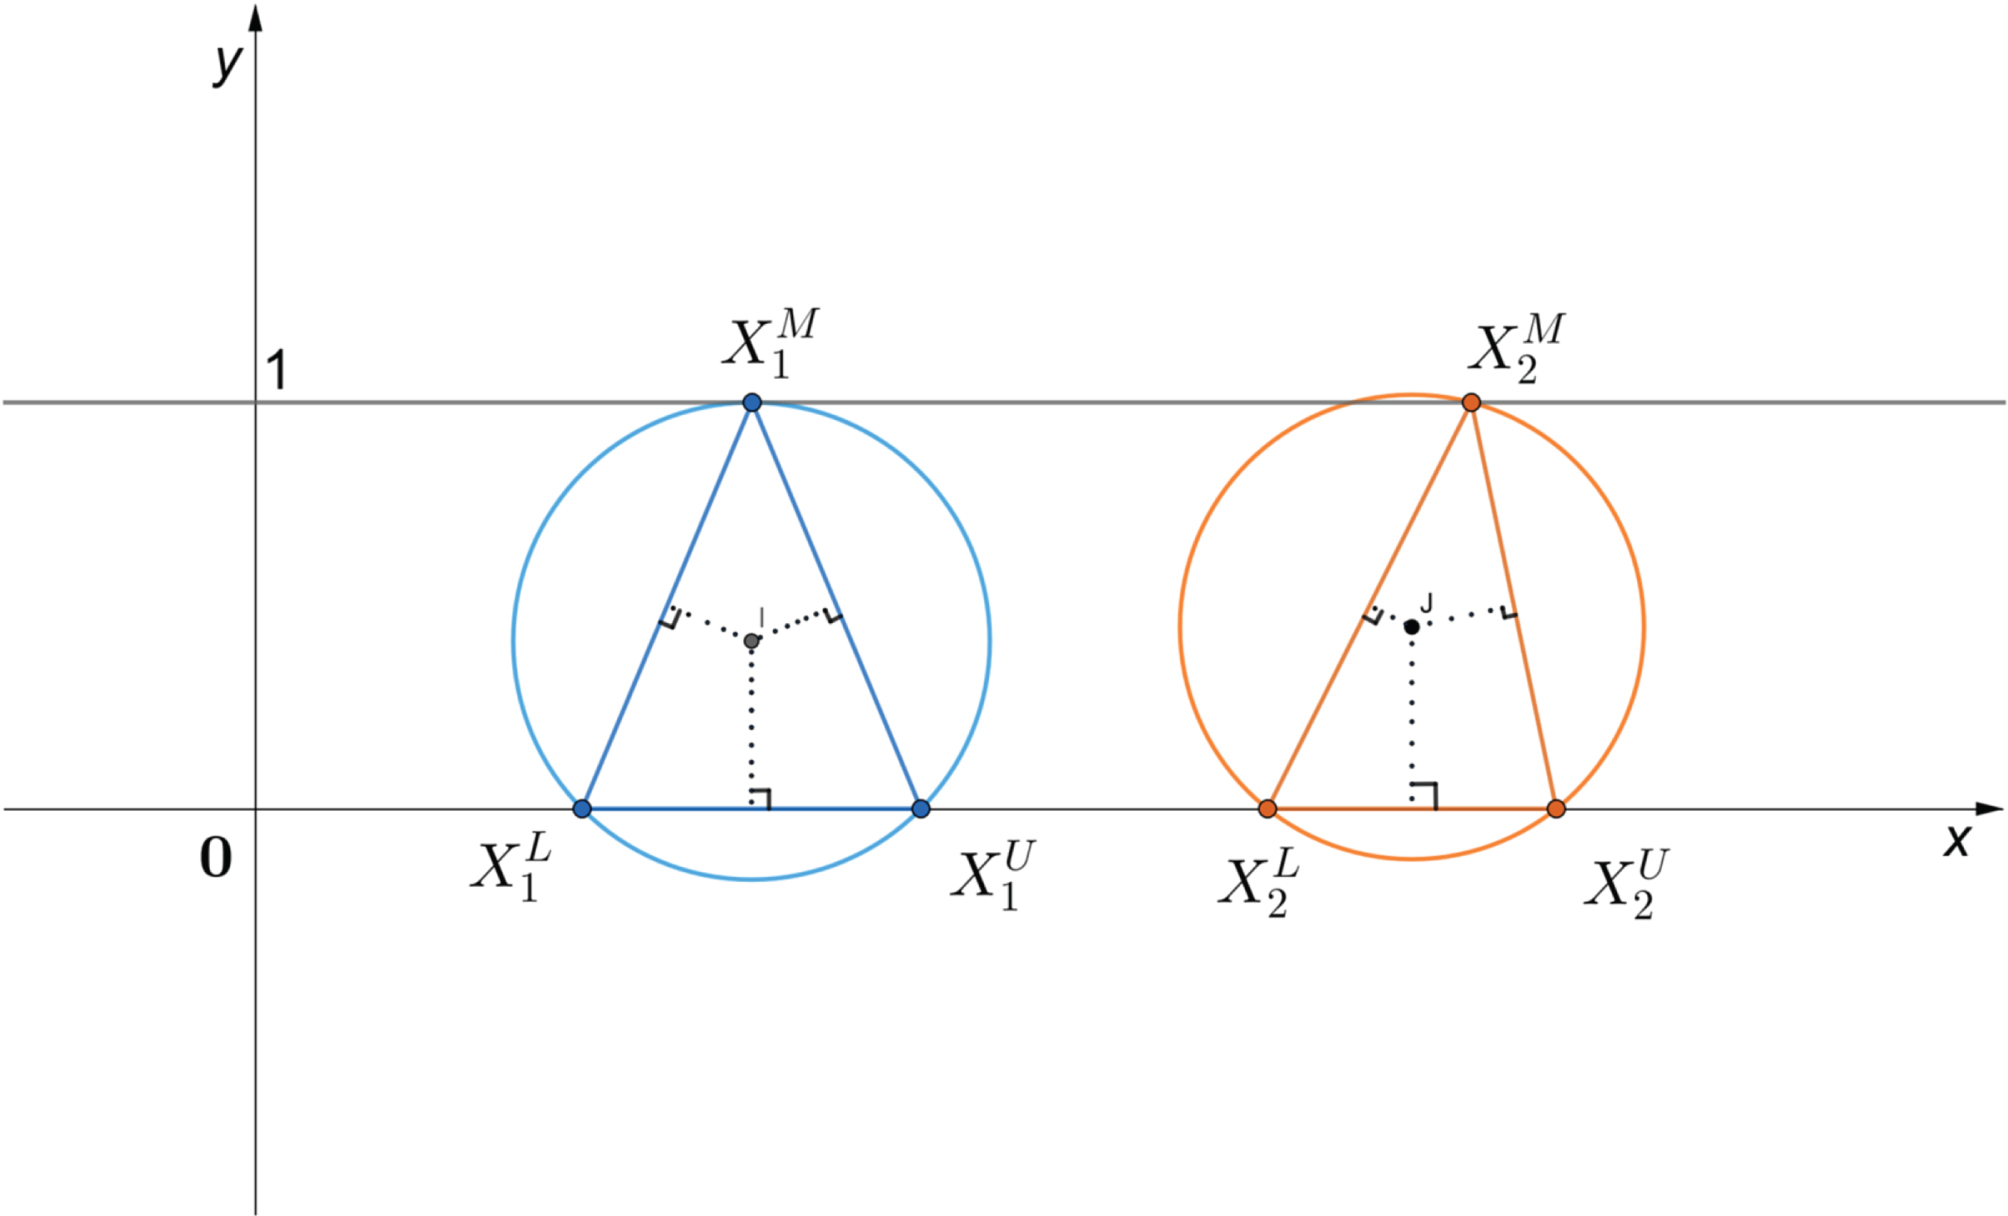
Triangular fuzzy numbers and circumcircle.
So, the information of a can be transformed into the circumcenter and radius of the circumcircle by the properties of the circumcircle which is constructed by the triangle corresponding to a.
Then (Cx TF , Cy TF ) is called the circumcenter point of a and r TF is the circumradius of a.
The calculation method of the circumcenter of a circumcircle in a plane is to solve the following equation:
And the circumradius is to solve the following equation:
The solution to the system is obtained, and the theorem holds.
Based on theorem 1 a new distance measure of triangular fuzzy numbers can be defined as follow:
D (a, b) ≥0, D (a, b) = D (b, a), D (a, a) =0, D (a, b) + D (b, c) ≥ D (a, c).
Q (A, B) ≥0, Q (A, B) = Q (B, A), Q (A, A) =0, Q (A, B) + Q (B, C) ≥ Q (A, C).
In the prediction field, it can be only used the center and radius of the circumcircle to define, because a triangular fuzzy number can be determined by the intersection of the circumcircle and the X-axis with y = 1, and there is no information missing in this process. If the inscribed circle is used, it can be found from Fig. 3 that we can construct countless triangular fuzzy numbers even with the same circle center and radius, which will cause information overlap and lead to the situation that the dispersion degree is 0 but the triangular fuzzy numbers are not equal. So, the dispersion degree of two triangular fuzzy numbers proposed in this paper is based on the circumcircle of triangular fuzzy numbers.
However, it can be found from Fig. 4 that a definite triangular fuzzy number cannot be obtained only by the coordinates of the circumcenter point, this means that there will be a deviation in measuring the difference between two triangular fuzzy numbers only by the distance between two circumcenter points. Therefore, the radius of the circumcircle is introduced to construct a new index to quantify the difference between the triangular fuzzy numbers.
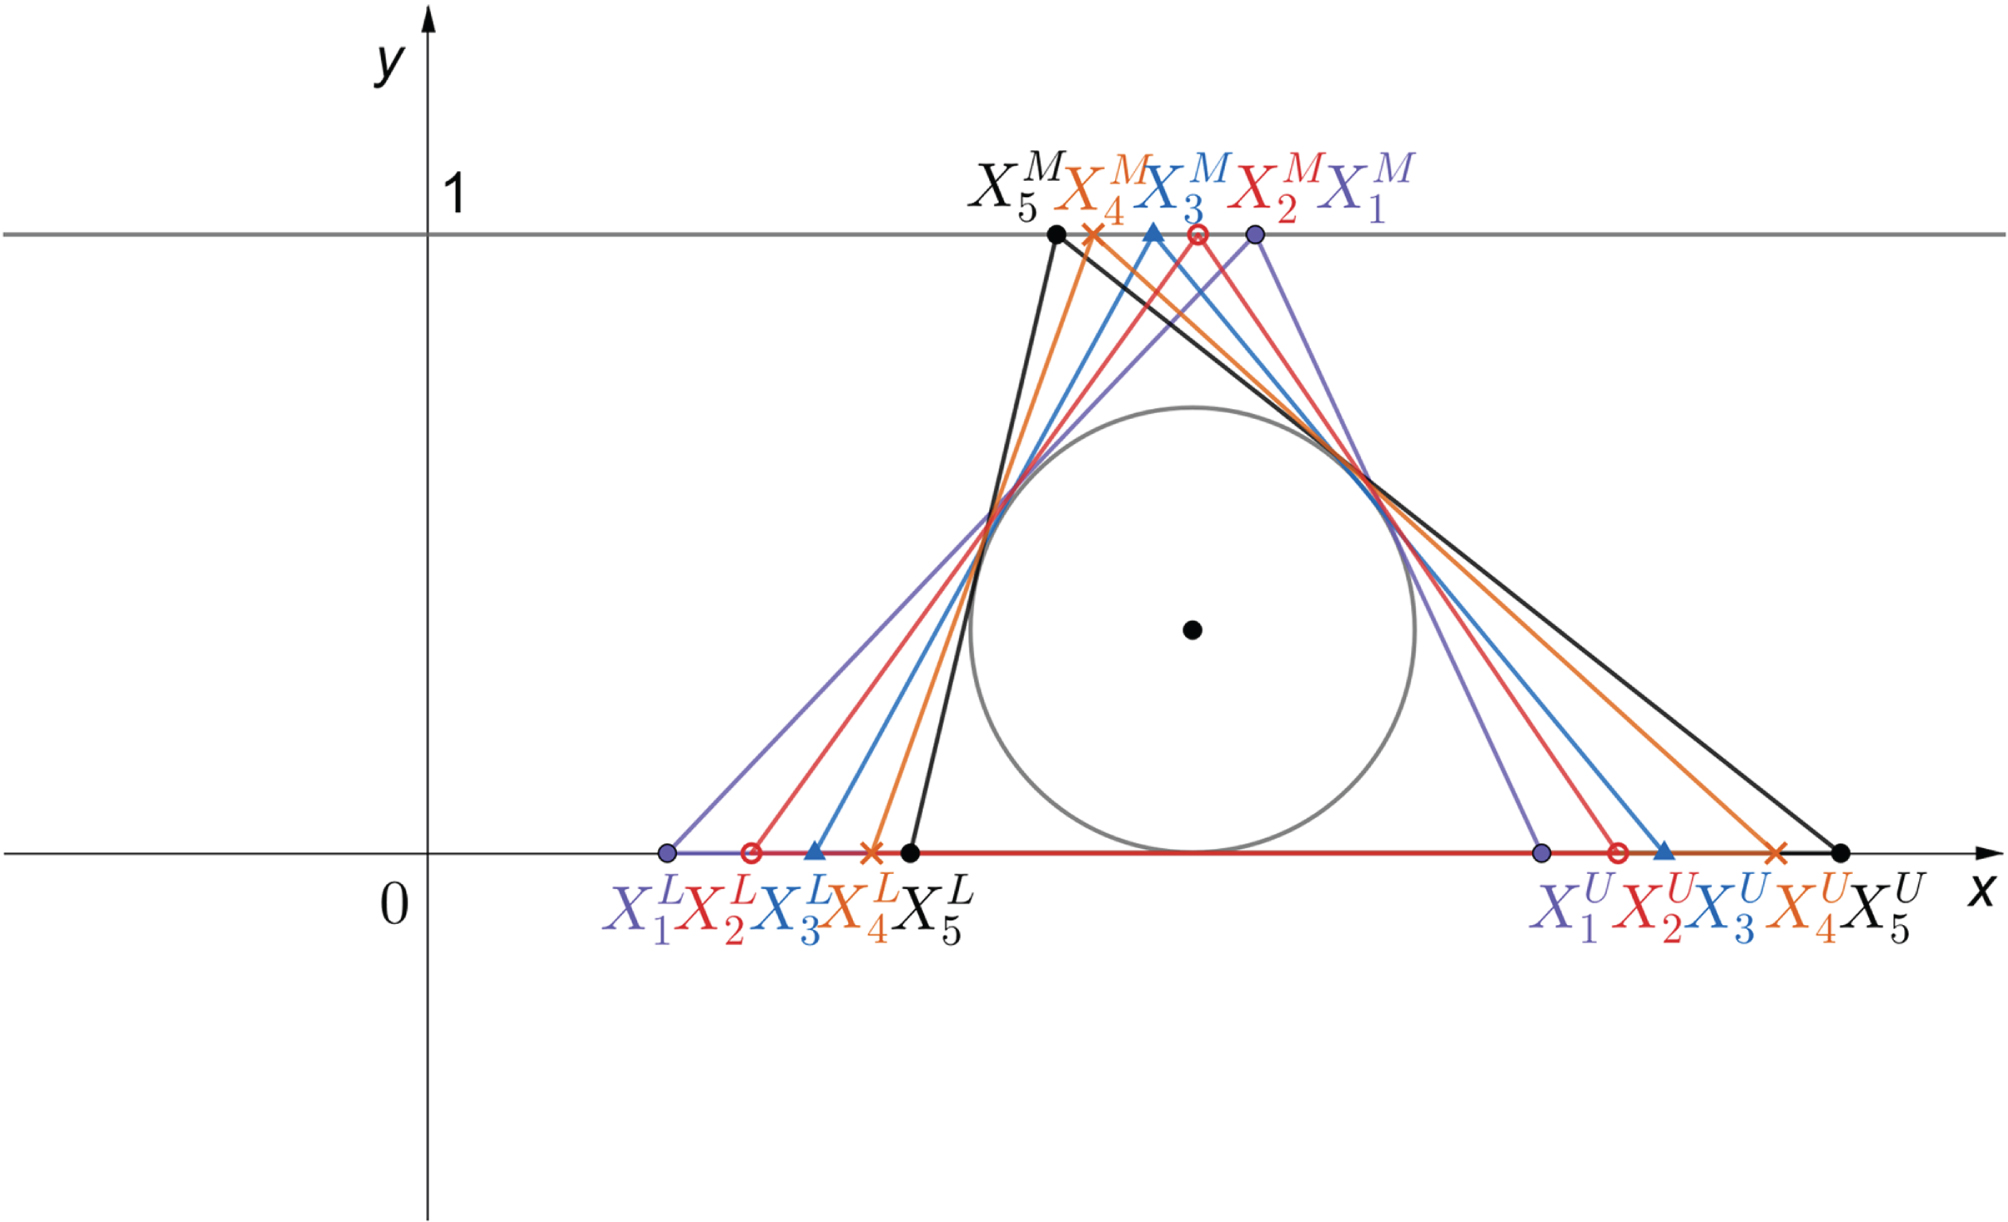
Inscribed circle of a triangular fuzzy number.
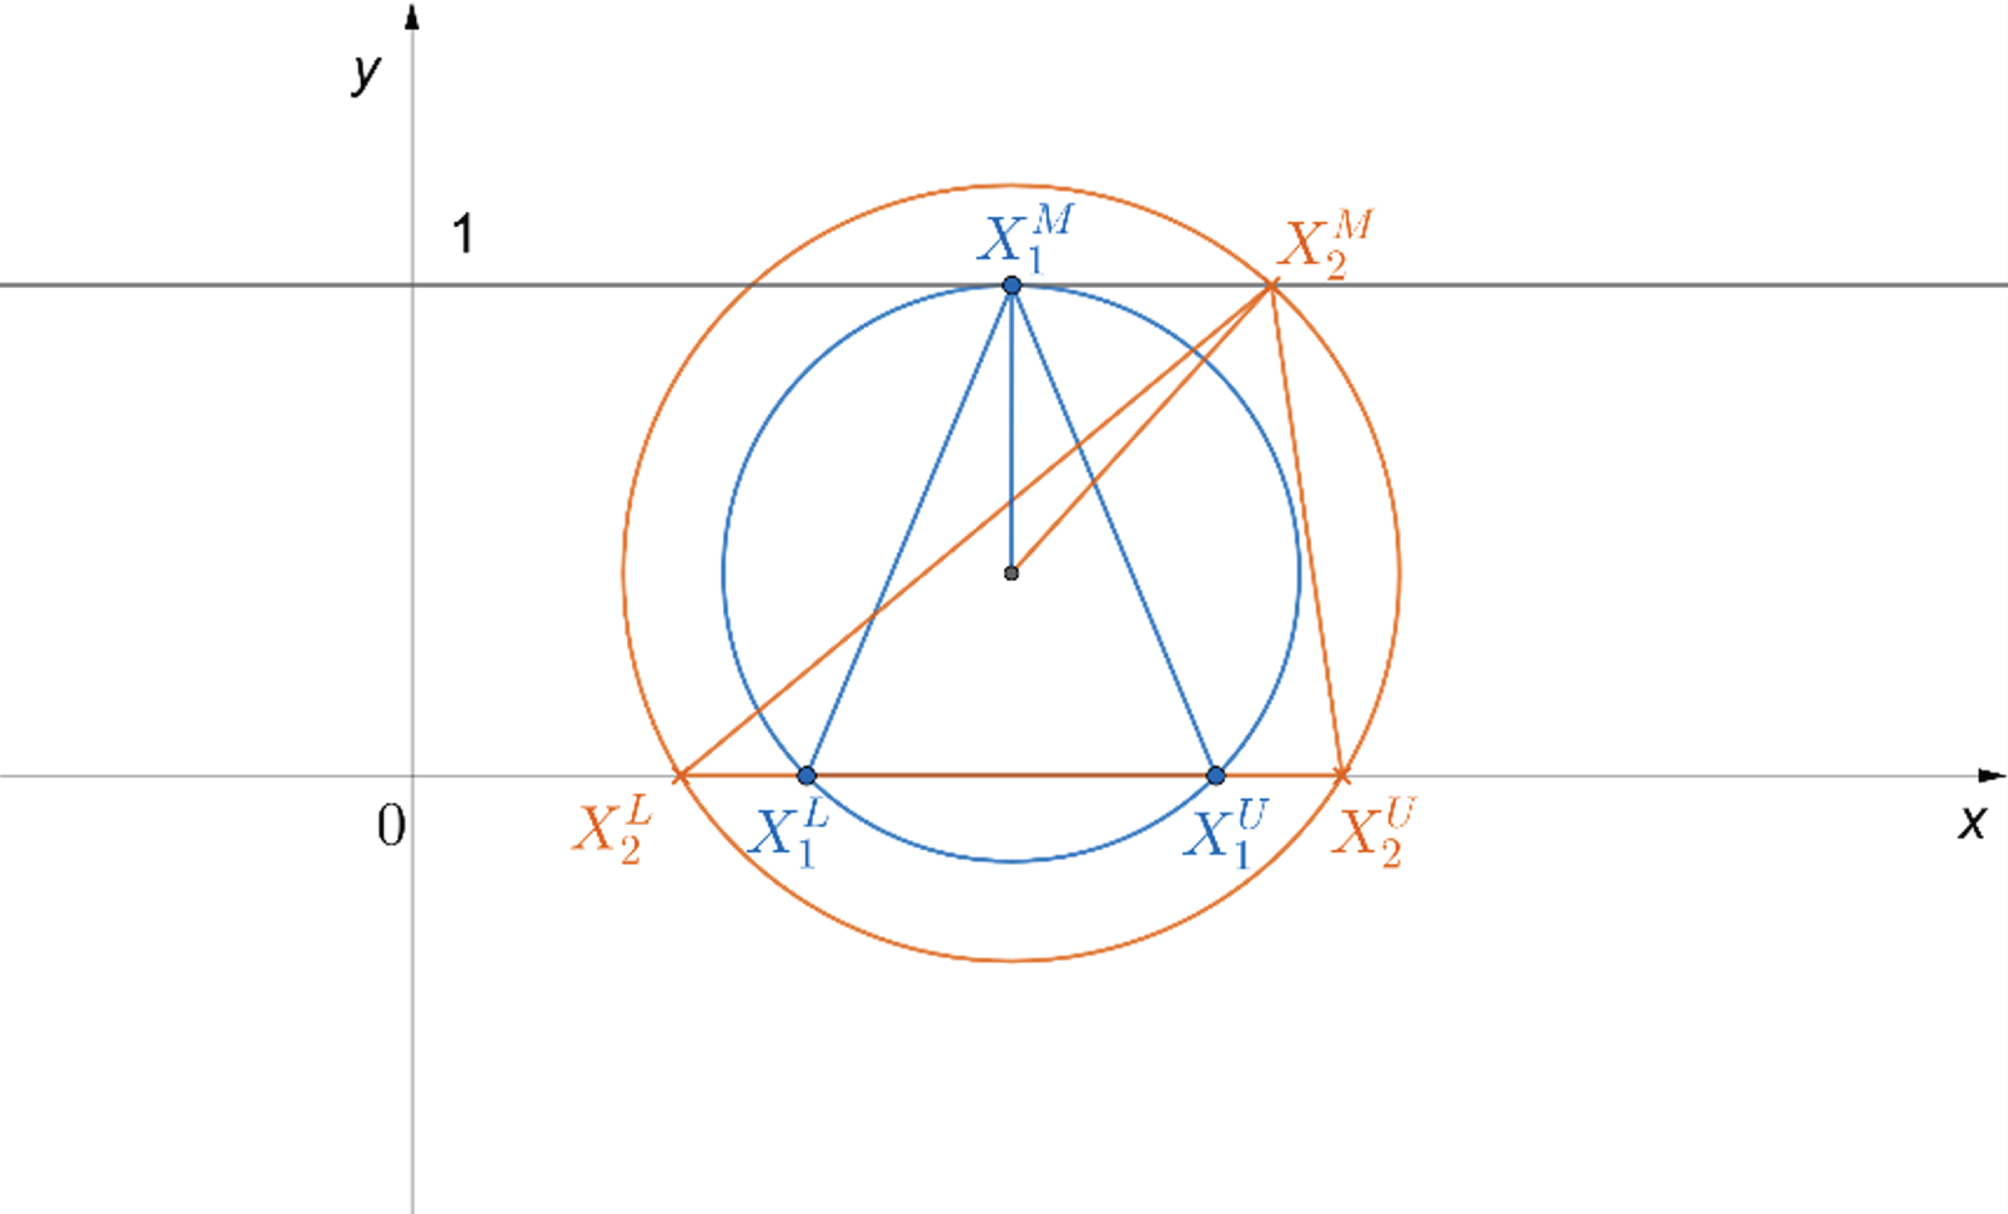
Two triangular fuzzy numbers with the same circumcenter point.
From Equation (16), attitude parameter α takes the radius into account which determines who is more important between triangular fuzzy distance and radius. If α approaches to 1, then the triangular fuzzy distance is more important for dispersion degree, while if α approaches to 0, then the circumradius is more important for dispersion degree.
DD (a, b) ≥0, DD (a, b) = DD (b, a), DD (a, a) =0, DD (a, b) + DD (b, c) ≥ DD (a, c).
(1) Since the dispersion degree is the square root of the sum of two squares, the dispersion degree is clearly nonnegative.
(2) Interchangeability.
(3)
(4) Triangle inequality.
By the property of the distance, we can get
Add two formulas together we can get
Thus DD (a, b) + DD (b, c) ≥ DD (a, c).
Similarly, the dispersion degree of two triangular vectors (DDTV) can be defined:
DDTV (A, B) ≥0, DDTV (A, B) = DDTV (B, A), DDTV (A, A) =0, DDTV (A, B) + DDTV (B, C) ≥ DDTV (A, C).
The proof is the same as
Transformation of the triangular fuzzy series
In order to combine the advantages of various individual forecasting methods the combination forecasting is usually carried out.
Similarly, by substituting Equations (12) and (13)
Where
Most of the existing triangular fuzzy combination forecasting methods use the original triangular fuzzy sets to solve the weight, and most of these are based on symmetric triangular fuzzy numbers. However, symmetric triangular fuzzy numbers are only special cases in the actual situation, so it is important to find a relationship applicable to all triangular fuzzy numbers. Therefore, DDTV proposed in this paper is used to solve the weight, this method can not only closely link three points of triangular fuzzy number, and apply to all cases of triangular fuzzy numbers. Moreover, since a triangle has a peripheral circle, which covers all the information of the triangular fuzzy numbers, the combined predictive value can be obtained more accurately. To this end, combination forecasting model can be constructed, for the vector X = (x1, x2, ⋯ , x
t
) which is made up of the sequence
If α approaches to 1, then the triangular fuzzy distance is more important for dispersion degree, while if α approaches to 0, then the circumradius is more important for dispersion degree. Under symmetric conditions the radius can be ignored because the radius can be represented by Cy as r = 1 - Cy. Therefore, under symmetric conditions the combination forecasting model can be simplified based on
In this article, the optimal weight is mainly solved by using python’s ipopt solver. As a result, the entire modeling process of the combination forecasting model has been obtained, and Fig. 5 shows the overall process.
Root mean square error (RMSE) has been commonly used over recent publications in the field to score point forecasts performances, so the following evaluation metrics are defined to directly reflect the effectiveness of model based on RMSE:
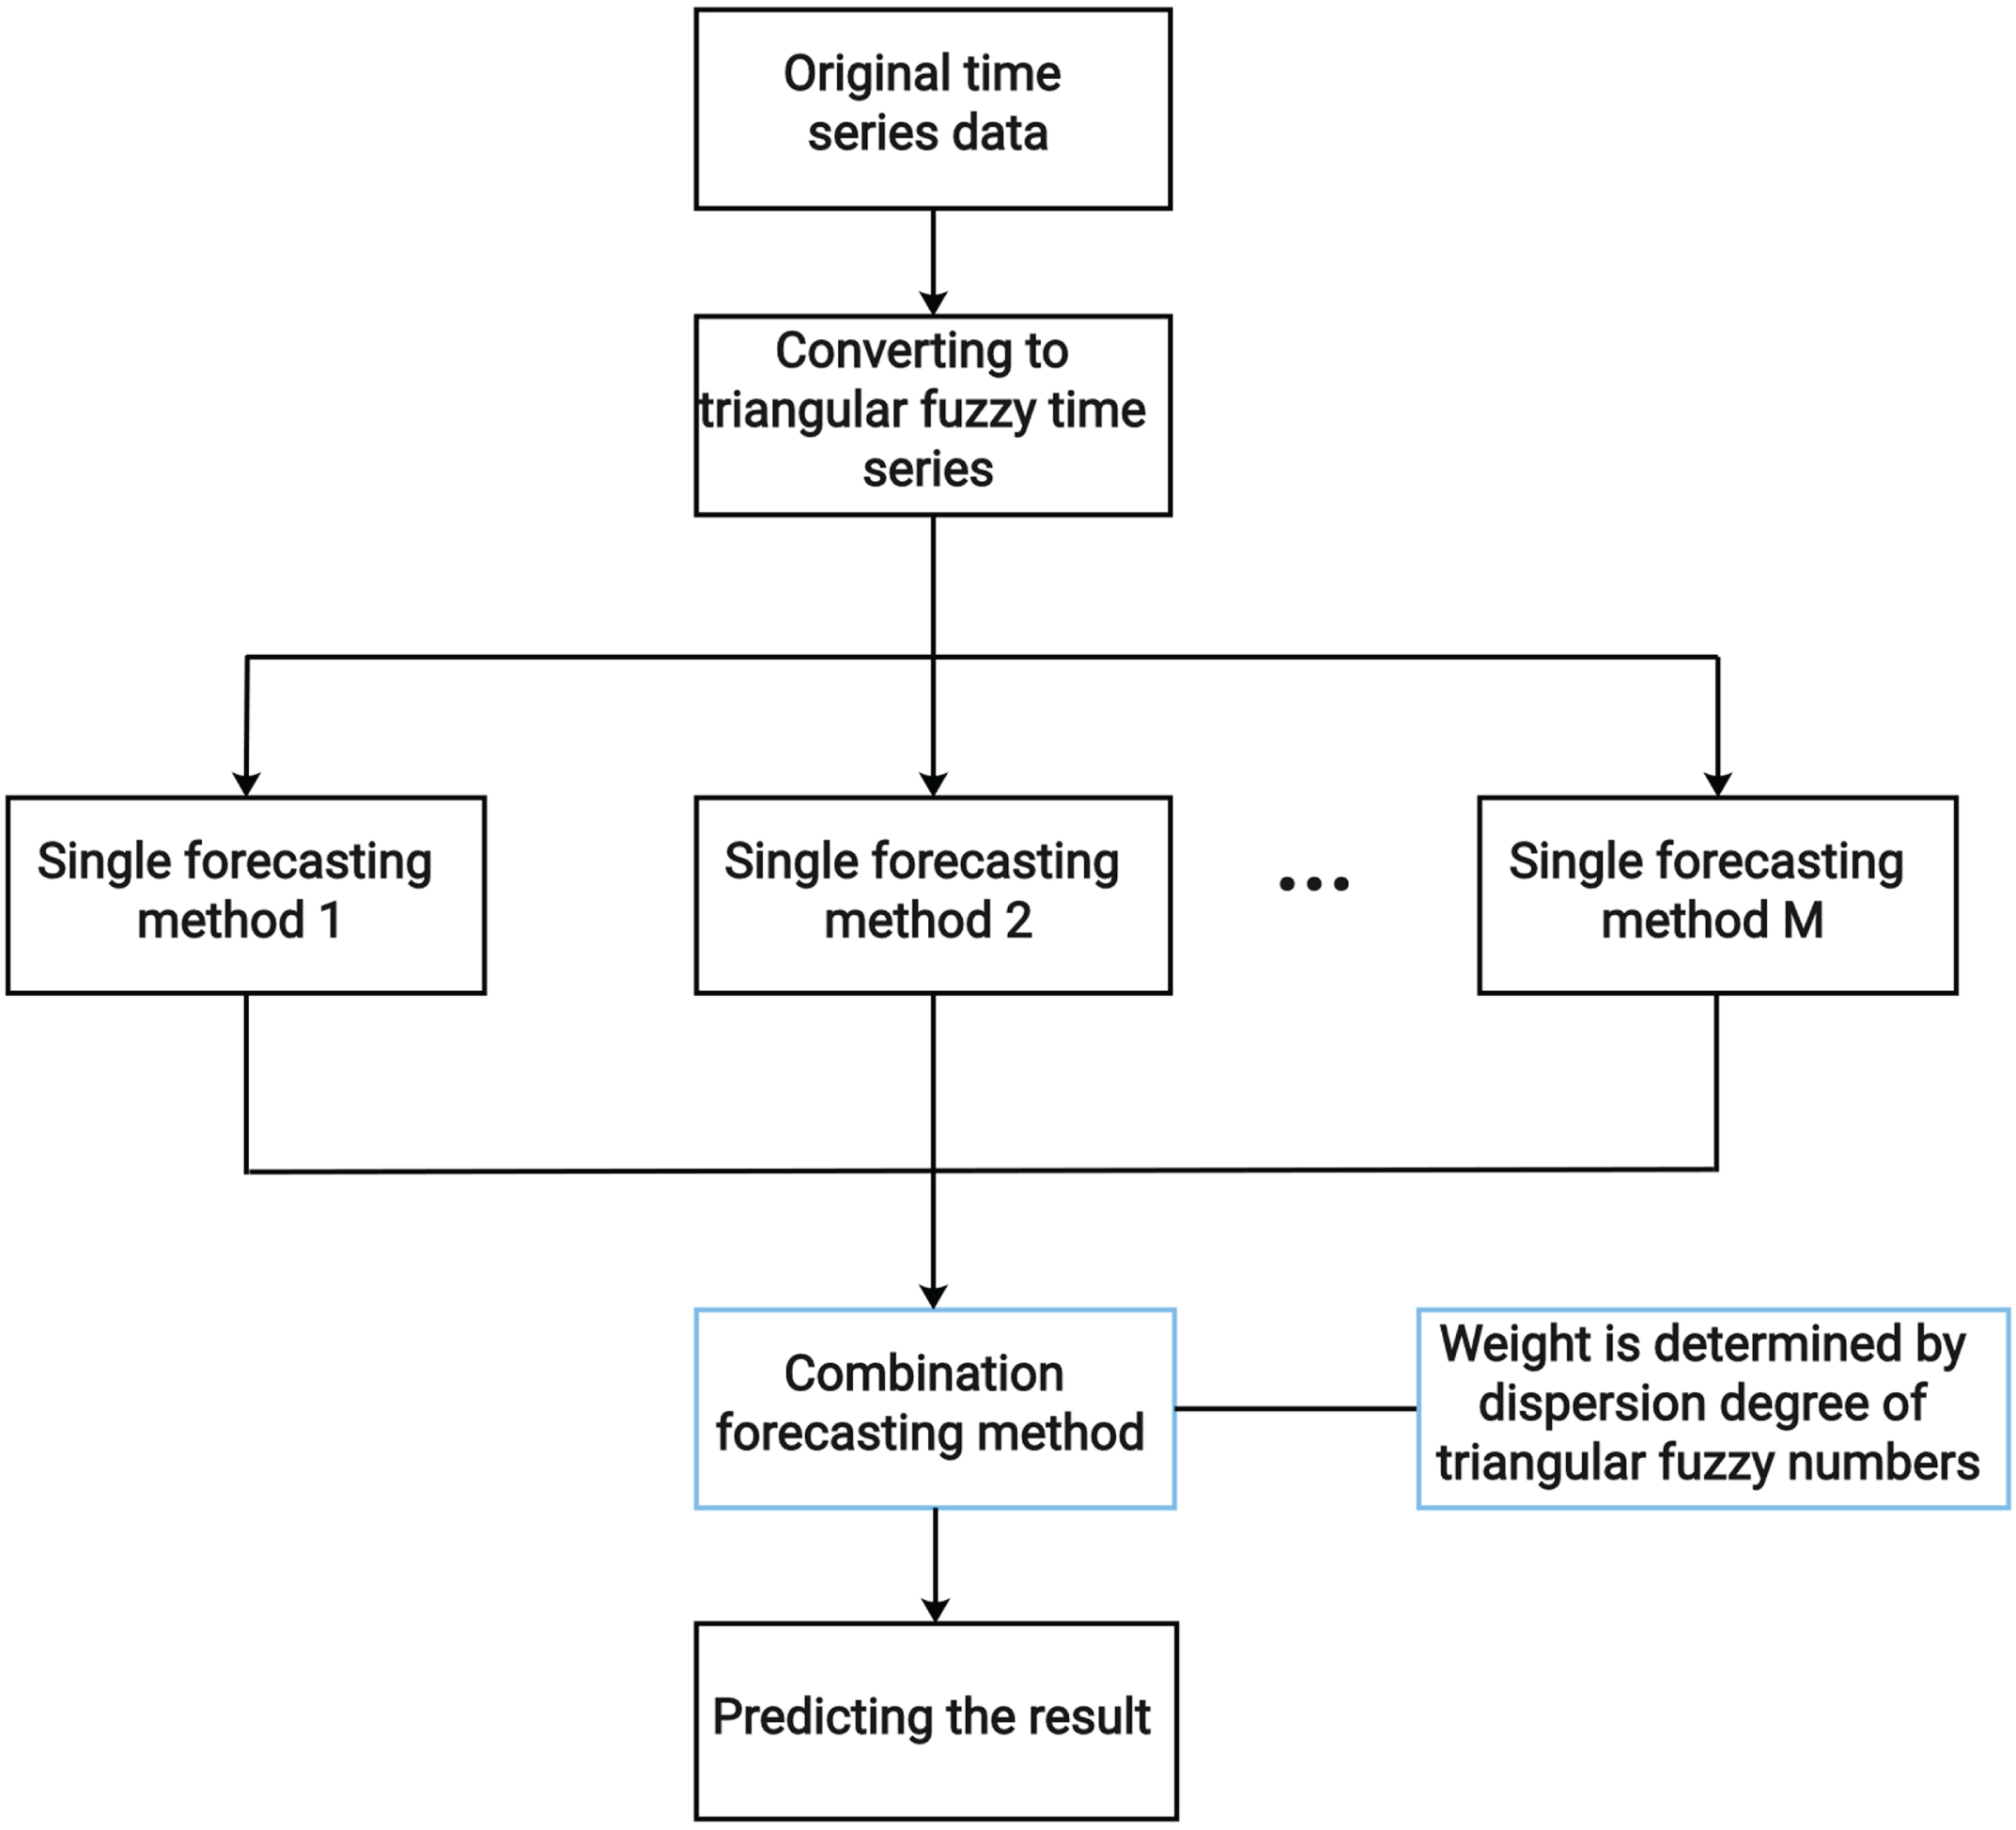
The flowchart of combination forecasting model.
The raw data and prediction results of power load
RMSEL, RMSEM, RMSEU are evaluation metrics to reflect the effectiveness of three points and RMSET is the overall evaluation metric of triangular fuzzy number prediction, the lower values are (and the closer to zero), the more accuracy the prediction is.
The application in power load prediction
Before proceeding to a new empirical application, it is need to verify whether the combination forecasting model proposed in this paper is effective through an experiment, so the data from Zeng [24] who used the power load data of one district of Guilin, China from September 2 to 5, 2014 are used to construct three Triangular fuzzy series forecasting models. These three single models will be combined with DDTV to verify the validity of our model. Raw data and single forecasting model data are as follows:
For the above 15 periods of data, it is need to divide them into in-sample and out-of-sample data for verification respectively to determine the effectiveness of the model. For out-of-sample test, 20% -40% of samples need to be reserved in advance for prediction on this sample after model establishment. Therefore, the data of the first 10 periods are selected as in-sample data and the data of the last five periods as out-of-sample data for verification respectively.
First is in-sample test, according to Equations (21)–(23) in Definition 17, the prediction accuracy sequence of three points can be obtained as follows:
The prediction accuracy sequence of three points for power load
The prediction accuracy sequence of three points for power load
Then IOWGA operator is used to combine the predicted triangular fuzzy sequences by Definition 18, and the circumcenter and circumradius of the predicted triangular fuzzy sequence are calculated with Definition 18. By substituting the triangular fuzzy prediction sequence into Equation (29), the optimal weights with different parameter values are shown in Table 3.
Optimal weights with different parameter values for power load
Finally, the combination forecasting values can be obtained in the Table 4.
The triangular fuzzy combination forecasting values for power load (In-sample)
In order to verify the effectiveness of the combination forecasting model in this paper, the method in literature [25] is selected for comparison. The errors for each group are calculated by Definition 19. In order to facilitate the comparison with the single prediction method, the prediction error indicators of each prediction method and several special values are shown in Table 5.
The triangular error indicators for power load (In-sample)
It can be found that, for the model proposed in this paper, the RMSET of any α is smaller than that of other methods, and as α becomes larger, the error of each point will be smaller than that of other methods. However, the effectiveness of the method in literature [25] is not only worse than the model proposed in this paper, but also worse than the single models. This is because symmetric triangular fuzzy numbers are required when converting triangular fuzzy numbers into area and center of mass, otherwise serious information loss will be caused, resulting in poor model effect eventually. It can be concluded that the proposed combination forecasting model performs well in the in-sample test.
And then is an out of sample test, which needs to get the prediction accuracy out of sample first. For the data of the last five periods, we use the moving average method to calculate the accuracy, considering that the original data is hourly and the amount of data is small, it is not suitable for the step length to be too long, so we choose the three-step moving average and take the weight under α = 0.5 as an example to predict the future, and finally get the prediction values as Table 6.
The triangular fuzzy combination forecasting values for power load (Out-sample)
Then the errors are calculated to conduct the out of sample test, and the final result is shown in Table 7.
The triangular error indicators for power load (Out-sample)
Finally, it can be found that the data of the five periods prediction out of sample is generally better than that of the single prediction, which can prove the effectiveness of the combination forecasting. In the future, the method of determining the accuracy to get better prediction effect will be further studied.
After conducting out-sample and in-sample tests, it can be found that the combination forecasting method proposed in this paper performed well in the two tests and could effectively predict the triangular fuzzy data, so the application of this method in oil price forecast will be further studied.
In this section, the Brent oil price data from March 28, 2012 to April 27, 2022 are used as an example, using data from investing.com. Brent is a light, sweet crude oil from the Brent and Ninian fields in the North Sea. It is widely traded in the futures, over-the-counter swaps, forward and spot markets. More than 65% of the world’s physical crude is now pegged to the Brent system. Among ten years of daily data, the closing price of each day is taken as the medium point of triangular fuzzy number. Meanwhile, the minimum and maximum of each day are taken as the lower and upper point of triangular fuzzy number respectively. As mentioned above, spot market data perfectly fits the definition of triangular fuzzy numbers. The lower and upper point don’t need to be explained too much, they represent the lowest and the highest price for a day and they won’t appear again on this day, so their memberships are equal to 0. The select of medium point is why this kind of data perfectly fits the definition of triangular fuzzy sets, in other articles they always choose mean value to be the medium point, but they can’t explain why the membership of mean value equals to 1. In this paper the closing price is selected to be the medium point because the closing price is obviously between the highest and lowest price, and it’s the final price every day, and it doesn’t change anymore, which means that probability of the closing price is 1, so the membership is equal to 1. Therefore, the triangular fuzzy sets can be constructed by processing the obtained data. It is worth mentioning that for general time series data the upper and lower points can be constructed by the maximum and minimum values, and the medium points can be constructed by the mean values and the invariant values.
The predicted results of the single forecasting model
Then ARIMA, GRNN and LSSVR are used to predict the Brent oil price which are represented by the triangular fuzzy numbers respectively, For ARIMA model, the data of the last year are used to make predictions and get the data of the last 10 periods. Then the data of the first 9 years are used as the feature set of machine learning, and the first 90% of the last year is used as the training set and the last 10% is used as the test set, and the statistical characteristics of the selected samples are summarized in Table 8. Finally, the data of the last 10 days are selected to correspond to the ARIMA model. For the parameters of the model, random state equals to 8 and we select original parameters to ensure consistency. Thus, the prediction results can be obtained from three single prediction methods, as shown in Table 9.
In order to facilitate comparison, the data are processed and get a sequence of symmetric triangular fuzzy data in Table 10.
The statistical characteristics of the selected samples
The statistical characteristics of the selected samples
The prediction results from three single prediction methods
The symmetric prediction results from three single prediction methods
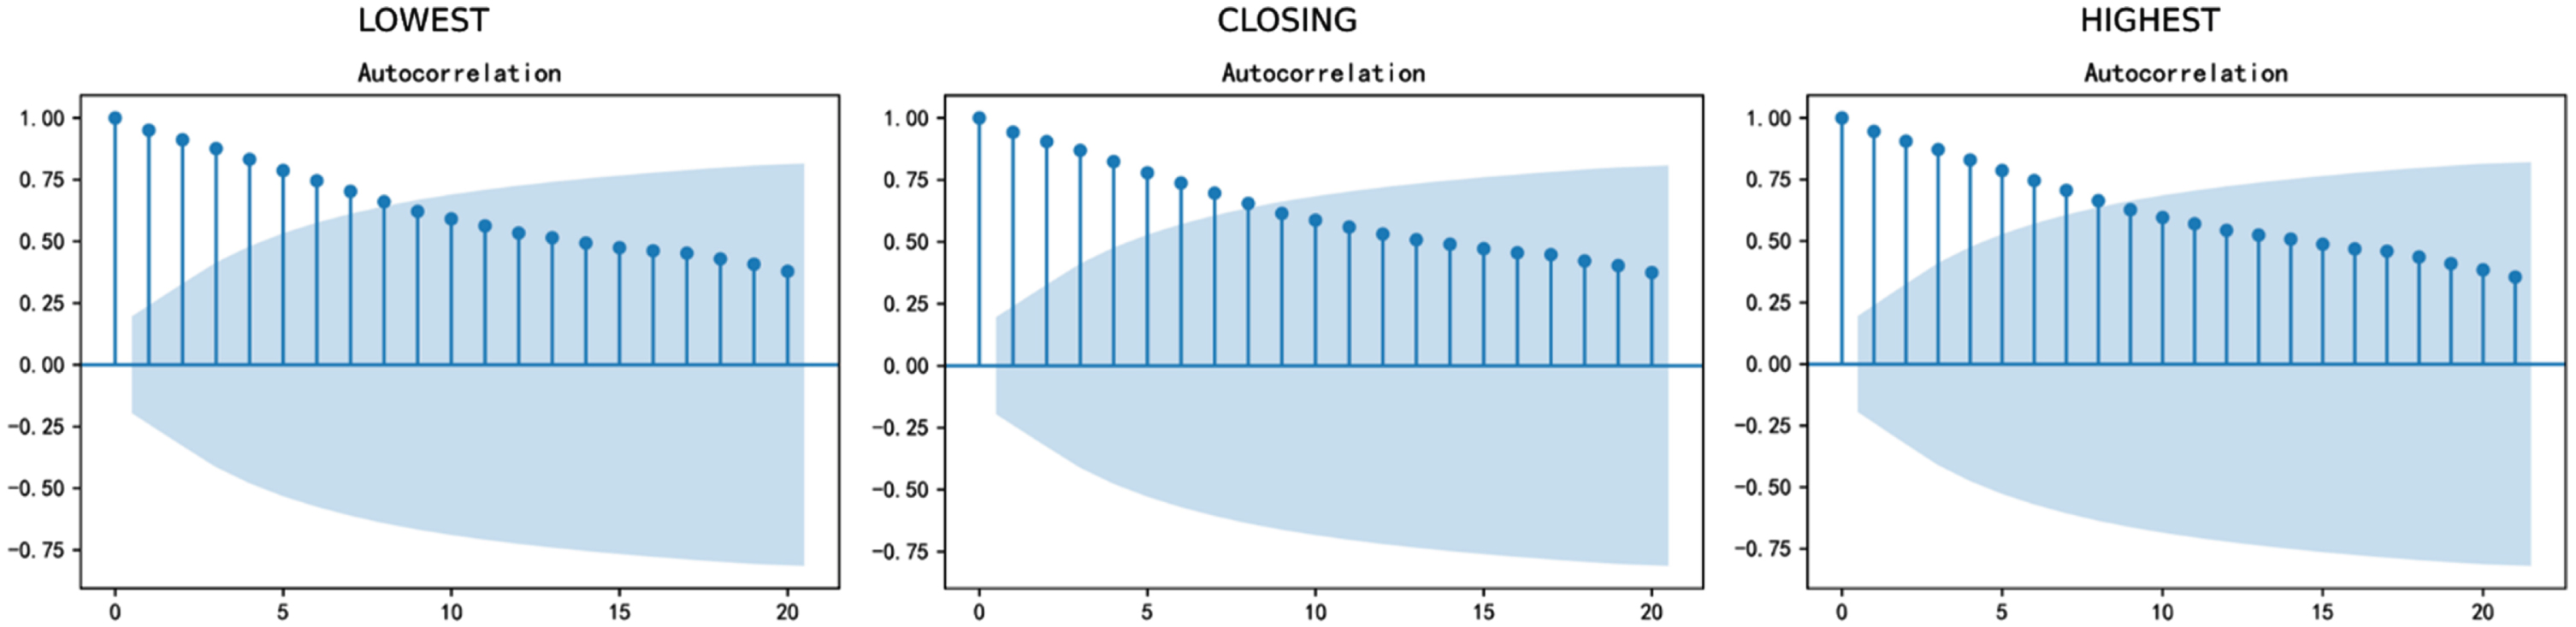
ACF of the original sequence.
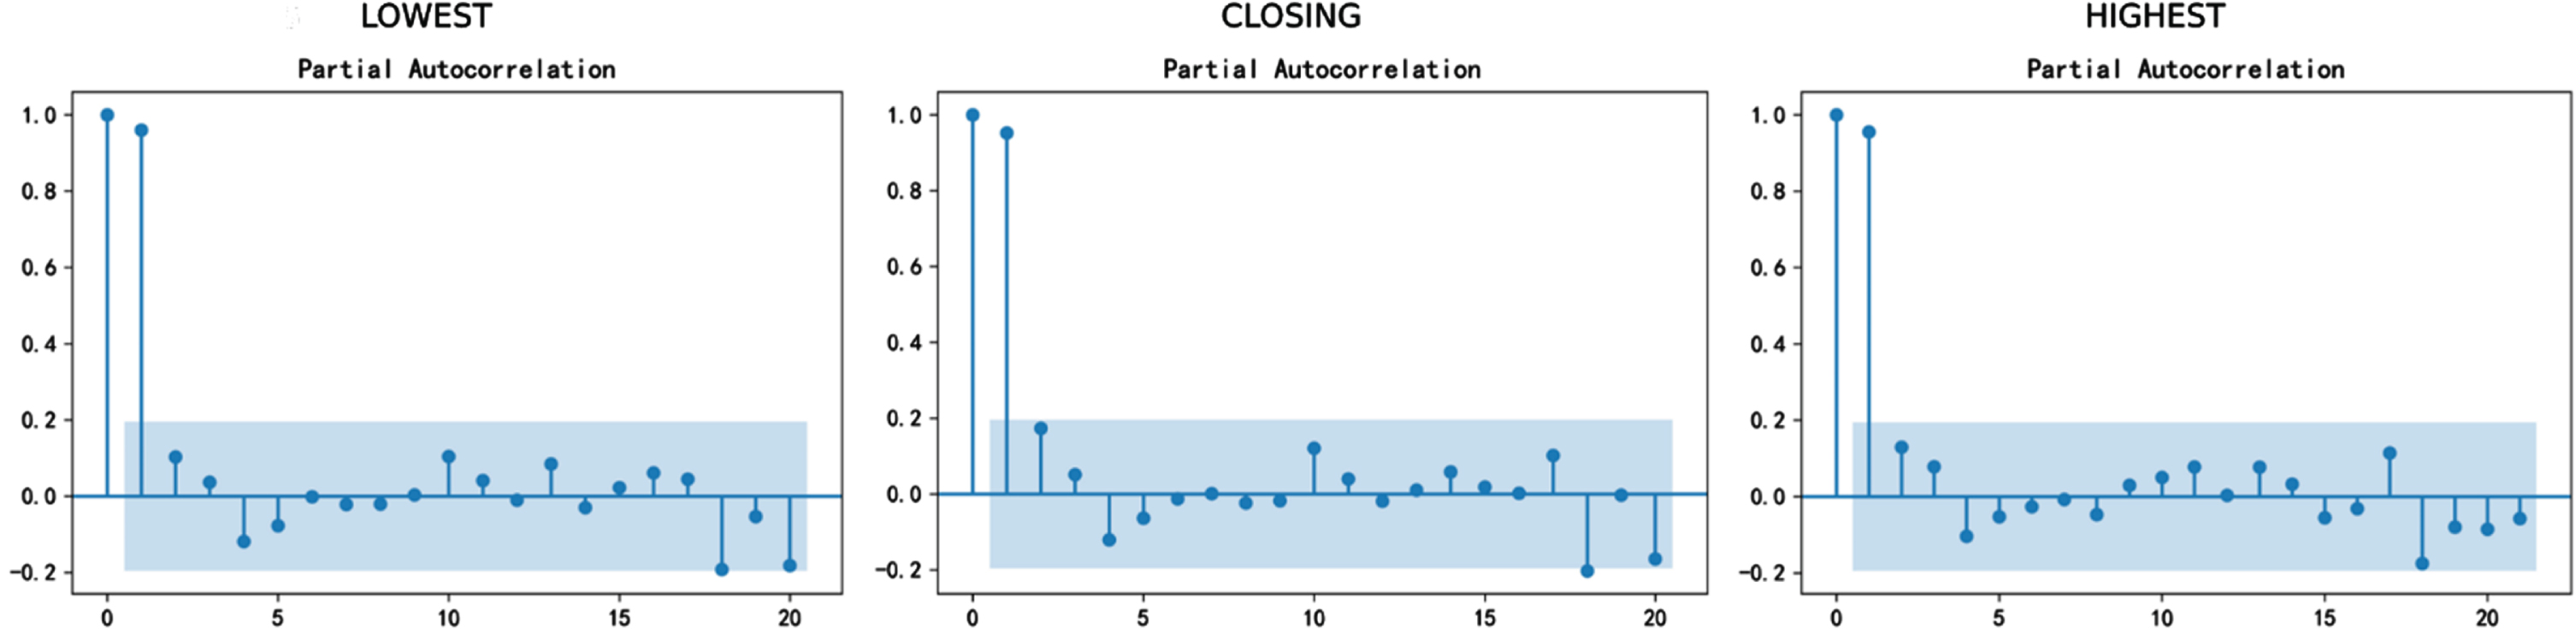
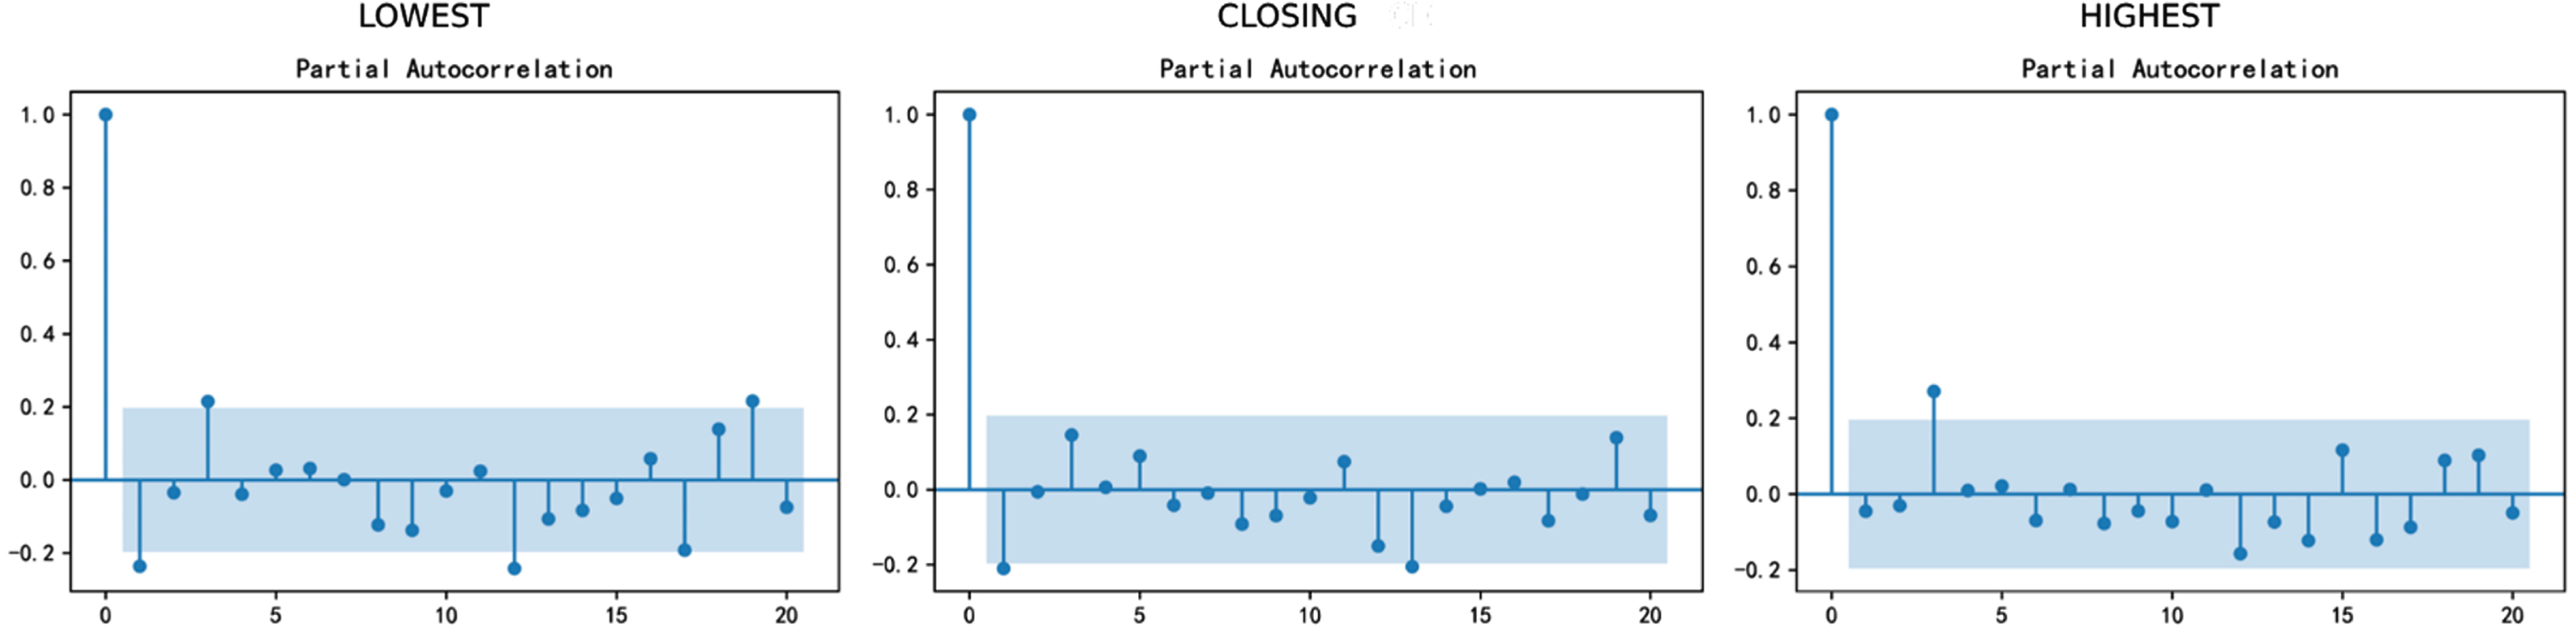
PACF of the original sequence.
(1) Validity test of ARIMA:
In the Arima model, the time series require to be stationary. If the time series is not stationary, a difference is usually used to ensure the stationarity, so we draw the ACF and PACF of the original sequence:
Then the unit root test is used to further confirm the non-stationarity, the ADF test results are as Table 11.
ADF test of the original sequence
It can be found that the original time series is not stationary because p-values of ADF tests are all greater than 0.05, so we make first-order difference, and then get the ACF and PACF graphs of first-order difference:
Also, the unit root test is used to further confirm the stationarity, the ADF test results for the first-order difference sequences are in Table 12.
After the difference of ARIMA, the p-value of ADF test is less than 0.05. It shows that the sequence after the first difference is stationary and can be modeled.
AIC and BIC information criteria are used to obtain the final ARIMA model and to predict the data of 10 periods. Finally, Lagrange multipliers are tested for residual terms and Table 13 is obtained. It can be seen from Table 13 that the prediction result is effective.
ADF test for the first-order difference sequences
Diagnostic test results
(2) The fitting effect of LSSVR and GRNN:
The model LSSVR and GRNN are also need to be tested. For the machine learning method, the fit degree curve is usually used to measure the model effect so we draw the fitting renderings of two prediction methods, Fig. 10 is the fitting renderings of two prediction methods at the lowest point, Fig. 11 is the fitting renderings of two prediction methods at the closing point, Fig. 12 is the fitting renderings of two prediction methods at the highest point. It can be seen from Figs. 10–12 that the forecast data of the model LSSVR and GRNN are basically consistent with the trend of oil price data. Then we calculate the fit degree of the two models to test the effect of model more accurately.
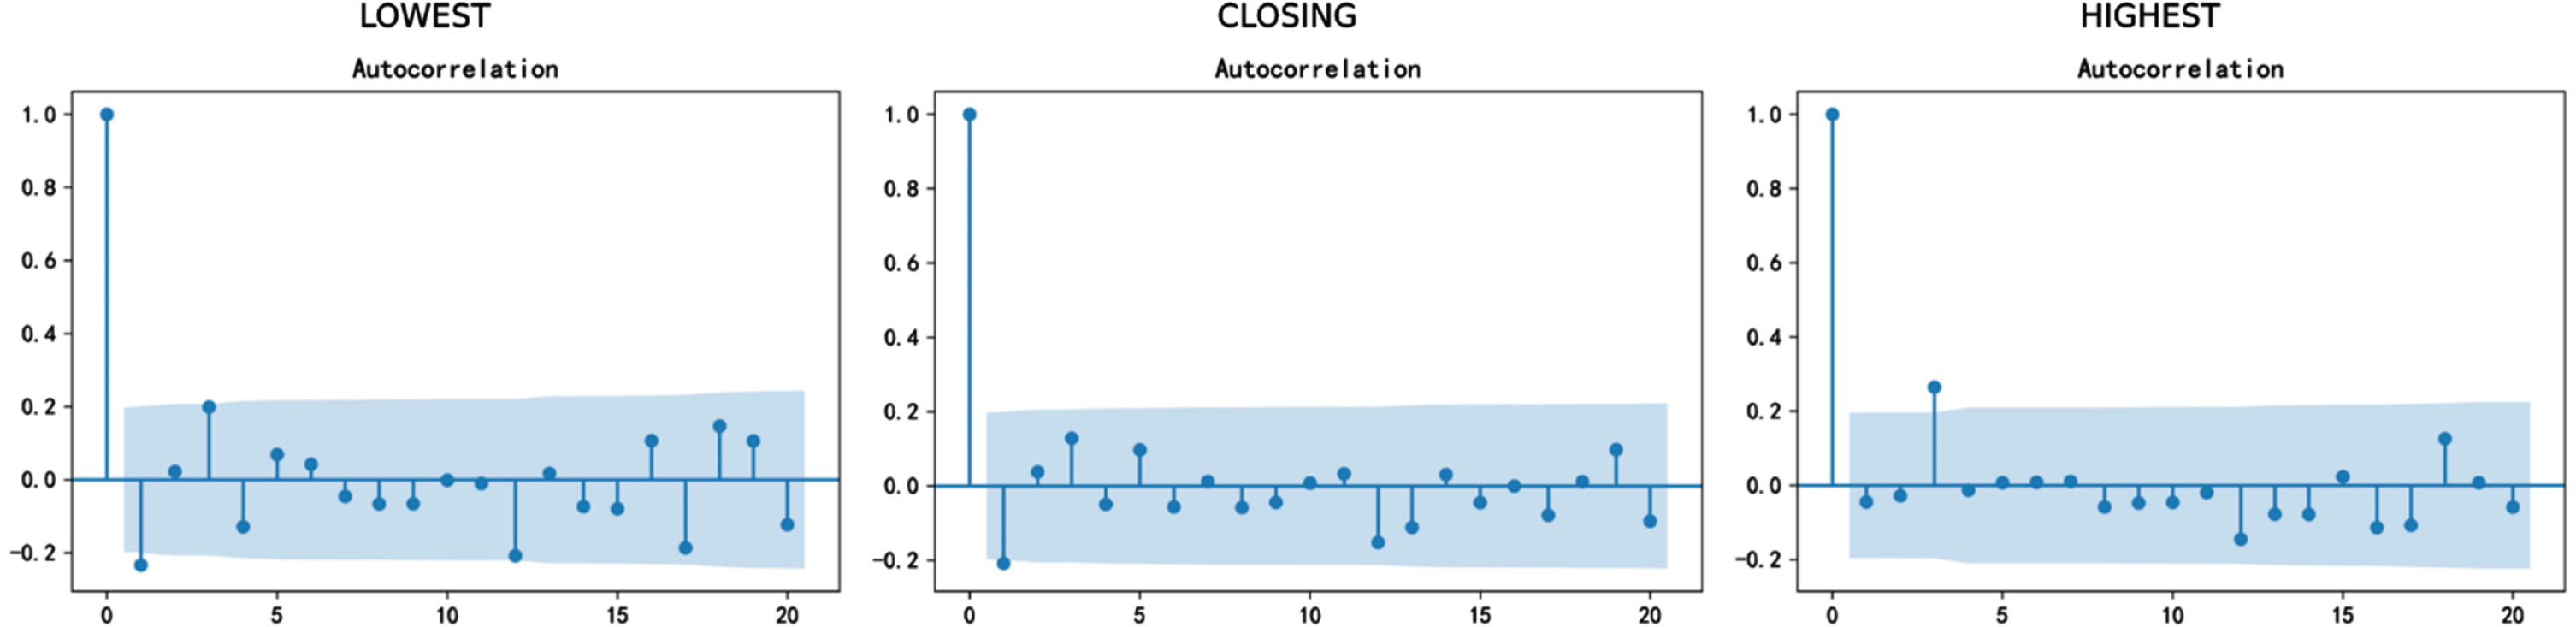
ACF of the first-order difference.
PACF of the of first-order difference.
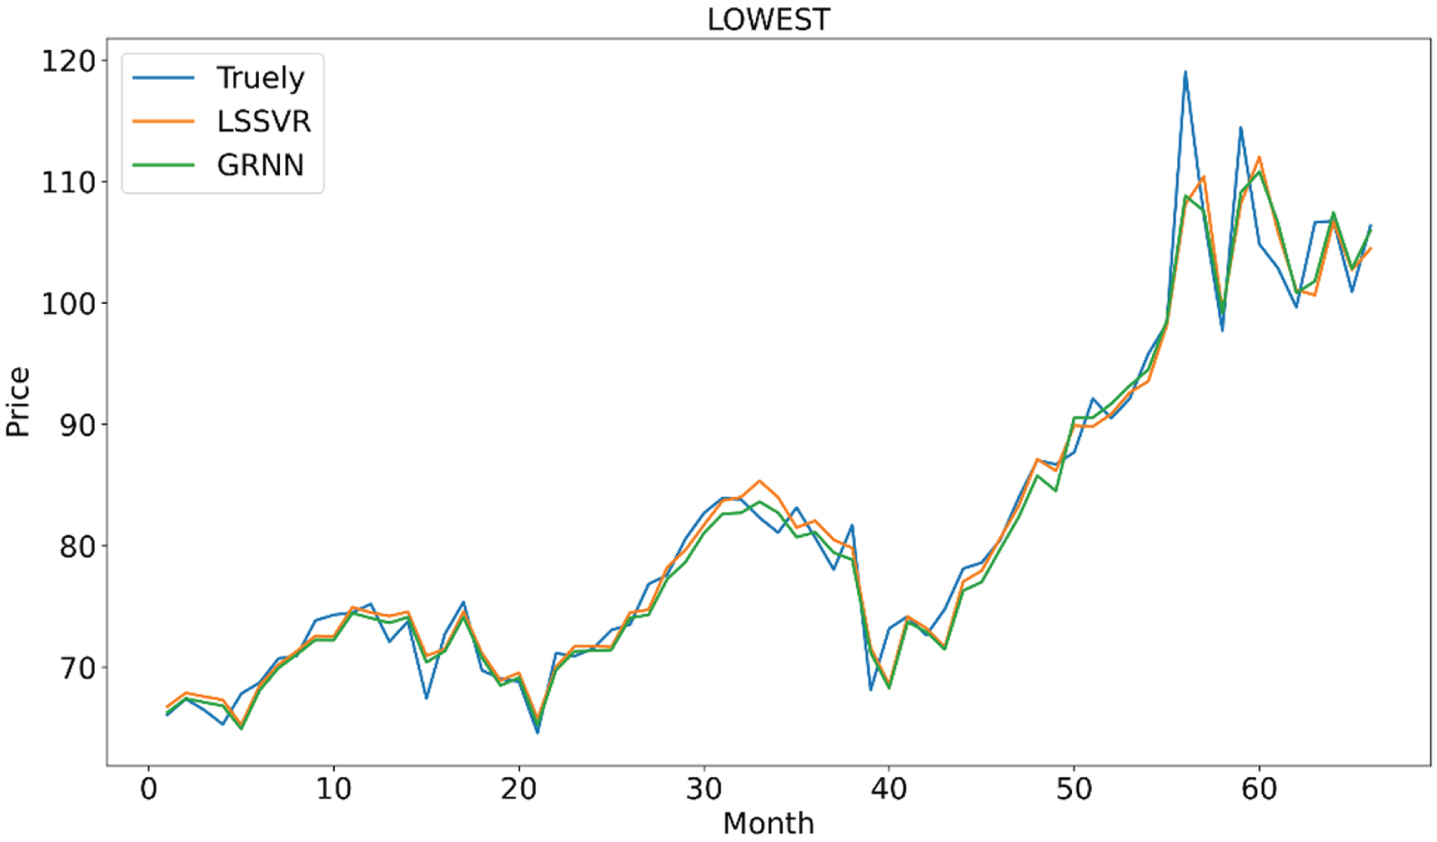
Fitting renderings of two prediction methods at the lowest point.
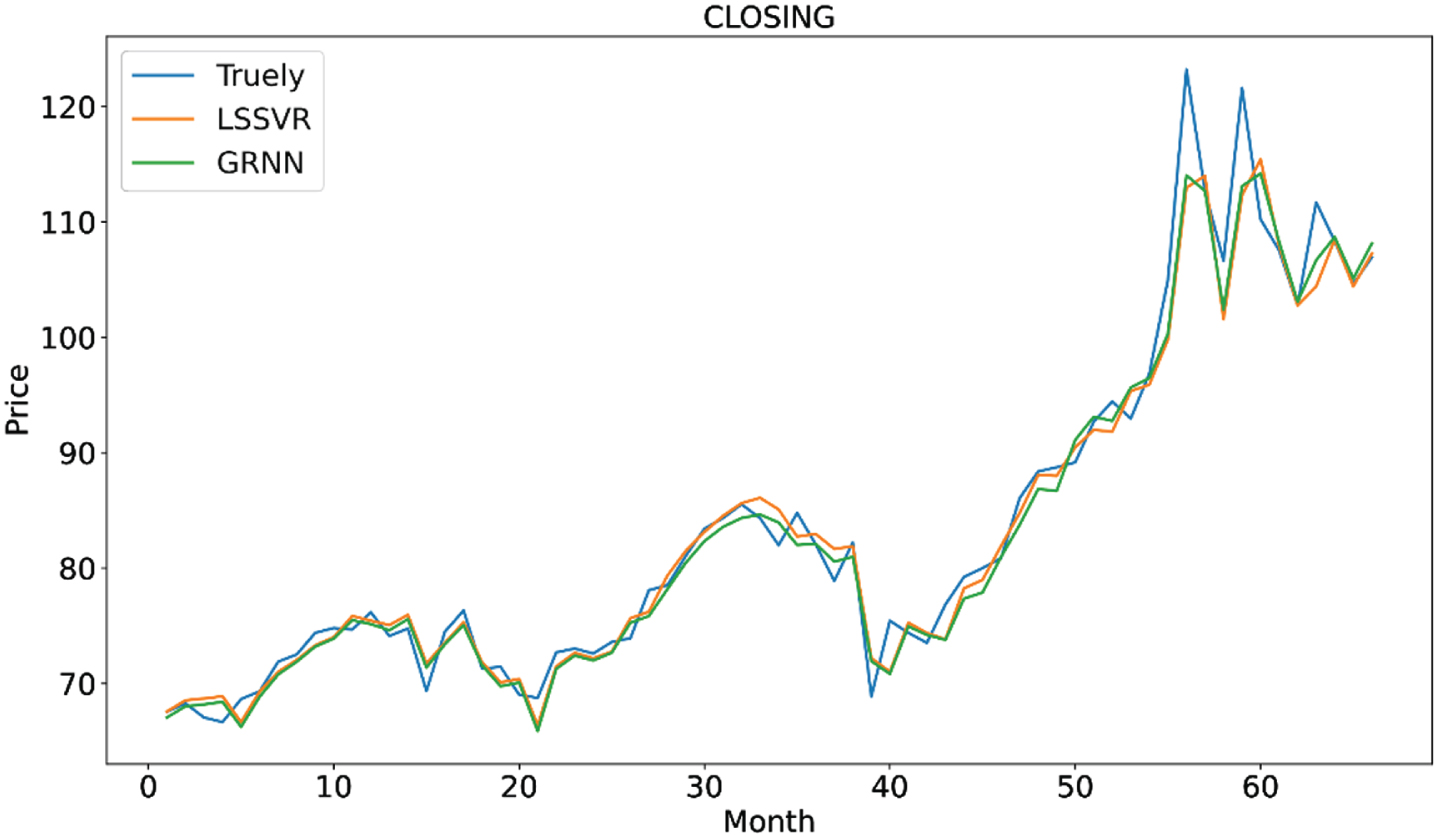
Fitting renderings of two prediction methods at the closing point.
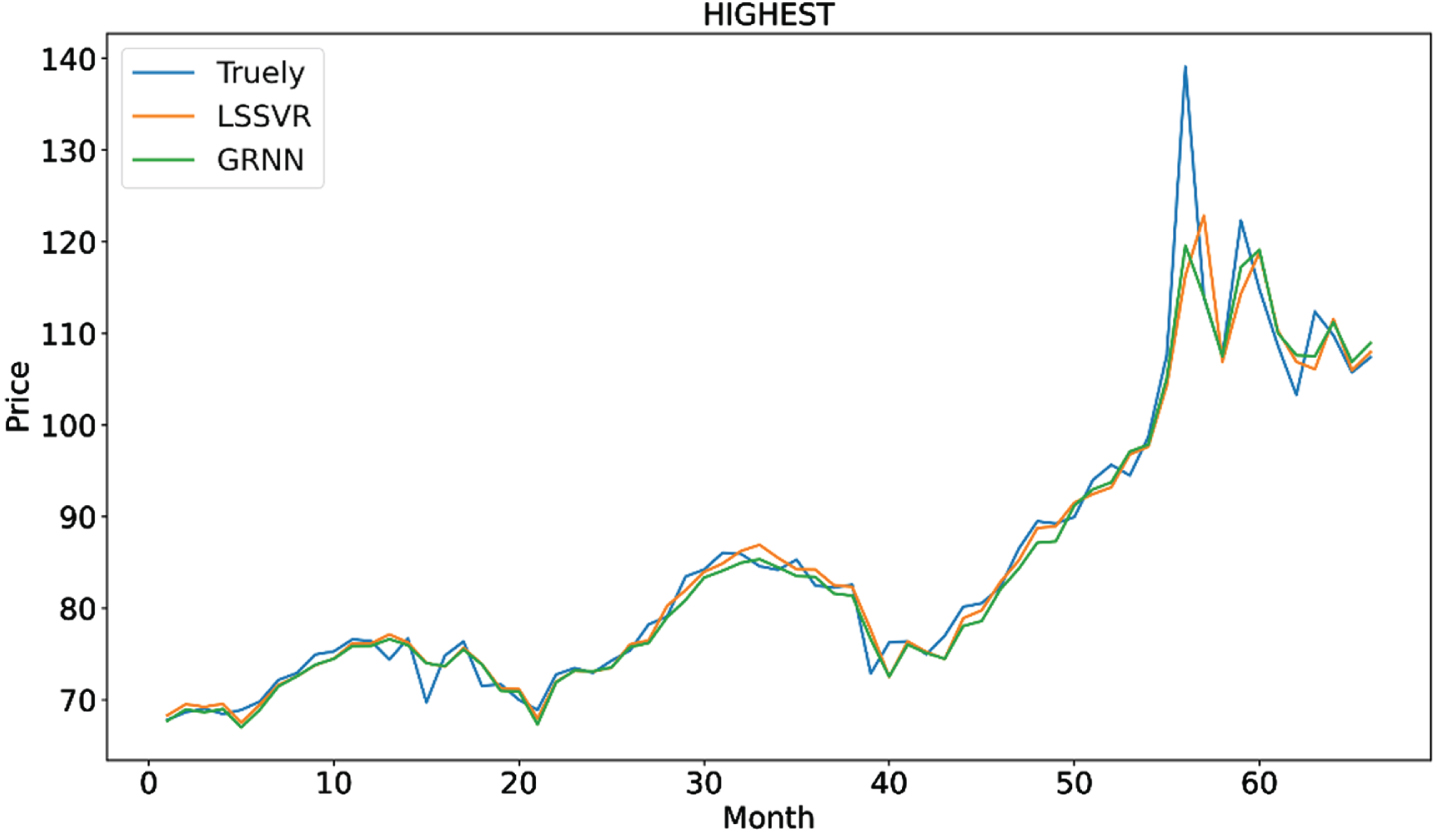
Fitting renderings of two prediction methods at the highest point.
The R2 fitted by the two prediction methods is calculated as Table 14, and R2 under different sample sizes are also calculated to ensure the stability of the model.
The R2 fitted by the two prediction methods
It can be seen from Table 14 that the R2 of LSSVR and GRNN fitting are around 0.95 in different sample sizes, indicating that the fitting effect is significant and the prediction result is effective. Meanwhile, in order to maintain the consistency of sample size, all the proportions in this paper are set at 10%.
According to Equations (21)–(23) in Definition 17, the prediction accuracy sequence of three points can be obtained as follows (Table 15 is asymmetric, and Table 16 is symmetric):
Then IOWGA operator is used to combine the predicted triangular fuzzy sequences by Definition 18, and the circumcenter and circumradius of the predicted triangular fuzzy sequence are calculated with Definition 18. By substituting the symmetric triangular fuzzy prediction sequence into Equation (30), the optimal weight is (w1, w2, w3) = (0.5105, 0.3511, 0.1384). And by substituting the asymmetric triangular fuzzy prediction sequence into Equation (29), the optimal weights with different parameter values are shown in Table 17.
The asymmetric prediction accuracy sequence of three points
The asymmetric prediction accuracy sequence of three points
The symmetric prediction accuracy sequence of three points
Optimal weights with different parameter values
Finally, the combination forecasting values can be obtained as shown in the Tables 18 and 19, in which Table 18 shows the symmetric triangular fuzzy combination forecasting values, and Table 19 shows the asymmetric triangular fuzzy combination forecasting values.
The symmetric triangular fuzzy combination forecasting values
The asymmetric triangular fuzzy combination forecasting values
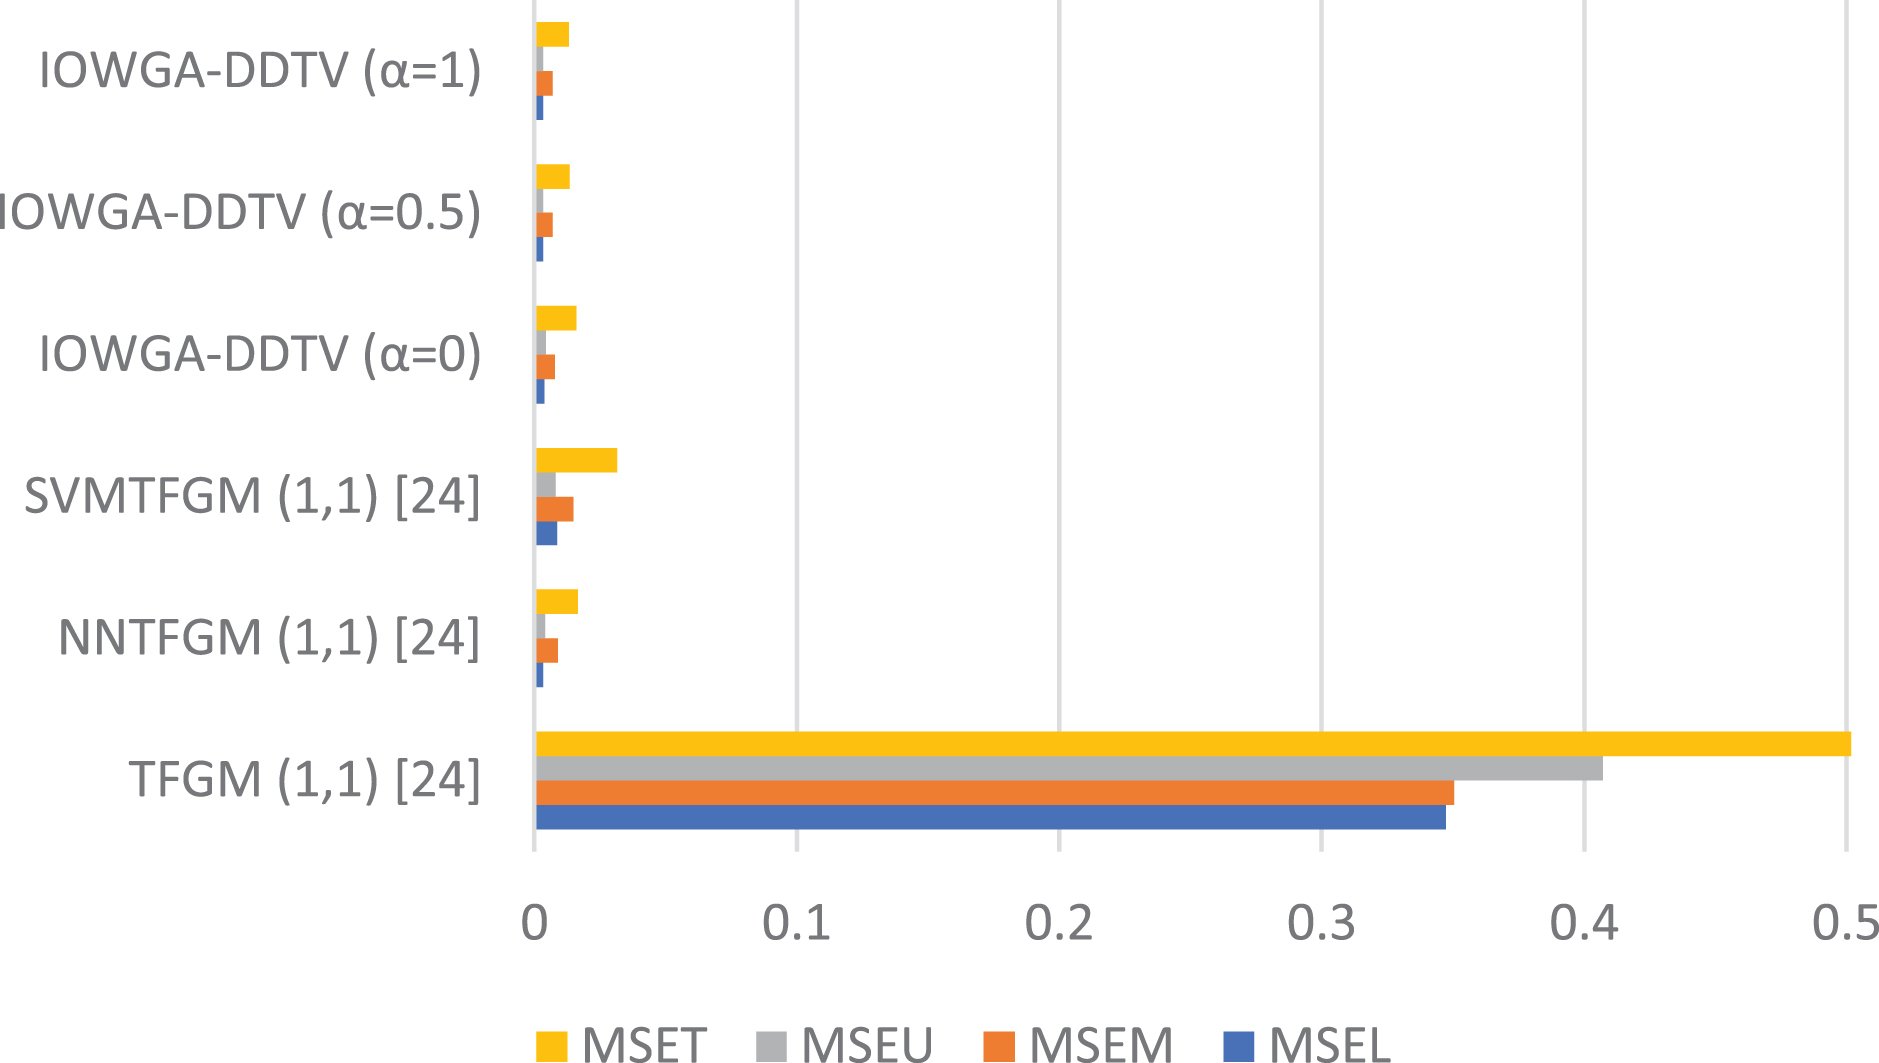
In order to verify the effectiveness of the combination forecasting model in this paper, in addition to the comparison of three single methods, the method in literature [25] is also selected for comparison. The errors are calculated for each group by Definition 19. In order to facilitate the comparison with the single prediction method, the prediction error indicators of each single prediction method are given in Tables 20 and 21. The symmetric triangular ambiguity is shown in Table 20, and several special values of asymmetry are shown in Table 21.
The symmetric triangular error indicators
The asymmetric triangular error indicators
Firstly, for single prediction methods ARIMA has lowest accuracy GRNN has highest accuracy and the accuracy of LSSVR is between another two methods, but the gap with the other two is even. At the same time, it can be found that the accuracy of each point of these three prediction methods is also inconsistent, ARIMA has higher accuracy at upper points LSSVR has higher accuracy at lower points and GRNN has higher accuracy at upper points. At last, it can be seen from Tables 20 and 21 that the values of RMSEL, RMSEM, RMSEU and RMSET of the model in this paper are all smaller than those of all single prediction methods and the combination forecasting model of triangular fuzzy number in literature [25]. Therefore, the combination forecasting model based on IOWGA and DDTV proposed in this paper effectively improves the prediction accuracy of triangular fuzzy numbers.
In the following, the parameter α is analyzed in the model. If α approaches to 1, then the triangular fuzzy distance is more important than circumradius, and if α approaches to 0, then the circumradius is more important than the triangular fuzzy distance. It can be seen from Equation (29) that the optimal weights change with the different values of α. In order to verify whether different α are feasible for the established model, take α ∈ [0, 1] and calculate the corresponding optimal weights and prediction error indexes, respectively. The results are shown in Figs. 13 and 14.
It can be seen from Fig. 13: w1 remains basically unchanged, w2 decreases as theα increases, w3 approaches 0 when α ≤ 0.16 and increases as the α increases from α = 0.16. As can be seen from Fig. 14, the prediction error indexes all are the lowest when the α is 0.16, monotonically decreasing from 0 to 0.16, and monotonically increasing from 0.16 to 1, which indicates that it is necessary to think about the triangular fuzzy distance and the circumradius.
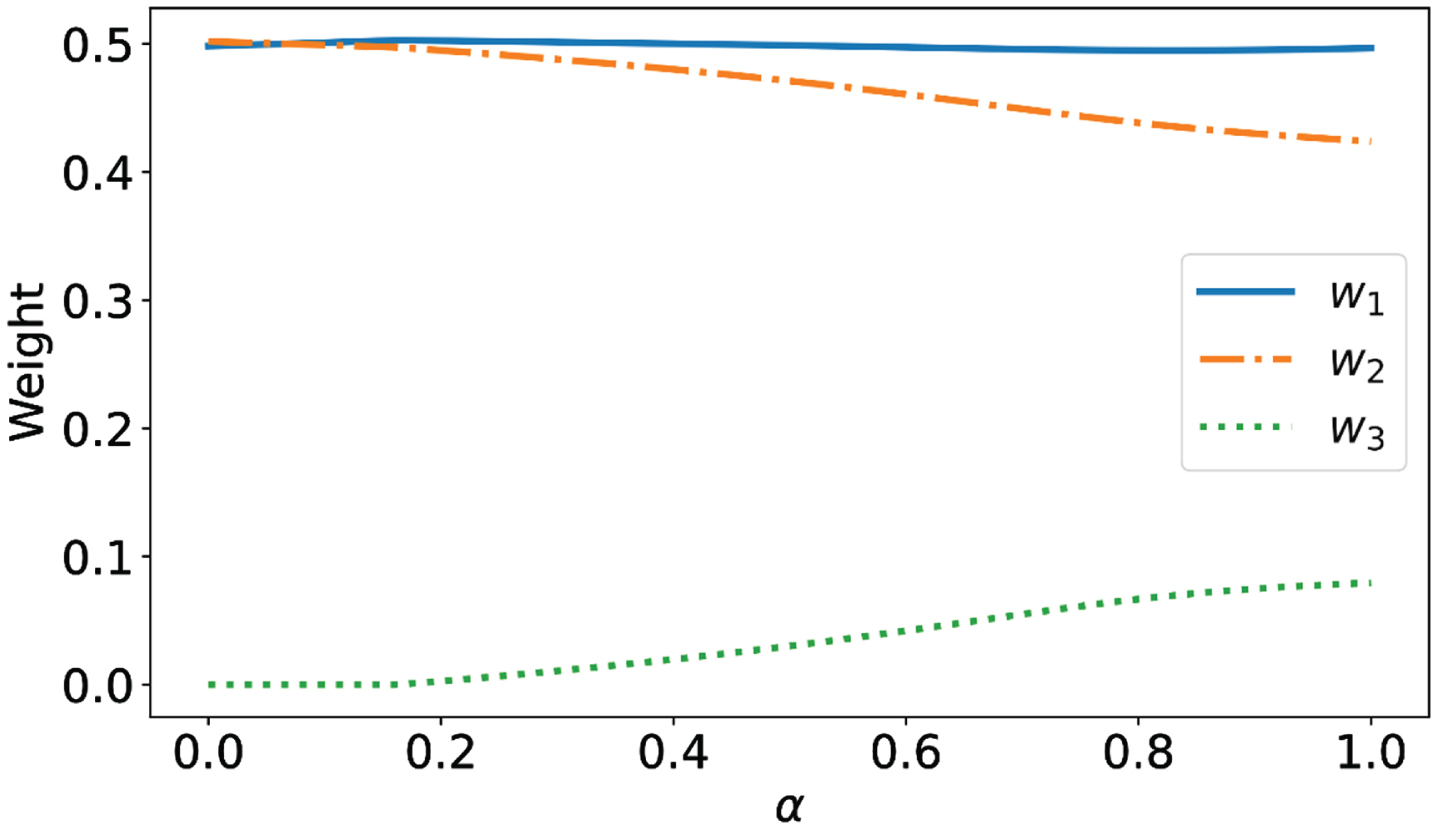
The relationship between and the optimal weights.
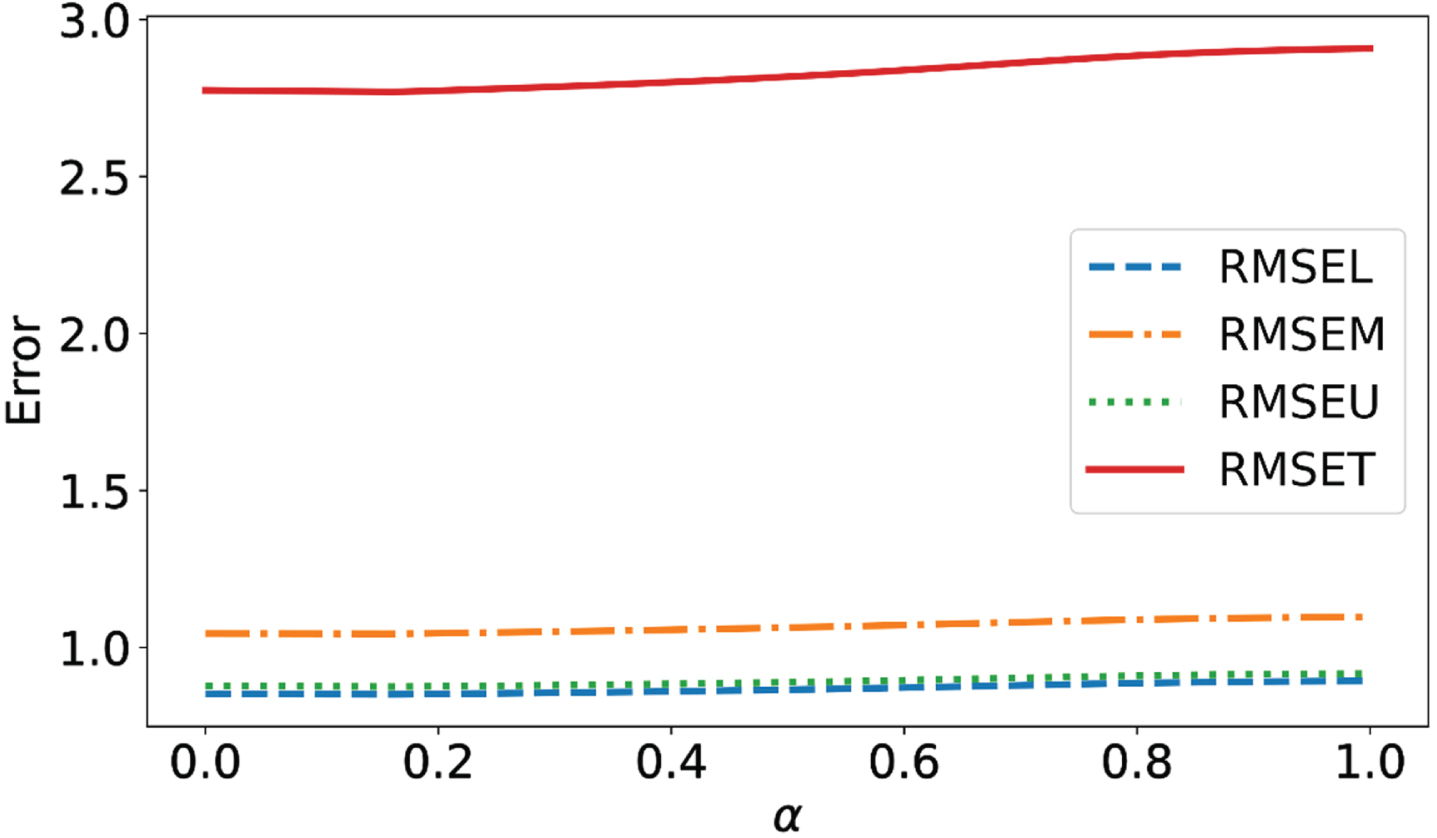
The relationship between α and prediction error indexes.
For the purpose of comparison, we construct two experiments, using seven different methods to compare. The first experiment is power load prediction. The combination forecasting method proposed in this paper is compared with the three methods proposed by Zeng [24], and also compared with the method proposed by Zhang and Chen [25], who converts a triangular fuzzy number (x
L
, x
M
, x
U
) to area and gravity center as
Error comparison for power load prediction.
At the same time, as mentioned above, the single forecasting method can be replaced, so another three single forecasting methods are selected for further analysis, including statistical ensemble learning approaches Adaboost Bagging and support vector machine approach SVR. The results are shown in Table 22.
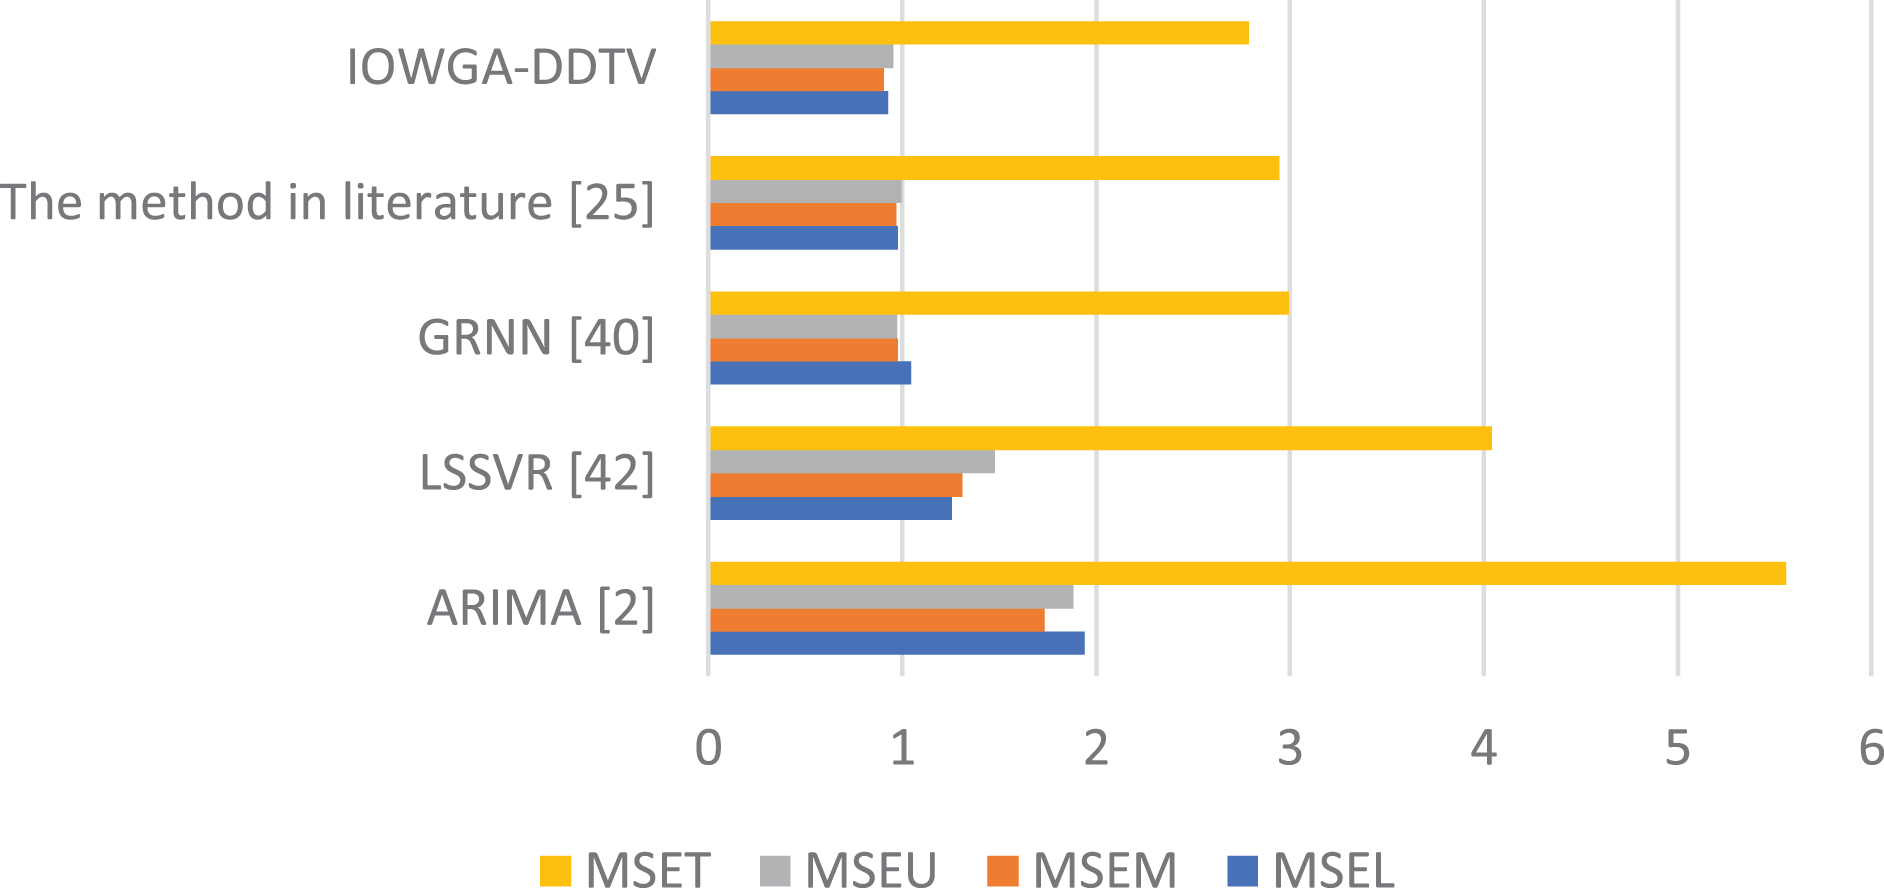
Error comparison for oil price prediction.
The error indicators for another three single forecasting methods
We can find that the overall accuracy of combination forecasting method is still higher than that of a single prediction method. Although SVR-Adaboost-Bagging combination forecasting method has higher accuracy, we can also find that when the accuracy gap of the single prediction method selected is too large, the accuracy of the combination prediction model will not be improved as expected, and it is even necessary to sacrifice the original method with high accuracy to balance the overall. Therefore, ARIMA-LSSVR-GRNN combination prediction model better combines the advantages of a single model, meanwhile it shows that the choice of a single forecasting model is very important, and how to choose a more suitable single forecasting model will be studied in the future research.
From what has been discussed above, the proposed method has the following characteristics: A prediction criterion for arbitrary triangular fuzzy numbers is proposed for the first time. It complements the theory of asymmetric triangular fuzzy prediction. In some practical applications, because the original data are not exact numbers, it is more reasonable to use fuzzy numbers to represent these data, so the prediction framework developed has a broad application prospect. The prediction model proposed in this paper has a good prediction effect at the inflection point and can reflect the fluctuation trend of triangular fuzzy sets well. IOWA and IOWGA operators are used respectively to integrate the prediction information and compare the results. It is found that the prediction errors of IOWGA operator are smaller than IOWA operator. It can also be concluded that replacing an operator more suitable for this scene will make the prediction results more effective for each prediction scene. The accuracy of the combination forecasting model in this paper is further verified by replacing the single forecasting method, and the advantage of combined forecasting is that it can learn from each other and make up for its shortcomings.
In this paper, a combination forecasting model based on IOWGA and dispersion degree of triangular numbers (DDTV) has been proposed based on ARIMA, LSSVR and GRNN for single prediction method. First, we have introduced three single prediction methods, namely ARIMA, LSSVR and GRNN, which combine the traditional statistical time sets prediction with the latest machine learning time prediction method to learn from and complement each other. In addition, we have proposed the distance of triangular fuzzy numbers and the dispersion degree of triangular fuzzy numbers based on circumcenter and circumradius to improve the prediction accuracy and make the application more widely. Finally, an example of BRT oil futures prediction has been given to show that the proposed prediction method is reasonable and effective. Under the same experimental conditions, the prediction performance of the model proposed in this paper is better than that of single prediction method and triangular fuzzy prediction based on barycenter area. Through the analysis of two examples, it can be found that the model proposed in this paper can be applied not only to the economic field but also to other fields such as engineering. Of course, the model works best for forecasting futures, securities, stocks, and other economic data, which are characterized by daily highest and lowest prices as well as closing prices. And these are the three pieces of information that people are most interested in and want to be able to predict accurately. Meanwhile, for other types of time series data, such as engineering data that can be used to predict power load, carbon emission data for environmental protection, and drug consumption data in the medical and health field, they can obtain the maximum and minimum values in a period of time to construct the upper and lower points. Although the selection of medium points in these series of data are controversial, the proposed model, however, is useful for any index selected as a medium point because it can be applied to arbitrary triangular fuzzy numbers rather than being restricted to median points. In the future work, we will introduce other factors affecting oil futures into the mixed model and study more suitable operators for triangular fuzzy combination forecasting to improve the prediction accuracy.
Footnotes
Acknowledgments
The work was supported by National Natural Science Foundation of China (Nos. 72171002, 71771001, U22A20366, 72271002, 71901001, 71901088, 72071001, 72001001, 72201004), Natural Science Foundation for Distinguished Young Scholars of Anhui Province (No. 1908085J03), Research Funding Project of Academic and technical leaders and reserve candidates in Anhui Province (No. 2018H179), Top Talent Academic Foundation for University Discipline of Anhui Province (No. gxbjZD2020056), Anhui Provincial Natural Science Foundation (No. 1808085QG211, 2108085QG290),College Excellent Youth Talent Support Program (gxyq2019236), Key Research Project of Humanities and Social Sciences in Colleges and Universities of Anhui Province (SK2019A0013), Statistics and Science Research Foundation of China (No. 2017LZ11), College Student Innovation and Entrepreneurship Training Program (Nos. 202210357011, 202210357240, 202210357278, S202210357015, S202210357016).
The authors would like to thank the reviewers and editors for their meticulous suggestions.