
Abstract
In this paper, we proposed classification and clustering algorithms that are proper for analyzing customer-related datasets, which are mostly high-dimensional with too many instances. For the clustering purpose, This paper presents a Cuckoo-Search-based Variable Weighting (CSVW) Clustering algorithm to obtain optimal variable weights of high-dimensional data for each cluster. This paper also proposes a deep Inferarer Classifier for categorizing customers using Bi-Directional Long Short-Term Memory (Bi-LSTM) neural network, which uses a Fuzzy Inferential Classifier on its last layer. The Insurance Company (TIC) and InstaCart datasets are utilized for the experiments and performance evaluation. Simulation results reveal that the proposed clustering algorithm generates appropriate Silhouette and Elbow criteria scores in a few cycles of execution in comparison to ordinal clustering algorithms. Also, the proposed classification algorithm with fuzzy soft-max classifier hits the better Classification Criteria in comparison.
Introduction
The customer is considered an essential part of a business market, and no business can be successful without customer satisfaction. Therefore, studying customers from different aspects is necessary to have a successful business. Here, data mining and machine learning algorithms help us to cluster, score or categorize customer-related data for further analysis. Separating customers into separate groups allows companies to predict what products their favorite basket contains and thus encourages the customers to buy more products. This can be used in other businesses such as bankruptcy prediction, financial markets, stock exchange, banking, etc. Identifying potential purchasers is a powerful approach to advertising a market or product. For example, an insurance company often wants to know which customers are willing to buy a particular product [1–5].
The data relating to the customers of the financial markets mainly have high dimensions. In some cases, the characteristics of this data include customer purchases which are sparse in nature. Clustering such type of data is usually a difficult task. Traditional clustering methods generally do not show good results when faced with such high-dimensional data. With the increase in dimensions, the dispersion of the data becomes very large, and the use of methods based on distance measurement in the entire dimension space becomes meaningless. This is because some data features may be irrelevant or redundant in the clustering process rather than the problem of dependent features. In this case, clusters of high-dimensional data are usually embedded in lower-dimensional subspaces. Thus, clusters should often be searched for in subspaces of dimensions rather than the whole dimension space. Clustering is computationally tricky in such conditions [6–8].
Using the k-means approach for clustering is another well-known technique that uses an iterative approach to minimize the sum of squared errors. But it supposes the same weight for the entire features in the dataset and ignores the effect of more useful features in the clustering process. Weighted clustering, in contrast, assigns normalized weights to each cluster based on its importance, which makes it more appropriate for clustering high-dimensional data. This type of clustering minimizes an objective function based on the k-means algorithm, iteratively. The weights related to each variable in a cluster normalize the Euclidean within cluster distance value [9–11, 31]. Considering that finding multiple weights in big data is a np-hard problem, optimization techniques can be used in this case.
In this paper, we proposed a new clustering algorithm by defining variable weights for each feature of the customer dataset, which uses the cuckoo search optimization algorithm in the objective function. In our clustering algorithm, instead of using the conventional local search strategies in the clustering process, we proposes a Cuckoo-Search-based optimizer to obtain optimal variable weights. The proposed clustering technique is also independent of the initial centroid of the clusters. The aim of using Cuckoo-Search optimization algorithm was that this algorithm has performed well in various real-world applications and optimization scenarios and specifically, the following reasons can be considered: Handling large search space: High-dimensional datasets usually have a large search space, and it can be challenging to explore all the possible combinations of features or variables. Cuckoo search algorithm uses a random mutation procedure, which helps to explore the search space efficiently and effectively. Finding global optimum: High-dimensional clustering problems often have multiple local optima, and it is necessary to find the global optimum. Cuckoo search algorithm uses a random walk strategy to explore the search space and can jump out of local optima to find the global optimum. Handling noise and outliers: High dimensional datasets often contain noise and outliers, which can affect the clustering results. Cuckoo search algorithm uses an adaptive step size, which helps to avoid getting stuck in noisy regions or outliers.
This paper will also propose an efficient deep-learning architecture for classifying customers based on the customers’ purchase behavior. The proposed deep learning structure uses a Bi-Directional LSTM learning network [19] to learn the investigated dataset’s time-series behavior. In the Bidirectional LSTM architecture, instead of training a single model, two models are presented that can manage long-term data better than the traditional LSTM. Also, this paper used a Fuzzy Inferential Classifier [20] which classifies LSTM Blocks’ output, fuzzily. The aim of innovating this classifier was that in some cases, the customers’ behaviors related to different classes have no significant difference with each other. The rest of paper is organisd as follow. In Section 2, an overview of the previous work is presented. Section 3 briefly describes the background algorithms used in this paper. In Section 4, the architecture of the proposed method has been expressed, containing the Cuckoo-Search-based variable weighting Clustering algorithm and the proposed Deep Inferrer architecture for classification. Experiments and results are discussed in Section 5. The overall method is also concluded briefly in Section 6.
Literature review
There are several researches in the literature which work on the clustering techniques for high-dimensional data. Here we summarize the most recent and impressive papers whith their pros and cons. At the end, we will conclude with the reason for presenting this research. The authors in [9] presented a clustering algorithm that is not sensitive to the initial values of the cluster centers. The presented method uses different weights for each variable in the clustering process. The presented method is a fuzzy extension of the standard k-means clustering algorithm, which can automatically determine the number of clusters by repeatedly calculating the weight of the feature values of the dataset and the membership value of each sample in the clusters. The authors in [7] proposed the Particle Swarm Optimizer (PSO) algorithm to cluster high-dimensional data by assigning different weights to each data set feature. Furthermore, the authors propose a feature-weighted fuzzy clustering algorithm based on multistrategy grey wolf optimization in [10].
Authors in [12, 13] have proposed an innovative model of data clustering. In the investigated data set, various features such as performance, interaction and social interactions are used to cluster players. The results of the presented algorithm have been compared with algorithms such as k-means, SOM and hierarchical clustering methods. Also, the authors in [17, 18] used the combination of K-Means and SOM algorithm to cluster customers based on the RFM model on the insurance industry dataset to identify customer needs and understand their characteristics. To overcome the convergence speed problem of large data set clustering methods, authors in [14, 15] proposed using Swarm-based algorithms such as flower pollination algorithm, black hole algorithm, bat algorithm and the like. The authors in [16] proposed a hybrid method using K-Means-based segmentation to predict customer behavior for future transactions. This research uses methods such as decision tree, clustering, rule extraction, and other such methods. The method presented in this article is not only very effective in identifying the behavior of new customers and predicting their profitability.
Also the authors in [30] proposes a modified cuckoo search algorithm (MCSA) for data clustering, which is an optimization technique used to group similar data points together. MCSA is designed to improve the efficiency and effectiveness of traditional cuckoo search algorithms in solving clustering problems. The experimental results showed that the proposed algorithm outperformed several clustering algorithms in terms of accuracy, clustering quality, and computational time. The paper lacks a detailed discussion of the key differences between traditional cuckoo search algorithms and the modified version proposed in the paper. While, the authors do not provide any theoretical analysis to justify the observed performance improvements. Finally, the paper is limited by its focus on benchmark datasets and the exclusion of real-world datasets. [31] proposes a new possibilistic Fuzzy c-means algorithm that utilizes an improved Cuckoo search method for data clustering. The proposed algorithm uses the concept of possibility theory to handle uncertainty in clustering, which allows the data points to belong to multiple clusters simultaneously. The Cuckoo search algorithm is used to optimize the clustering parameters and improve the convergence speed. Experimental results on several benchmark datasets demonstrate that the proposed algorithm outperforms other state-of-the-art clustering algorithms, The paper does not provide a comparative analysis of the proposed algorithm with other possibilistic clustering algorithms, which limits the scope of the study.
Based on the above reviews, any paper, So far, has investigated the cuckoo search optmaziation algorithm for clustering high-dimensional commercial data that was free of initial data centroids with variable weighting for dimensions. Also, few works have been done regarding the optimal classification of this data, which is referred to in this article
Background
Convolutional neural network Layers
Convolutional neural networks (CNNs) are formed by a sequence of processing layers that are connected through neurons. This structure aims to make a dense feature vector from the raw data. Two layers, Convolutional and Pooling, are usually used to build a CNN-based architecture. These layers are usually stacked placed on top of each other and perform different tasks. The data is input directly to the network, and it followed by several stages of convolution and pooling. The Convolutional layer is the main building CNNs and is responsible for extracting features from the input data. It consists of multiple filters or kernels that slide over the input data and perform element-wise multiplication with the data/features under the filter, producing new feature maps.
The structure of the convolution layer is shown in Fig. 1, where L is the level of the network layer, NL is the number of feature maps, and fL() is the activation function of the Lth layer. Also, for the convolution layer L, the size of the mask is defined as RL×CL.
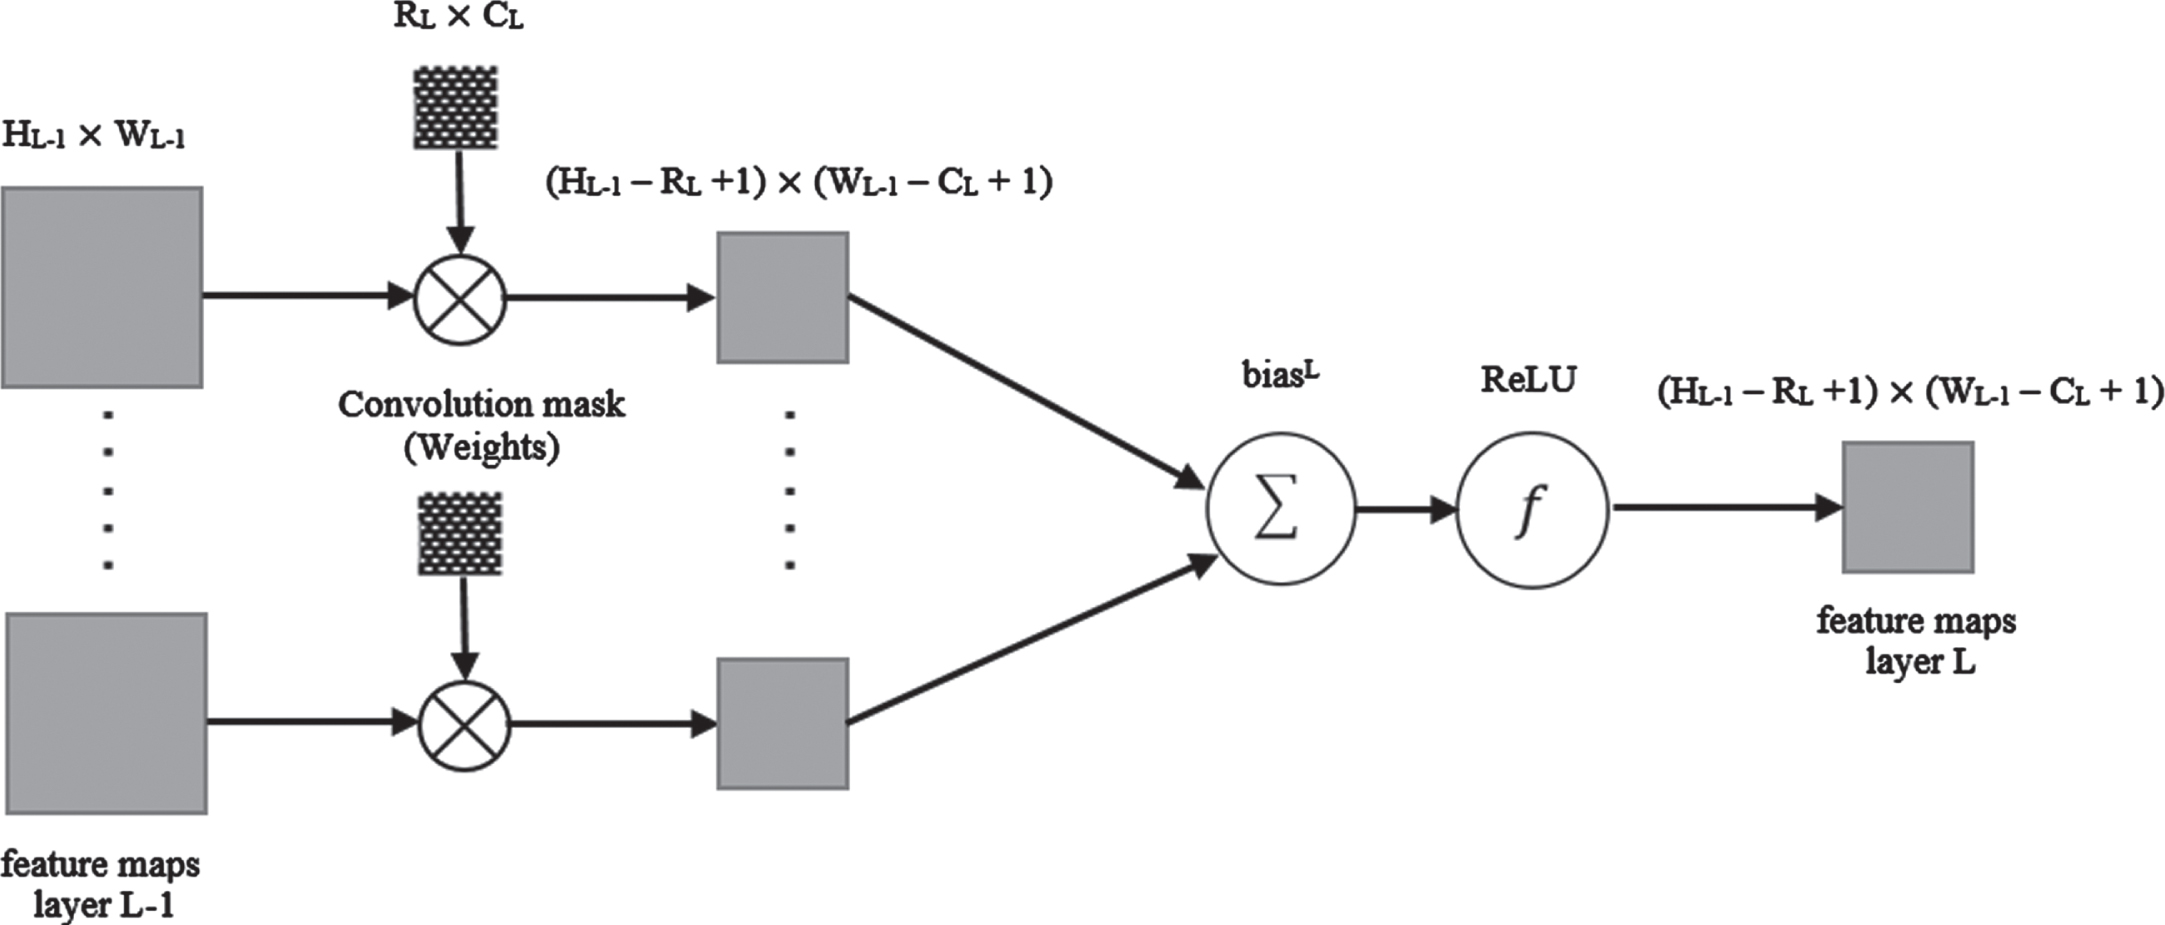
Convolution layer block diagram.
Let
The Pooling layer also performs the dimension reduction operation, whose structure is shown in the level (L) in Fig. 2. The function of this layer is to reduce the spatial size of the input width and height to reduce the number of parameters and calculations in the network and control overfitting. The most widely used dimension reduction operations are max pooling and average pooling operations, which extract the maximum value and the average value of the specified range, respectively. In the pooling layer, the nth feature map from the convolution layer (L-1) is divided into non-overlapping blocks (for example, 2x2 average pooling).
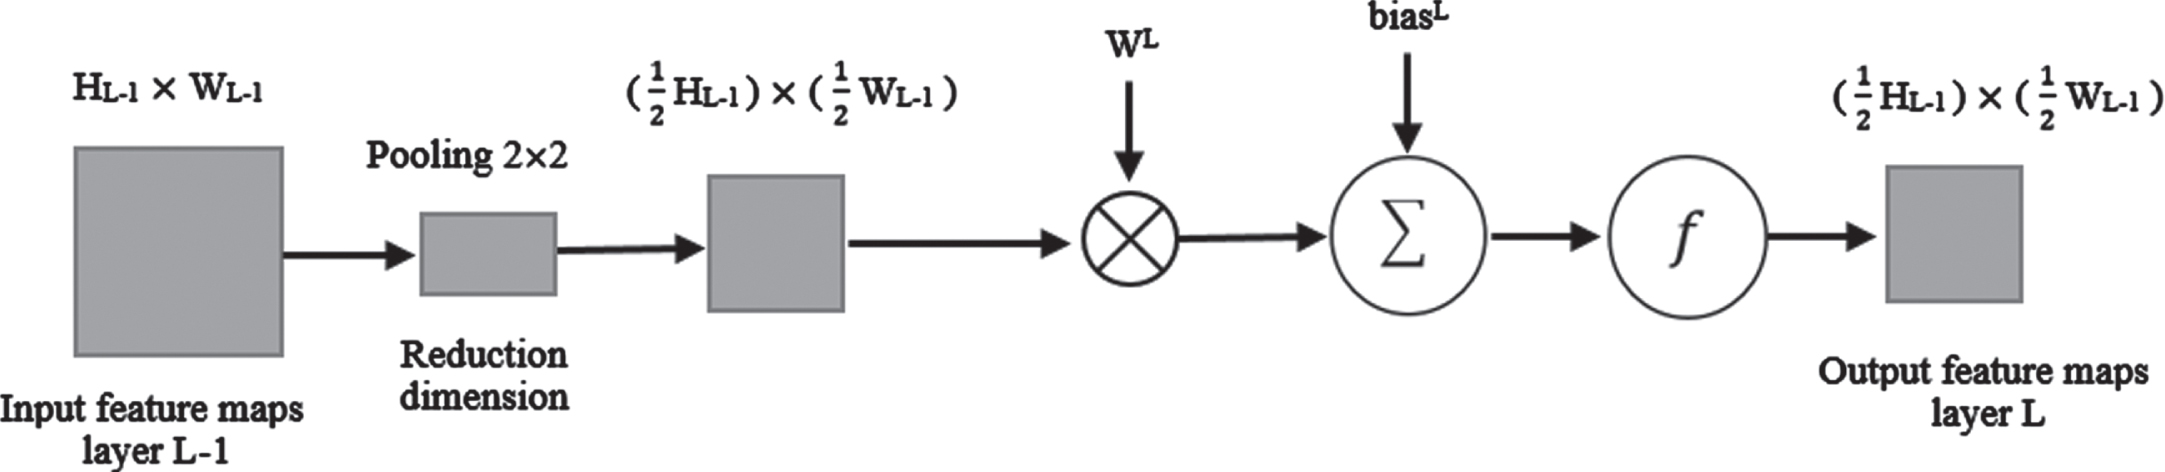
Pooling Layer block diagram.
BI-LSTM combines the LSTM algorithm and the bi-directional recurrent neural network (Bi-RNN). Graves and Schmidhuberl first proposed Bi-LSTM for phoneme classification [19]. In B-LSTM (Fig. 3), in the first round, LSTM is applied forward, and in the second round, it is reversed, i.e., backward. Data trained late in the LSTM neural network responds better in the test phase than data trained early in the neural network. Therefore, the data is trained once from beginning to end and from the end to the beginning. This structure allows networks to have back-and-forth information about the sequence at any time. The output of the LSTM blocks then fed into a classifier to classify the input data [19].
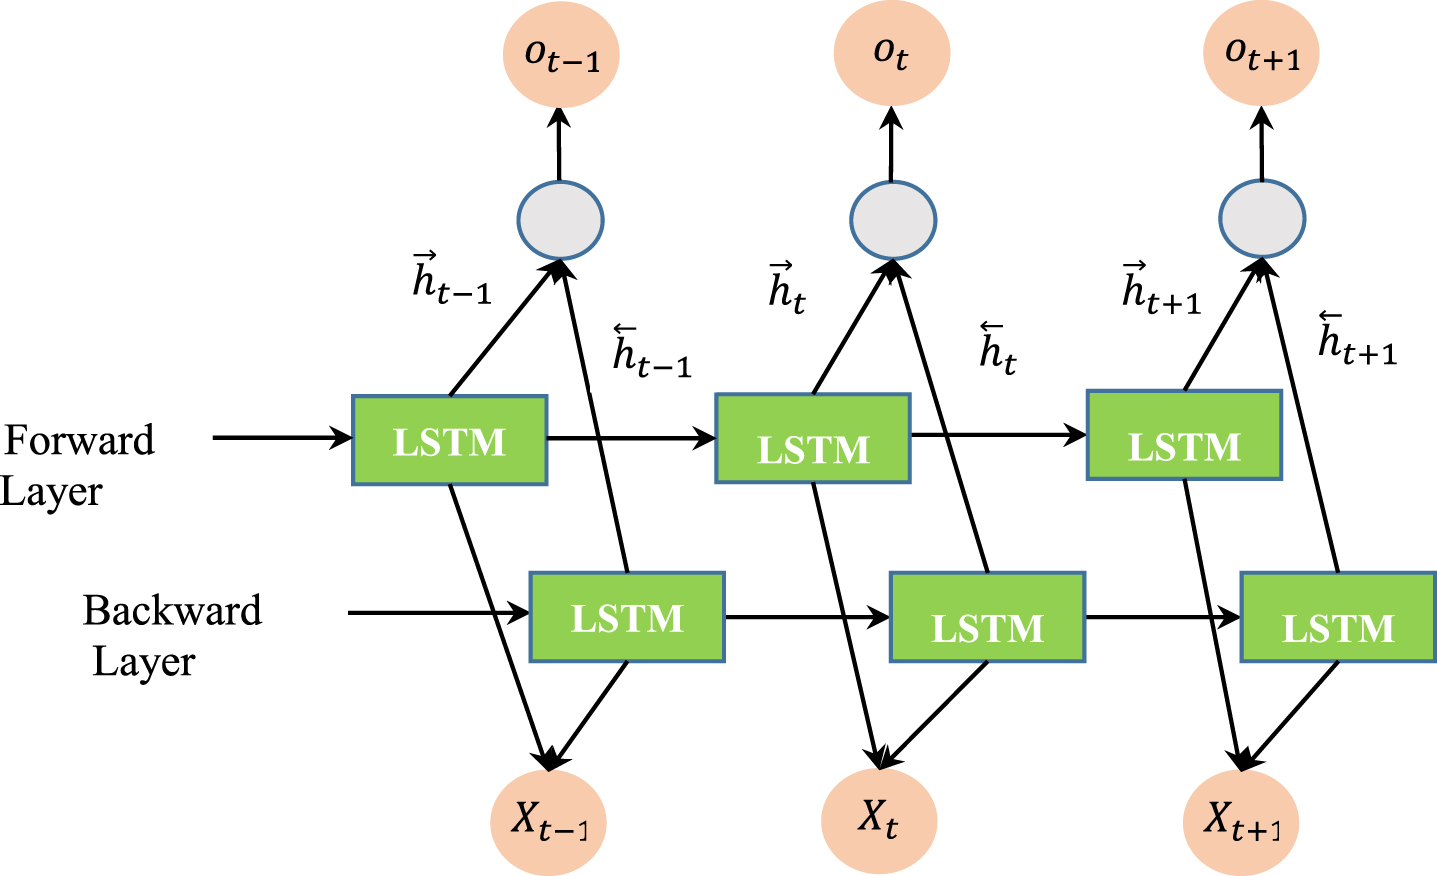
Schematic of the BI-LSTM algorithm.
Cuckoo Search Optimization Algorithm is inspired by the lifestyle (such egg-laying and reproduction) of a family of birds called Cuckoos. This algorithm has performed well in various real-world applications and optimization scenarios. The initial population of the cuckoo optimization algorithm produced by cuckoo eggs and adult cuckoos. Each egg in each nest represents a solution. This bird has the habit of laying eggs in other birds’ nests. The eggs will develop into adult cuckoos in the host bird’s house if not detected and destroyed by the adult host birds. The adult cuckoos may migrate to the new group, hoping to find an optimal place for reproduction and life. The algorithm aims to replace the not-so-good solutions in the nests with new and possibly better solutions (eggs of cuckoos). Depending on the problem’s complexity, each nest may contain one or several eggs (solutions) [21–23]. The population of cuckoos is initialized through random initialization of variables regarding the desired optimization problem. A number of eggs are assigned to each cuckoo. This could be bounded between N
min
and N
max
. For each cuckoo, the Egg-Laying Radius (ELR) is specified. Each cuckoo lays eggs within the specified laying radius. The ELR is described as below:
In the above equation, α is a parameter that controls the maximum value of the spawning radius, var
h
represents the upper limit and var
l
shows the lower limit of the decision variables. The host bird destroys % ρ of Cuckoo eggs. This value usually equals ten percent of the laid eggs and includes solutions that cannot converge to the optimal solution. The habitat of each adult cuckoo is evaluated (the amount of profit is determined). According to the N
max
parameter, the cuckoo population in the environment is controlled, and the cuckoos that live in the worst habitats are destroyed. The cuckoo population is clustered, the average profit of cuckoo groups is calculated and the best habitat is selected as the migration destination of other groups. The cuckoo population migrates towards the selected optimal habitat. If the population of cuckoos converges to the global optimal point or more than 95% of the population of cuckoos converges to a specific habitat, the execution of the algorithm is stopped; Otherwise, the execution of the algorithm is transferred to step 2 and the algorithm is executed again.
Proposed method
As stated, in this paper we proposed classification and clustering algorithms that are proper for analyzing customer-related datasets. For the clustering purpose, This paper proposes a Cuckoo-Search-based variable weighting Clustering algorithm to obtain optimal variable weights of high-dimensional data to each of the clusters. This paper also proposes a deep Inferarer Classifier for categorizing customers using Bi-Directional Long Short-Term Memory (Bi-LSTM) neural network which uses a Fuzzy Inferential Classifier on its last layer. A details description of each of the proposed algorithms is presented as follows.
Cuckoo-Search-based variable weighting Clustering algorithm
In this section, to optimally weight features in high-dimensional data clustering, we have proposed a Cuckoo-Search-based variable weighting Clustering algorithm called CSVW. To transform the upgraded k-means minimization problem by a cuckoo search optimizer, we used the variable weights matrix in the objective function. In the following, we provide a detailed description of the proposed CSVW algorithm. Our new algorithm uses a weighted k-means objective function, which calculates the sum of the intracluster distances of each cluster with more attention to its associated features. If the feature from the data set is founded to be unrelated to that cluster, a small weight is assigned to it, and as a result, it will not affect the total intra-cluster distance.
On the other hand, features that have a high correlation with a cluster get larger weights. This makes these variables to be more helpful in identifying data objects to their associated cluster. The presented clustering performance largely depends on using a suitable objective function and an efficient search strategy. The objective function determines the quality of the clustering and the search strategy affects the achievement of the optimality of the objective function [7].
Cuckoo Search for variable weighting (CSVW)
Suppose we have dataset X with n data objects and m dimensions which are supposed to be portioned into k clusters. U, Z, and W represent the membership matrix of the data objects to the clusters, the cluster centroids matrix, and the weight matrix associating dataset features to the clusters. Throughout this paper, we adopt the notations in Table 1.
The description of notation in the proposed method
The description of notation in the proposed method
First, we define the initial cuckoo swarm. Each cuckoo includes a complete weight matrix Wm,k and the Z matrix (which initially holds k different data objects randomly chosen out of all data objects). Each wl,j cell in matrix W corresponds to the weight of dimension l alonge cluster j. For each cluster we initially set wl, j = 1/m related to each dimension. The process iterates by updating U, Z, and W matrices using equations 2–4. The whole process terminates until reaching the maximum iteration or hitting the minimum value for the objective function.
The algorithm details are as below:
The position swarm W of variable weights are set randomly. Each object in the W swarm represents a complete weight matrix relating dimensions to the clusters. The swarm Z of cluster centroids is k different data objects randomly chosen out of all data objects. Each object in the Z swarm represents a complete cluster centroid vector which is directly related to the corresponding index of the W matrix. The Z and W swarms are segmented in multiples of beans as cuckoo eggs in nests. Then we have nests of solutions, a portion of Z and W swarms.
Repeat:
–For each of the eggs in a nest, the U matrix, which holds the cluster membership information of any data objects has been updated using equation (2), based on the current
This is a K-means based function which consider the distance to the centroids based on the weighting coefficients. Here, β is a user-defined parameter that has non-negative values. A large value of β makes the objective function to be more sensitive to the changes in weight values. Its large values cause variables with high weights to play a strong role in distinguishing between related and unrelated variables (dimensions). For the case β=0, it is as like as k-means algorithm.
–After determining the matrix U, equation (3) has updated the Z matrix.
–Holding the Z and the U matrixes, the W matrix has been updated using equation (4). Here h is a parameter that controls the influence of X on wl,i.
Here we have used a normalized representation of variable weights in the objective function, and its optimized value is investigated using the Cuckoo Search algorithm. The optimization algorithm looks for the appropriate weight for each feature to minimize the sum of all intra-cluster distances. % ρ of Cuckoo eggs in each nest with the lowest fitness value will be destroyed and replaced with the new solution. Three nests (this is arbitrary and deduced by the try and error) with the lowest average fitness value will migrate to the three best nests, randomly.
In the proposed classification architecture that is depicted in Fig. 4, we employ convolution and pooling layers, recursively. In the pooling layer, a feature vector is obtained by considering a maximum operation. In the following, the Bi-LSTM layers are stacked to learn the time series behavior of the data. Inspired by [20], we used soft-max classifier for classifying the output of the Bi-LSTM.
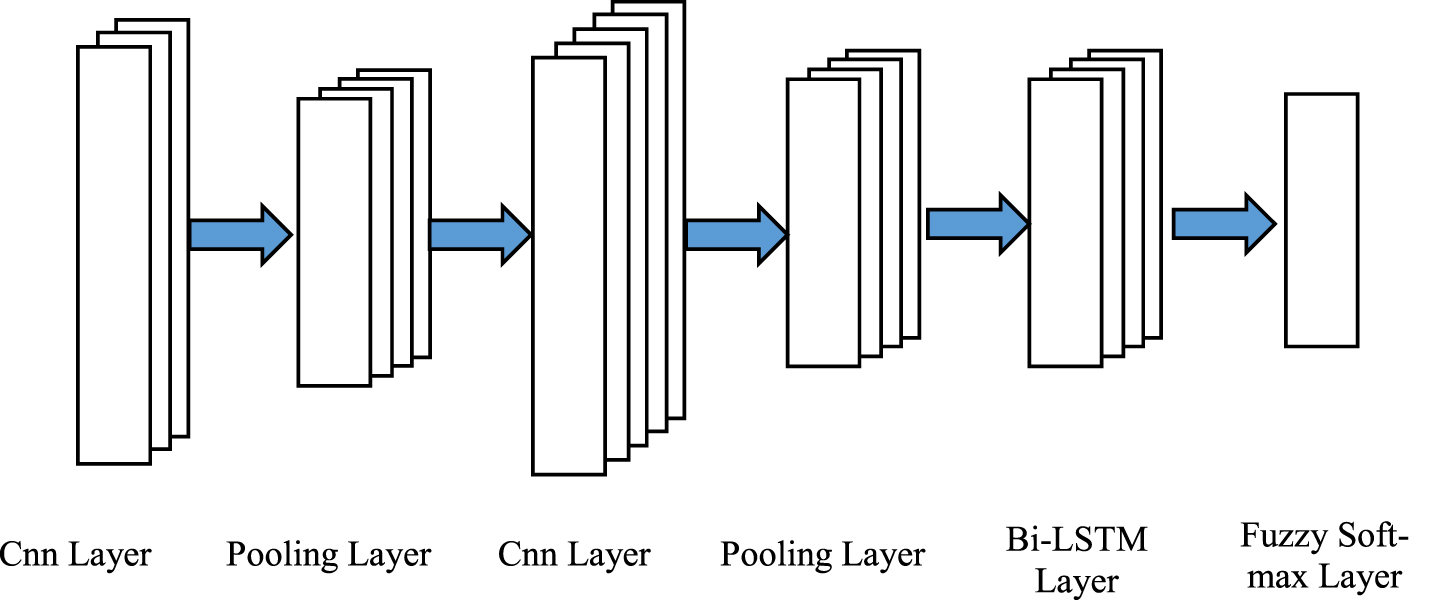
The presented classifier block diagram.
The presented classifier block diagram.
As a variation of the Soft-max logistic function, the Soft-max classifier reports back the “confidence score” for each class. In its simplest mode, the final class is the item with the highest confidence score in the list. By the m different blocks, the Bi-LSTM layer has the output form shown as Equation 8. In the last phase, the Soft-max classifier in the Dense layer transforms the raw outputs of the Bi-LSTM layer to the class probabilities. The classification of customers is executed by selecting the one with the highest score [20, 25].
The T C j (HV) stands for the probability of selecting class C j as the final calss [20, 25].
An Intuitive Fuzzy Set (IFS) A in the domain of X is defined as an object as follows where μ A : X ⟶ [0, 1] defines membership degree and ϑ A : X ⟶[0,1] refers to non-membership degree of an object.
For every x ∈ X, 0≤μ A (x) + ϑ A (x)≤1. Authors in [26] stated that IFS Intuitionistic Fuzzy Number (IFN) could the membership degree and non-membership degree of IFN and the related rankimg method. The authors in [28] propose a method that uses score and accuracy functions to calculate IFN. In this paper, we use a variety of score functions introduced by [26]. Supposing the Intuitionistic Fuzzy α i = μ i , ϑ i , then the score function is presented as Equation 9.
Considering the membership and non-membership value of the Bi-LSTM h state to the corresponding classes the T C j (HV) would be as below. T C j (HV) corresponds to the probability value of selecting class C j [20].
In this equation, the v c j (h i ) stands for the weight of the arc connected the h i input node to the C j output class. f (x) is an activation function. The fuzzy significance of the input node (h i ) associated to the output class (C j ) symbolized with s C j (h i ). This is expressed by Equation 11. In this equation, μ C j (h i ) and ϑ C j (h i ) corresponds to the fuzzy and non-membership membership of the input node h i associated to the output class C j , respectively.
Considering V as a weight vector that connects each of the Bi-LSTM layer nodes to the associated output class, the values of the parameters μ C j (h i ) . ϑ C j (h i ) are determined. Where, v nj points to the weight of the arc connecting n’th input node in the LSTM layer to the output class (C j ).
In this section, we conducted multiple experimental evaluations to determine the validity of the proposed method on two famous commercial datasets. The investigated datasets are Insurance Company Benchmark dataset [27] and Instacart Dataset [28]. The proposed Fuzzy Soft-max classifier is implemented using the Keras library [29]. In the classification task, the data are segmented into mini-batches of 100 through training and testing phases. The learning rate sets to 10e-3 with a decay rate of 0.95. For the regularization purpose, we used a drop-out strategy with probability p = 0.3 [21]. The main parameters of the proposed deep neural network have been adjusted by defining a validation subset.
The parametes of the CSVW
The parametes of the CSVW
Also for the variable weight clustering algorithm, we set the parameters as below. The β parameters were adjusted using experiments as 8.
As our proposed method consists of both clustering and classification tasks, here we introduce the investigated criteria for evaluating the proposed method.
Silhouette
This criterion is a tool for identifying the quality of clustering and selecting members in a cluster. This value has a value between 1 and -1. The closer the number is to one, the better the clustering and negative values mean the selected cluster is not good and the data may belong to neighboring clusters. Euclidean or Manhattan distance can be used for the distance in this criterion. In general, if the overall value of this criterion is high in a cluster, it means that the cluster in question has clustered the data better. Here, this criterion is used to select the number of clusters. That is, the higher the value of this metric in any number of clusters, that is, clustering with that number of clusters is better for the data. Finally, to better express this criterion, it states whether there is a large gap between each sample and all other samples in the same cluster or among different clusters. Silhouette Visualizer is a visualization tool for the Silhouette benchmark that displays data graphically in its clusters. Based on this, the value between 1 and -1 shows the data graphically and the appropriate cluster can be selected from the events.
Elbow
This metric is one of the methods used to select the number of clusters in unsupervised clustering data. It is clear that if we choose too few clusters, data from the data set will be lost and will not be placed in the right cluster, on the other hand, if the number of clusters is chosen too small, small differences will become important and we will not have a proper clustering, this metric using the location The intersection of two graphs defines the clustering proposal.
Classification criteria
In order to evaluate the performance of machine learning algorithms for classification problems, different criteria can be used. The following criteria are used in this article:
The Insurance Company Benchmark dataset
This dataset proposed in the CoIL 2000 challenge contains customer information of an insurance company [27]. This dataset includes 86 variables related to customers (including demographic variables (1-43) and product ownership variables (44-86)). The data is for predicting the purchase of caravan insurance policies by users and includes 5822 records. All customers living in areas with the same zip code are assumed to have the same demographic characteristics. Variable 86 (Purchase) indicates whether the customer has purchased a caravan insurance policy or not.
The dataset includes three species: tic_2000_train_data: dataset for training a validating prediction models and creating explanations (5822 customer records). tic_2000_eval_data: dataset for predictions (4000 customer records). Its format is similar to the training data, only it does not have a target variable. Participants are supposed to return only the list of predicted targets. tic_2000_target_data: is the “target” variable for the evaluation dataset.
Instacart dataset
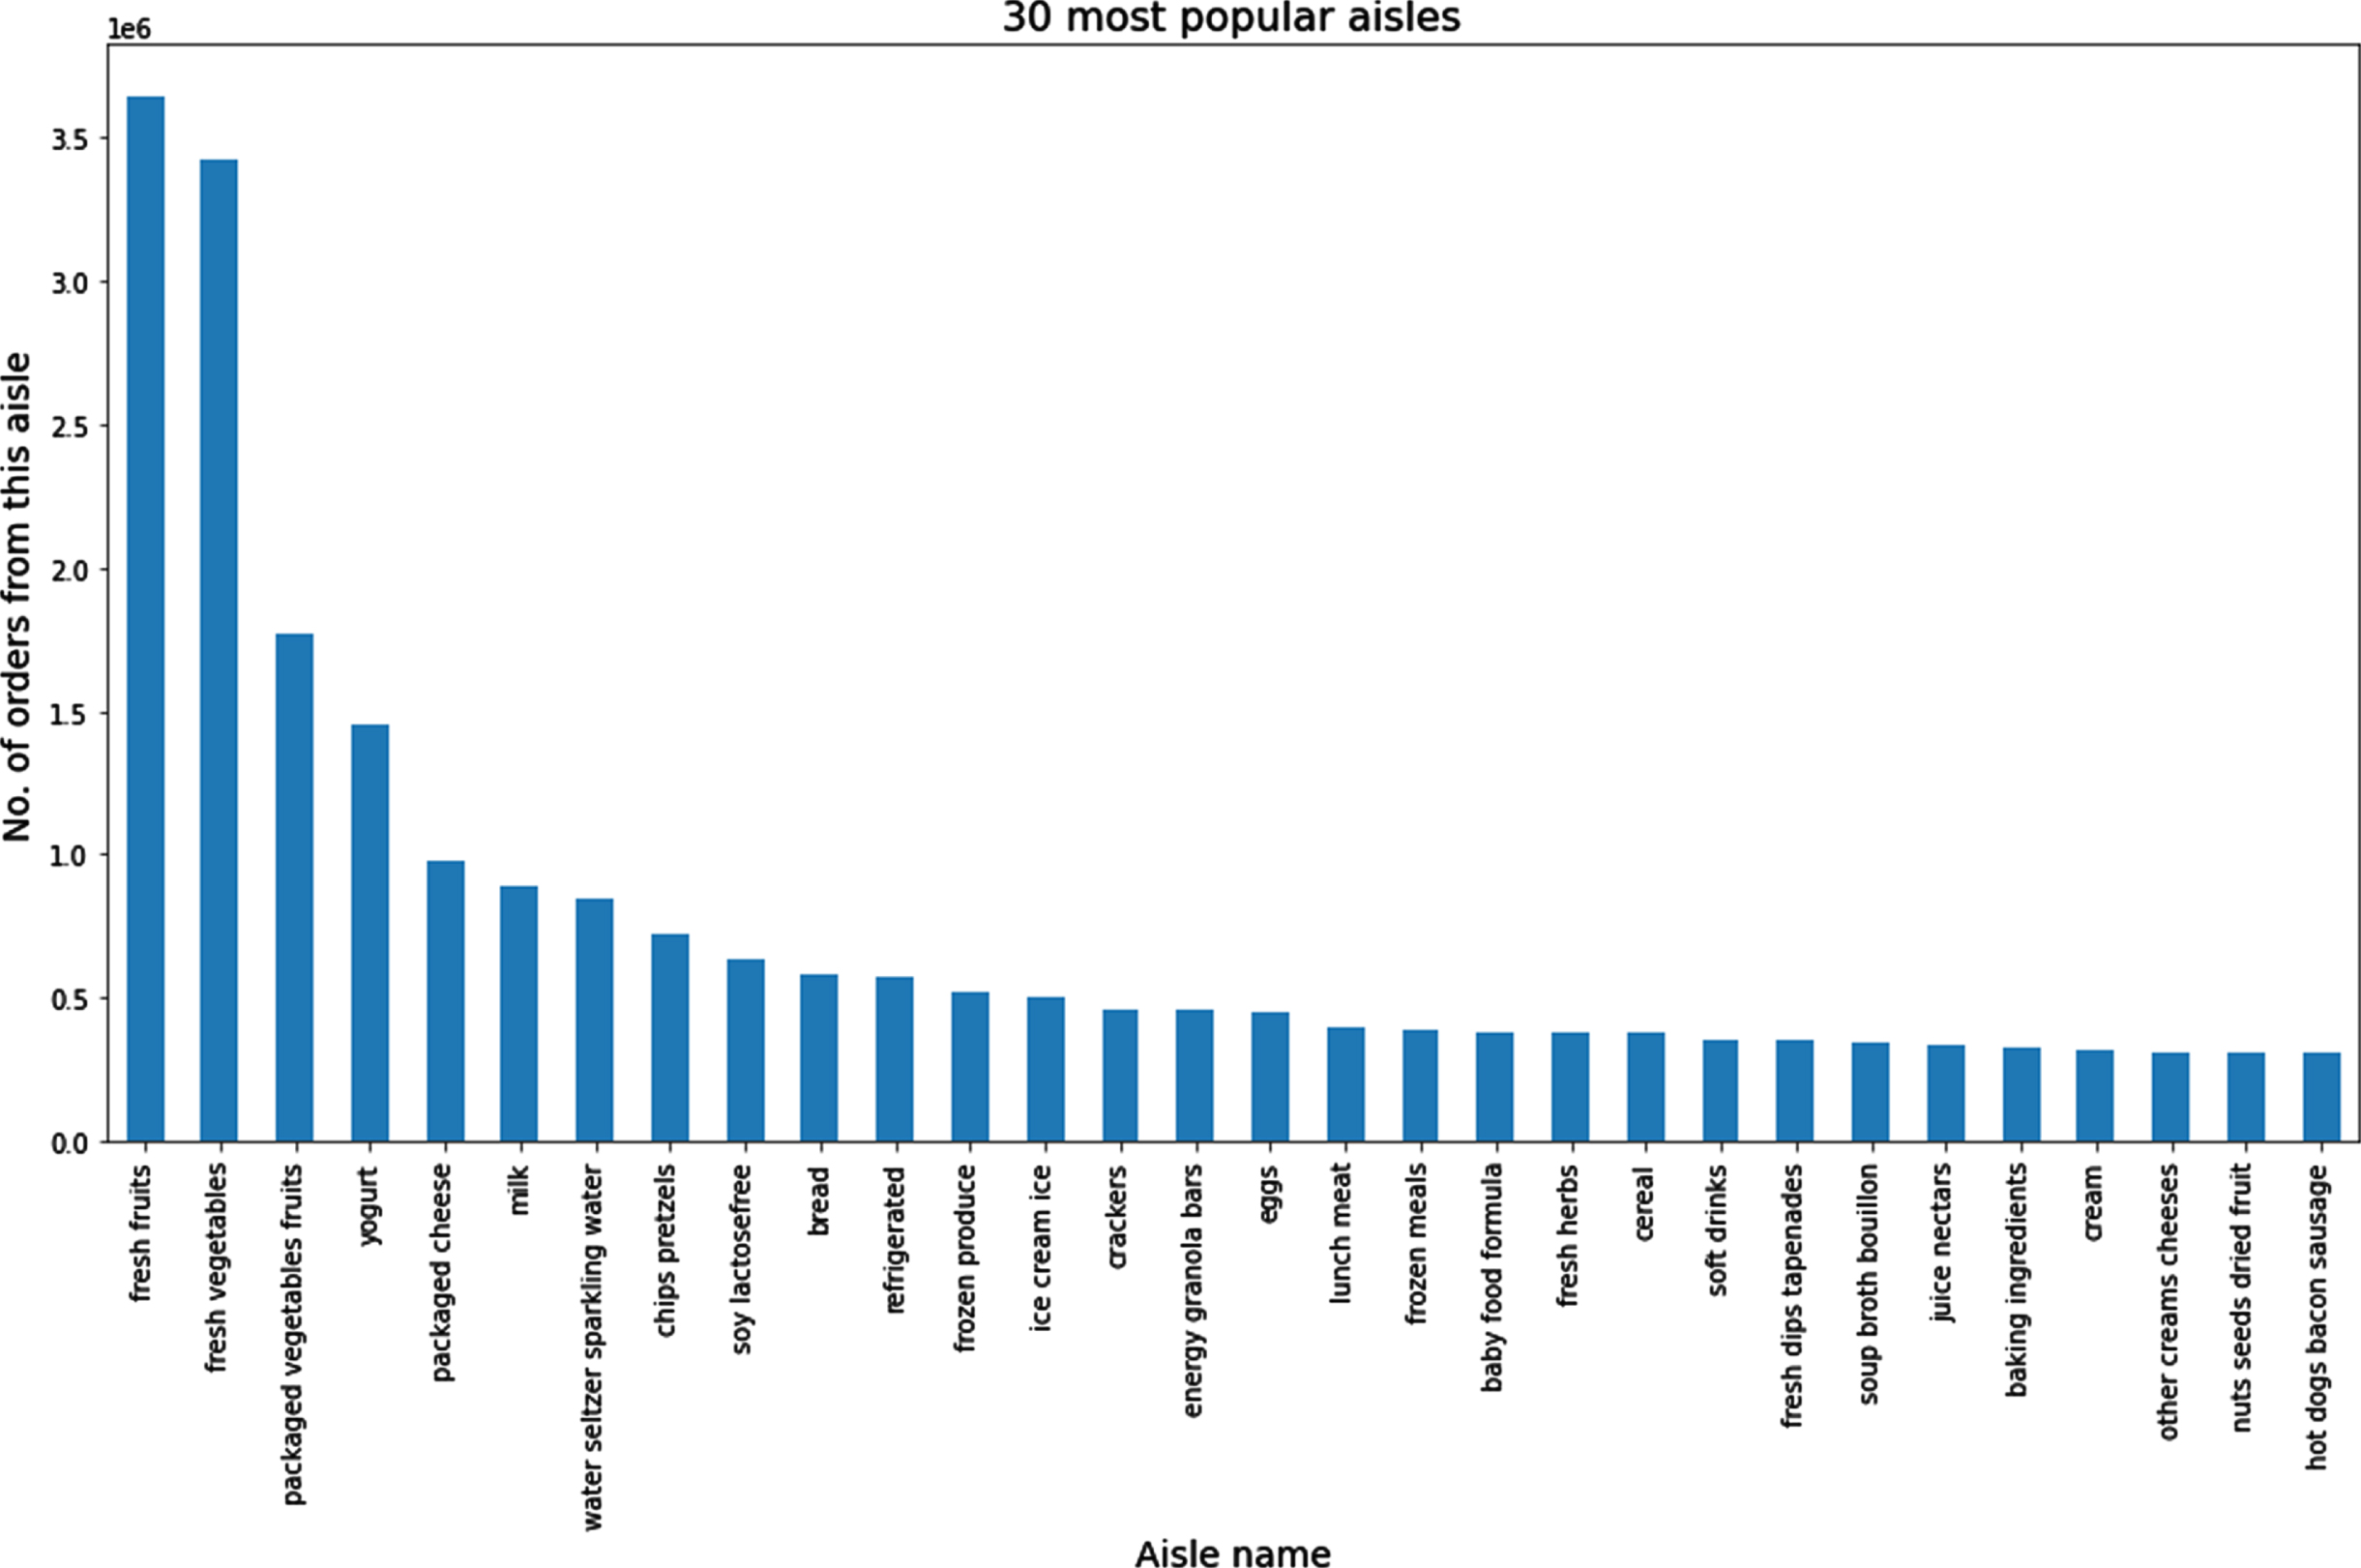
It shows the order information of more than 200 thousand users (206,209) over time. This data includes 3 million orders of these users from the Instacart store, ultimately aiming to predict the user’s next order and his next choice. In this data, the order day and week and the time between each user’s orders are specified. This dataset contains 7 CSV files as follows [28]: Aisles.csv (aisle_id, aisle): details of aisles Departments.csv (department_id, department): details of department Products.csv (product_id,product_name,aisle_id,department_id): details of a product Orders.csv (order_id, user_id, eval_set(prior/train/test), order_number, order_dow, order_hour_of_day, days_since_prior_order) It consists of order details placed by any user. Prior data: The history of users’ orders. Train data: Current order data of every user. Test data: Future order data for each of the users. Order_product_prior.csv (order_id,product_id,add_to_cart_order, reordered): consists of all product details for a train order add_to_cart_order: denotes the sequence in which products were added to the cart. reordered: product is reordered? (1/0) Order-product_train.csv (order_id, product_id, add_to_cart_order, reordered): consists of all product details for any prior order sample_submission.csv (order_id,products) Fig. 6 illustrates the 30 most populare Aisles names that are ordered by customers.
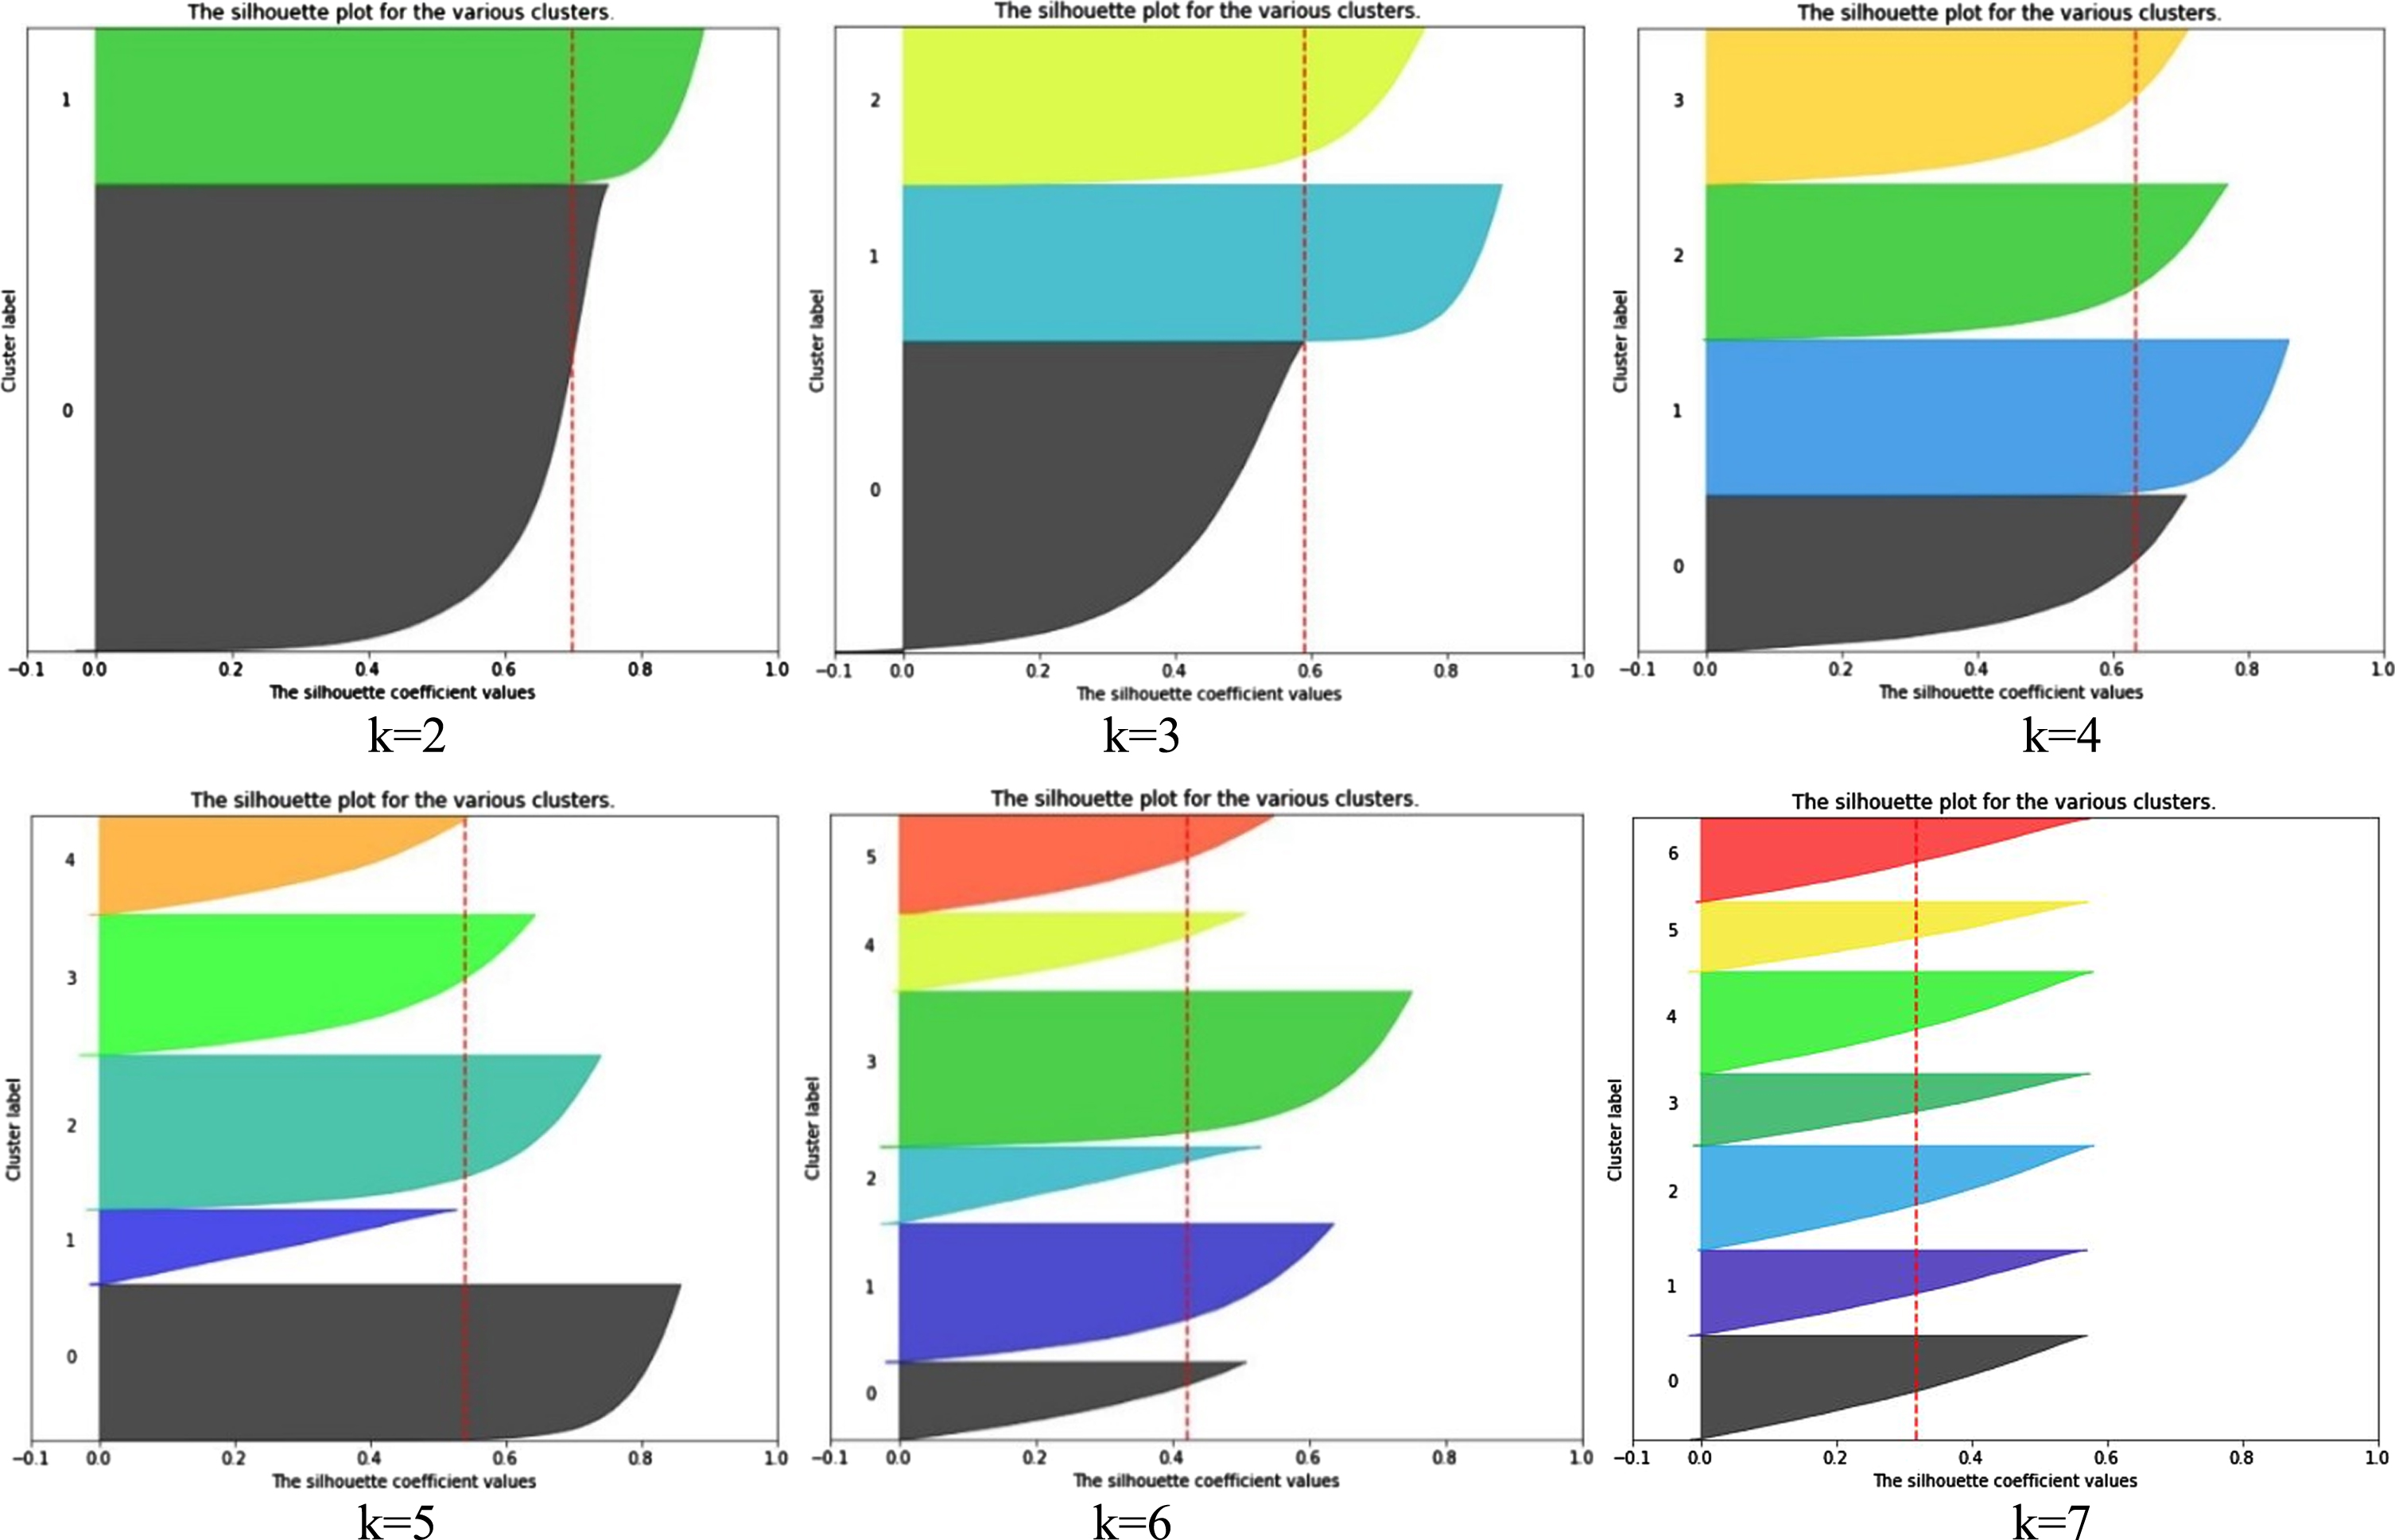
Visualization of the Silhouette score values for different Cluster numbers of InstaCart dataset from k = 2 to 7.
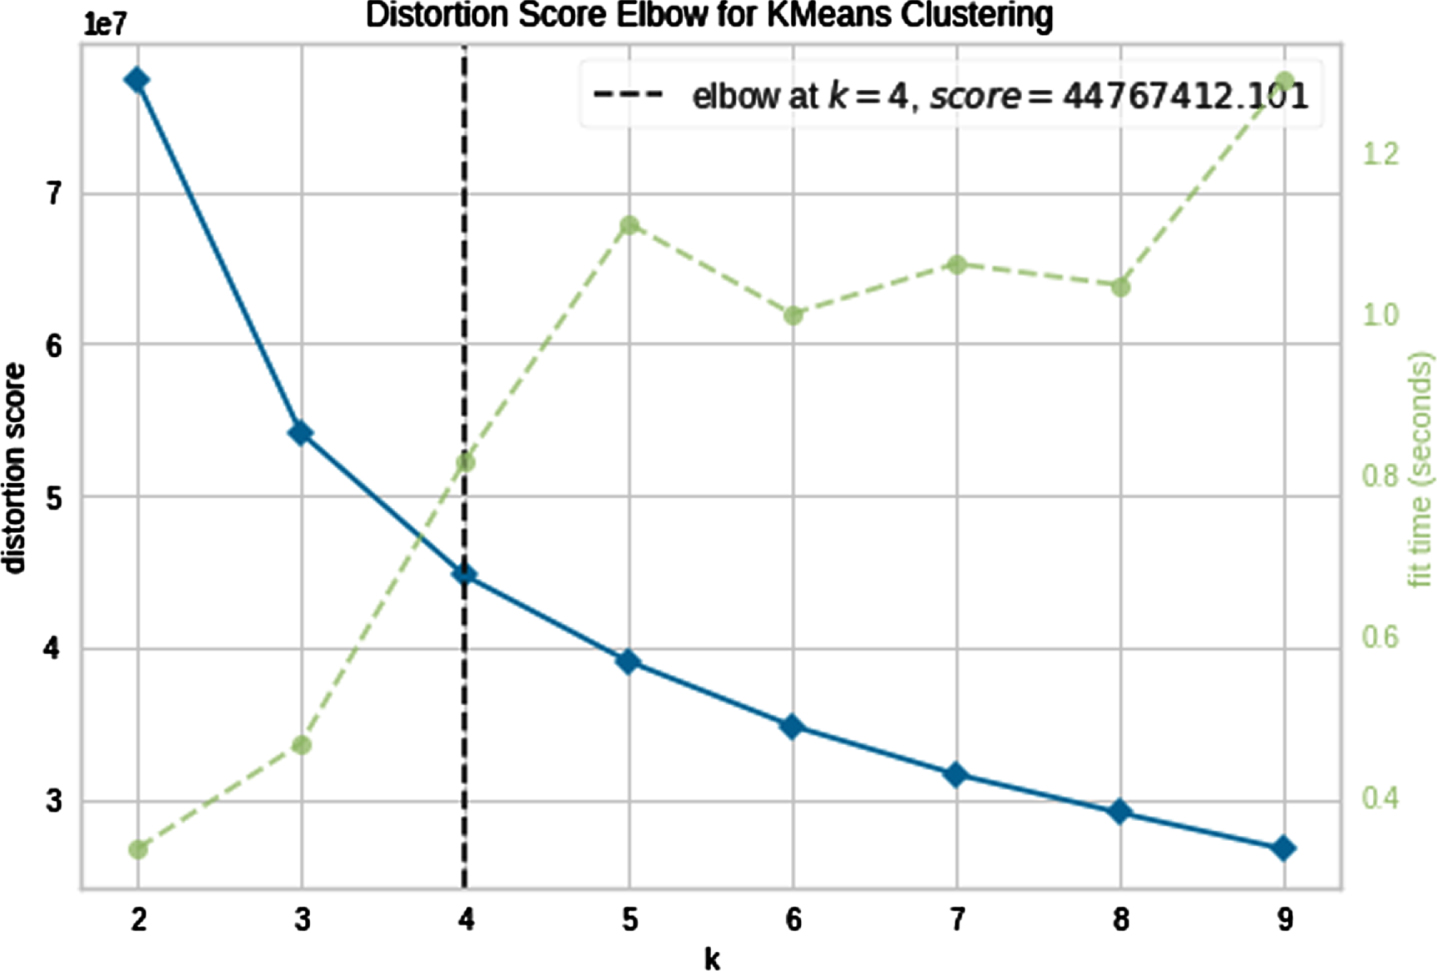
Visualization of the Elbow distortion values for different Cluster numbers of InstaCart dataset from k = 2 to 9.
To determine the best cluster number, we examined cluster numbers from k = 2 to 9. The results are illustrated in Figs. 8 and 9, where the Silhouette and Elbow criteria were plotted. As can be seen, the best cluster number matched on k = 4.
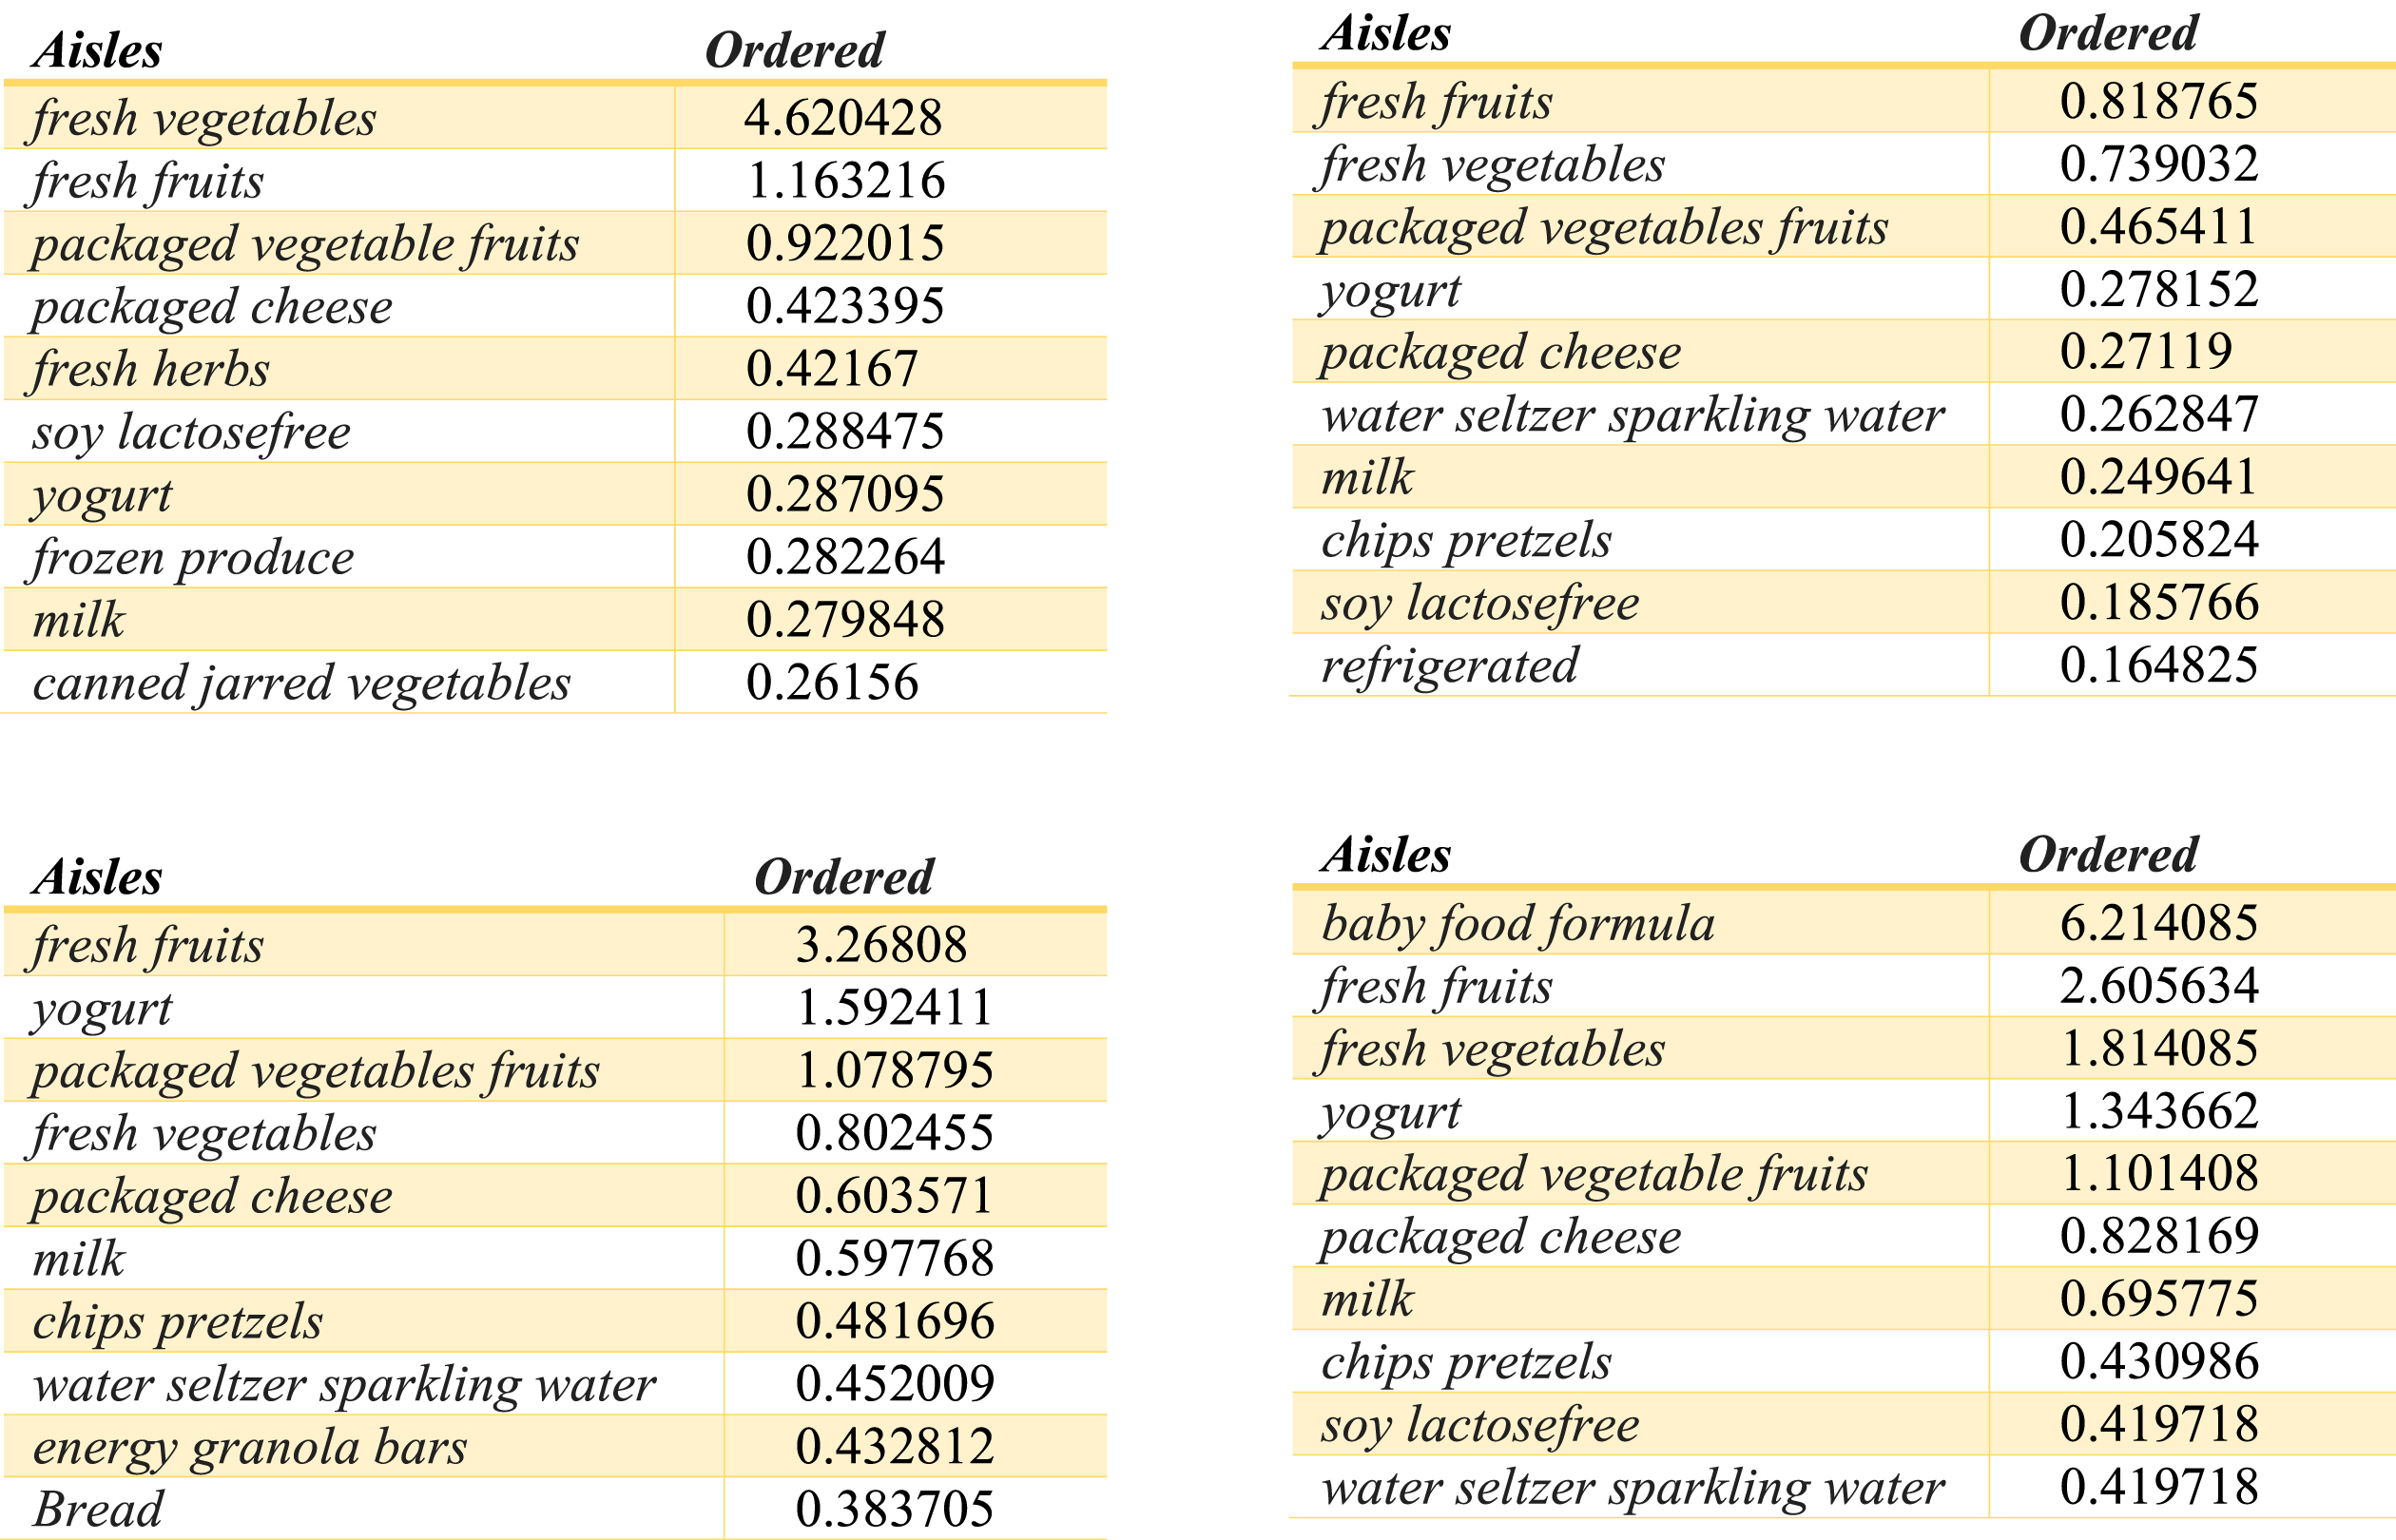
The tops 10 most ordered products Aliases by the customers from each cluster.
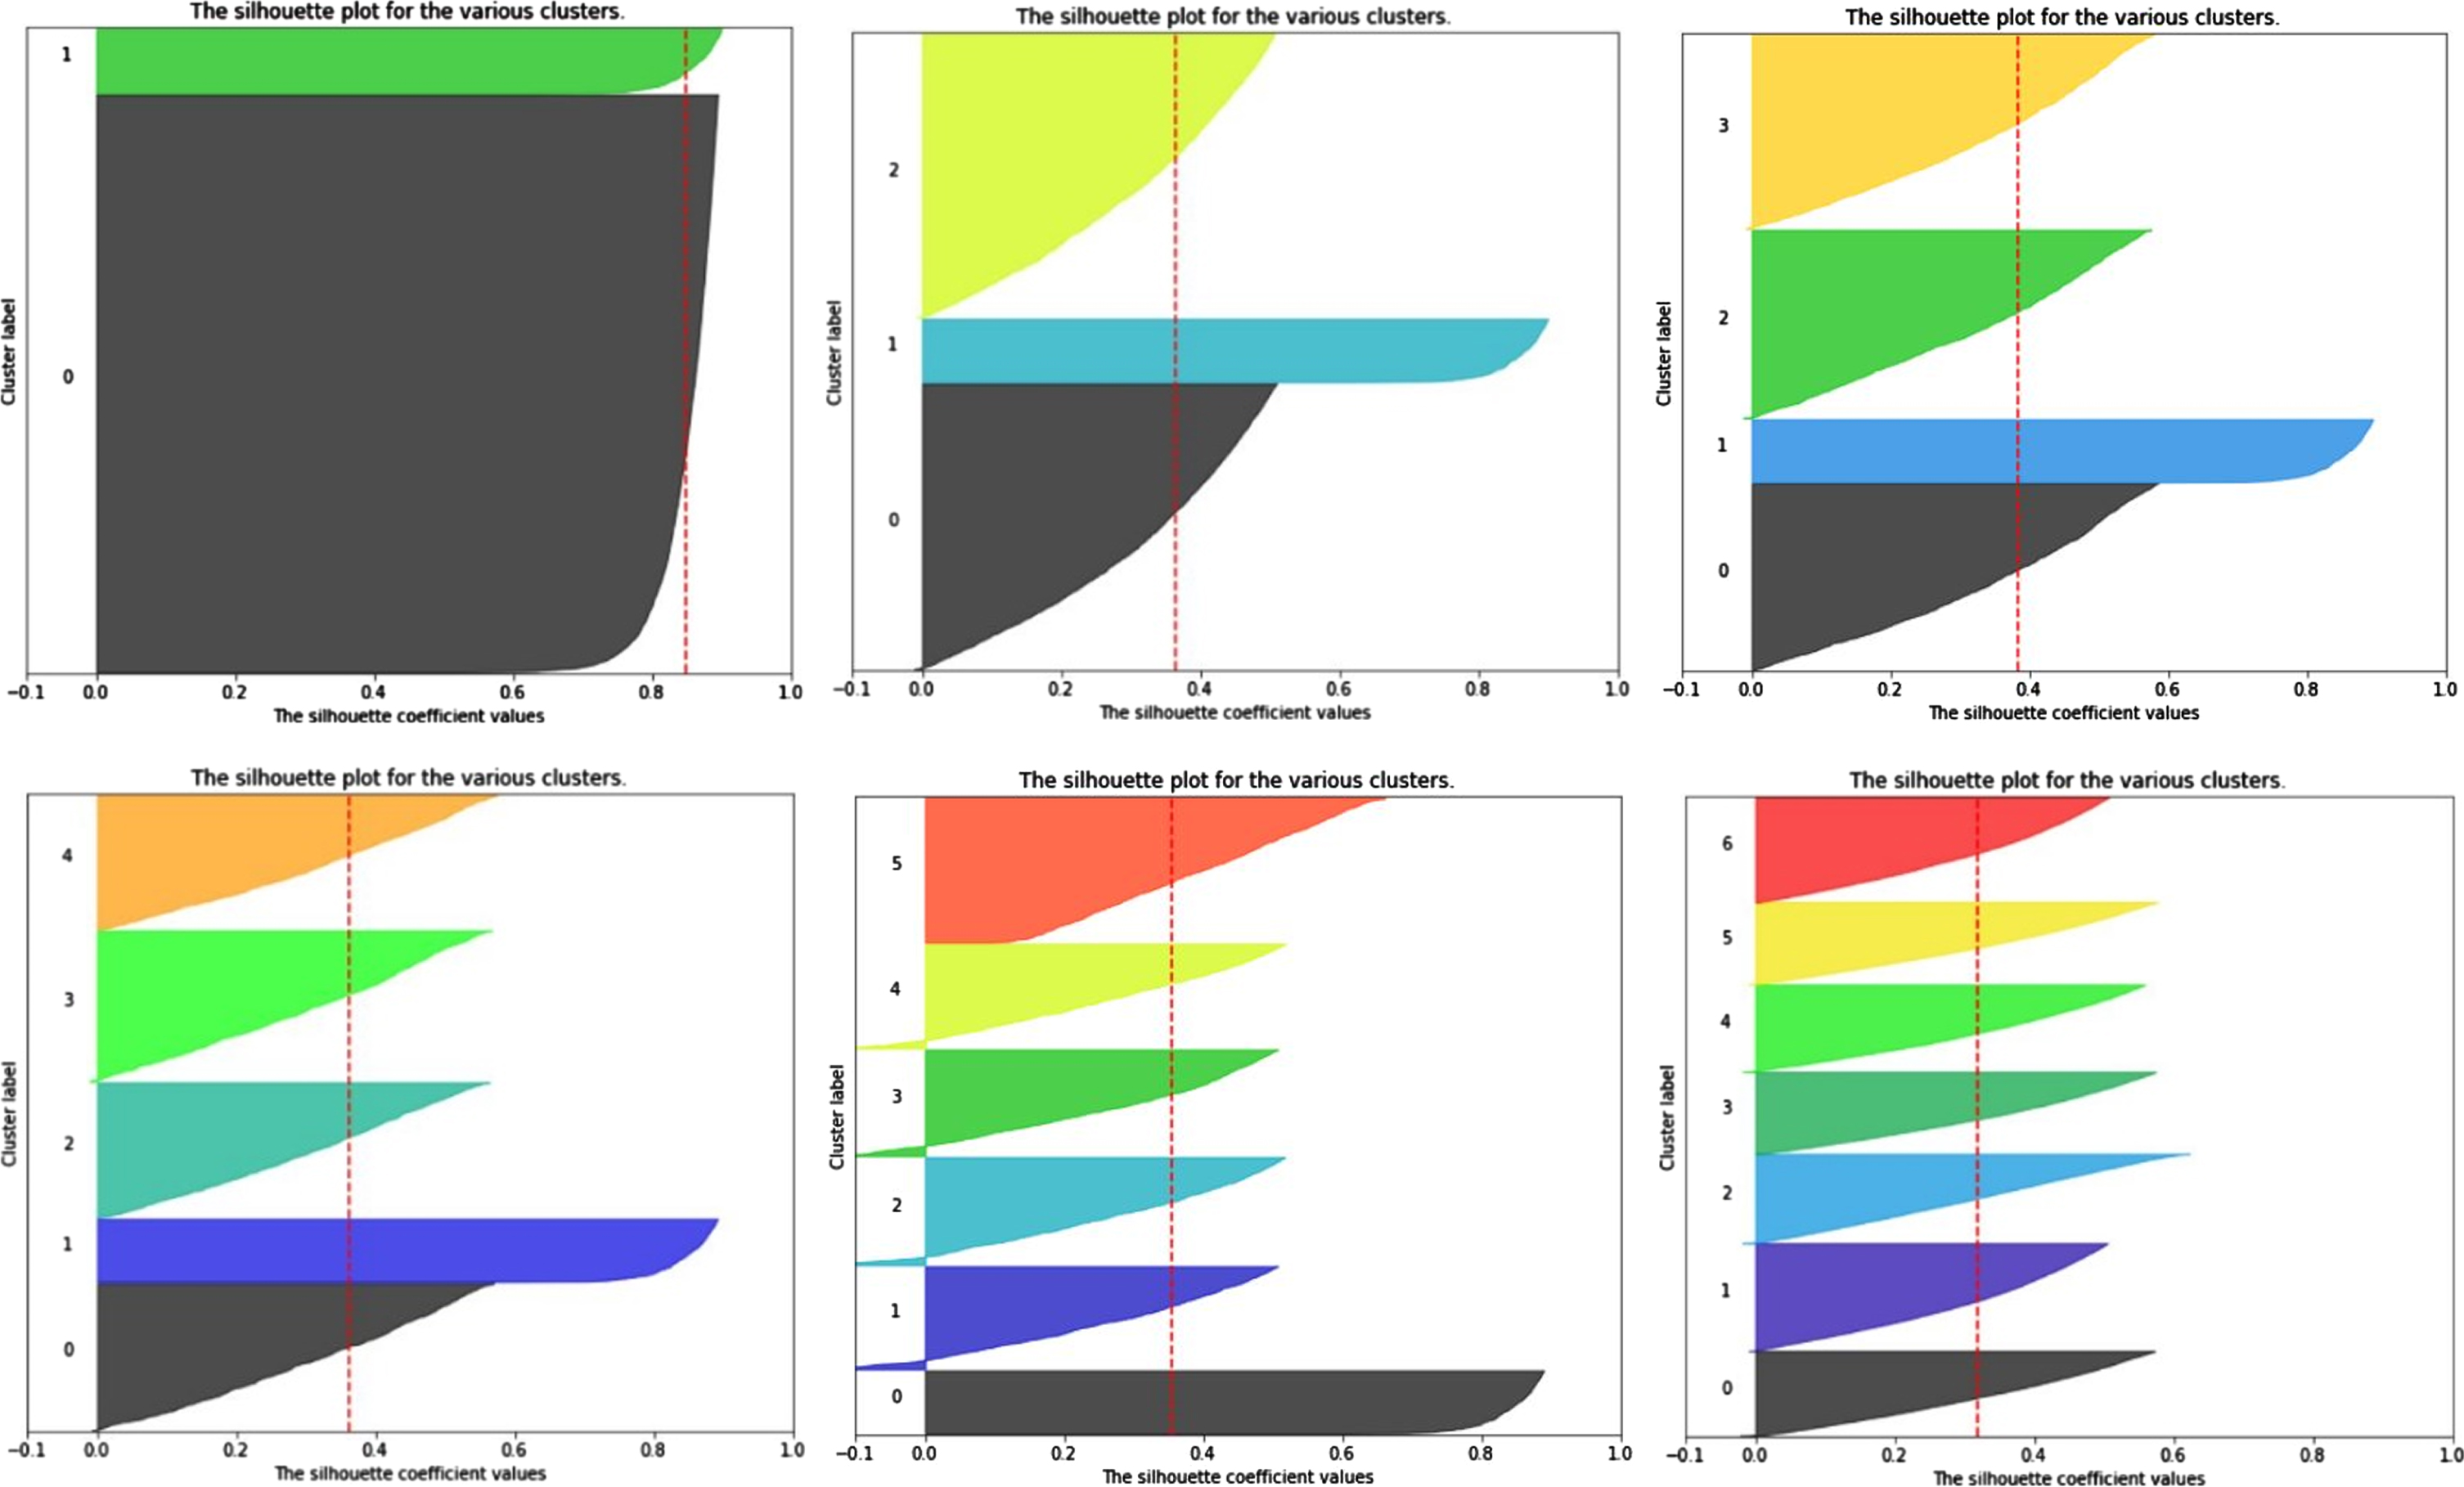
Visualization of the Silhouette score values for different Cluster numbers of Insurance Company dataset from k = 2 to 7.
By determining the appropriate cluster number, we extracted the top 10 most ordered products Aliases by the customers from each cluster. Those are illustrated in Fig. 9.
A first analysis of the clusters it is confirmed that: fresh fruits fresh vegetables packaged vegetable fruits yogurt packaged cheese milk water seltzer sparkling water chips pretzels are products which are generally bought by the majority of the customers.
As stated, the insurance company is a supervised dataset that includes information about the customers who decide to purchase Caravan insurance or not. Then, we can further and better analyze the proposed clustering method. Figures 10 and 11 confirm that the segmentation of data into two clusters is the best case for this dataset.
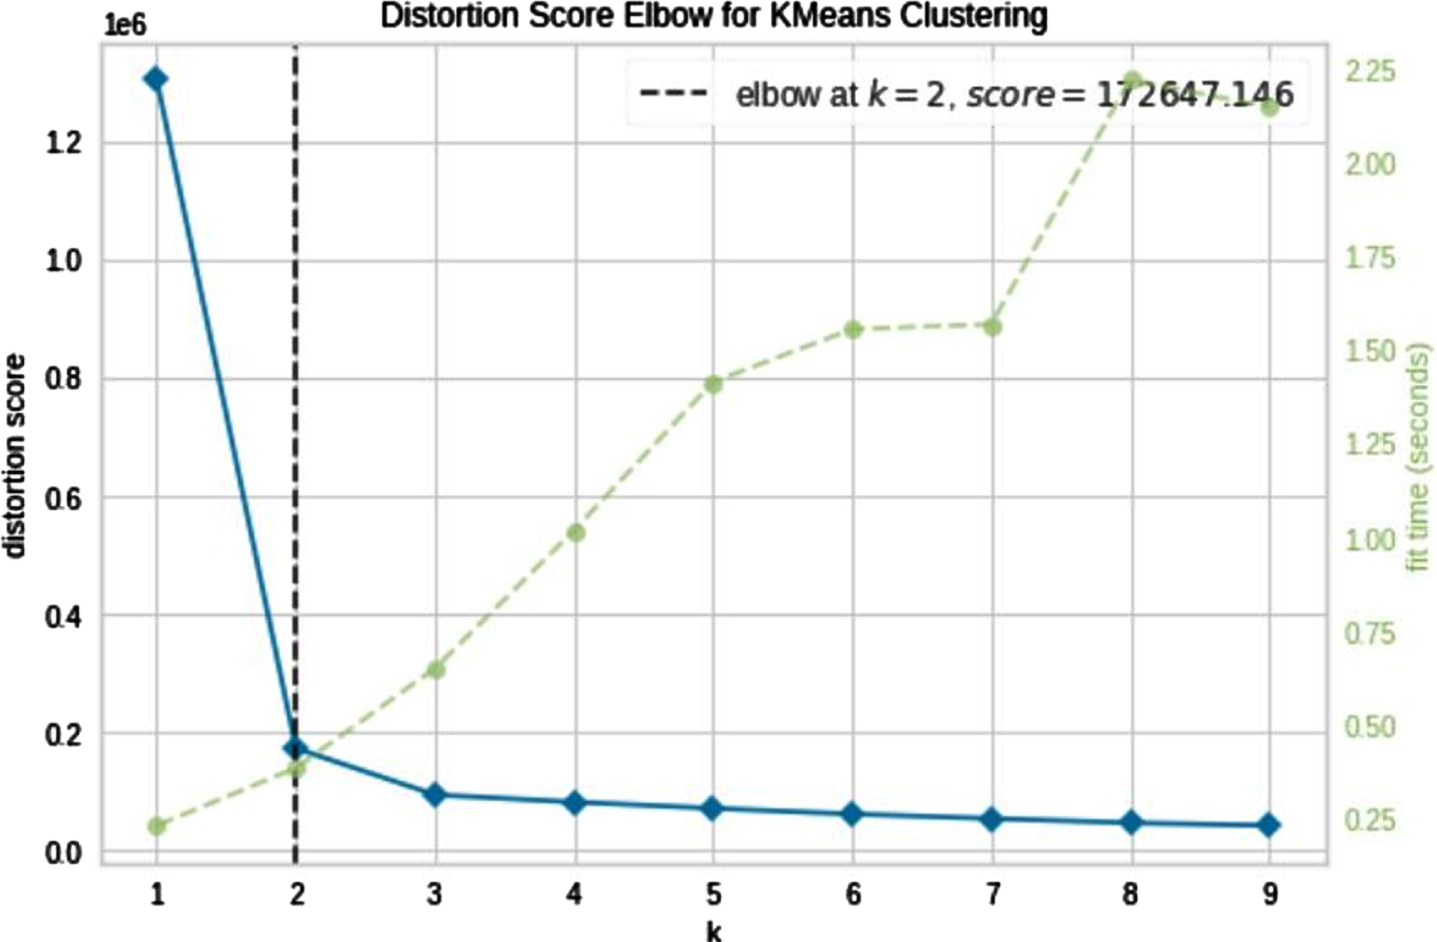
Visualization of the Elbow distortion values for different Cluster numbers of Insurance Company dataset from k = 2 to 9.
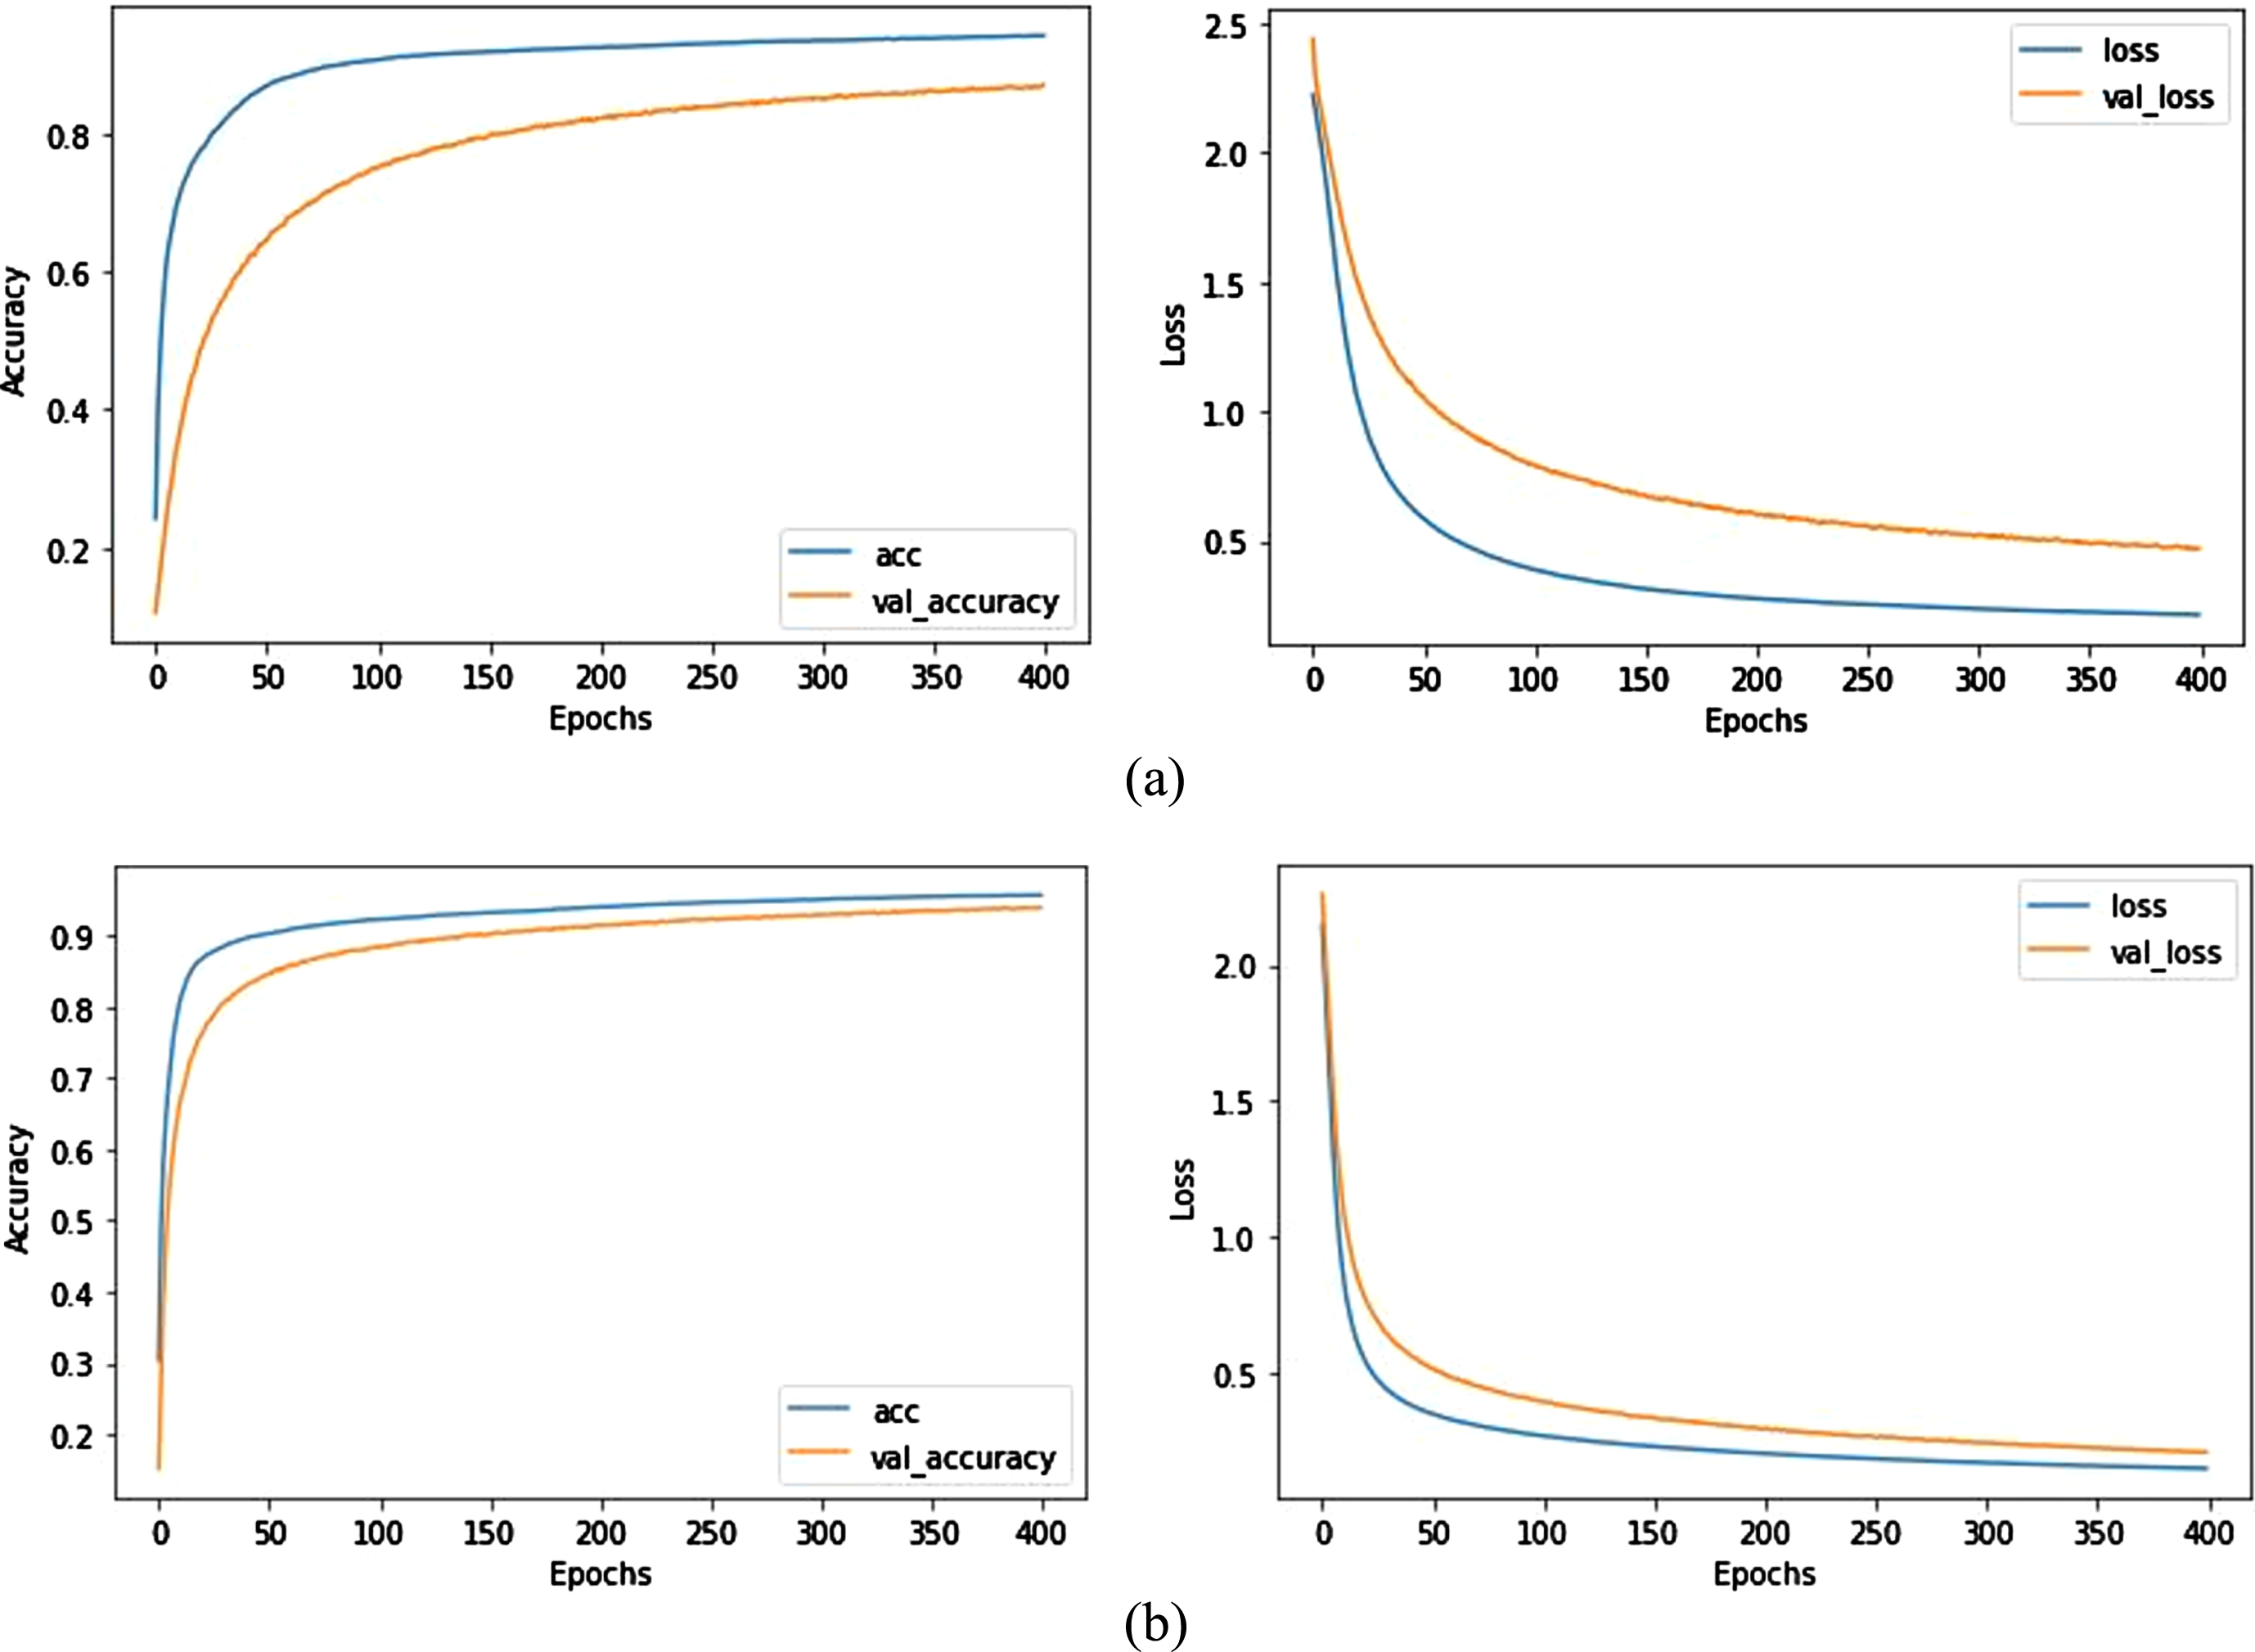
Accuracy and loss plot for the Insurance Company dataset, through running the epochs a) using Soft-max classifier b) using proposed classifier.
Fig. 12 (a) and (b) show the training accuracy and loss rate using the ordinal soft-max and proposed classifier on the Insurance Company dataset by running the epochs. As it is illustrated, with the passage of epochs, the accuracy of training and testing data increases in general, and the amount of loss rate decreases. As depicted in Fig. 6(b), the proposed classifier has reached a better accuracy and loss rate compared to the ordinal Soft-max classifier. This is due to the fuzzy inference capability that our proposed classifier is equipped with. Also in the proposed Fuzzy Soft-max classifier, the validation accuracy and loss have no significant difference with trian accuracy and loss, which indicates the superiority of the proposed classifier. Table 3 reported the classification criteria that are generated on test data. The results indicated that the performance criteria generated using the proposed classifier increased by about 4% compared to the Soft-max classifier.
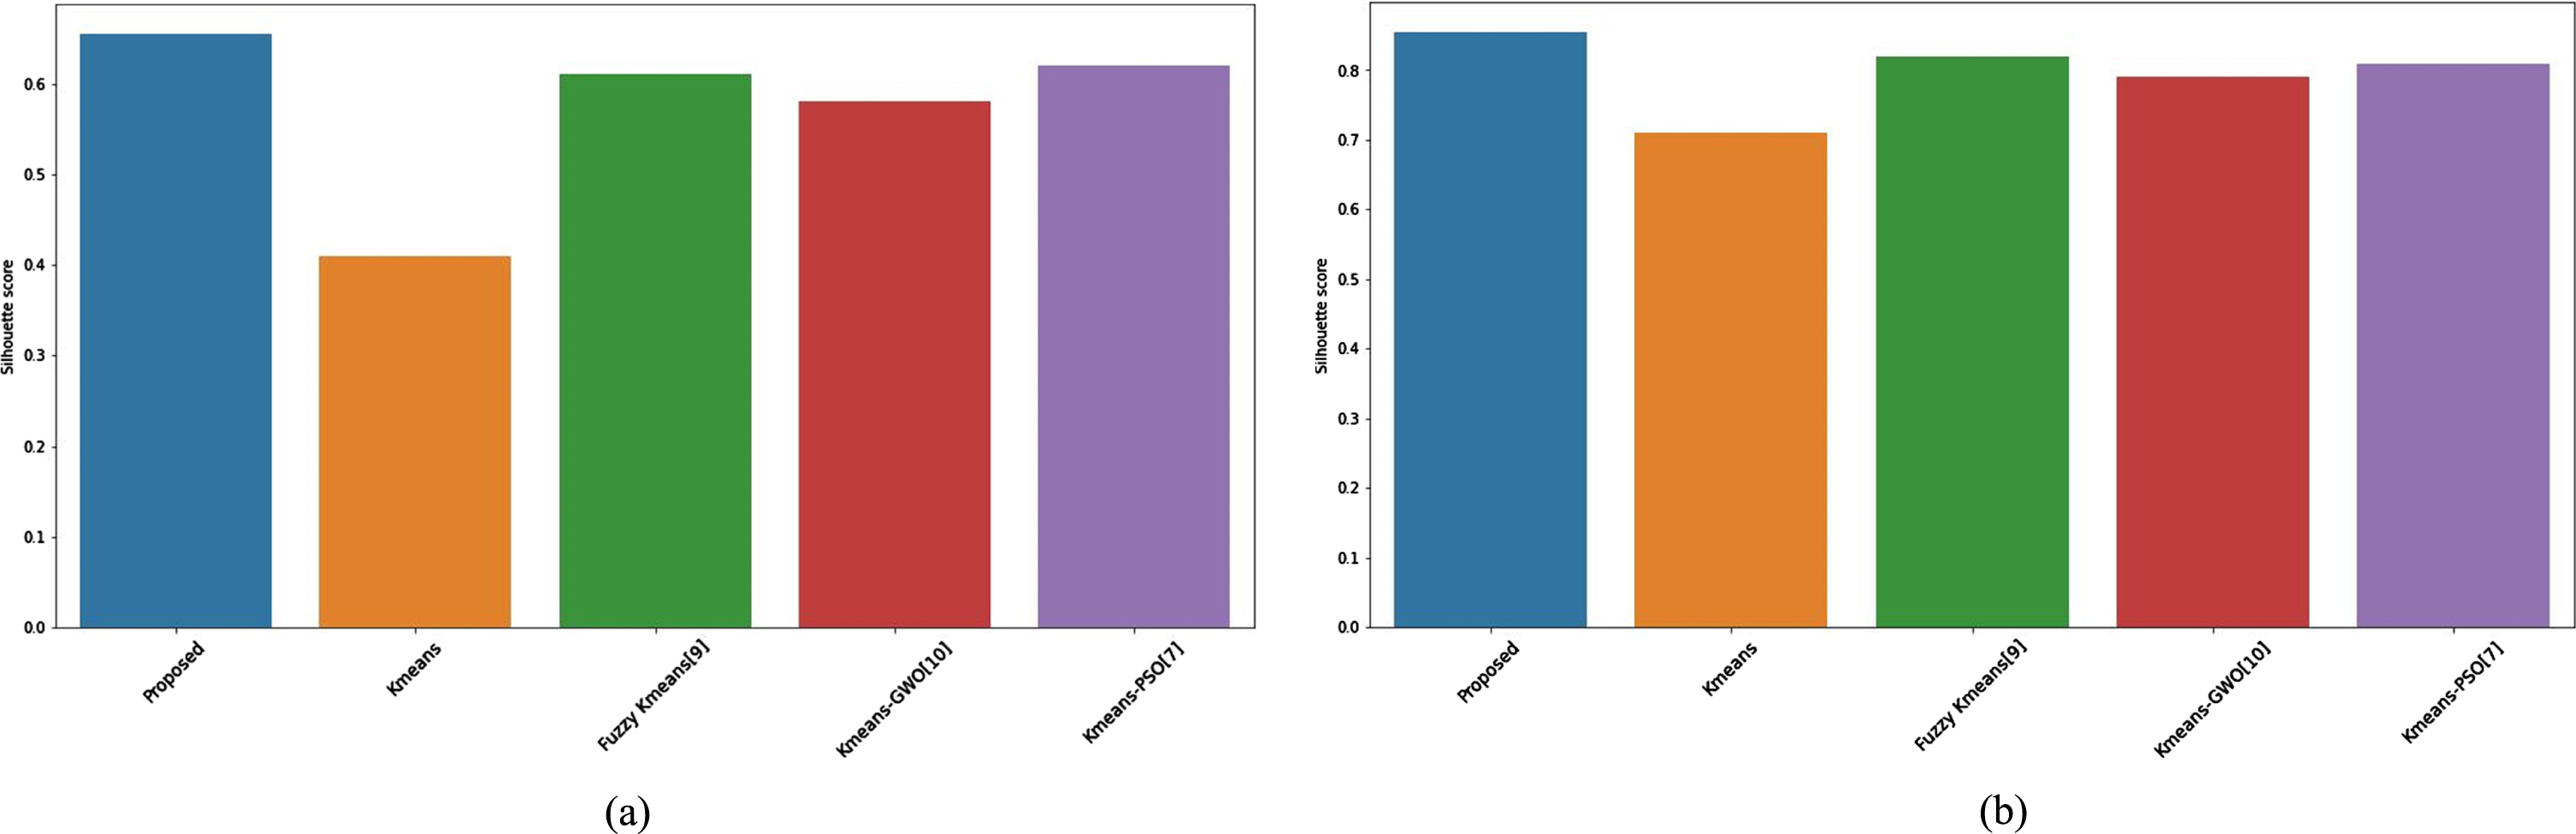
The Comparison of Silhouette score (a) for instacart and (b) insurance company datasets.
Classification criteria for the Insurance Company dataset
We compare the proposed clustering algorithm with some co-related articles in the literature for better clarification. As the investigated researches differ in terms of dataset and evaluation criteria, we simulated them with the information obtained from the method presented in the article. The results are illustrated in Fig. 13(a) and (b), both for instacart and insurance company datasets in terms of Silhouette score. As depicted, the proposed method reaches a superior Silhouette score in comparison.
To ensure the signification and robustness of the proposed model and inspired by [29] we perform both the Wilcoxon signed-rank and Friedman test. the Wilcoxon signed-rank test can be used to make simple pairwise comparisons, and the Friedman test is effective for making multiple comparisons, The Wilcoxon signed-rank test assumes that there is no significant difference in the Silhouette score between the two models being compared, while the Friedman test starts with the hypothesis that there is no significant variation in the Silhouette score of the models being compared. As an important parameter, the significance level indicates the probability of obtaining the observed test statistic. We set this parameter to ∞=0.005 for both methods,. The original hypothesis is rejected if the critical value W is below 100, and the p-value is less than 0.05. Table 4 compares the two statistical methods results for the investigated methods in comparison. As illustrated, for the instacart dataset, the least significant difference is between the proposed method and the method presented in [7] while for the this happens for the insurance company dataset this happens in comaprison with [9].
Results of Wilcoxon signed-rank test and Friedman test for instacart and insurance company datasets
Results of Wilcoxon signed-rank test and Friedman test for instacart and insurance company datasets
In this paper, we proposed classification and clustering algorithms for analyzing customer-related datasets. As the customer related datasets usually contain high domensional data we present a Cuckoo-Search-based Variable Weighting (CSVW) Clustering algorithm to obtain optimal variable weights of such dimensions. As we explained in detail in section 3, the proposed clustering algorithm does not dependent on the initial centers of clusters, and it takes advantage of the cuckoo algorithm to avoid falling into the trap of local optimum. This paper also proposed a deep Inferarer Classifier for categorizing customers using Bi-Directional Long Short-Term Memory (Bi-LSTM) neural network, which uses a Fuzzy Inferential Classifier on its last layer. The Insurance Company (TIC) and InstaCart datasets are utilized for the experiments and performance evaluation. Simulation results reveal that the proposed clustering algorithm generates appropriate Silhouette and Elbow criteria scores in a few cycles of execution in comparison to similar clustering algorithms in literature. Also, the proposed classification algorithm with fuzzy soft-max classifier hits the better Classification Criteria in comparison. In the future we aim to propose an ensamble clustering algorithm that uses variety of optimization algorithms for clustering other type of high-dimensional data, such as text-based data
Data availability statement
The data that support the findings of this study are
Conflict of interest
There is no conflict of interest.