
Abstract
A Computer Aided Diagnosis (CAD) framework to diagnose Pulmonary Edema (PE) and covid-19 from the chest Computed Tomography (CT) slices were developed and implemented in this work. The lung tissues have been segmented using Otsu’s thresholding method. The Regions of Interest (ROI) considered in this work were edema lesions and covid-19 lesions. For each ROI, the edema lesions and covid-19 lesions were elucidated by an expert radiologist, followed by texture and shape extraction. The extracted features were stored as feature vectors. The feature vectors were split into train and test set in the ratio of 80 : 20. A wrapper based feature selection approach using Squirrel Search Algorithm (SSA) with the Support Vector Machine (SVM) classifier’s accuracy as the fitness function was used to select the optimal features. The selected features were trained using the Back Propagation Neural Network (BPNN) classifier. This framework was tested on a real-time PE and covid-19 dataset. The BPNN classifier’s accuracy with SSA yielded 88.02%, whereas, without SSA it yielded 83.80%. Statistical analysis, namely Wilcoxon’s test, Kendall’s Rank Correlation Coefficient test and Mann Whitney U test were performed, which indicates that the proposed method has a significant impact on the accuracy, sensitivity and specificity of the novel dataset considered. Comparative experimentations of the proposed system with existing benchmark ML classifiers, namely Cat Boost, Ada Boost, XGBoost, RBF SVM, Poly SVM, Sigmoid SVM and Linear SVM classifiers demonstrate that the proposed system outperforms the benchmark classifiers’ results.
Keywords
Introduction
Pulmonary Edema (PE) is the result of an imbalance between the formation and reflux of lung tissue fluid, resulting in the absorption of vast amounts of tissue fluid by lymph and vein failure in the lungs. The fluid transudes into the interstitium of the lungs and then accumulates in the alveolars from the lung capillaries, causing a severe disturbance of pulmonary ventilation and gas exchange [1]. Two types of PE cases are acute and chronic.
Since December 2019, typical pneumonia termed covid 19 has been increasing exponentially worldwide [3]. As of October 12th, 2022, a total of 619.7 million cases of Covid-19 had been diagnosed worldwide, with a total of 6.5 million people dying as an outcome of the condition [4]. It poses a significant threat and challenge to world health and the economy. Medical specialists face uncertainty in making decisions based on their judgment for covid 19.
The identification and differentiation of covid-19 and PE is a challenging task. There has been an increased rate of mortality due to the lack of a diagnosis system and the lack of expertise and difficulty in differentiating PE and covid-19 lesions through human observation. Moreover, early diagnosis of the diseases is not possible, which accelerates the severity of the symptoms due to the lack of treatment at the early stages and even runs the risk of being vulnerable to human errors. Hence, a clinical decision support system that can considerably reduce the time and increase the quality of prediction is highly imperative to address these problems. In precise, a Clinical Decision Support System (CDSS) [5] can effectively foster better communication, improve quality and expedite the diagnosis and help physicians in the betterment of treatment. The main objective of this study is to design a CAD that helps in decreasing the false negative rate in the diagnosis of pulmonary edema and covid-19 and assisting physicians as a second opinion system.
Computed Tomography (CT) is better than conventional radiography because it produces high-resolution pictures and can detect early-stage lesions [6, 7]. CT is also used to diagnose pneumoconiosis, pneumonia, pulmonary edema, and lung cancer. Treatment requires early disease identification. Due to large CT scan data volume, it is one of the radiologists’ most challenging responsibilities. Thus, radiologists need CAD tools to analyse CT scans for pulmonary diseases [8, 9].
The motivation for designing a Computer Aided Diagnosis (CAD) system is to assist medical practitioners in differentiating PE and covid-19 lesions efficiently. The main goal of employing a CAD system is to identify even small lesions at an early stage. It serves as a supporting and decisive role in the interpretation of medical imaging diagnosis. The implementation of a CAD system has the potential to lead to an improved analysis using CT images and locate the regions of interest. The CAD serves as a second opinion system, whilst physicians are still the primary source for diagnosing. This can be a unique methodology to take up the challenge of differentiating PE and covid-19.
Critical reviews of the latest studies [5, 10–20] show that CAD system-based prediction models using clinical datasets can be significantly helpful in a timely, effective, and accurate diagnosis of the disease. The main advantage of using CAD systems is the quality services which can be used by medical practitioners to enhance the accuracy in clinical decision making. It also helps in achieving time efficiency, image diagnosis accuracy, interpretation time and sensitivity, which benefits the diagnosis of covid-19, PE and other pulmonary disorders. It not only classifies numerous pulmonary diseases but also provides an early and accurate diagnosis of the anomaly shown in the images. The present study aims to establish a CAD system with the following contributions. Segmentation was done using “Otsu’s Thresholding”. ROIs were extracted, and the feature vectors were split as train and test sets in the ratio of 80 : 20. A wrapper-based feature selection (FS) approaches using Squirrel Search Algorithm (SSA) with the Support Vector Machine (SVM) classifier’s accuracy as the fitness function has been used to select the optimal features. The selected features were trained using the Back Propagation Neural Network (BPNN) classifier. Statistical Analysis namely: Wilcoxon’s test, Mean Whitney U test and Kendall’s Rank Correlation Coefficient were performed, which indicates that the proposed method has a significant impact on the accuracy, sensitivity and specificity of the novel dataset considered. With the advantage of SSA combined with BPNN classifier, more accurate (88.02%) solutions are provided when compared with other traditional ML classifiers, namely Linear SVM, Ada Boost, Cat Boost, XG Boost, Poly SVM, RBF SVM and Sigmoid SVM.
The rest of the article is structured as described below. Section 2 presents the results of the literature review conducted in relation to the work done. In Section 3, the framework for the system is designed. The outcomes of the experiments are discussed in Section 4. Under Section 5, the description of the dataset and an analysis of its performance are presented. The conclusion is presented in Section 6, as well as the future scope of the work.
Literature survey
Classification algorithms and feature selection filter algorithms using medical data
Sweetlin et al. [18] used CAD to improve lung CT pulmonary bronchitis diagnosis. Optimal thresholding segmented the lungs. The size and texture of Pathology bearing Regions (PBRs) are retrieved. Relevant characteristics were identified using a hybrid Ant Colony Optimization (ACO) –cosine similarity –SVM classifier approach. Tandem run recruiting was employed to choose promising features. Simple performance measures evaluate the trained SVM classifier. ACO with tandem run strategy was 81.66% accurate, whereas, without tandem run, it was 77.5% accurate.
Mohammed et al. [21] developed adaptive wrapper FS techniques based on a new metaheuristic algorithm, the coronavirus herd immunity optimiser (CHIO), with and without a greedy crossover (GC) operator strategy to improve CHIO’s search space exploration. 23 medical benchmark datasets and a real-time covid-19 dataset have been used to test CHIO and CHIO-GC. CHIO-GC surpassed CHIO in search capabilities, as measured by selection size, accuracy, standard deviation, convergence speed and F-measure. Two FS approaches and four filter-based methods have been compared to the proposed CHIO-GC. On all 23 medical datasets, CHIO-GC had the highest accuracy of 0.79.
Sanjay Agrawal et al. [22] developed a hybrid technique for analysing brain MRI (Magnetic Resonance Imaging) data. A layered thresholding technique for brain MRIs was developed using edge size information. Brain image slice Gray Level Co-Occurrence Matrix (GLCM) was used to compute edge magnitude. Cuckoo Search (CS), SSA, Adaptive Cuckoo Search (ACS), and ACS-SS algorithms discovered multiple optimal threshold values. This was evaluated with Harvard T2–w brain MRI images. The ACS-SS methodology is preferable for qualitative and statistical evaluations, according to the analysis. Hybridisation validates objective function value indices. ACS is CPU-efficient, and it improves fitness function and speed.
Mohit et al. [23] developed SSA. This research studies southern flying squirrel’s dynamical hunting and gliding to optimise SSA. Both CEC 2014 and 33 standard functions were used to evaluate SSA. We used convergence rate analysis, statistics, Wilcoxon’s test, and ANOVA to compare nature-inspired optimisation techniques. Comparative statistical study reveals that SSA converges to global optimal solutions. SSA has shown accuracy and consistency for complex CEC 2014 benchmark functions, while alternative approaches are difficult. The heat Flow Experiment verified the algorithm’s applicability and stability. In this real-time experiment, SSA’s numerical optimisation results were competitive with other optimisers. It allegedly solves actual NP-hard combinatorial optimisation issues.
Parthiban et al. [24] introduced HFWE-based FS to select the best Chronic Kidney Disease (CKD) dataset characteristics. This technique minimises CKD analysis feature breadth, while SVM categorises features. The filter algorithm uses Relief, One-R, GR, and Gini Index (GI). The Improved Bat Algorithm (IBA) wrapper algorithm picks CKD dataset analytical features. The SVMt-based embedded algorithm picks CKD dataset analytical characteristics. SVM classifiers are used for low feature set validity. 400 patients, 250 with early CKD. UCI machine learning (ML) repository supplied CKD samples. UCI characteristics predict CKD. HWFFS algorithm features are tested to determine CKD or non-CKD. Classification performance depended on six parameters. SVMHFWE-FS outperforms (Artificial Neural Network) ANN-HFWE-FS and SVMHFWE-FS with 93.33% accuracy, 6.66%, and 8.1%. Noisy, missing data. Thus, missing and noisy inputs necessitate a categorization system for future work.
Elena Velichko et al. [25] proposed an EDECOVID-net which is a method based on ML to distinguish covid-19 symptoms from PE with the help of radiomic features using lung CT scans. With a simple structure and just a few math computations, the EDECOVID-net has been put together. The slices with edema and covid have been acquired and pre-processed and the texture features are extracted and then classified using EDECOVID-net. The dataset consisted of 13717 imaging patches, which included 5759 and 7958 covid-19 and edema images admittedly and extracted through CT incision. A comparison of this model with other competitive ML models has been made to prove its superiority. These competitive models are namely, VGG-16 with 94%, VGG-19 with 96%, Xception with 95%, ResNet101 with 97%, and DenseNet20l with 97% accuracy. The differentiation between covid-19 and PE classification has been 98% accurate by this EDECOVID-net computer-aided model. Moreover, it has achieved 0.99 precision, 0.97 recall, 0.98 specificity, sensitivity and F1 score each which is better in comparison to other models involved in the study.
Kumar et al. [26] used a Gabor filter and SVM to differentiate lung x-rays. The model accurately differentiated normal from PE chest x-rays. Most Gabor filter values were chosen empirically, and the angles were chosen to be within the range of normal rib cage incline. Model performance may be affected by pulmonary segmentation. All of the feature vectors in this study had an accuracy of 95.90 or higher and an AUC of 0.96 or higher. This may be attributed to the binary classification and the short number of test photos. Kurtosis, entropy, and skewness have the highest AUC of 1 and can be used for classification.
Liang Sun et al. [27] presented an Adaptive Feature Selection Guided Deep Forest (AFS-DF) for the problem of covid-19 classification. This has been achieved by first extracting location-specific features. CT slices have been involved in the study to capture these. Further, for extracting the high-level features where only a small data is available, a deep forest model has been implemented for learning the features’ high-level representation. This model has helped in reducing the redundancy in features. Experimental results on covid-19 classification have shown that the proposed AFSDF -LR, AFSDF-SVM and AFSDF-RF outperformed their counterparts LR, SVM and RF.
Spam detection using bidirectional transformers and machine learning classifier algorithms
Yanhui et al. [28] in their study created an efficient spam detection approach using a pretrained bidirectional encoder representation from the transformer (BERT) and ML algorithms to classify ham or spam emails. Email texts were fed into the BERT, and features obtained from the BERT outputs were used to represent the texts. Four classifier algorithms in ML were employed to classify the features of the text into ham or spam categories. The proposed model was tested using two public datasets in the experiments. The results of the evaluation metrics demonstrate that the Logistic Regression (LR) algorithm achieved the best classification performance in both datasets. The experimental results demonstrate that LR achieved the best classification performance in two publicly available datasets.
Luis et al. [29] differentiated covid-19 pneumonia in chest X-rays. Using hand-crafted radiomic features and ML, the study compared covid-19 chest X-ray images and pneumonia. Lung texture was segmented in two ways. Upper, middle, and lower lung zones are separated by the L-R method. First- and second-order texture features are derived from 80 : 20 training/testing data. 136 segmented chest X-rays from two public datasets were used. SVM, Ada Boost (AB), and LR classifiers are analysed. AB distinguished covid-19 from normal pneumonia better than other models. Lung zones outperform L-R in classification parameters (sensitivity, accuracy, AUC). The proposed approach using a model of lung segmentation in six separate zones achieved an AUC of 0.98.
Rongyao et al. [30] published a study that compares moderate and severe cases, differences, HDLSS data, and class imbalances. Chest CT slices using multi-task multi-modality SVM can detect covid-19 early. The system consisted of three-step (i) multimodality handmade features were extracted to retain the difference between severe and moderate; (ii) Data augmentation (iii) Classification and regression. Comparison approaches include baseline, log-least, M3T, MvCCDA, CPM-Nets, and MVF. The suggested method performs better in classification and regression than six state-of-the-art methods on one real-time and two falsified covid-19 datasets. The proposed method obtained 89.47% and 83.20% on the two falsified datasets and 92.57% on the real-time dataset, better than other methods.
Mohammad H et al. [31] proposed an enhanced whale optimisation algorithm for medical FS (E-WOA) to solve the problems in global optimisation. It uses a pooling mechanism and three different searching strategies, namely migrating, preferential selecting, and enriched encircling prey. Comparative results have been shown where E-WOA outperforms the variants of traditional WOA. Further, a binary E-WOA named BE-WOA has been proposed for effectively selecting features precisely in medical datasets. This BE-WOA FS has been used to select features in covid-19 diagnosis. Experimental results and statistical results have been shown to demonstrate the efficiency of BE-WOA over other variants of WOA.
Makram et al. [32] suggested a prediction model that distinguished cases infected by covid-19 based on their symptoms and features. It uses a non-dominated sorting genetic algorithm (NSGA-II) for FS and to find the best trade-off between the two objectives namely, reducing the features and increasing the weights of those selected features. This has been followed by AdaBoost classifier for classification. The results shown prove the efficiency of NSGA-II algorithm combined with AdaBoost, which has outperformed several other results through combinations of FS algorithms and classifiers.
Duchesne et al. [33] proposed the prediction of covid-19 radiological trajectory with the help of deep learning techniques on chest x-rays. The open CheXnet dataset has been used for training the deep learning algorithm, and patients’ data has been collected from two open-source datasets. ROC analyses and Mann-Whitney tests have been performed. ROC-AUC curve determines the label learning, and Mann-Whitney tests compare the results obtained between different outcome groups.
Situation awareness prediction technology based on improved RBF neural network algorithm
Mostafa et al. [3] employed an ANN to diagnose covid-19. 400 Covid-19 cases were included in the dataset. Backpropagation trains ANN. MLP activation produces the best diagnostic output. Performance measures have determined the optimal ANN structure. 9-10-15-2 is the finest ANN (two hidden layers with 10 in the first and 15 in the second accounting for a total of 25 sigmoid nodes). Accuracy, specificity, sensitivity, and AUC-ROC were calculated for the system. The system has achieved competent results with 94% accuracy, 90.6% specificity, 96.4% sensitivity and 98.2% ROC.
Anuja et al. [34] developed an ML-based automatic covid-19 identification system. CXR and CT were used to detect coronavirus. First, quality enhancement and noise removal are applied to the slices. Using fuzzy c-means clustering, the pre-processed images are segmented. Third, the principal component analysis identified four features from the feature vector: gradient histogram, textural, statistical, and discrete wavelet transform. Normal, pneumonia, and covid-19 classifications use k-Nearest Neighbor (k-NN), Sparse Representation (SRC), ANN, and SVM classifiers. Nine datasets from diverse sources were analysed. k-NN, SRC, ANN, and SVM had covid-19 detection accuracies of 91.70, 94.40, 96.16, and 99.14%.
Adi et al. [35] developed a lung cancer detection technique using microscopic biopsies. Digital image processing includes texture feature extraction using GLCM and image classification using BPNN. Texture features are extracted using contrast, correlation, energy, and homogeneity, and lung biopsy images are identified using an ANN algorithm. This new system can classify images with a 95% training accuracy and 81.25 testing accuracy. These two studies suggest this technology can detect lung cancer.
According to the literature, the above-mentioned approaches can solve the FS problems in various applications. Based on these above inferences, the proposed CAD framework is developed to cater to an effective feature selection mechanism that can significantly impact the classifier’s performance. Therefore, the SSA is used and is trained with SVM classifier as the fitness function to select features of PE and covid-19. With the advantage of SSA combined with BPNN classifier, more accurate (88.02%) solutions are provided when compared with other traditional ML classifiers namely, Linear SVM, Ada Boost, Cat Boost, XG Boost, Poly SVM, RBF SVM and Sigmoid SVM.
System framework
The present study aims to establish a CAD system with the following contributions. (a) Segmentation has been done using “Otsu’s Thresholding”. (b) ROIs were extracted, and the feature vectors were split as the train and test sets in the ratio of 80 : 20. (c) A wrapper based feature selection approach using SSA with the SVM classifier’s accuracy as the fitness function has been used to select the optimal features. (d) The selected features were trained using the Back Propagation Neural Network (BPNN) classifier. (e) Statistical Analysis, namely Wilcoxon’s test, Mean Whitney U test and Kendall’s Rank Correlation Coefficient were performed, which indicates that the proposed method has significant impact on the accuracy, sensitivity and specificity on the novel dataset considered (f) Combining SSA with BPNN classifier provide a more accurate solution when compared to other seven benchmark classifiers. SVM classifier is less prone to the problem of overfitting and hence produces robust and accurate systems, whereas BPNN classifiers are very sensitive to noisy data and outliers. SSA yields the best feature selection subset to improve the accuracy of the classifier which in turn enhances the performance of SVM and BPNN classifiers with minimal computational cost and time [36]. The flowchart for the proposed CAD system framework is shown in Fig. 1.
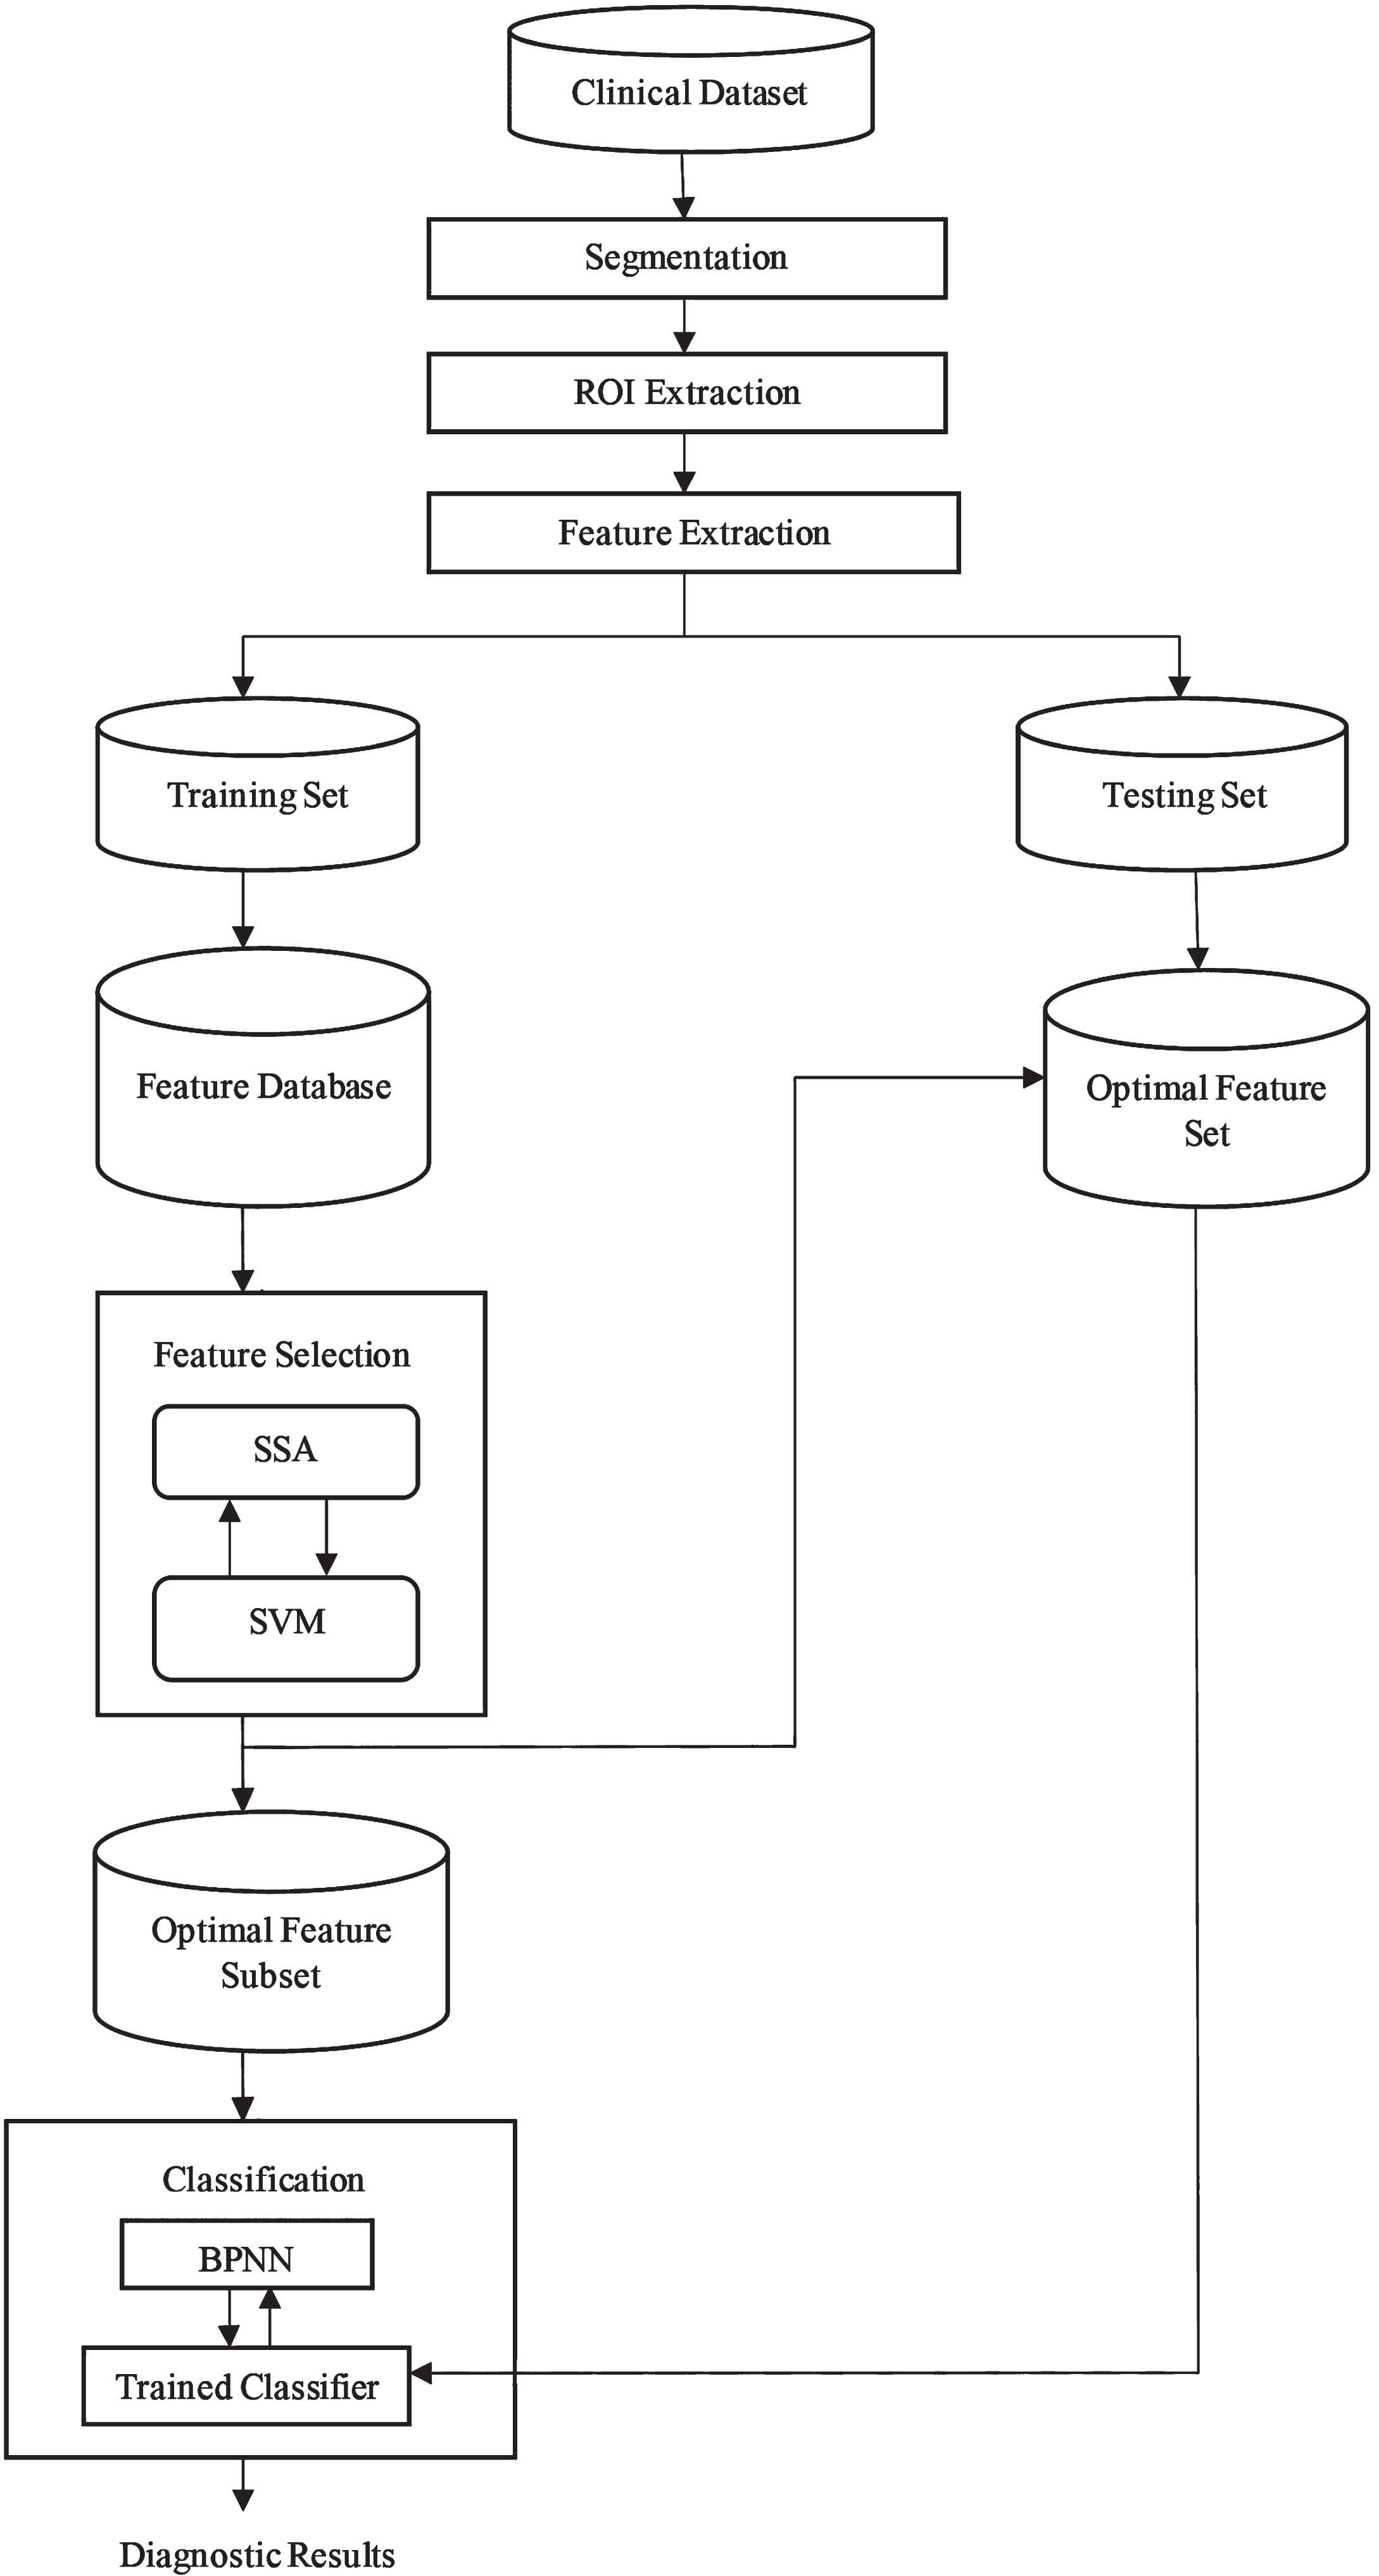
Flowchart for Proposed CAD System Framework.
The procedure of segmentation involves separating the lung tissues from the lung CT slices in order to obtain the objects of interest for further analysis by removing the background of the lung tissues. This is done in order to perform segmentation [26]. The Otsu’s thresholding technique was followed to accurately segment the lung tissues from their background.
The OTSU’s thresholding method was put forward by Japanese scholars OTSU in 1979 [37]. It takes the maximum inter-class variance between the background and the foreground as a measuring standard. The Otsu’s algorithm is based on a discriminant analysis that partitions the image based on the gray levels. According to the grayscale characteristics, the variance between the lung CT slices and the lung tissues is maximised to minimise the probability of misclassification, realising an accurate segmentation of the image.
The steps taken in Otsu’s thresholding method [38] are outlined as follows.
The average gray levels of these lung CT slice class and lung tissue class can be computed using the equations (5).
The lung tissues were segmented from the obtained CT slice using morphological operations.
Feature extraction
A feature is an information extracted from the images in terms of numerical values that are difficult to understand and correlate by humans. Features contain information required to distinguish between classes. The pathology bearing regions (PBRs) are the ROIs in this work. The ROIs considered in this work are edema lesions, namely interlobular septal thickening, peri-bronchovascular interstitial thickening, pleural effusion, GGO and thick fissure and covid-19 lesions, namely GGO, Consolidation, Pleural effusion, Crazy paving appearance, air space consolidation, Broncho-vascular thickening and Traction Bronchiectasis (TB). Features in a medical image are categorised as Texture based features, Run-length features, Geometric features and haralick features. The features were generated using the GLCM. The feature vector is generated for all ROI by combining the 80 features, which includes 12 geometric features and 68 texture features which are given in Table 1. The feature vectors were split in the ratio of 80 : 20, with 80% used for training and 20% for testing the trained classifier [10, 39].
Features extracted
Features extracted
In FS, the relevant feature subset was chosen using a wrapper-based FS approach based on the SSA and the SVM classifier’s accuracy as the fitness function [23]. The algorithm starts by finding out where flying squirrels are at random. In a search space with d dimensions, the vector shows where the flying squirrels are. So, flying squirrels can glide in 1-D, 2-D, 3-D, or “hyper-dimensional” search space and also change their location vectors. The parameters used in SSA are given in Table 2. The four rules of SSA are as follows.
Parameters used in SSA
Parameters used in SSA
The SSA is depicted as follows:
where FSi,j represents the j th dimension of i th flying squirrel
The initial location of each flying squirrel in the forest is allocated using a uniform distribution as follows,
Calculate the seasonal constant (S
c
) using the equation (17).
Find the minimal value of seasonal constant S
min
and check the seasonal monitoring condition, i.e., (
If the seasonal condition is true, then relocate the flying squirrels.
The dataset is divided in the ratio of training-testing sets as (80-20). The BPNN is the classifier used and it has three layers. The input layer has 80 features, and the hidden layer has 21 selected features, and the output layer represents 3 classes namely, class 0 for edema, class 1 for covid-19 and class 2 for the normal dataset [10, 13].
Experimental results
The real-time PE and covid-19 datasets were used in the experiment. The results from different stages of the process obtained for a slice containing PE lesions are displayed in Figs. 2a –2 g. Figure 2a shows the input CT lung slice, and Figs. 2b–2e shows the stages involved in segmenting the input slice. Figures 2f and 2 g show the nodules (Interlobular Septal Thickening and Ground Glass Opacity (GGOs)) which were extracted. Similarly, the experimental results obtained for a healthy lung slice are given in the series of Figs. 3a –3 g. The performance of the proposed system was compared with the existing ML classifiers, namely Linear SVM (78%), Ada Boost (80%), RBF SVM (76%), XGBoost (81%), Poly SVM (75%), Cat Boost (82%) and Sigmoid SVM (65%) classifiers. From the results, it is inferred that the proposed system outperforms the existing ML classifiers. The comparison graph of the classifiers is given in Fig. 4.
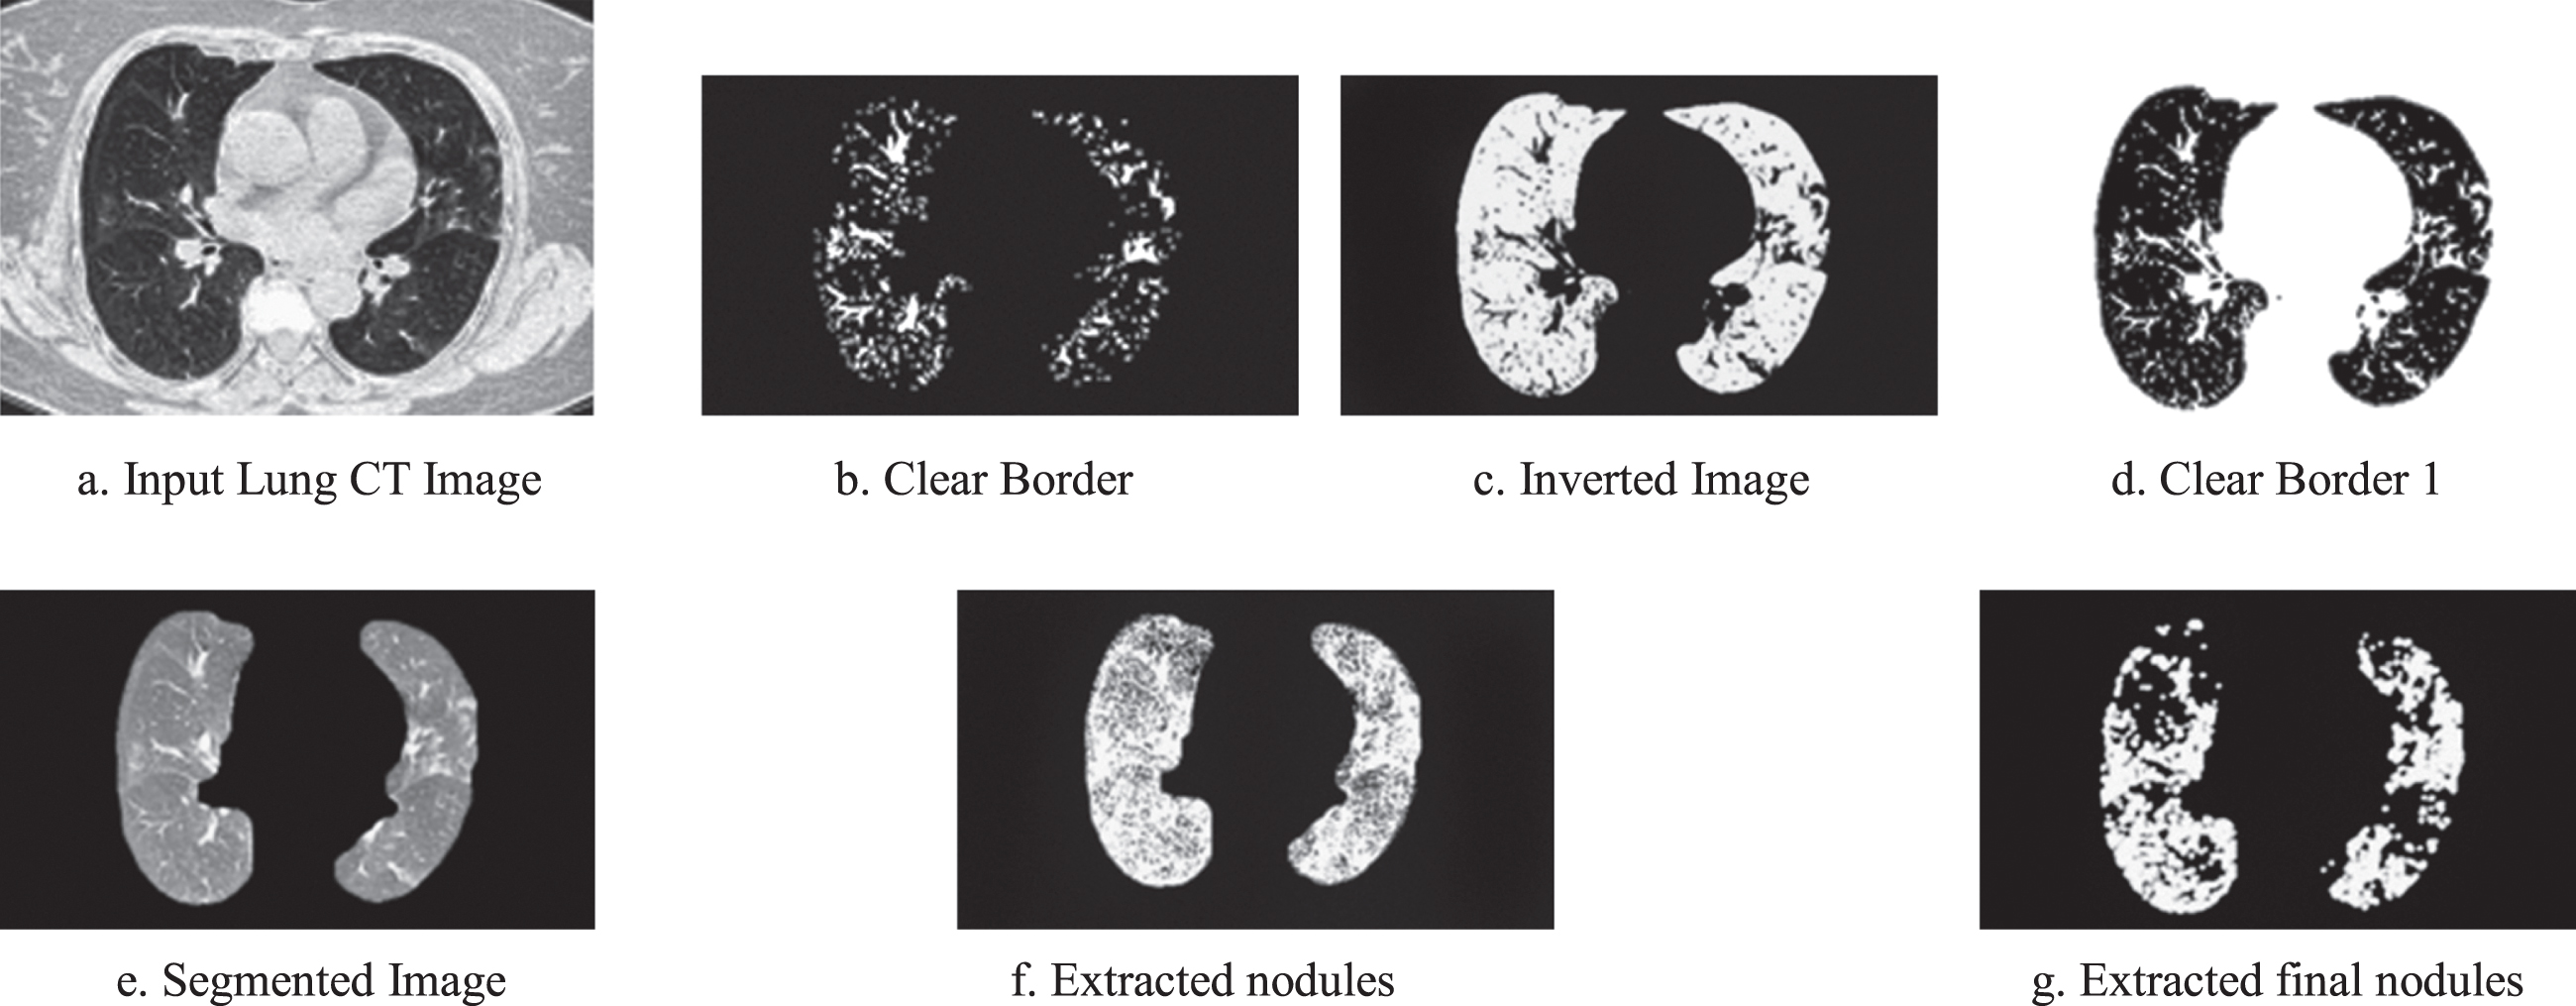
a–2 g. Experimental images obtained for Pulmonary Edema.
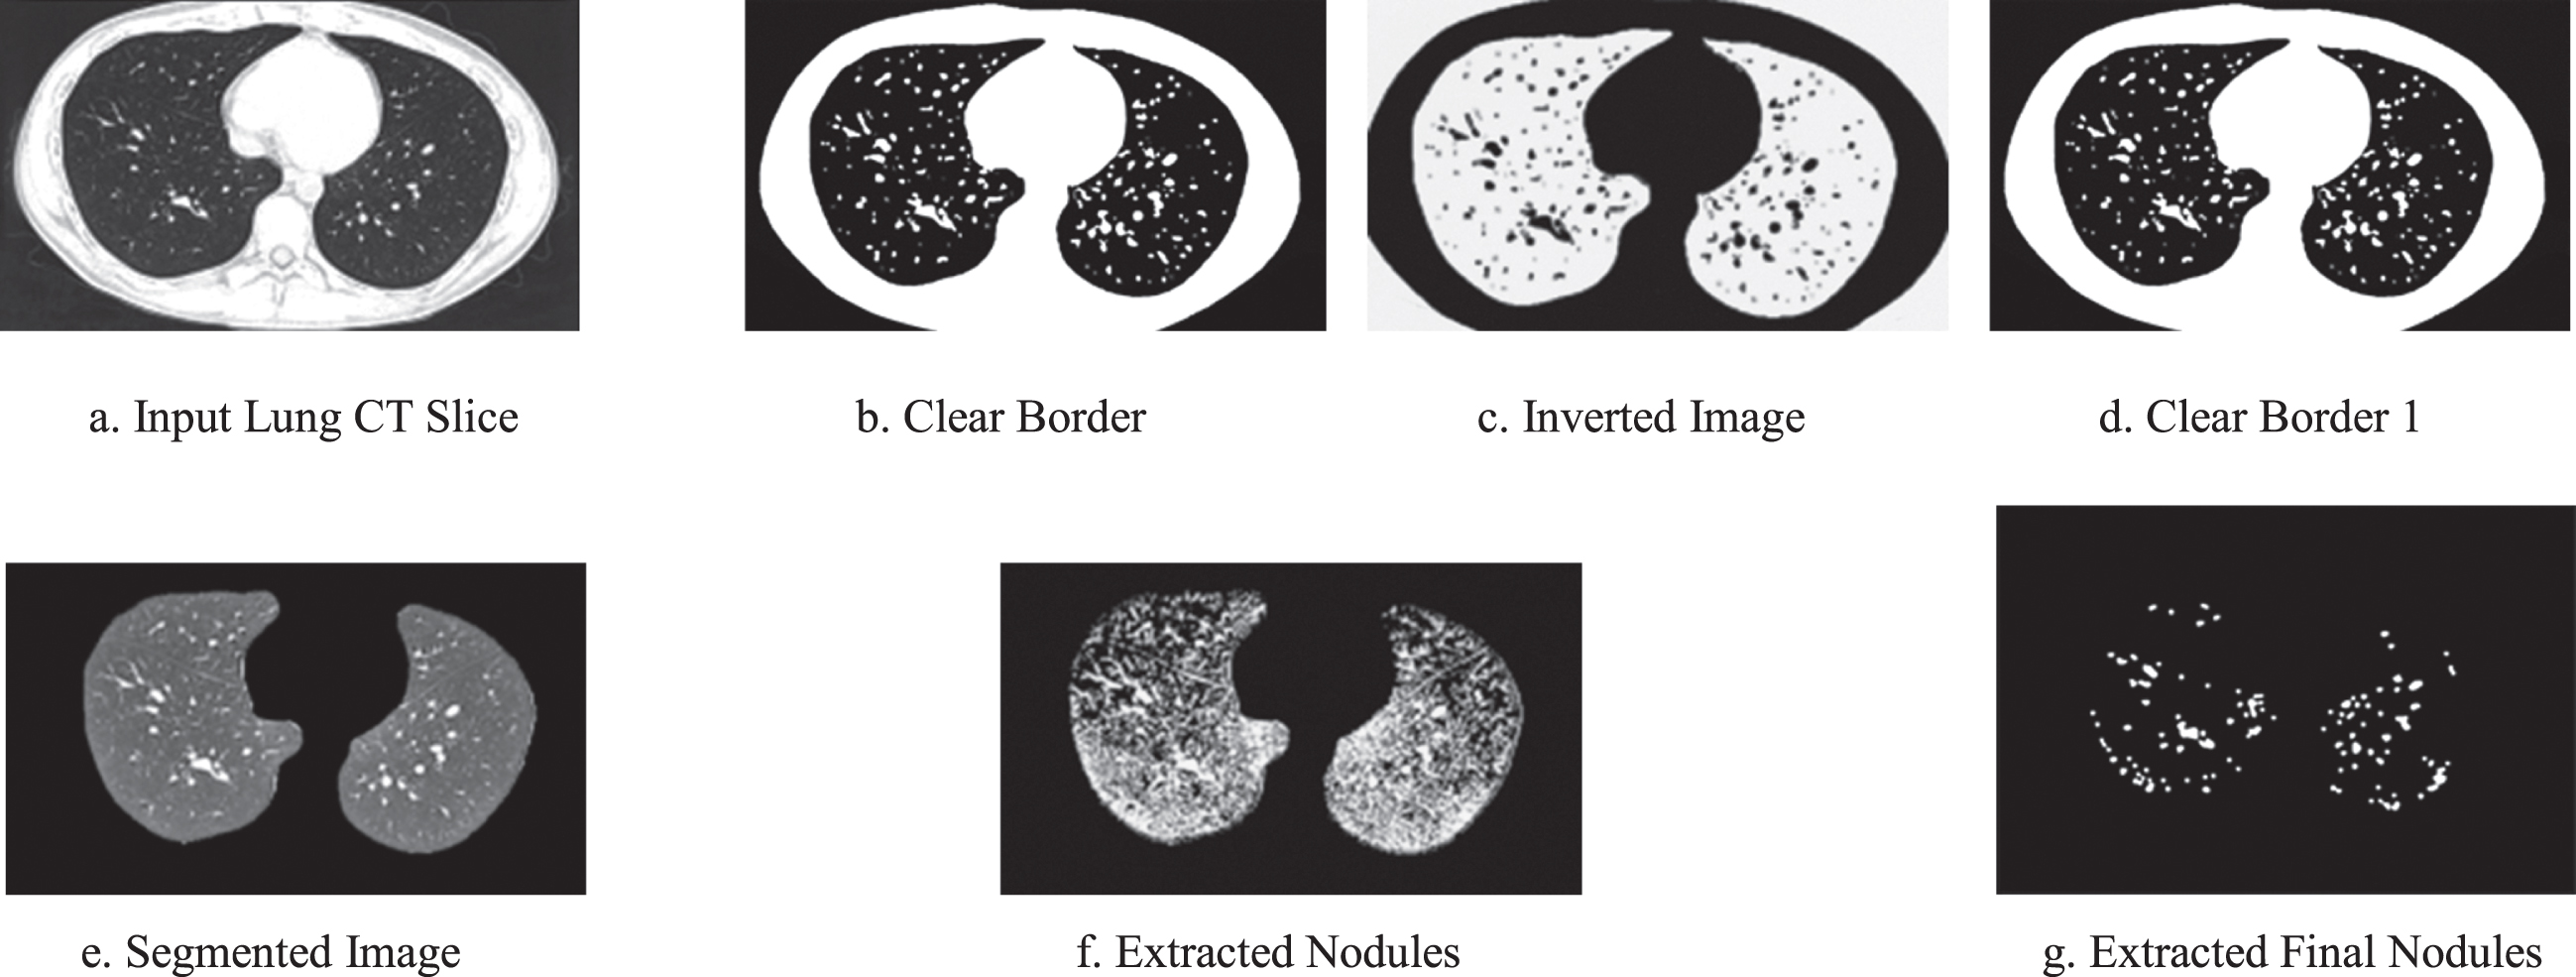
a –3 g. Experimental images obtained for Normal Lung Slices.
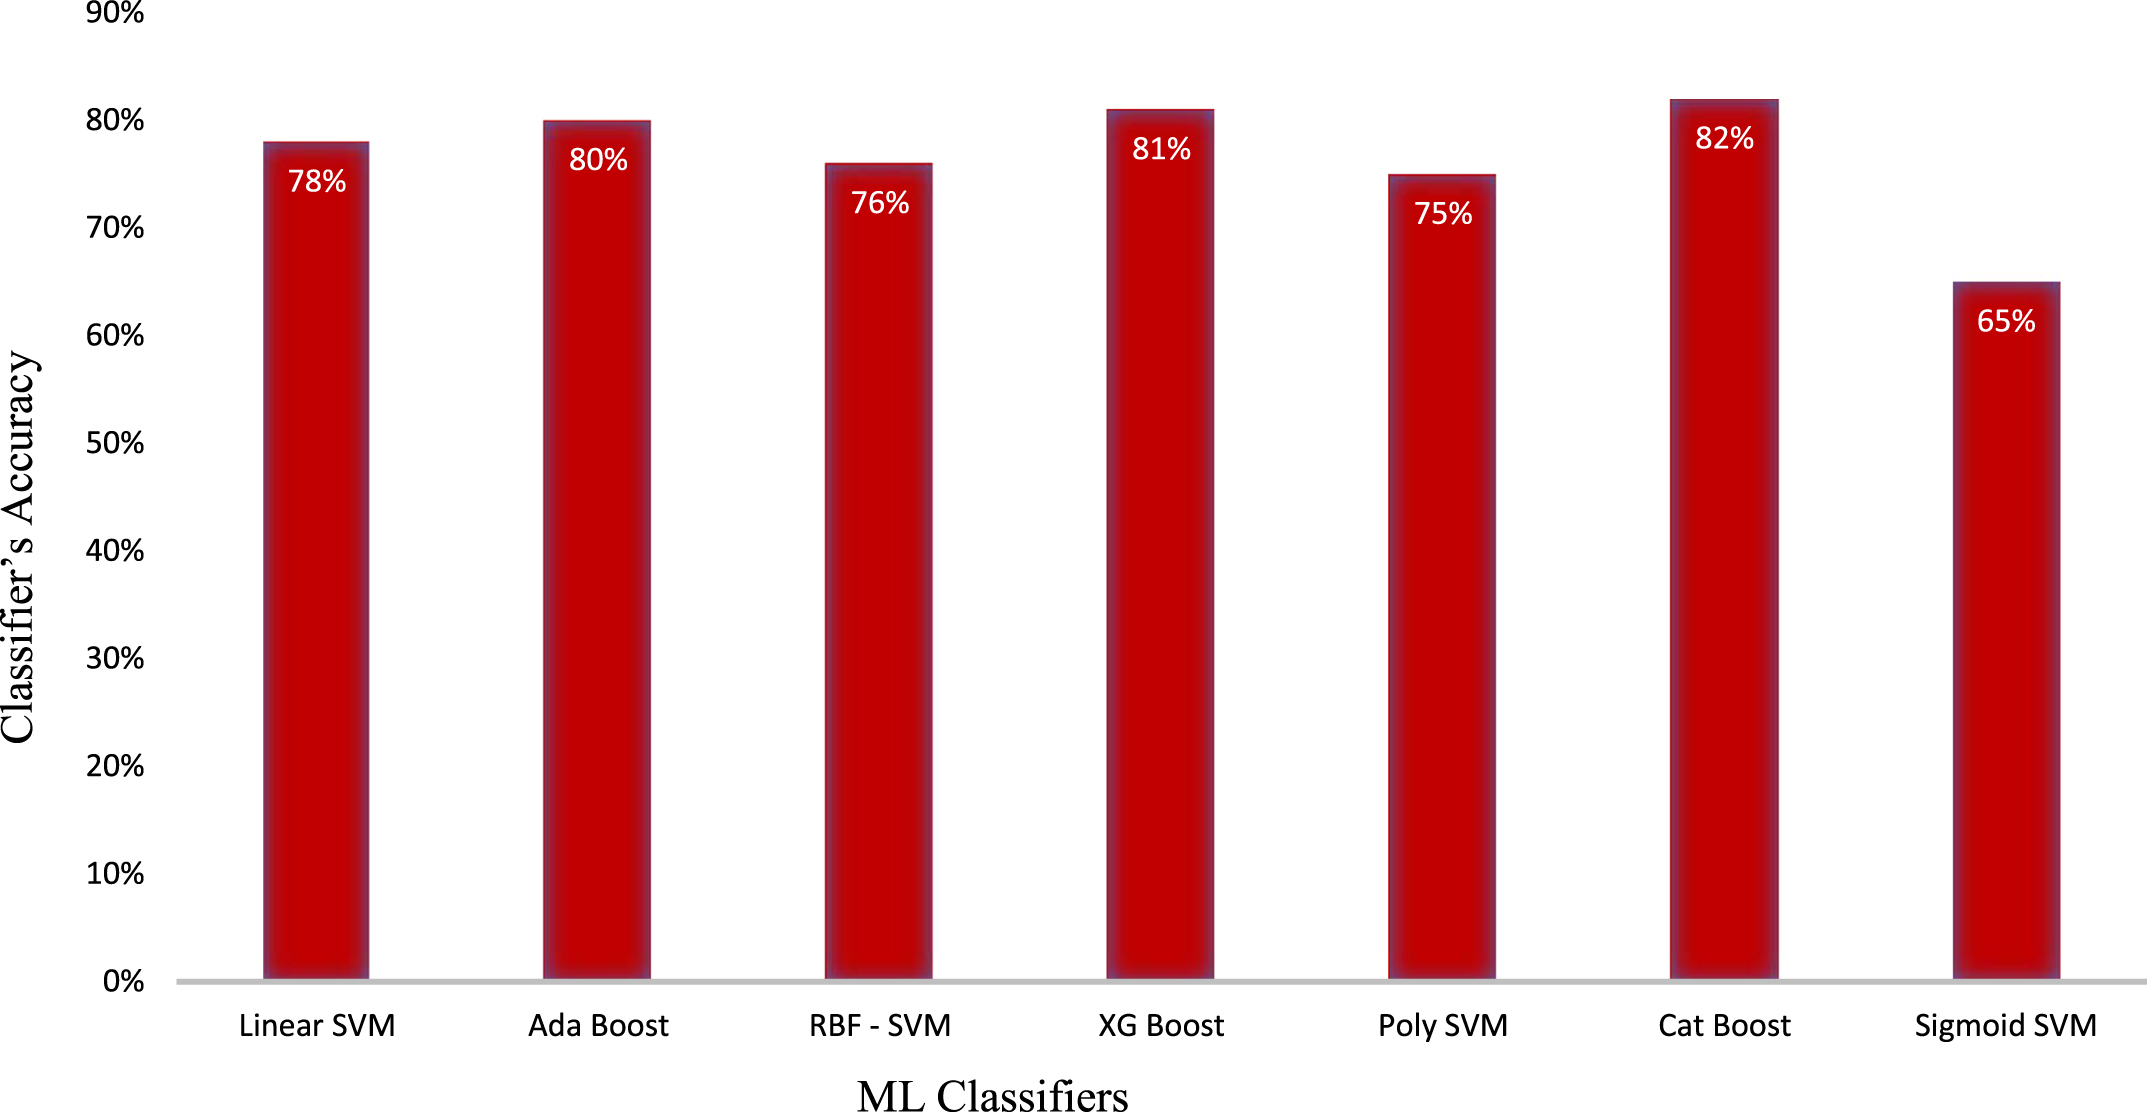
Comparison of the classifiers.
The real-time dataset has been collected from Bharat Scan Centre, Chennai, India. There was a total of 50 patient datasets obtained, which included 15 sets of healthy people, 9 patients diagnosed with PE disease, and 26 patients diagnosed with covid-19. Training has been carried out for PE using 735 Computed Tomography scan slices which include 270 slices with PE, 240 slices with covid-19 and 225 normal slices. Feature vectors of ROIs obtained from the same patient are present either in the training or testing set and not in both sets. To protect privacy, we deleted the Personally Identifiable Information (PII) from all CT scans. Although the covid-19 CT slices include enough data, proper annotated labels are also required. Each ROI was identified using the expert radiologist’s opinion, manually labelled, and made clear by the radiologist. The dataset description for the PE disease and covid-19 disease are given in Table 3.
Dataset description
Dataset description
The performance measures, namely accuracy, specificity, precision and sensitivity is calculated using equations (23).
Where, true positive (TP) refers to the number of instances correctly classified as the presence of disease.
A true negative (TN) refers to the number of instances correctly classified as the absence of disease.
A false positive (FP) refers to the instances classified as the presence of disease in the absence of disease.
A false negative (FN) refers to the instances which are classified to be the absence of disease when it is actually present. The performance metrics are given in Table 4.
Performance evaluation
While using the SSA, 21 optimal features are selected and a maximum of 88.02% accuracy is achieved. The precision value achieved with FS is 88.12%, the specificity value is 84.78% and the sensitivity value is 83.4%. The confusion matrix is given in Table 5.
Confusion matrix
Statistical significance of the proposed training method is established using three statistical analysis methods namely, Wilcoxon’s test, Kendall’s Rank Correlation Coefficient test and Mean Whitney U test. Wilcoxon Test showed that the difference was statistically significant. The results in p value is <.001, which is below the specified significance level of <.05. The result of the Wilcoxon test is therefore significant for the present data and then the null hypothesis is rejected. A Mann-Whitney U-Test showed that the difference with respect to the dependent variable was statistically significant, i.e., p = < .001, r = 0.8. Thus, the null hypothesis value is rejected. Kendall’s Rank Correlation Coefficient graph is given in Fig. 5.
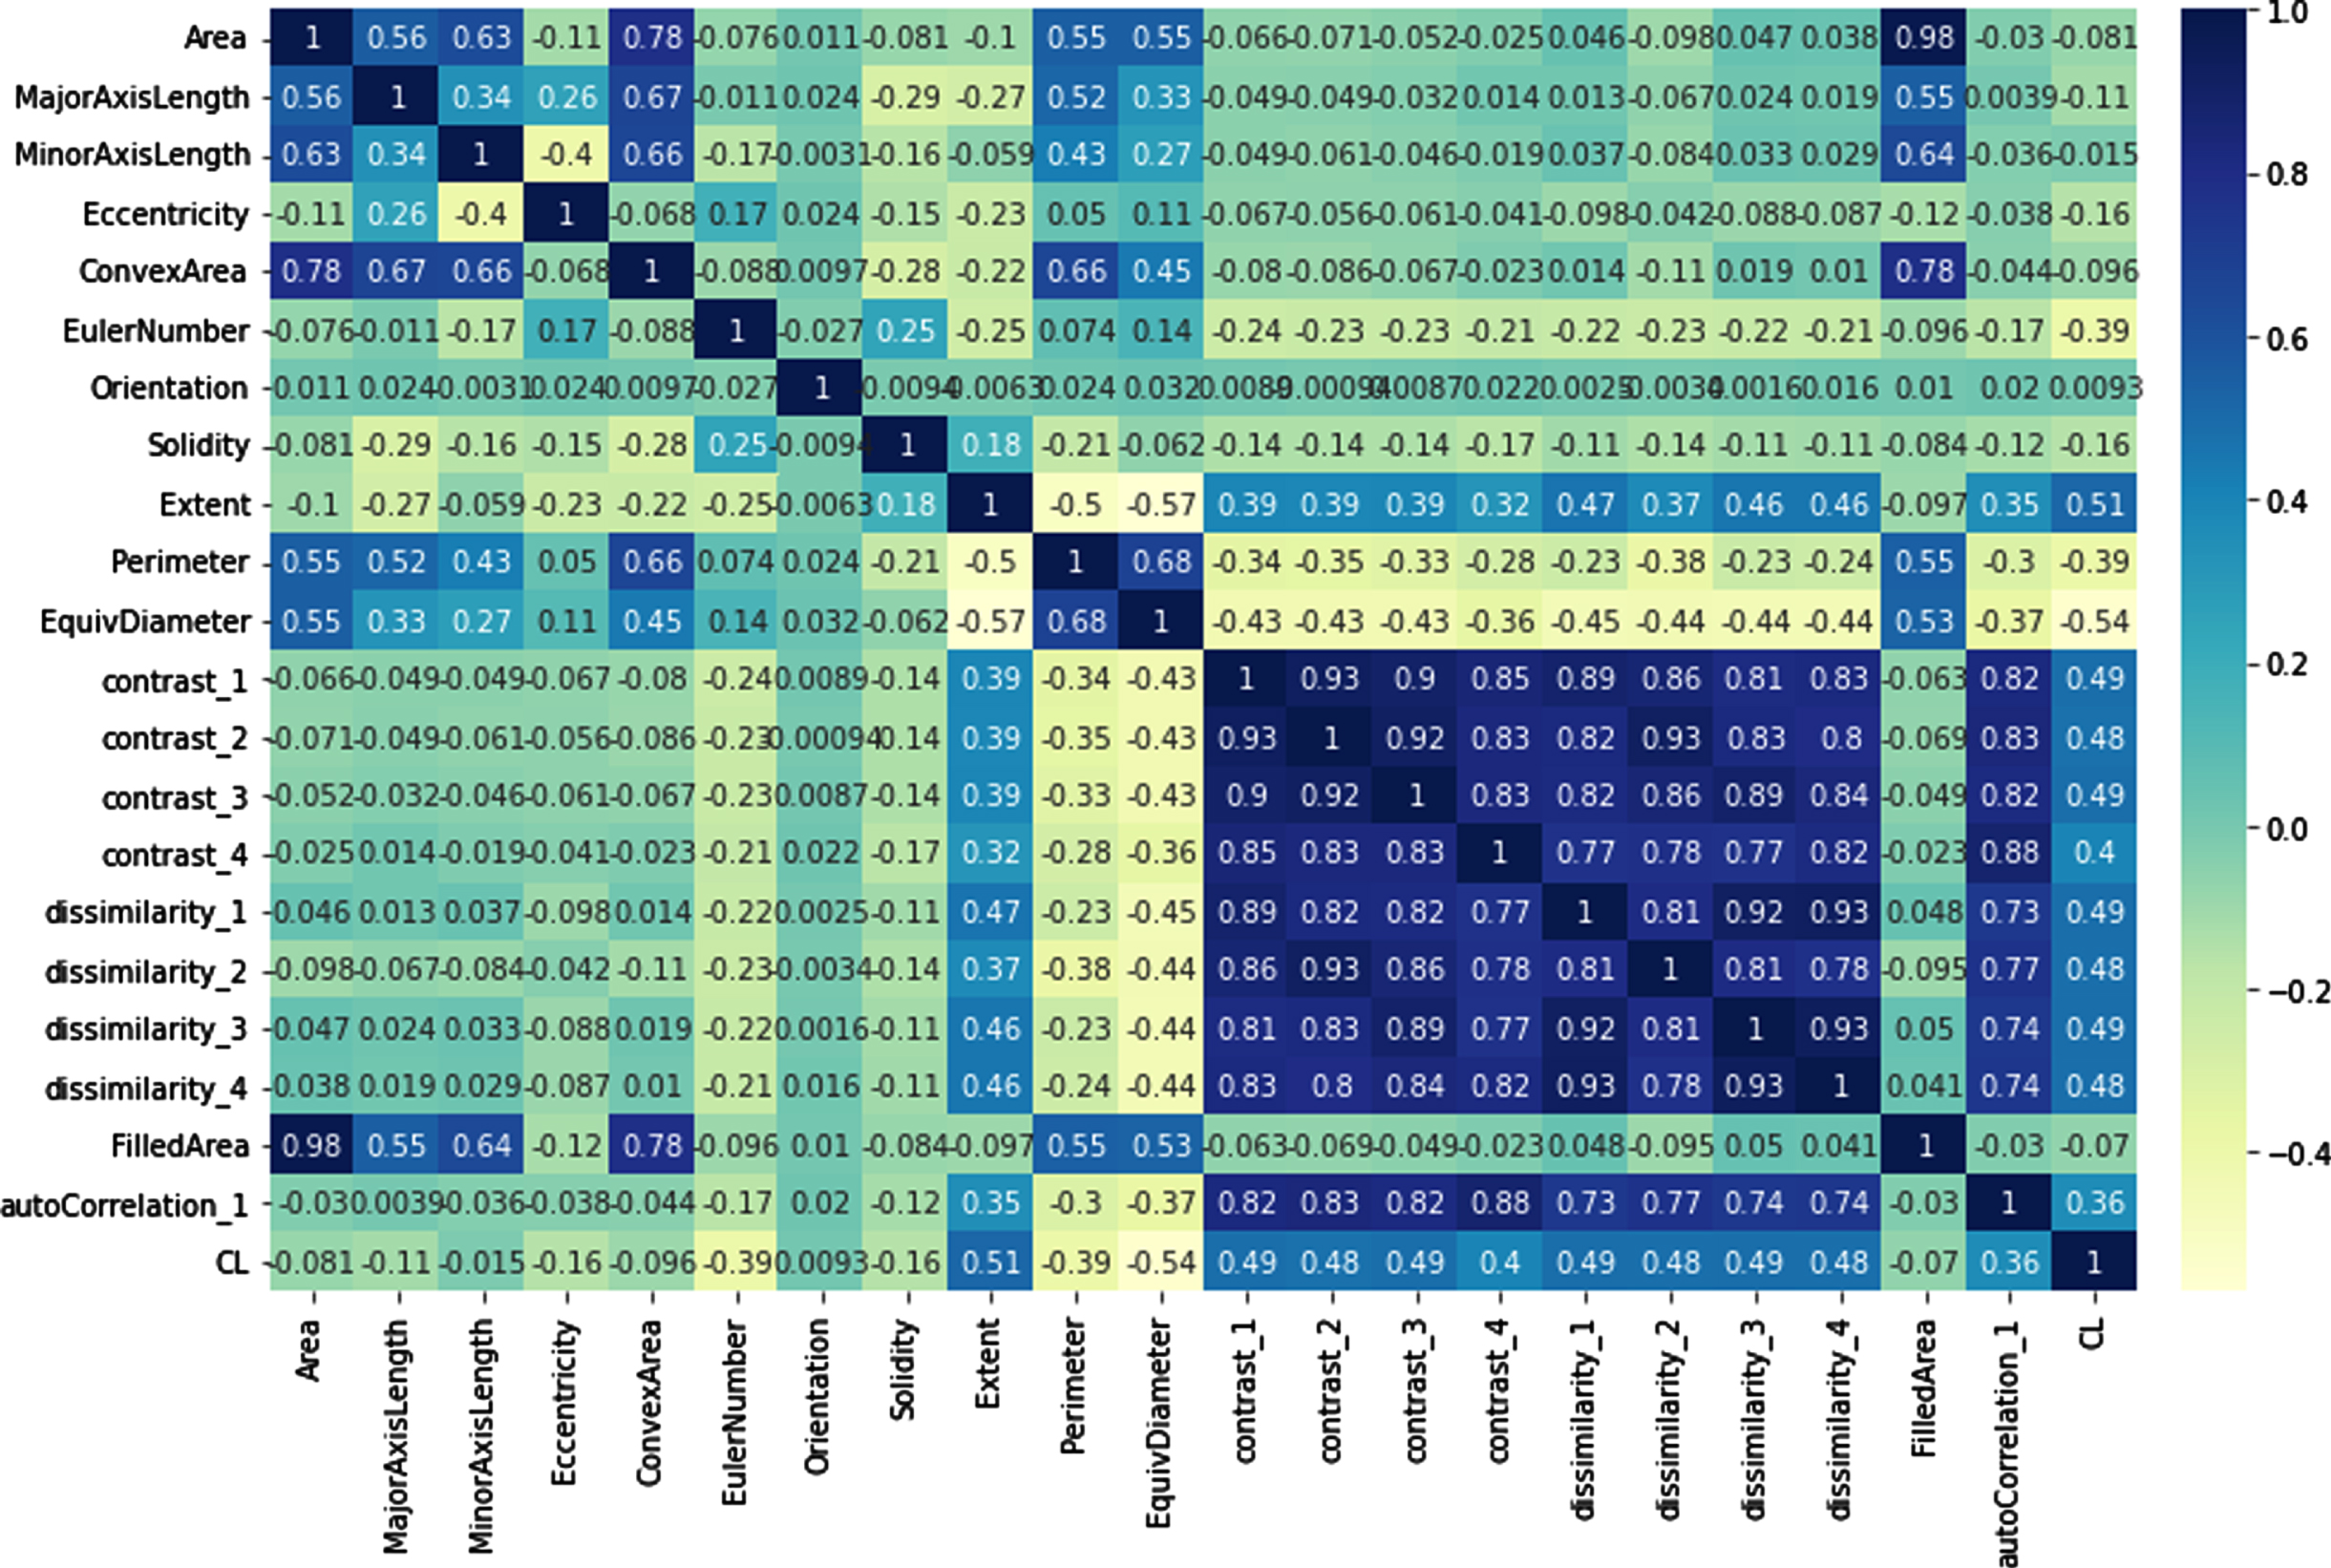
Kendall’s Rank Correlation Coefficient graph.
The covid-19 pandemic has led to reduced seriousness in the identification and treatment of PE, which also has significant impact on the mortality rate of patients. Hence an effective CAD system which can address the presence of covid-19 and PE has been designed and implemented. Through this research work, the false negative rates can be considerably reduced.
From the input chest CT slices, the lung parenchyma was segmented, and the ROIs were extracted. A list of 80 features was obtained from each ROI to formulate feature vectors. The wrapper-based FS was performed using SSA with the accuracy of the SVM classifier as the fitness function. The optimal feature subset obtained from the FS subsystem was trained using the BPNN classifier, and the performance was evaluated using the performance metrics. The proposed CAD system yielded better accuracy when Squirrel Search Algorithm have been used with the fitness function of SVM classifier and BPNN classifiers whereas it has the limitation of not being trained with big data and does not indicate the level of severity of the disease.
The system was examined using the real-time covid dataset and the experimental results showed that the framework with SSA has shown a greater accuracy of 88.02% compared to that without SSA with 83.80% accuracy. Statistical analysis namely, Wilcoxon’s test, Kendall’s Rank Correlation Coefficient test and Mean Whitney U test were performed which indicates that the proposed method has significant impact on the accuracy, sensitivity and specificity on the novel dataset considered.
In future, this work can be extended by using the Linguistic Neutrosophic Cubic Set (LNCS). By using the linguistic features, future work can be extended to the theory of LNCS by developing aggregation operators based on the properties of the LCNS.