
Abstract
Background:
The Huntington’s Disease Integrated Staging System (HD-ISS) defined disease onset using volumetric cut-offs for caudate and putamen derived from FreeSurfer 6 (FS6). The impact of the latest software update (FS7) on volumes remains unknown. The Huntington’s Disease Young Adult Study (HD-YAS) is appropriately positioned to explore differences in FS bias when detecting early atrophy.
Objective:
Explore the relationships and differences between raw caudate and putamen volumes, calculated total intracranial volumes (cTICV), and adjusted caudate and putamen volumes, derived from FS6 and FS7, in HD-YAS.
Methods:
Images from 123 participants were segmented and quality controlled. Relationships and differences between volumes were explored using intraclass correlation (ICC) and Bland-Altman analysis.
Results:
Across the whole cohort, ICC for raw caudate and putamen was 0.99, cTICV 0.93, adjusted caudate 0.87, and adjusted putamen 0.86 (all p < 0.0005). Compared to FS6, FS7 calculated: i) larger raw caudate (+0.8%, p < 0.00005) and putamen (+1.9%, p < 0.00005), with greater difference for larger volumes; and ii) smaller cTICV (–5.1%, p < 0.00005), with greater difference for smaller volumes. The systematic and proportional difference in cTICV was greater than raw volumes. When raw volumes were adjusted for cTICV, these effects compounded (adjusted caudate +7.0%, p < 0.00005; adjusted putamen +8.2%, p < 0.00005), with greater difference for larger volumes.
Conclusions:
As new software is released, it is critical that biases are explored since differences have the potential to significantly alter the findings of HD trials. Until conversion factors are defined, the HD-ISS must be applied using FS6. This should be incorporated into the HD-ISS online calculator.
INTRODUCTION
Volumetric assessment of structural brain magnetic resonance imaging (MRI) has greatly aided our understanding of neurodegenerative diseases. Manual delineation remains the ‘gold standard’ but is very time-consuming and impractical for large-scale clinical trials. Automated methods are faster, reproducible, and require less anatomical and methodological training. However, selection of software package and even parameters within individual methodologies can have huge impacts on volumetric results. This is particularly important when considered in the context of treatment. Disease-modifying therapies need to be given before the onset of significant neurodegeneration to maximize their effect, which will be reflected in study inclusion criteria. Subtle changes to volumetric measures have the capacity to significantly alter the findings of clinical trials
FreeSurfer
FreeSurfer (FS) (https://surfer.nmr.mgh.harvard.edu/fswiki) is an automated segmentation pipeline widely used in neuroimaging research. FS infers tissue class by registering the image to a probability atlas and combining probability distributions for voxel location and intensity [1, 2]. Volume is then calculated as the number of voxels, of known size (usually 1 mm3), within the region-of-interest (ROI). Software updates are known to impact volumetric output, with a study comparing previous versions of FS finding significant differences in absolute volumes with variable correlation [3].
A number of updates have been described for the latest version of FS (FS7). These include a change to the bias field correction from the N3 to the N4 Advanced Normalisation Tools (ANTs) software, additional segmentation subfields to various nuclei, and reduced run times (20–25%) [4]. There is also a new tool named Sequence Adaptive Multimodal Segmentation (SAMSEG) which rapidly segments a much smaller number of brain regions without intensity homogenization.
Huntington’s Disease
Huntington’s Disease (HD) is a devastating neurodegenerative disorder defined by cytosine-adenine-guanine (CAG) trinucleotide repeat expansion in the Huntingtin gene (chromosome 4p16.3), encoding an expanded polyglutamine stretch of the huntingtin protein (HTT) [5] which accumulates in cells. Toxic gain-of-function effects of mutant huntingtin (mHTT) cause neuronal death, predominantly of the medium spiny neurons within the striatum [6], resulting in early atrophy within that region [7] which extends to other subcortical and cortical regions as the disease progresses [8].
The Huntington’s Disease Young Adult Study (HD-YAS)
HD-YAS is the furthest from onset young adult HD cohort studied to date, 24 years from predicted onset, and mean age 29 years [9]. This cohort was found to have normal brain imaging measures, except slightly smaller putamen volumes unrelated to disease burden, suggesting it captures the period before or during the onset of neurodegeneration.
The Huntington’s Disease Integrated Staging System (HD-ISS)
We now enter a pivotal period for HD research, with multiple ongoing clinical trials of disease-modifying therapies. The recently developed HD-ISS has defined the onset of disease (Stage 1) using cut-offs for caudate and putamen volume adjusted for intracranial volume [10]. The staging system was created using volumes derived from FS version 6 (FS6) and aims to allow study harmonization and define inclusion criteria for clinical trials of disease-modifying therapies. Differences in the biases of automated segmentation software have the potential to significantly alter the findings of these trials.
HD-YAS is the ideal cohort to study the impact of the new FS software update on volumetric outputs in an early neurodegenerative disease population with the ability to directly impact study inclusion and harmonization. This will provide a proof-of-concept for the importance of considering segmentation software versions in clinical trial design, alongside providing data specific to their use in early HD.
This study aims to explore the relationships and differences between raw caudate and putamen volumes, calculated total intracranial volumes (cTICV), and adjusted caudate and putamen volumes, derived from FS6 and FS7, in the HD-YAS cohort, to assess the impact of software version on volumetric measures.
MATERIALS AND METHODS
Study participants
Participants were all enrolled from the Huntington’s Disease Young Adult Study [9]. They were recruited across the UK from the Enroll-HD study (https://www.enroll-hd.org/), regional genetic and HD centers, and nationally through the HD Association (https://www.hda.org.uk/) and Youth Organization (https://hdyo.org/).
HD and control groups were matched for age, gender, and education, using means and variances.
The first participant was enrolled in August 2017 and all assessments were completed by April 2019.
All participants were aged 18–40 inclusive and were excluded if they had a history of drug and/or alcohol abuse, significant co-morbidity, or contraindications to MRI scanning.
Pre-manifest HD (preHD) participants were required to have no clinical diagnostic motor features of HD (Unified Huntington’s Disease Rating Scale [UHDRS] Diagnostic Confidence Score < 4 [11]), CAG expansions≥40, and disease burden scores (DBS), a measure of cumulative exposure to mutant huntingtin, ≤240.
Controls were at-risk family members who tested gene negative (CAG < 36), genetically unrelated family members (e.g., partners), and members of the wider HD community.
A total of 131 participants were enrolled. However, six were excluded due to claustrophobia or contraindications to MRI identified after screening. One was excluded after the detection of additional pathology on the MRI known to cause systematic errors in grey matter segmentations. Another was excluded after the detection of an unspecified abnormality on the MRI. The remaining 123 participants underwent neuroimaging (62 preHD and 61 controls).
Ethics
HD-YAS was approved by the Bloomsbury Research Ethics Committee. All participants gave written informed consent before enrolment.
MRI acquisition
All MRIs were acquired on the same research dedicated 3T Prisma scanner (Siemens) by an experienced radiographer. A radiofrequency body coil was used for transmission with a 64-channel head coil for signal reception. A protocol optimized for the study was used: T1-weighted (T1w) images were acquired using a 3D Magnetization Prepared Rapid Gradient Echo (MPRAGE) with the following parameters: repetition time = 2530 ms; time to echo = 3.34 ms; inversion time = 1100 ms; flip angle = 7°; field of view = 256 × 256 × 176 mm3; and resolution = 1.0 × 1.0 × 1.0 mm3.
FreeSurfer
FS versions 6.0.1 and 7.2.0 were downloaded from the FS website (https://surfer.nmr.mgh.harvard.edu/pub/dist/freesurfer/). The default FS intensity inhomogeneity correction was used because 3T images are fully corrected during the default recon-all.
Segmentation
T1w images from all 123 participants with neuroimaging were segmented using the recon-all pipelines of FS6 and FS7 [1, 12]. The skull is stripped and anchors are made on the anterior and posterior commissures. The test scan undergoes an affine transformation to MNI305 space [13], intensity is homogenized using either N3 (FS6) or N4 (FS7) ANTs bias field correction, and then a high-dimensional non-linear transformation is performed to maximize registration accuracy. The probability that a voxel belongs to a tissue class can then be inferred from the MNI305 atlas. This probability is considered alongside probability distributions for voxel intensity to determine tissue class. The program convolves across the image and calculates tissue probabilities for every voxel to create the primary segmentation. The neighborhood function, which infers tissue probability based on the classes of surrounding tissues, then runs multiple iterations until the tissue boundaries stop changing. This prevents the formation of tissue islands, and results in the final segmentation.
Calculated total intracranial volume (cTICV)
TICV is the total volume within the cranium including the brain, meninges, and cerebro-spinal fluid (CSF). TICV remains stable after the fusion of skull sutures and can therefore be used as a surrogate for the maximal brain growth achieved during adolescence [14, 15]. Expressing volumes as a percentage of TICV adjusts for inter-individual variations with maximum brain volume. Manual delineation is the ‘gold standard’, with interslice sampling (for example, every tenth slice) previously validated and currently the status quo [16], but this remains very time-consuming. A variety of different automated techniques have been described, which are either registration- or segmentation-based. FS recon-all employs a registration-based algorithm, known as cTICV, because the skull-CSF boundary is difficult to determine accurately in T1w images (both tissues are low signal), reducing the accuracy of a segmentation-based TICV (sbTICV). cTICV is inferred from the scaling factor required for the affine transformation to Talairach space, and the known TICV of the Talairach atlas which was calculated manually [17].
In addition, FS7 has been released with a new tool, named SAMSEG [18]. This tool uses a mesh-based atlas with a Gaussian model to perform segmentation independent from image contrast by grouping together voxels with similar intensities, whilst simultaneously performing the non-linear transformation, and bias field correction. This is computationally much less demanding, and faster (approximately 10 minutes per scan), than recon-all. Unlike recon-all, SAMSEG segmentations completely fill the skull, and the simple addition of all segmentations outputs an alternative sbTICV, rather than having to rely on the affine transformation to Talairach space. In a post-hoc analysis, SAMSEG was run for the acquisition of sbTICV from FS7.
Manual total intracranial volume (manual TICV)
Manual TICV (the ‘gold standard’) was calculated during the HD-YAS study using the protocol by Whitwell et al. [16]. Every 10th axial section was segmented with the inferior border set as the lowest section with cerebellar tissue present. Linear interpolation between sections was used to calculate overall TICV. This has previously been shown to stream-line manual TICV without loss of accuracy [19].
Quality control
Volumes may remain normal despite inaccurate segmentations and therefore segmentations must be reviewed directly [20]. All scans were quality controlled twice by a single investigator (HK) blinded to disease status, software version, and volume. QC was performed in sequential order of random numbers to avoid the introduction of systematic bias through rater-drift. The first 20 segmentations were reviewed alongside a second researcher (RIS) to ensure consistency and neuroanatomical accuracy. Scans were considered to be broadly ‘pass’ or ‘fail’ based on whether the segmentation boundary was deemed to be outside of the visible boundary. Manual editing of failed segmentations was not performed to avoid the introduction of additional variability.
Unlike segmentation volumes, cTICV could not be quality controlled since it is not based on a segmentation, but rather the affine transform to the Talairach atlas. The quality of the Talairach registrations was not assessed directly as the presence of a successful segmentation implied accurate registration, and because cTICV is calculated solely from the affine component of the transformation, not the final transform (including non-linear) which is visualized.
Statistical analyses
Continuous variables are presented as means (standard deviation) if normally distributed, or median (interquartile range) if not. Categorical variables are presented as numbers (percentages). Means for continuous variables were compared using appropriate statistics dependent on whether data was parametric and paired. Log transformations to parametric distributions were attempted where appropriate. Categorical variables were compared using the χ2 test for expected frequencies > 5, and Fisher’s exact test when≤5.
The relationships between FS6 and FS7 volumes were assessed on participants with pairwise data available. Similarities were assessed using intraclass correlation coefficient (ICC). Differences were explored using Bland-Altman analysis [21, 22]. A scatter plot is created in which the Y axis shows the difference between two volumes (A –B), and the X axis shows the mean between two volumes ([A + B]/2). Systematic bias is described using the mean difference and 95% limits of agreement. Proportional bias is explored through Bland-Altman linear regression analysis [23]. In a post-hoc analysis, cTICV was compared with manual TICV available from the HD-YAS study. Bland-Altman plots were constructed using the mean of FS and manual TICV.
A two-tailed p-value below 0.05 was considered statistically significant. All statistics were performed using Stata v17.0. Graphs were created on Stata and GraphPad Prizm v9.0.
RESULTS
Quality control of segmentations
No segmentations were identified as gross failures, however, a number showed poor delineation of the caudate and putamen. This included 8/123 (6.5%) of FS6 outputs: 5 for undersegmentation of the right caudate head (Fig. 1); 2 for bilateral putamen extension into the adjacent claustrum (Fig. 2); and 1 for both. This also included 6/123 (4.9%) of FS7 outputs: all for bilateral putamen extension into the adjacent claustrum. A more detailed description of failure frequencies according to FS version, disease status, and brain region can be seen in Table 1.
Baseline characteristics
Baseline disease status, demographics, and clinical characteristics are provided for populations passing quality control for FS6, FS7, and both. Education level is according to the International Standard Classification of Education (ISCED). CAG, cytosine-adenine-guanine; DBS, Disease Burden Score; CAP, CAG-Age-Product; CAP100, CAG-Age-Product100; TMS, Total Motor Score; SDMT, Symbol Digit Modalities Test.
Figure 1 shows the missing right caudate head in FS6 (A and B) which has been recovered in FS7 (C and D). There were no external islands of caudate and putamen tissue, or internal islands of other tissues, identified. Only one participant failed both FS6 and FS7, for putamen extension in both cases.
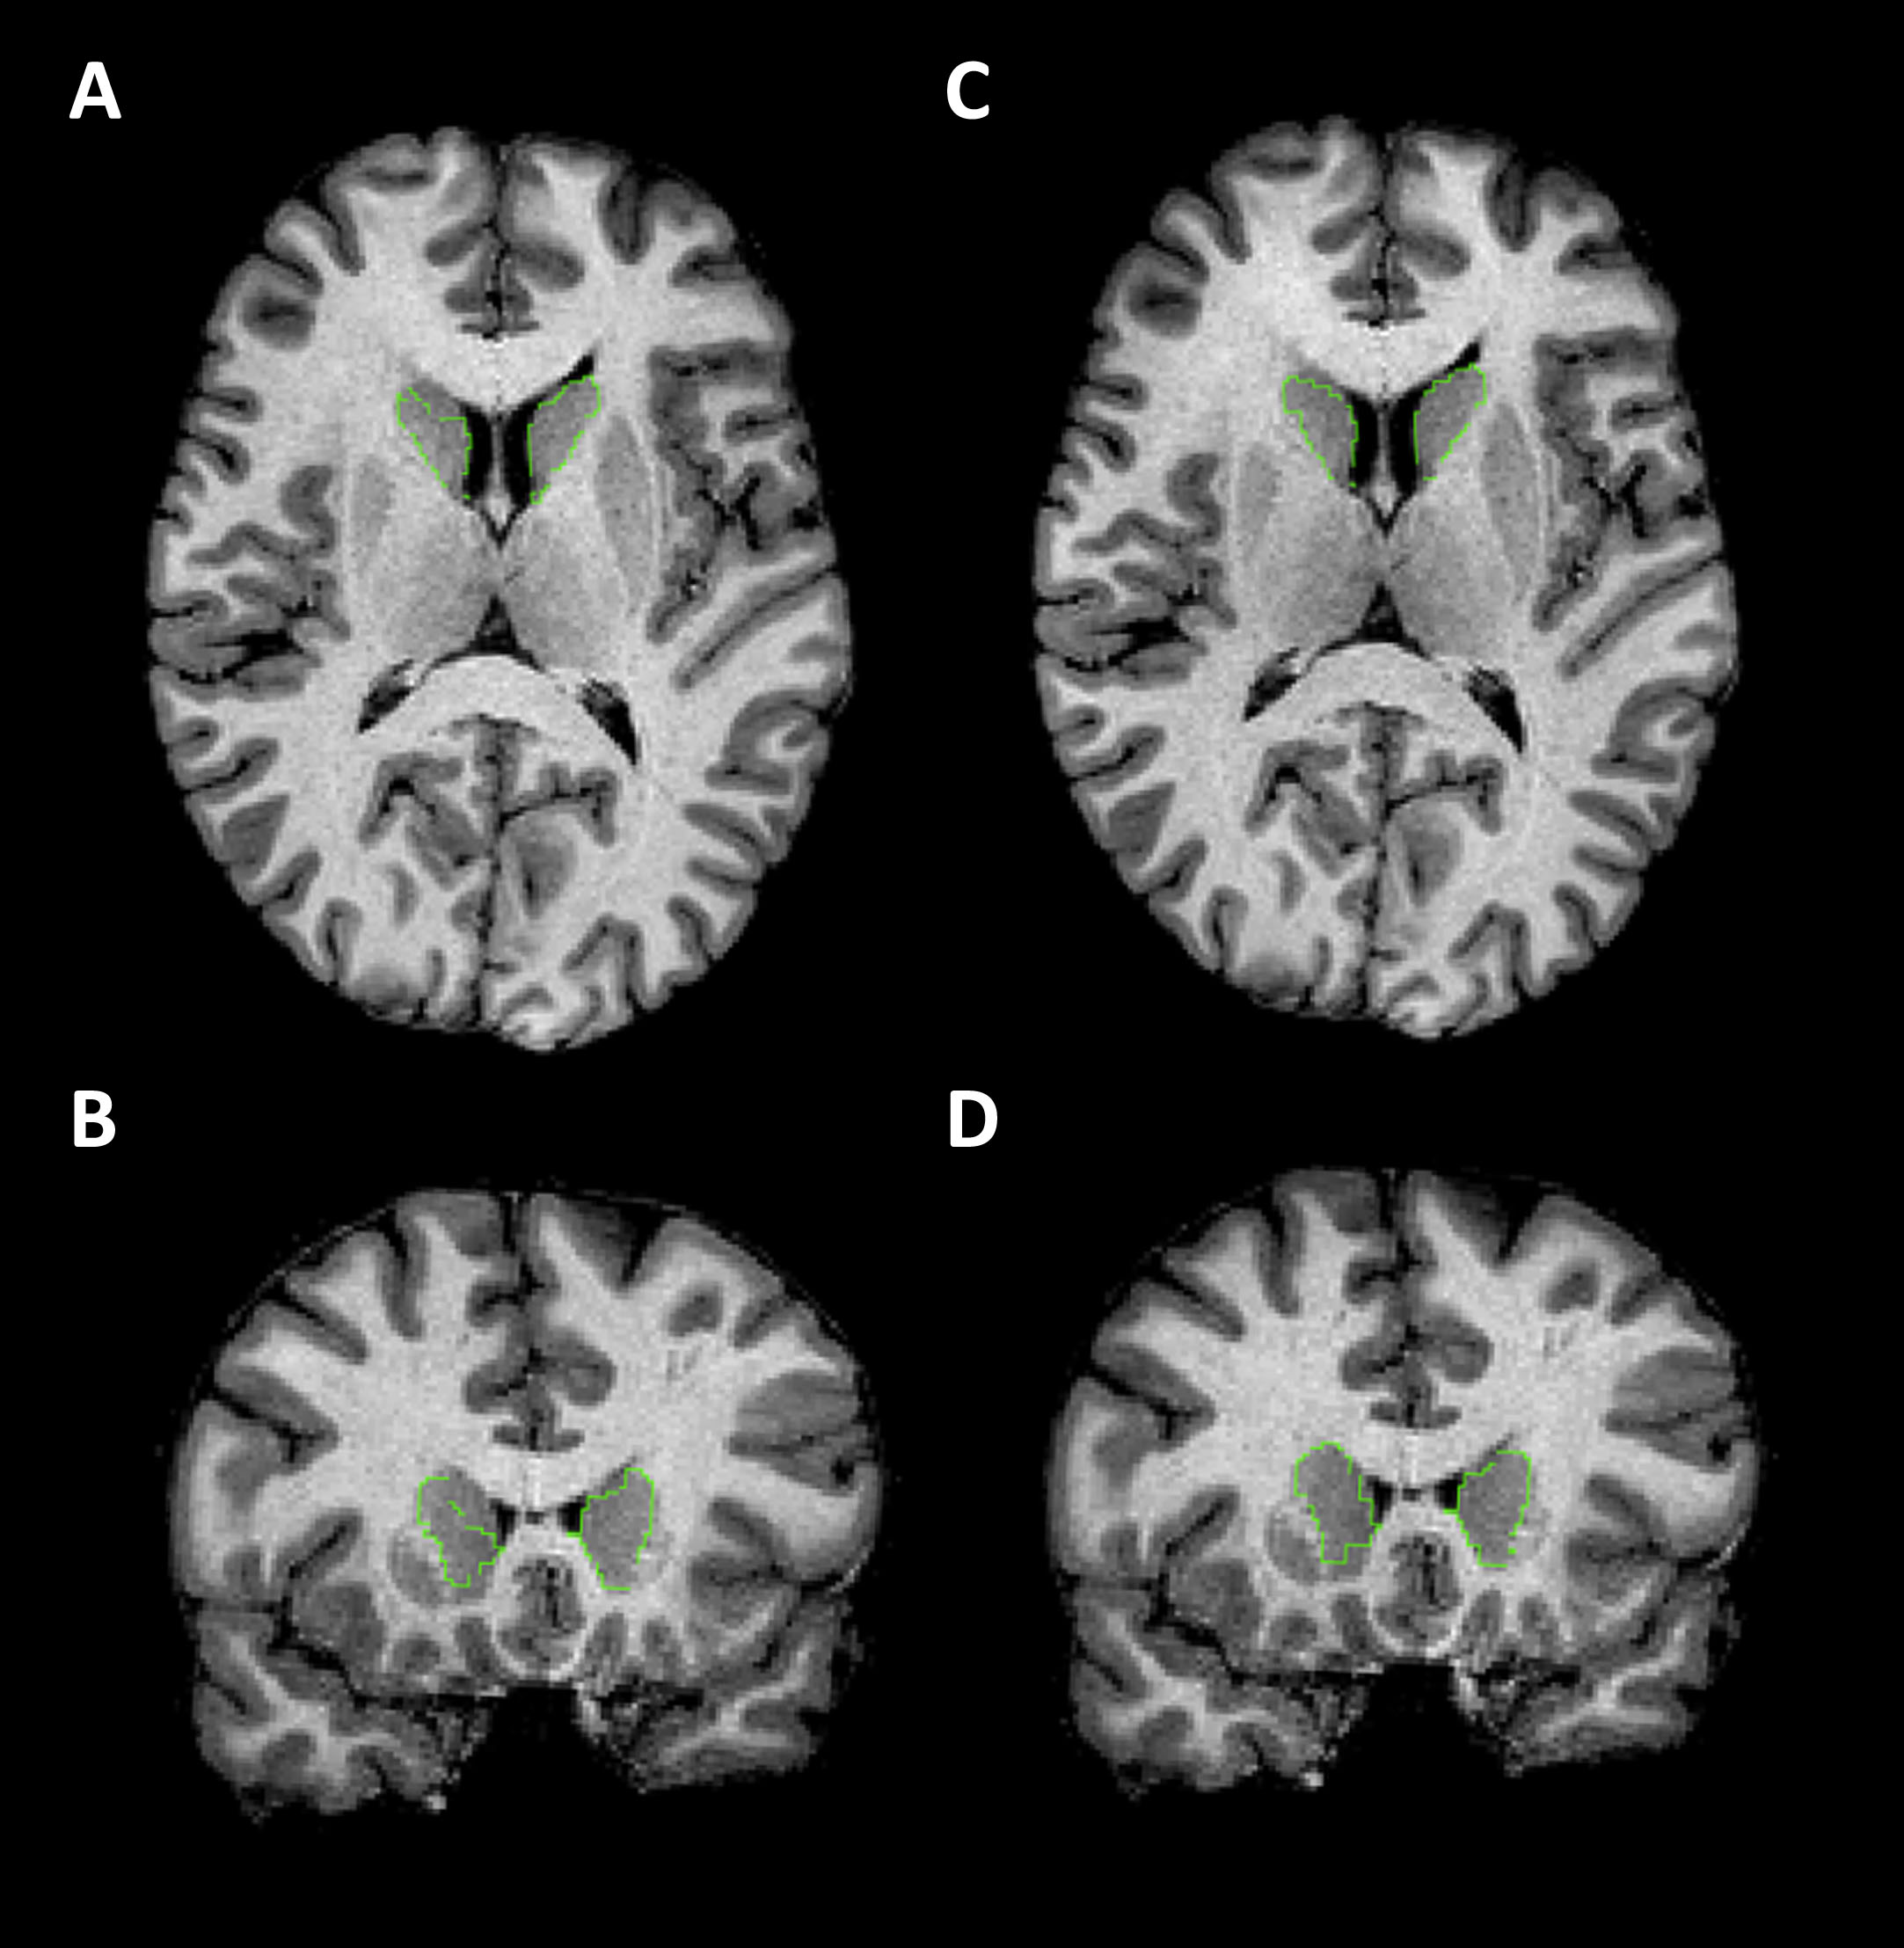
Examples of caudate segmentations. T1-weighted MRI images with caudate segmentation boundaries highlighted in green. All images are from a single participant. A and C are in the axial plane (axial slice 108). B and D are in the coronal plane (coronal slice 149). A-B shows a poor-quality segmentation from FS6. C-D shows the good quality segmentation from FS7. There were no borderline caudate segmentations, unlike putamen, to provide an example of.
Undersegmentation of the caudate head was only present in QC failures. By contrast, bilateral putamen extension into the adjacent claustrum was always present, but with varying severity. Putamen extensions representing the spectrum of severity (good, borderline, and failure) are displayed in Fig. 2.
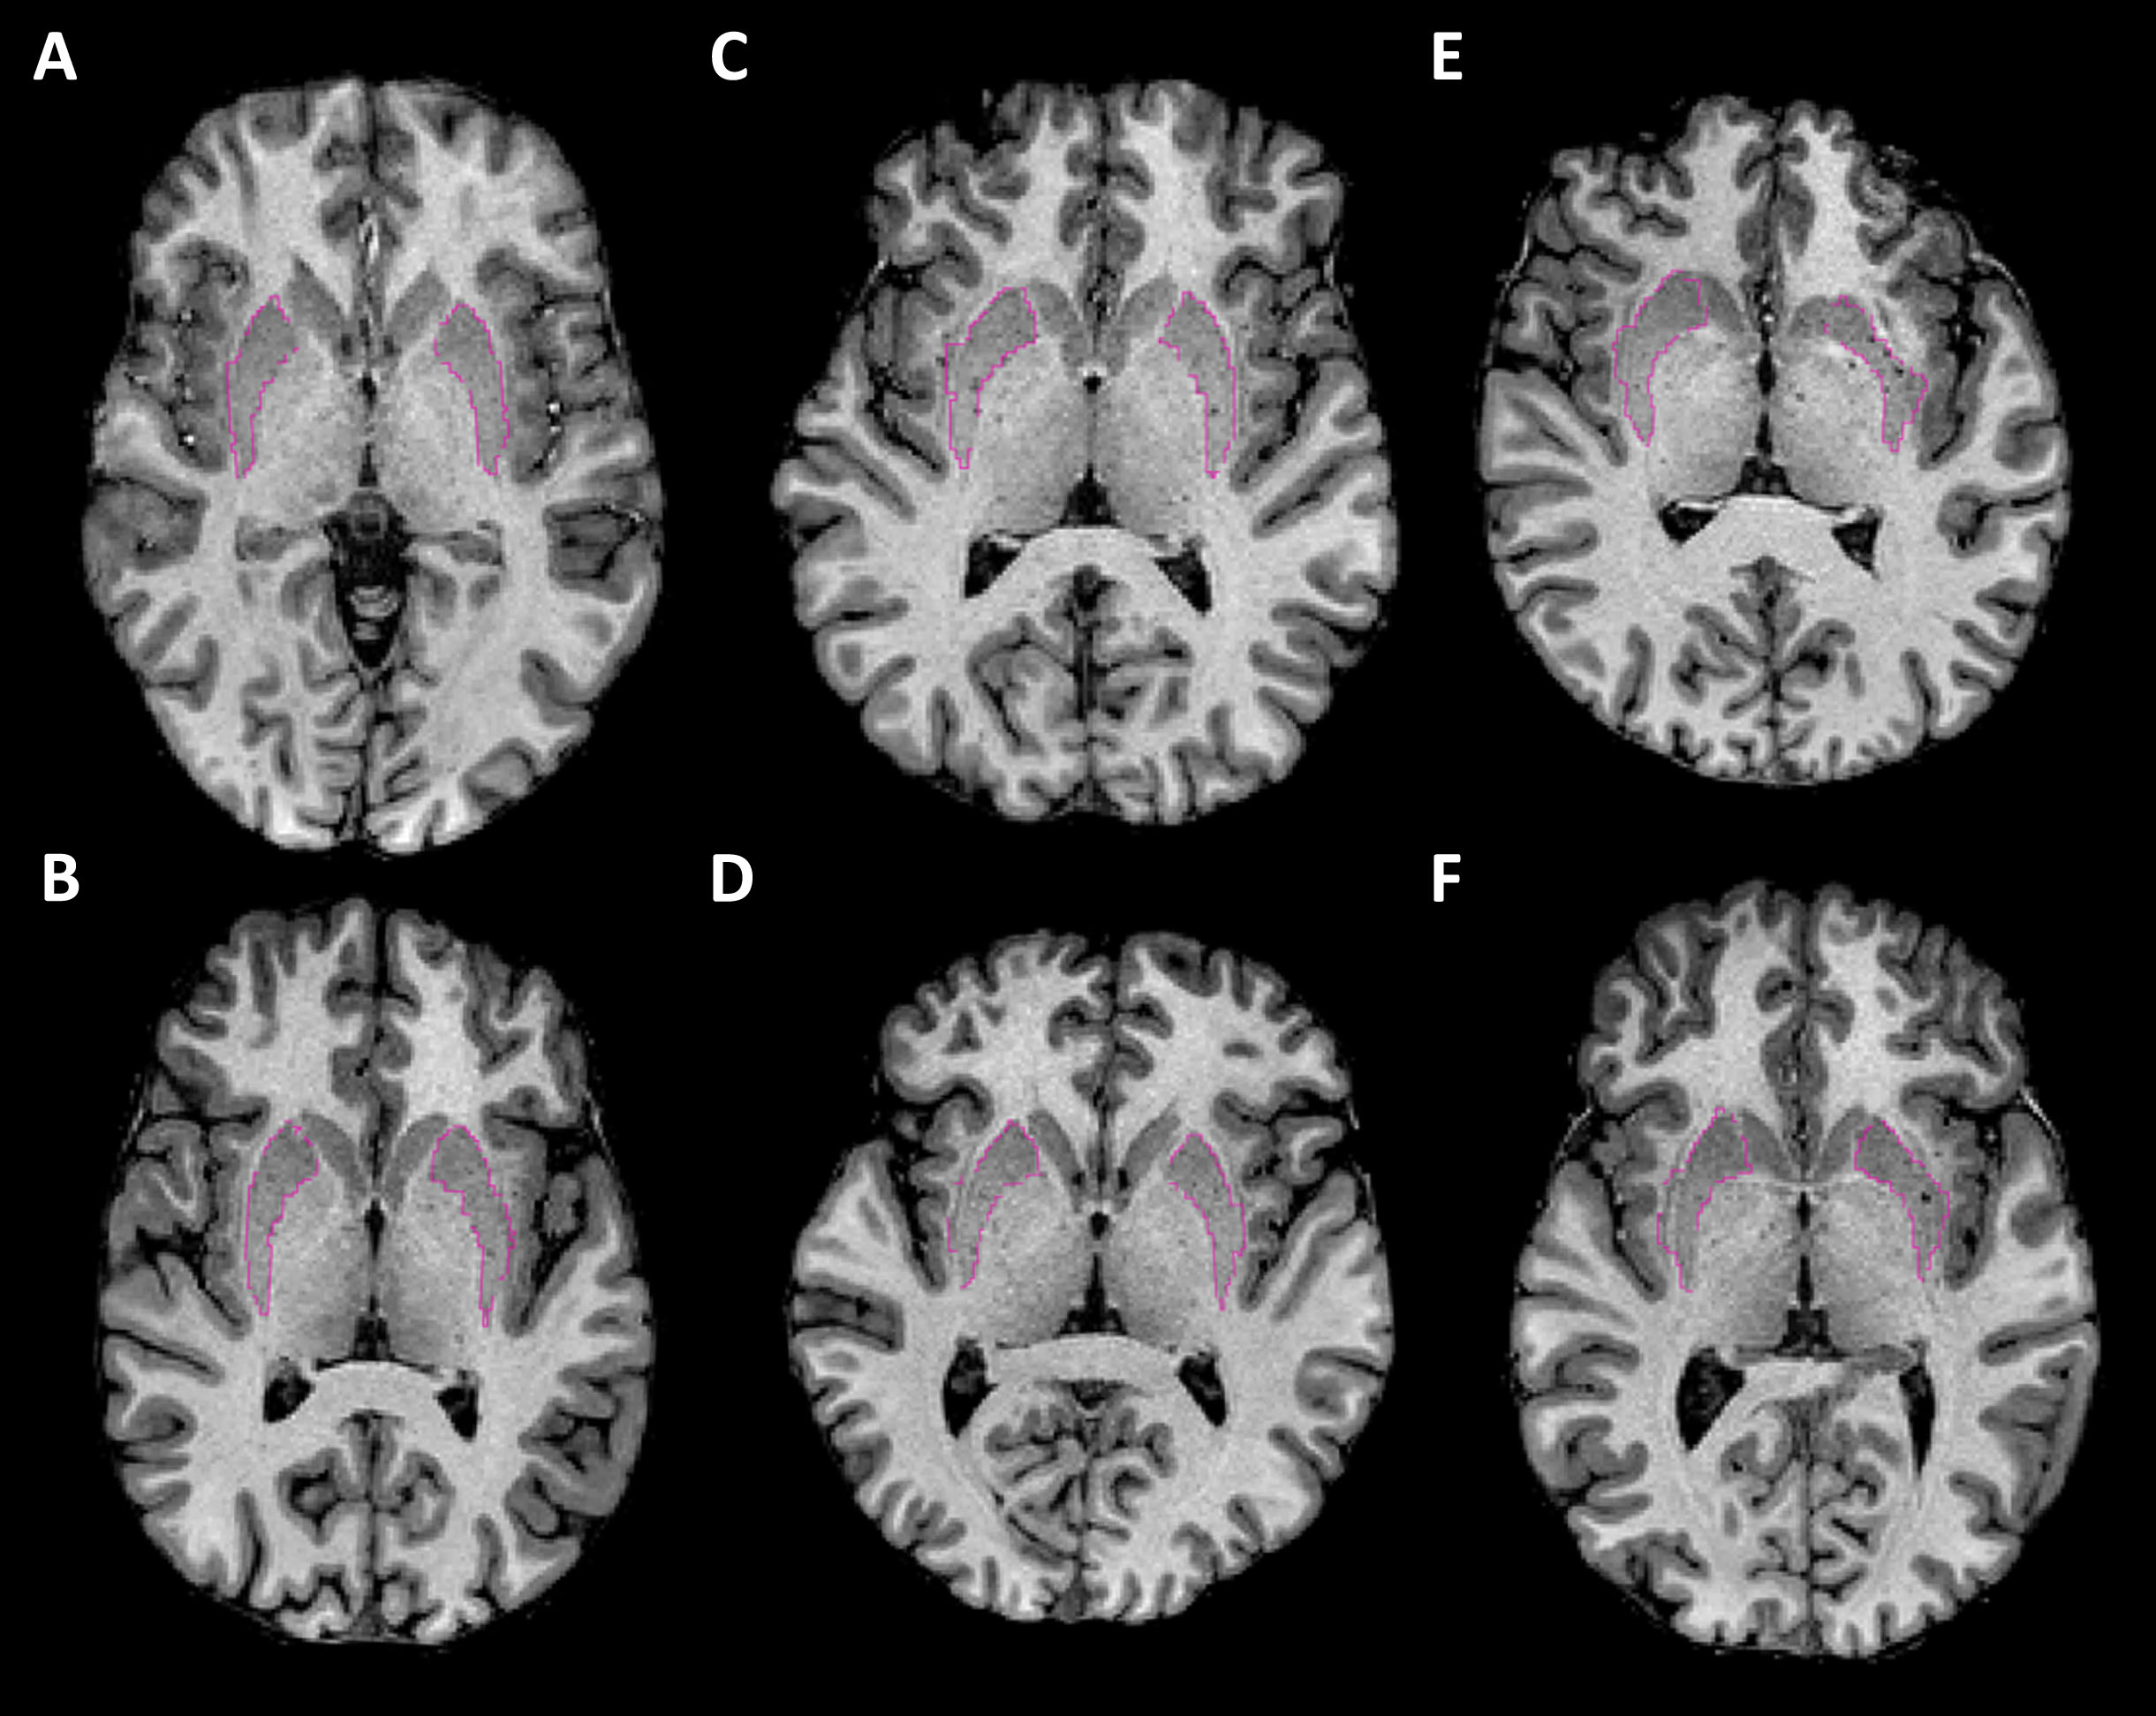
Examples of putamen segmentations. T1-weighted MRI images with putamen segmentation boundaries highlighted in pink. Images are in the axial plane and bisect the putamens to visualize the putamen extension into the claustrum. A-B show examples of good segmentations. C-D show borderline segmentations that were included. E-F shows failures. Images are taken from FS6 (top row) and FS7 (bottom row) as this error was consistent across software version.
The areas of error for putamen extensions were where the claustrum touches the putamen. Failed caudate head segmentations were always at the anterior grey-white matter boundary.
Analysis of failure frequencies revealed that the use of FS6 instead of FS7 was significantly associated with undersegmentation of the right caudate head (p = 0.029), while there was no significant difference in the frequencies of putamen oversegmentation into the adjacent claustrum (p = 0.33).
The final populations were 115 for FS6, 117 for FS7, and 110 for the pairwise comparison of FS6 and FS7. Baseline demographics for these populations are displayed in Table 1. Differences between these populations were marginal.
Comparison between FS6 and FS7
Relationships between FS6 and FS7 volumes
ICC for raw volumes measured by FS6 and FS7 was 0.99 for caudate and putamen in the whole cohort, and individually for preHD participants, and controls (Table 2). cTICV correlation was slightly less strong with an ICC of 0.93 for the whole cohort, although this was higher at 0.95 for preHD participants, and slightly lower at 0.91 for controls. When raw volumes and cTICV were combined for the calculation of adjusted volumes, ICC values decreased further: adjusted caudate was 0.87 for the whole cohort, and again was higher at 0.93 for preHD participants, than controls at 0.78; adjusted putamen was similar at 0.86 for the whole cohort, and again higher for preHD participants at 0.90, than controls at 0.80. All ICC values were highly significant at p < 0.0005.
Individual intraclass correlation coefficients for segmentation volumes derived from FS6 and FS7
ICC values are calculated for the whole cohort and then separately for preHD participants and controls only. cTICV, calculated total intracranial volume; ICC, intraclass correlation coefficient.
Differences between FS6 and FS7 volumes
Bland-Altman analysis was performed to describe the differences between caudate and putamen volumes derived from FS6 and FS7. FS7 was found to be systematically biased towards calculating larger raw volumes than FS6, with a larger difference for the putamen (+1.9%) than caudate (+0.8%) (Table 3). Linear regression analysis of raw caudate and putamen volume Bland-Altman plots identified small and monophasic positive trends of differences across the range of volumes measured, proportional to volume (Fig. 3A, B). This suggests that FS7 has a tendency to overestimate larger more than smaller raw caudate and putamen volumes.
Systematic differences in segmentation volumes from FS6 and FS7
cTICV, calculated total intracranial volume.
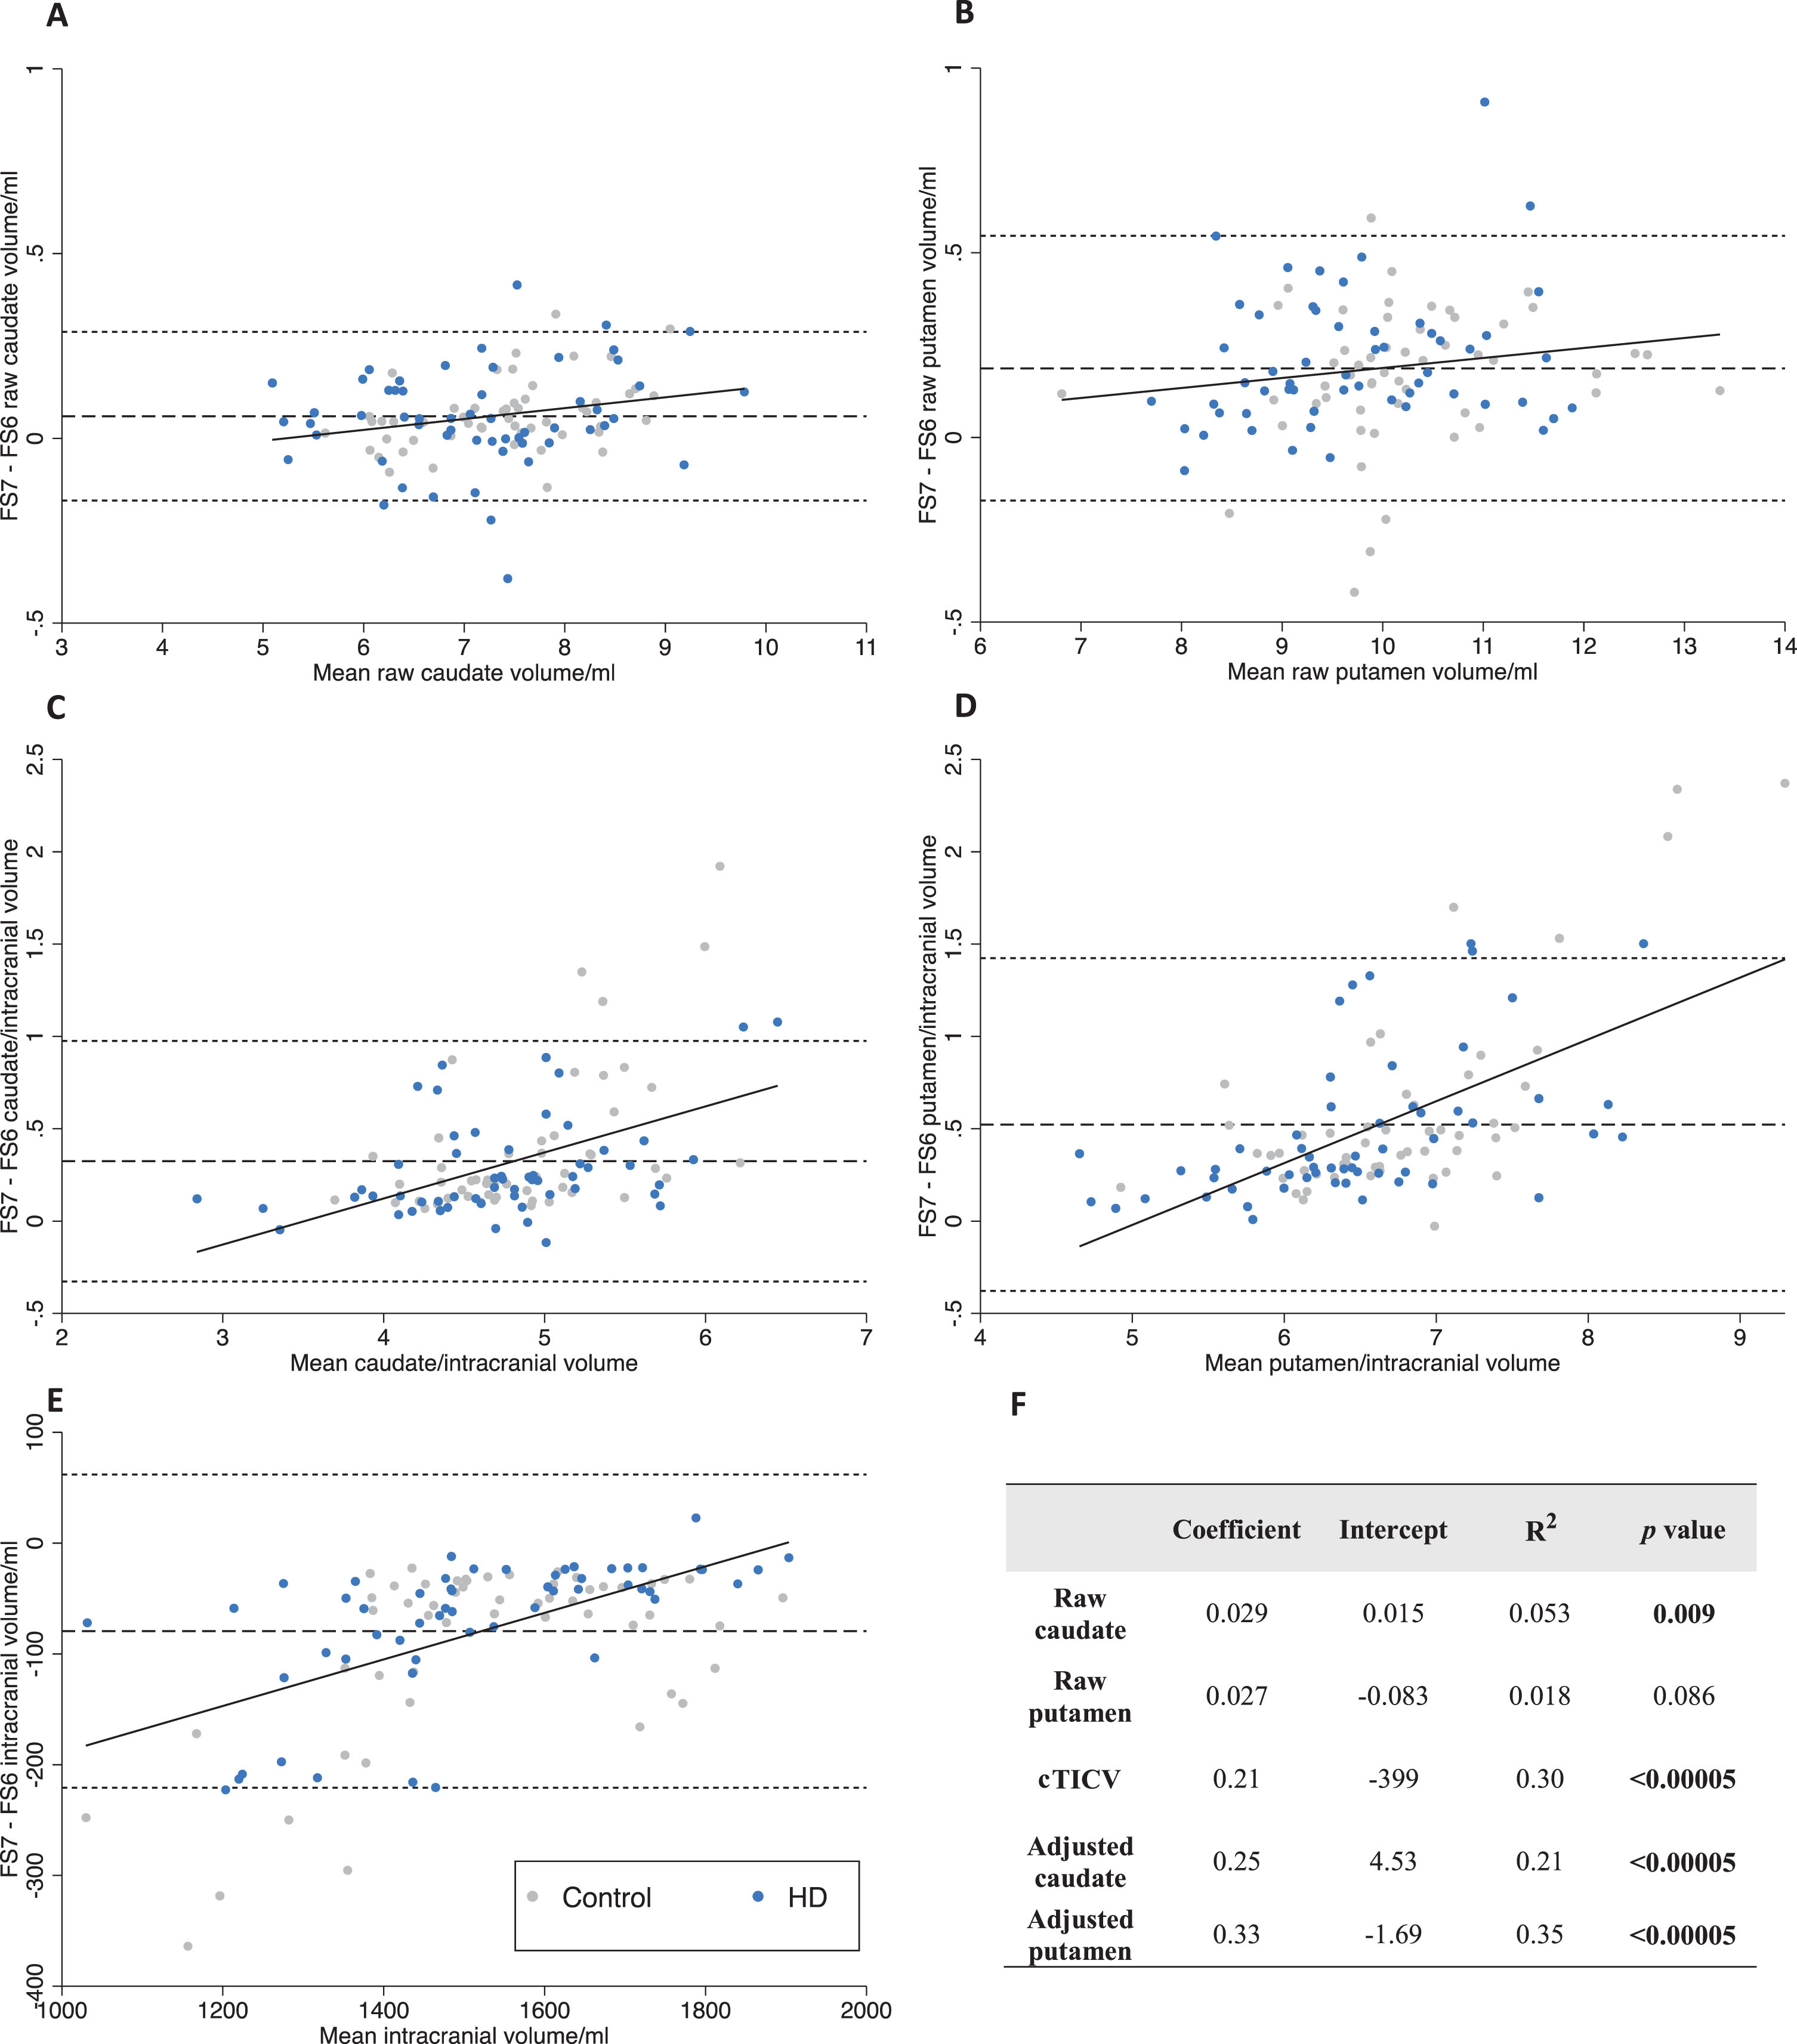
Bland-Altman analysis of FS6 versus FS7. Bland-Altman differences are plotted as FS7 –FS6. Linear regression (solid), mean difference (dash), 95% limits of agreement (dots). Data points are labelled as preHD (blue) and control (grey) to visualize any difference in bias with disease status. A-B raw volumes. C-D volumes adjusted for cTICV. E cTICV. F coefficients, intercepts, R-squared, and p-values for regression lines on Bland-Altman plots. cTICV, calculated total intracranial volume; FS, FreeSurfer.
FS7 calculated smaller cTICV than FS6 (–5.1%). Linear regression analysis of the cTICV Bland-Altman plot identified a large and positive monophasic trend of differences across the range of volumes measured, proportional to volume (Fig. 3E). This suggests FS7 underestimates smaller more than larger cTICVs.
When raw volumes were adjusted for cTICV to calculate adjusted volumes, FS7 calculated larger adjusted caudate (+7.0%) and putamen (+8.2%) volumes than FS6. Linear regression analysis of the Bland-Altman plots identified large and positive monophasic trends of differences across the range of volumes measured, proportional to volume (Fig. 3C, D). This suggests FS7 overestimates larger adjusted volumes.
Overall, the overestimation of raw volumes by FS7 was small in comparison to the underestimation of cTICV. Furthermore, cTICV showed a much greater variation in bias proportional to volume measured. These findings suggest the difference in adjusted caudate and putamen volume between FS6 and FS7 is predominantly the result of different cTICV measurement. Therefore, in a post-hoc analysis, cTICV was compared to manual TICV (the ‘gold standard’) calculated during the HD-YAS study using the protocol by Whitwell et al. [16] (Fig. 6).
Comparison of cTICV to manual TICV
FS6 was systematically biased towards calculating larger cTICV than manual segmentation (+5.2%) (Table 4). Linear regression analysis displayed a small positive trend proportional to volume measured (Fig. 4). This suggests FS6 mildly overestimates larger cTICVs more than smaller cTICVs.
Systematic differences in cTICV between FreeSurfer and manual segmentation
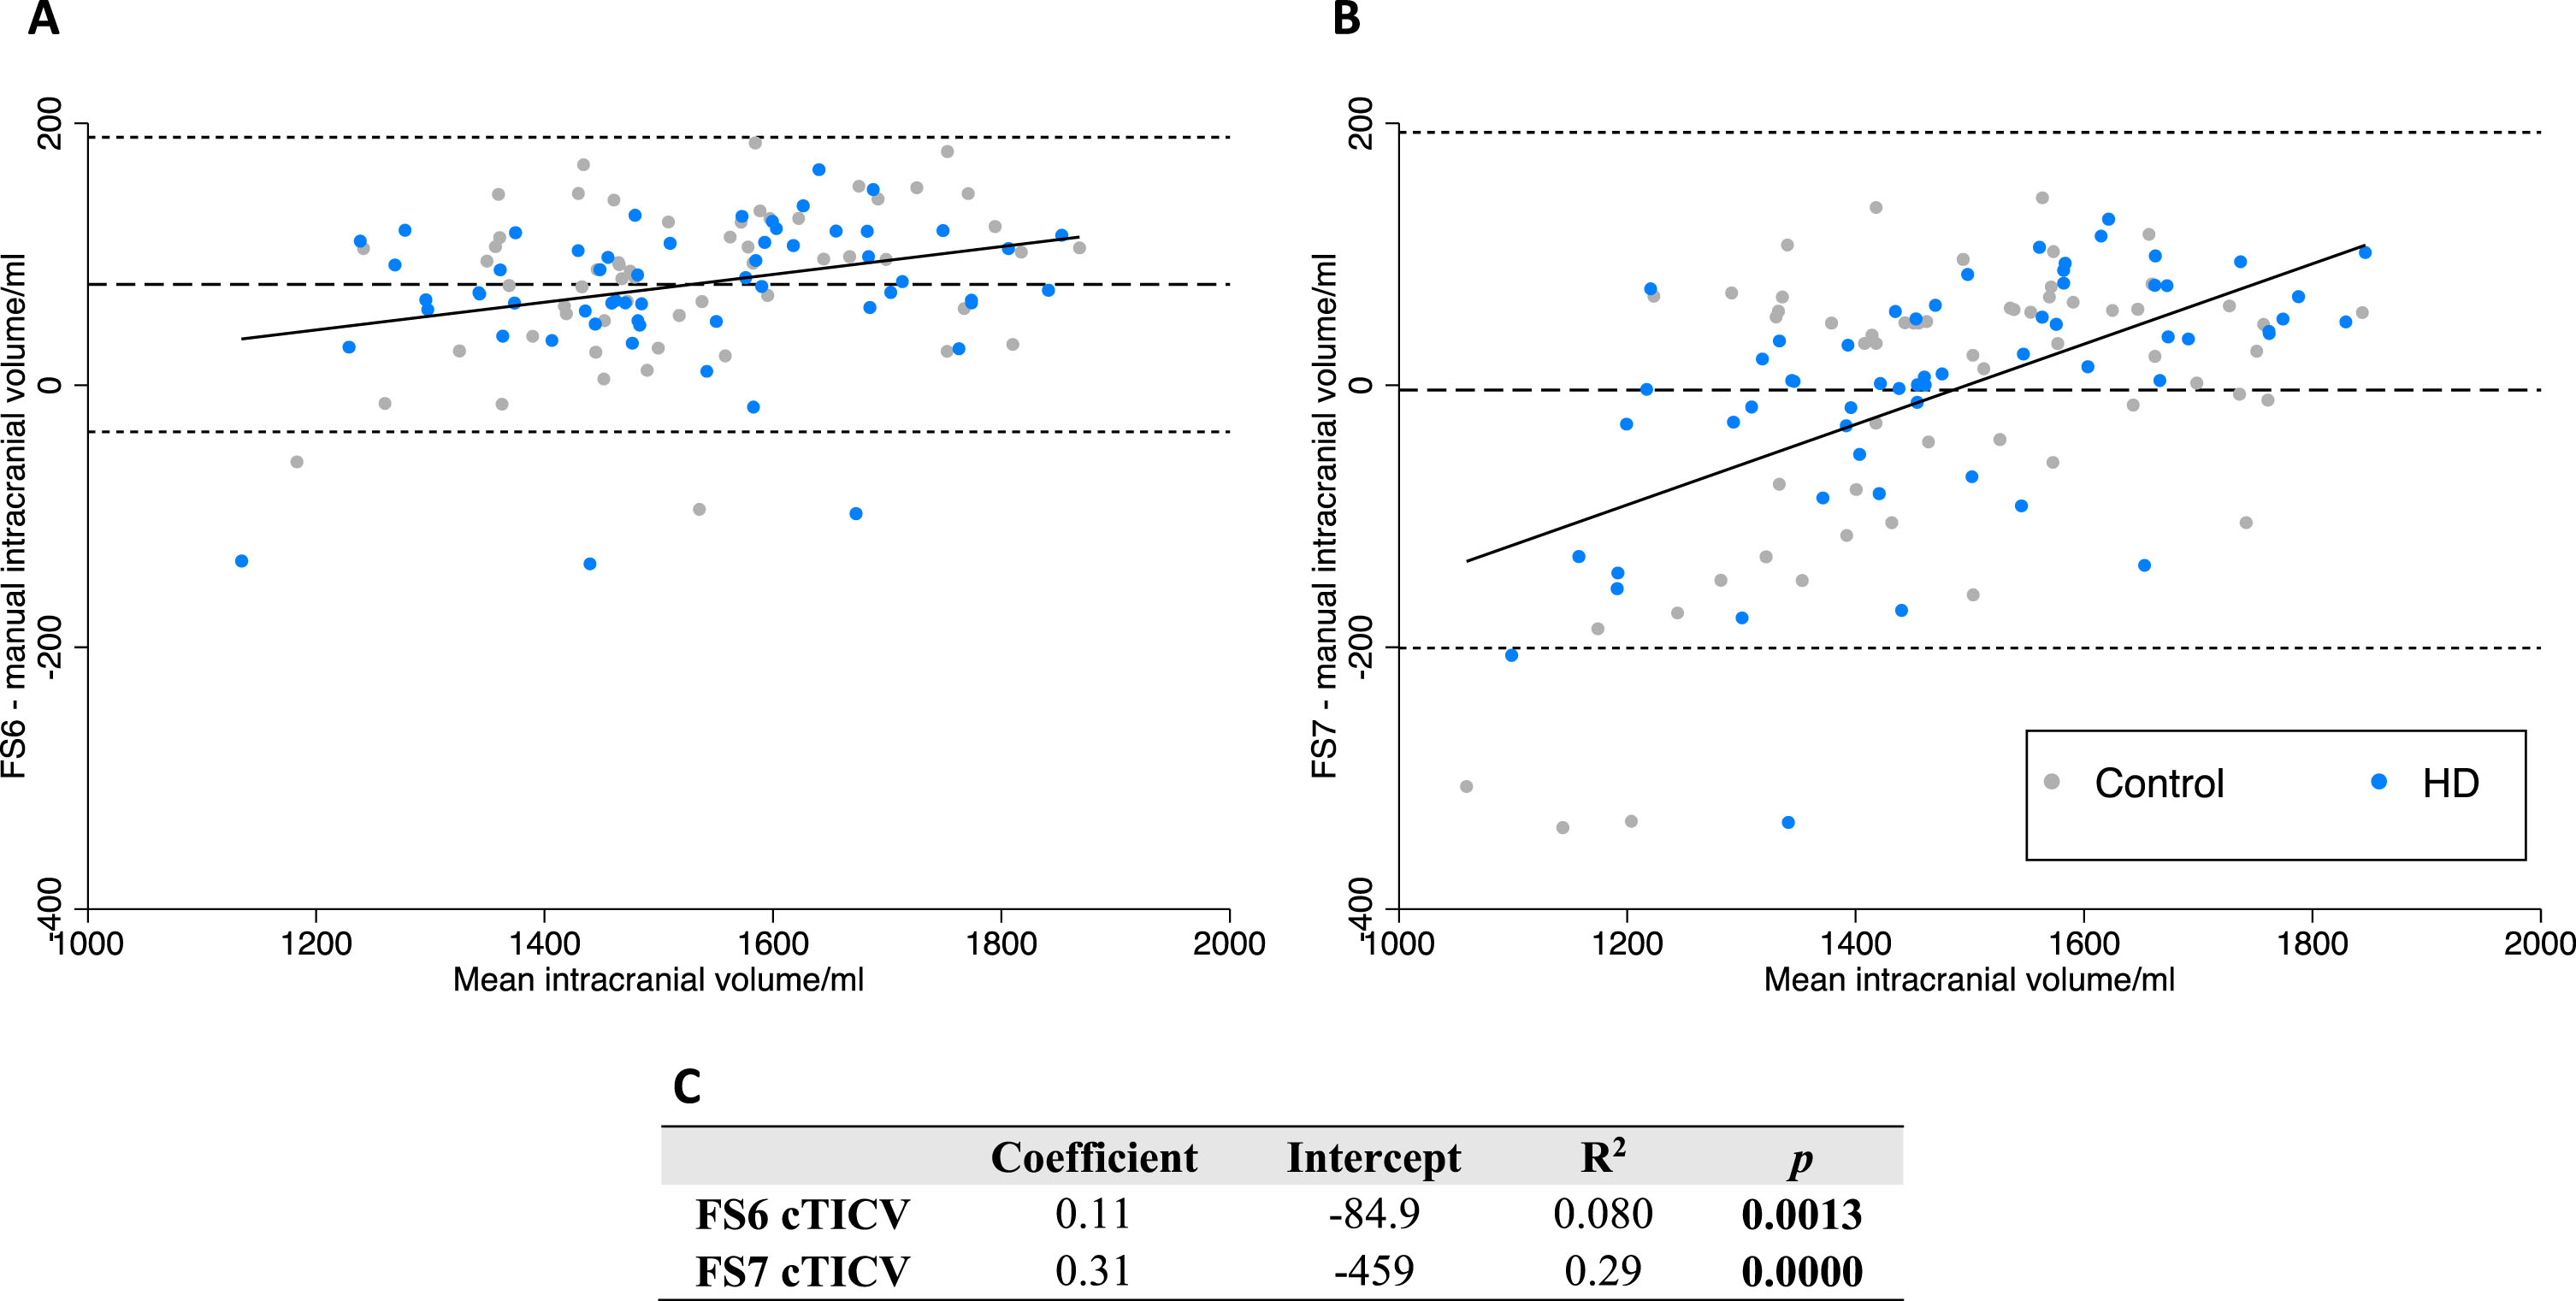
Bland-Altman analysis of FS6 and FS7versus manual delineation of cTICV. Bland-Altman differences are plotted as FScTICV –manual TICV. Linear regression (solid line), mean difference (dashed line), 95% limits of agreement (dotted line). Data points are labelled as preHD (blue) and control (grey) to visualize any difference in bias with disease status. A FS6. B FS7. C equations for displayed linear regression.
FS7 was not systematically biased compared to manual segmentation when measuring cTICV (–0.3%, p = 0.69) (Table 4). However, linear regression analysis displayed a large and biphasic positive trend proportional to volume measured (Fig. 4). This suggests FS7 overestimates larger and underestimates smaller cTICVs.
FreeSurfer 7 segmentation-based total intracranial volume (sbTICV)
In a post-hoc analysis performed after the identification of FS7 cTICV error, FS7 SAMSEG was performed for the calculation of sbTICV. sbTICV was systematically biased towards calculating larger TICV than manual segmentation (mean sbTICV 1578 ml, mean manual TICV 1492 ml, mean difference 86.0 ml, % difference +5.76, p = < 0.0005) (Fig. 5). Linear regression analysis displayed a small positive trend proportional to volume measured. This suggests SAMSEG mildly overestimates larger sbTICVs more than smaller sbTICVs.
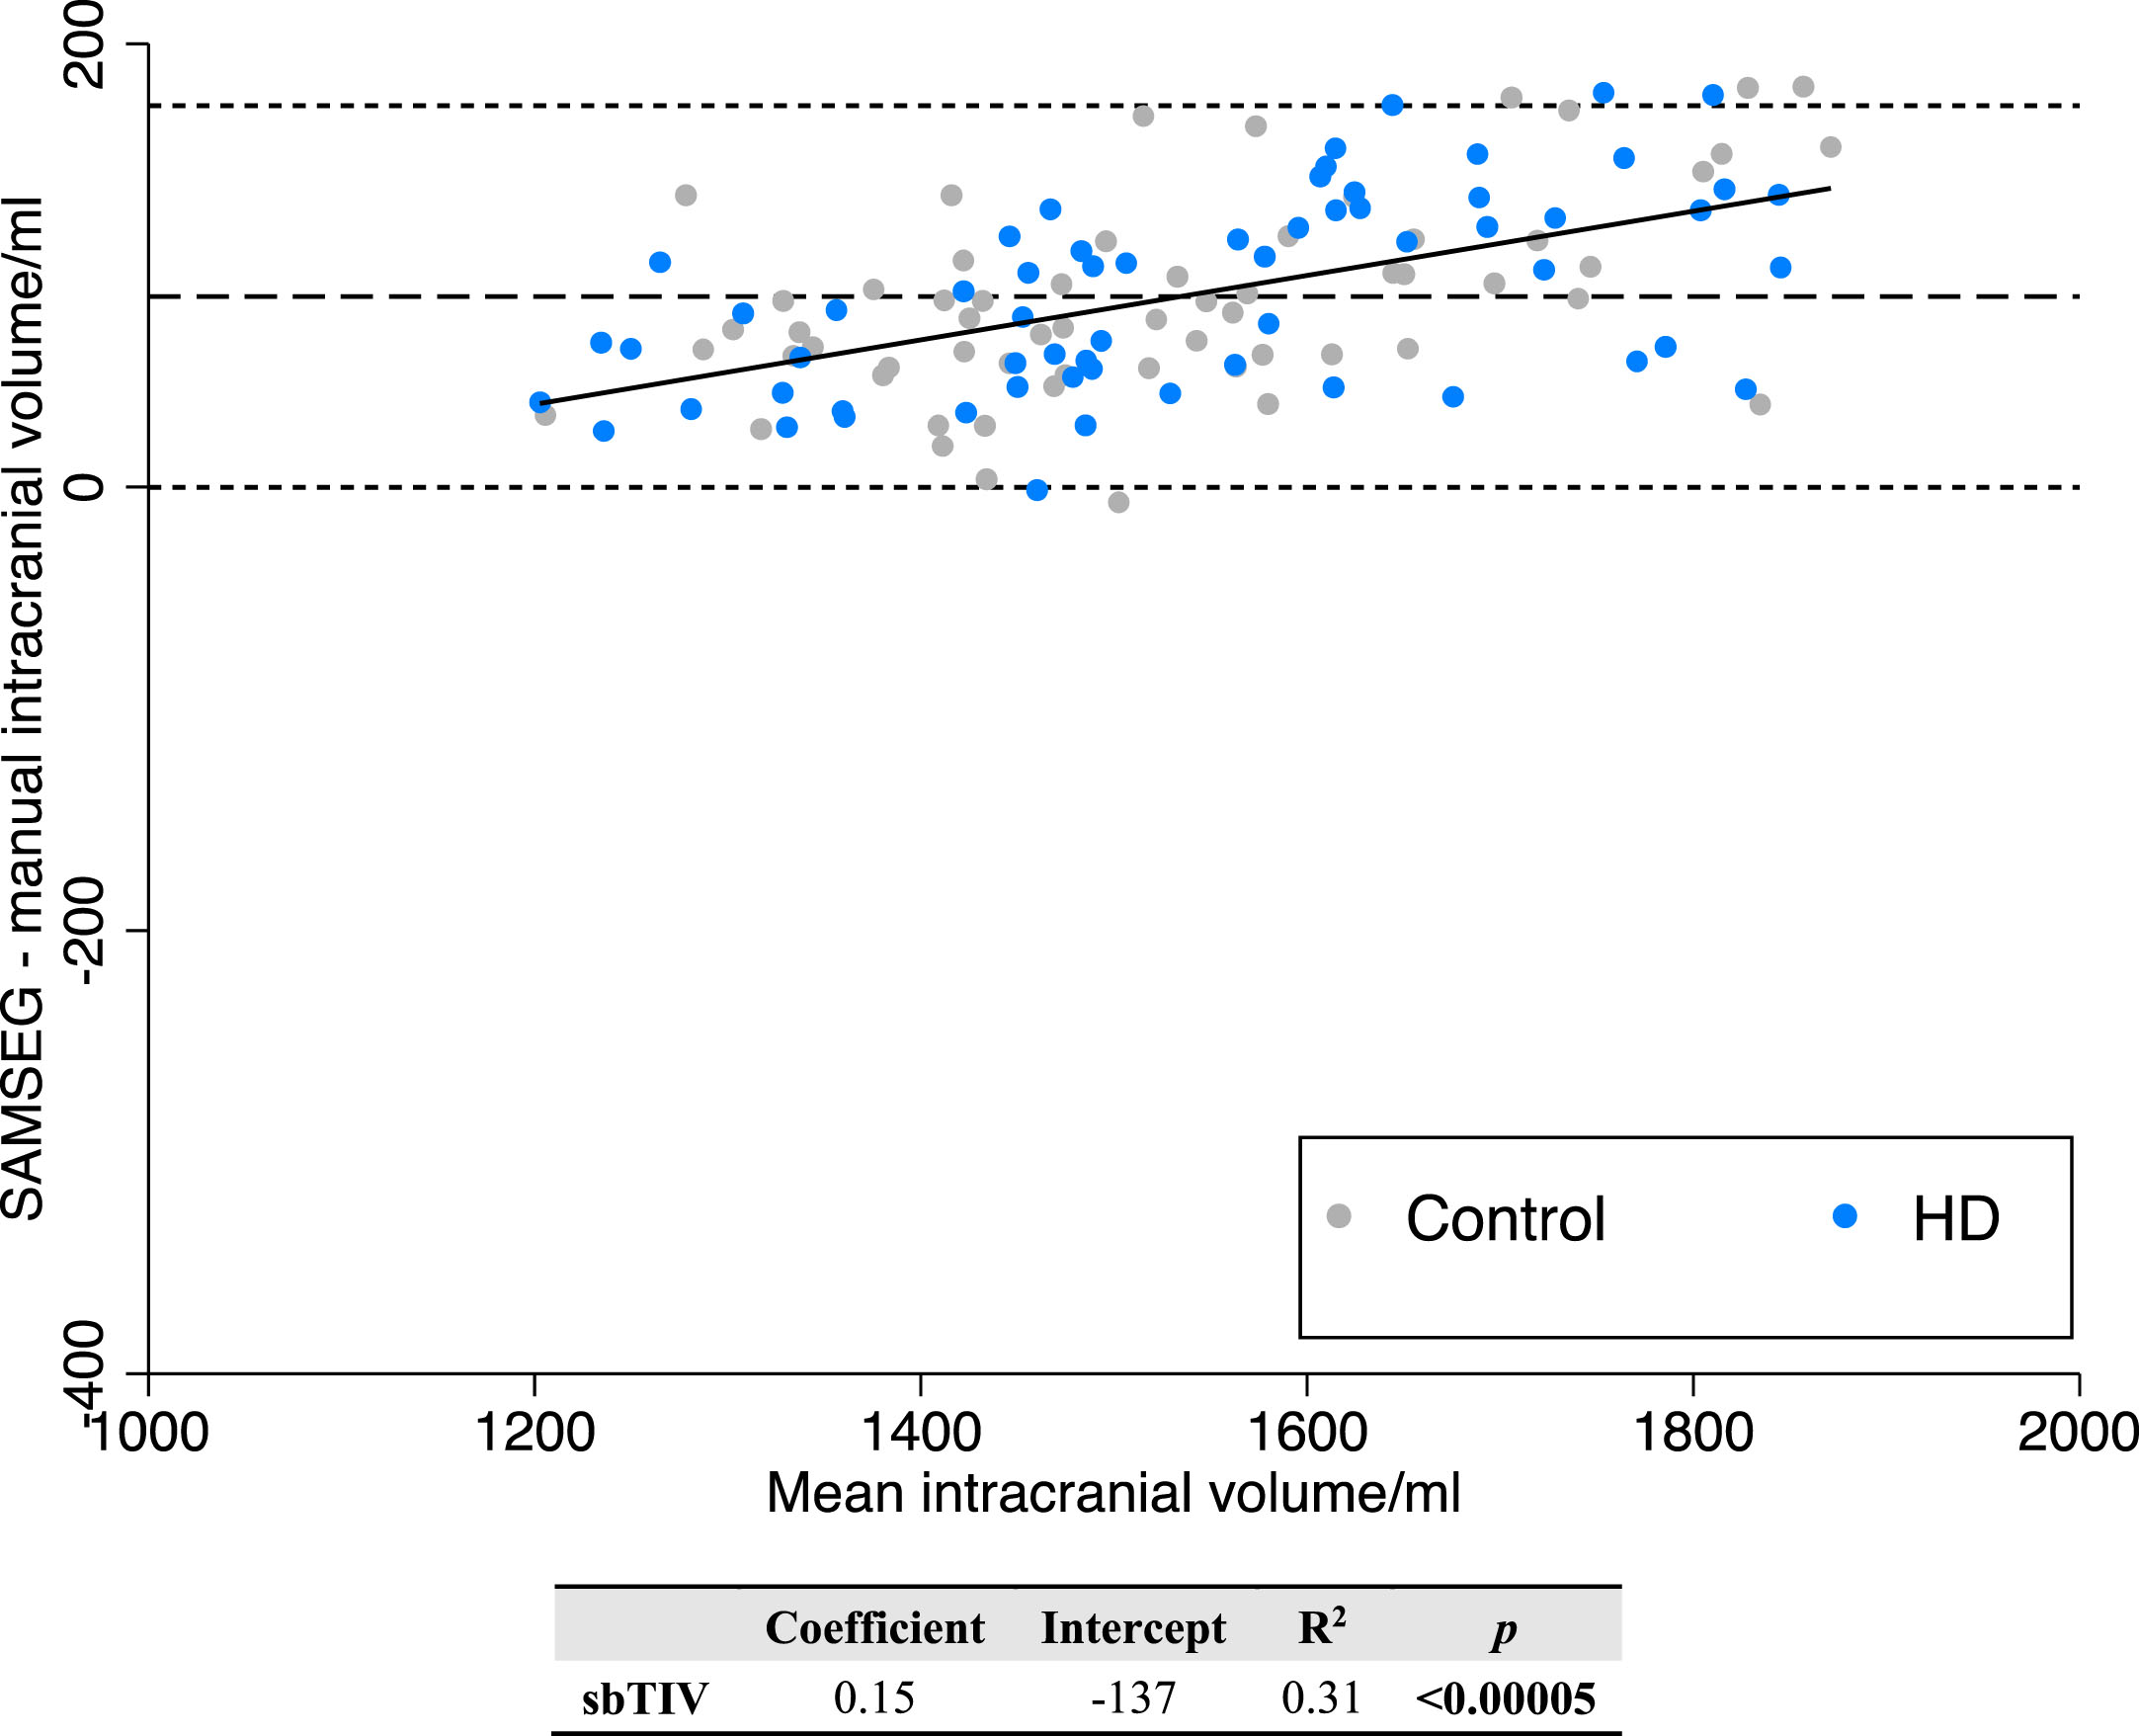
Bland-Altman regression analysis of FS7 SAMSEG sbTICV versus manual TICV.
DISCUSSION
This study highlights the introduction of volumetric differences dependent on segmentation methods and software versions. When applied to a cohort of far from predicted clinical onset HD participants, caudate and putamen volumes, as well as intracranial volumes, varied greatly between FS versions. This has implications for the newly developed HD-ISS and likely impacts other neurodegenerative conditions employing automated volumetric techniques.
Quality control of segmentations
Both FS6 and FS7 displayed bilateral and systematic expansion of the putamen into the overlying claustrum. While the most severe examples were excluded as QC failures, this error was present in all segmentations to varying degrees. The error occurs where the inferior-posterior putamen appears to touch the claustrum, making the structures difficult to distinguish visually on T1-weighted MRI, and has been described previously in healthy participants [24] and HIV-infected individuals [25]. FS version 7.3.0 (released July 2022) includes two ‘bug-fixes’ which may help improve the putamen error [4]. This includes the ability to force white matter between the putamen and overlying cortex, and the improvement of white matter surface placement in the inferior frontal area near the putamen.
Unlike FS6, no FS7 segmentations failed QC for undersegmentation of the right caudate head, representing an improvement in the accuracy of the FS7 segmentation. In contrast to putamen extension, this error was sporadic for FS6, with all examples excluded during QC.
Comparison of volumes between FS6 and FS7
Analysis of similarities
Analysis of the relationships between FS6 and FS7 volumes identified high ICCs throughout. Interestingly, while ICCs for raw volumes were consistent between preHD and control participants, values for cTICV were noticeably higher in preHD. The reason for this remains unclear, but it may reflect differences in the accuracy of Talairach registration (during which the cTICV is calculated) for preHD and control participants. No other studies have been performed, to date, comparing FS6 and FS7 caudate, putamen, and cTICV segmentations. However, Bigler et al. compared FS5 and FS6 segmentations of these regions in 249 participants from the Chronic Effects of Neurotrauma Consortium. They found generally lower ICCs, especially for the putamen, than between FS6 and FS7, suggesting a weaker relationships between older versions of FS [3].
Analysis of differences
Assessing the comparability between methods requires analysis of the differences, rather than similarities [22]. Bland-Altman analysis showed FS7 calculated larger raw volumes, and this difference was greater for larger rather than smaller volumes. Contrary to the majority of previous studies [3, 26–30], the comparison between automated segmentation techniques must include cTICV since raw volumes are regularly divided by cTICV to adjust for variation with maximal brain volume. This is also what is required for the HD-ISS. Without doing so, unaccounted for variation exists between automated techniques. FS7 calculated smaller cTICV, and this difference was greater for smaller rather than larger volumes.
Since adjusted volumes are calculated as raw caudate/putamen volume divided by cTICV, these two biases combine to give even greater differences in adjusted volumes. Combining these effects, FS7 calculated larger adjusted volumes, and this difference was greater for larger than smaller volumes, resulting in a greater discrepancy of measurement in participants with larger striatal volumes. The far-from-onset YAS cohort has near normal striatal volumes, contributing to greater discrepancy. Together, these findings highlight the poor reliability between software versions of FS when applied to brains in the early stages of neurodegenerative disease.
cTICV compared to manual segmentation (the ‘gold standard’)
The discrepancy in cTICV measurement was much greater than for raw volumes. To explore the relative contributions of each FS version to this error, a post-hoc analysis was performed comparing cTICV to manual TICV (‘the gold standard’) calculated during the original HD-YAS study. Both versions calculated biased cTICVs: FS6 systematically overestimated; and FS7 overestimated larger, and underestimated smaller.
Previous studies have shown FS5 overestimates cTICV by 5.9% [31] in 399 healthy controls and 3.7% in 288 participants with probable Alzheimer’s disease, compared to manual TICV. Proportional bias descriptions have been variable, with one study showing biphasic proportional bias for larger cTICV [32], comparable to our data, and the other showing monophasic proportional bias for larger cTICV [31]. One study found FS6 overestimated cTICV by 4.0% in 62 participants with mild cognitive impairment, compared to manual [33], although they do not assess proportional bias. No studies were identified comparing FS7 cTICV to manual TICV.
The cTICV error may represent either inaccuracy in the manual TICV of the Talairach atlas, or inaccuracy in the affine Talairach transform, which only crudely approximates brain shape. Alternatively, problems with the FS7 cTICV calculation are described in the Freesurfer Wiki version 7.2.0 release notes [4]. They propose that the cause is erroneous Talairach registration in participants that have been aggressively defaced (face voxels replaced by zeros for anonymization purposes). The findings from this study would suggest this error is more systemic since scans had not been defaced in this study. There is no comment on cTICV errors for version 6, or the version 7.3.0 to be released. A solution may be to use the new FS7 SAMSEG segmentation-based TICV (sbTICV). This calculates TICV from the total segmentation volume, rather than the linear transform during Talairach registration, which we have shown is more accurate in our dataset. Post-hoc comparison to manual TICV suggests the bias from sbTICV is comparable to FS6 cTICV. sbTICV also provides the advantage of being able to undergo visual quality control (unlike cTICV).
Strengths and limitations
YAS images were obtained on the same research dedicated 3T Siemens scanner using the same imaging protocols and an experienced radiographer. Participants were, by definition, far-from-onset without movement symptoms, limiting motion artefacts. This led to particularly high quality sequences and minimized imaging heterogeneity. Participants were also young, which has been shown to reduce scan-rescan variability in caudate and putamen volumes measured using FS [34].
The far-from-onset HD-YAS cohort is appropriately positioned to assess bias between FS versions when detecting early caudate and putamen atrophy. This is useful for assessing how different FS versions will impact HD-ISS staging in the future. However, the confines of this dataset have also resulted in a smaller and less heterogenous sample for comparing FS measurements. Automated segmentation techniques have previously demonstrated greater overlap in controls than HD participants [20, 30]. Near-normal brain volumes may therefore have resulted in closer proximity of measurements than can be expected for participants with more advanced disease. Future studies comparing techniques incorporating larger and more heterogenous samples would address this.
Conclusions
A number of automated segmentation pipelines have been used to determine volumetric change in HD brains, with new pipelines and software versions continuously in development. We now enter a pivotal period for HD research, with multiple ongoing clinical trials of disease modifying therapies. When applied to a cohort of far from predicted clinical onset HD participants, caudate and putamen volumes, as well as intracranial volumes, varied greatly between FS versions. As new software is released, it is crucial that biases are explored because differences have the potential to significantly alter disease staging for stratification and may consequently impact our ability to assess treatment efficacy in future. Specifically, in HD, differences in calculated volumes around the threshold for the HD-ISS Stage 1 cut-off will significantly alter inclusion in clinical trials of preventive disease modifying therapies. Until conversion factors are validated, the HD-ISS must be applied using FS6 to generate caudate and putamen volumes from MRI.
Footnotes
ACKNOWLEDGMENTS
We would like to thank all the study participants for their invaluable contribution to this research.
We would also like to thank the HD-YAS Investigators: Paul Zeun, Katherine Osborne-Crowley, Eileanoir B Johnson, Sarah Gregory, Christopher Parker, Jessica Lowe, Akshay Nair, Marina Papoutsi, Peter McColgan, Carlos Estevez-Fraga, Kate Fayer, Henny Wellington, Filipe B Rodrigues, Lauren M Byrne, Amanda Heslegrave, Harpreet Hyare, Hui Zhang, Edward J Wild, Geraint Rees (University College London); Claire O’Callaghan, Christelle Langley, Trevor W Robbins, Barbara J Sahakian (Cambridge University); Douglas Langbehn (University of Iowa).
FUNDING
The HD Young Adult Study is funded by the Wellcome Trust (grant codes 200181/Z/15/Z and 223082/Z/21/Z; SJT is PI and RIS and NZH receive funding from this grant). We also thank the Wellcome Trust Centre for Human Neuroimaging (London, UK) who acquired the MRI scans. Part of this work and funding for SJT was supported by the UK Dementia Research Institute (DRI London UK) which receives its funding from DRI Ltd, funded by the UK Medical Research Council. Some of this work was undertaken at the University College London Hospital/University College London (London UK) supported by the UK’s Department of Health National Institute of Health Biomedical Research Centre (London UK).
CONFLICT OF INTEREST
Sarah J. Tabrizi is an Associate Editor of this journal, but was not involved in the peer-review process nor had access to any information regarding its peer-review.
DATA AVAILABILITY
The data supporting the findings of this study are available on request from the corresponding author. The data are not publicly available due to privacy, ethical restrictions, or other concerns.