
Abstract
Background:
Huntington’s disease (HD) is a neurodegenerative disorder caused by expanded cytosine-adenine-guanine (CAG) repeats in the Huntingtin gene, resulting in the production of mutant huntingtin proteins (mHTT). Previous research has identified urea as a key metabolite elevated in HD animal models and postmortem tissues of HD patients. However, the relationship between disease course and urea elevations, along with the molecular mechanisms responsible for these disturbances remain unknown.
Objective:
To better understand the molecular disturbances and timing of urea cycle metabolism across different stages in HD.
Methods:
We completed a global metabolomic profile of cerebrospinal fluid (CSF) from individuals who were at several stages of disease: pre-manifest (PRE), manifest (MAN), and late manifest (LATE) HD participants, and compared to controls.
Results:
Approximately 500 metabolites were significantly altered in PRE participants compared to controls, although no significant differences in CSF urea or urea metabolites were observed. CSF urea was significantly elevated in LATE participants only. There were no changes in the urea metabolites citrulline, ornithine, and arginine.
Conclusions:
Overall, our study confirms that CSF elevations occur late in the HD course, and these changes may reflect accumulating deficits in cellular energy metabolism.
INTRODUCTION
Huntington’s disease (HD) is caused by an expanded cytosine-adenine-guanine (CAG) repeat in the Huntingtin gene and results in the accumulation of mutant huntingtin protein (mHTT) [1]. The clinical consequences of HD are well-characterized; however, the molecular pathologic process that accounts for disease progression remains unclear. Recent work indicates that mHTT impairs DNA repair, transcriptional and proteomic profile, autophagy, and energy metabolism. Metabolomic studies allow for assessments of the molecular substrates of cell metabolism [2], and are often referred to as the “systematic study of the unique chemical fingerprints that specific cellular processes leave behind”. Metabolomic profiles provide a snapshot of the functional consequences of select variants or disease conditions, in this case, the pathologic process of HD. Recent applications of these methods have identified novel targets for breast cancer and bladder cancer patients [3]. In multiple sclerosis and Parkinson’s disease, these methods have been used to identify novel biomarkers and inform diagnostic criteria [4–6].
Arginine, citrulline, ornithine, and kynurenines are metabolically linked to urea production [7, 8]. In HD, cerebrospinal fluid (CSF) arginine has been reported to increase with disease progression [9]. Metabolomics methods have been applied in HD biofluids to assess kynurenines, a breakdown product of the amino acid tryptophan and a primary producer of the coenzyme nicotinamide adenine dinucleotide [10]. There is strong evidence that the urea cycle and its metabolites are altered in HD. Urea elevation has been previously identified in HD transgenic rodent models, HD transgenic sheep models, and postmortem human brain tissues [11, 12]. This metabolic abnormality is not only found in basal ganglia circuitry, but throughout different regions in the brain [13, 14]. Despite this consistent evidence, the timing at which this metabolic impairment occurs is unclear. There is little information on urea cycle pathology across different stages of the disease and the exact pathophysiologic mechanisms contributing to these elevations in urea. To begin addressing these gaps in knowledge, we utilized an unbiased, untargeted metabolomic approach to measure the level of metabolites through the collection of CSF in pre-manifest (PRE), manifest (MAN), and late manifest (LATE) participants as well as controls. We hypothesized that distinct elevations in urea cycle intermediates may be observed as HD progresses.
MATERIAL AND METHODS
Participant profile
CSF samples were collected from 60 participants as part of the CHDI HD-Clarity study. There were 16 PRE, 16 MAN, and 16 LATE HD participants, and 12 control participants. This study was powered based on predicted differences in essential metal levels, which was the primary objective for these HD-Clarity samples. Interestingly, the observed differences in CSF metal levels in neurological disease states are less robust than differences in CSF urea reported in HD; thus, although this is an ancillary study, it is well-powered [15, 16]. Disease stage was determined using the diagnostic confidence level (DCL), length of CAG expansion, and a metric of disease burden (CAP score), which is calculated from (CAG expansion –35.5) x Age. Control participants were individuals without a known history of HD. All HD participants have a CAG expansion of ≥40. PRE participants were not motor manifest as indicated by a DCL of < 4 and a burden of pathology of > 250. MAN participants had a DCL = 4 and a total functional capacity (TFC) between 7–13. The LATE group had all the above criteria for MAN and a TFC score between 0–6. Cognitive, behavioral symptoms, and motor severity, including the symbol digit modality test (SDMT), Stroop Word Reading (SWR), total functional capacity (TFC), total motor score (TMS), and the recently developed Composite Unified Huntington’s Disease Rating Scale (cUHDRS) scores were also evaluated [17].
These samples were provided by CHDI as de-identified samples with select pieces of medical and clinical information which did not pose additional risk for participant identification. The molecular work outlined in this manuscript was approved by the Vanderbilt University Medical Center Internal Review Board (IRB# 191615) and adhered to all relevant guidelines and regulations. Informed consent was obtained at each HD-Clarity study site prior to conducting any study procedures performed in accordance with the Declaration of Helsinki.
Metabolomic analyses
Optima grade liquid chromatography-mass spectroscopy (LC-MS) solvents and chemicals for the mass spectrometry analyses were obtained from Thermo Fisher Scientific (Thermo Fisher Scientific, Waltham, MA).
CSF samples collected were flash frozen and stored at –80°C until analyzed via Liquid Chromatography-High Resolution Mass Spectrometry (LC-HRMS and LC-HRMS/MS)-based metabolomics in the Vanderbilt Center for Innovative Technology (CIT) using a previously described method [18–20]. Briefly, equal volumes (100μL) of previously frozen CSF were diluted with 100μL ice-cold lysis buffer (1:1:2, Acetonitrile:MeOH:Ammonium Bicarbonate 0.1M, pH 8.0, LC-MS grade). Isotopically labeled phenylalanine-D8 and biotin-D2 were added to individual samples prior to protein precipitation and 800μL of ice-cold methanol was added. Following overnight incubation at –80°C, precipitated proteins were pelleted by centrifugation at 10,000 rpm for 10 min and metabolite extracts were dried down in vacuo and stored at –80°C until reconstitution prior to MS analysis.
Prior to mass spectrometry analysis, individual extracts were reconstituted in 60μl of acetonitrile/ water (80:20, v/v) containing isotopically labeled standards, carnitine-D9, tryptophan-D3, valine-D8, and inosine-4N15, and centrifuged for 5 min at 10,000 rpm to remove insoluble material. A pooled quality control sample (QC) was prepared by pooling equal volumes of individual CSF samples; the pooled QC sample was extracted in parallel with the individual samples. The pooled QC sample was used for column conditioning (10 injections prior to sample analysis) and retention time alignment. Mass spectrometry instrument reproducibility (1 injection every 5 sample injections) throughout the sample set was assessed and sample acceptance was determined.
Global, untargeted mass spectrometry analyses were performed on a high-resolution Q-Exactive HF hybrid quadrupole-Orbitrap mass spectrometer (Thermo Fisher Scientific, Bremen, Germany) equipped with a Vanquish UHPLC binary system (Thermo Fisher Scientific, Bremen, Germany). CSF extracts (5μL injection volume) were separated on an ACQUITY UPLC BEH Amide HILIC 1.7μm, 2.1×100 mm column (Waters Corporation, Milford, MA) held at 30°C as previously described [21, 22]. Liquid chromatography was performed at 200μL min–1 using solvent A (5 mM ammonium formate in 90% water, 10% acetonitrile, and 0.1% formic acid) and solvent B (5 mM ammonium formate in 90% acetonitrile, 10% water, and 0.1% formic acid) with a gradient length of 30 min.
Full MS analyses were acquired over the mass-to-charge ratio (m/z) range of 70–1,050 in positive ion mode. Full mass scan was acquired at 120,000 resolution with a scan rate of 3.5 Hz, automatic gain control (AGC) target of 1x10⁶, and maximum ion injection time of 100 ms, and MS/MS spectra were collected at 15,000 resolution, AGC target of 2×10⁵ ions, with a maximum ion injection time of 100 ms.
Statistics and pathway analysis, metabolomics data processing
Power calculations
The sample size for this study was determined based upon a power analysis for a previous study using the same biological samples, where the primary endpoint was changes in essential metal levels [12]. Power calculations for the primary study determined that 16 PRE, 16 MAN, 16 LATE HD participants, and 12 control participants were sufficient to detect differences in CSF metal levels [15]. These power calculations were used in contrast to a pilot CSF HD metabolomic study which only analyzed samples from 12 participants at different stages of disease [9].
Metabolomics processing
Mass spectrometry raw data was imported, processed, normalized, and reviewed using Progenesis QI v.3.0 (Non-linear Dynamics, Newcastle, UK). All MS and MS/MS sample runs were aligned against a pooled QC reference run. Unique ions (retention time and m/z pairs) were de-adducted and de-isotoped to generate unique “features” (retention time and m/z pairs). Significantly differentially expressed metabolites were determined based upon p≤0.05. After an outlier analysis (the ROUT (
Tentative and putative annotations were determined by using accurate mass measurements (<5 ppm error), isotope distribution similarity, and fragmentation spectrum matching (when applicable) by searching the Human Metabolome Database (HMDB[GC1]) [23], METLIN[GC2] [24], and the CIT’s in-house library. Annotations (Level 1–3[GC3]) [25] were determined for all significant compounds (p-value≤0.05) with a match to any of the searched libraries or databases.
Metaboanalyst 4.0 (www.metaboanalyst.ca/) was used to perform pathway and metabolite enrichment analyses from annotated compounds with statistical significance (p≤0.05) between genotype and disease stage [26]. Compounds included in the pathway analysis were selected based upon the significance of between-group comparisons, and there was no expression threshold for the number of samples within a particular group. Briefly, MetaboAnalyst assigns a pathway impact factor which reflects the location of an enriched compound within that particular metabolic pathway and its impact on the downstream targets. Negative log p-values were calculated based upon the number of observed compounds detected by LC-HRMS/MS within a particular metabolic pathway compared to the expected number of compounds known to be present in that pathway. The complete, de-identified raw data file for metabolomics can be found in the Metabolomics Workbench, https://www.metabolomicsworkbench.org under the assigned Project ID (PR001333).
RESULTS
Clinical demographics
The clinical profile of participants in this cohort has been previously reported in a study on metal homeostasis [12] and is also summarized here in Table 1. PRE participants were significantly younger than control and MAN participants. The ratio of males to females did not significantly differ across each study group. As expected, the average motor score significantly increases across HD groups: PRE, MAN, and LATE participants as shown in Table 1.
Participant characteristics
Differences in baseline demographic variables are identified using 1 way-ANOVA with post-hoc testing using p < 0.05. Participant age, sex, the number of trinucleotide repeat length (CAG), total functional capacity (TFC), symbol digit modality test (SDMT), stroop word reading (SWR), total motor score (TMS), and the Composite Unified Huntington’s Disease Rating Scale (cUHDRS) scores are reported as mean±S.D. Values that do not significantly differ from each other share the same superscript. Data from this table has been previously reported in a study on metal homeostasis in HD [12].
Metabolomic profile
We identified various metabolites that were differentially abundant in PRE, MAN, and LATE participants compared to controls. There were 2,571 different metabolic compounds detectable in CSF samples (Table 2). There was a robust effect of genotype on the metabolomic profile. The comparison between control and PRE participants identified 516 significantly different compounds: 355 of those were increased in abundance and 161 of those were decreased in abundance (p≤0.05) (Fig. 1A). The comparison between control and MAN participants identified 185 significantly different compounds: 91 of those were increased in abundance and 94 of those were decreased in abundance (p≤0.05) (Fig. 1B). The comparison between control and LATE participants identified 481 significantly different compounds: 284 of those were increased in abundance and 197 of those were decreased in abundance (p≤0.05) (Fig. 1C). A total of 38 metabolites were altered across all stages of HD (Fig. 1D).
Differentially Abundant Metabolites Across Stages of HD
Differences in expressed metabolite relative abundances in the cerebrospinal fluid of control and HD participants. Pairwise comparisons were made between controls and PRE, MAN, and LATE participants.
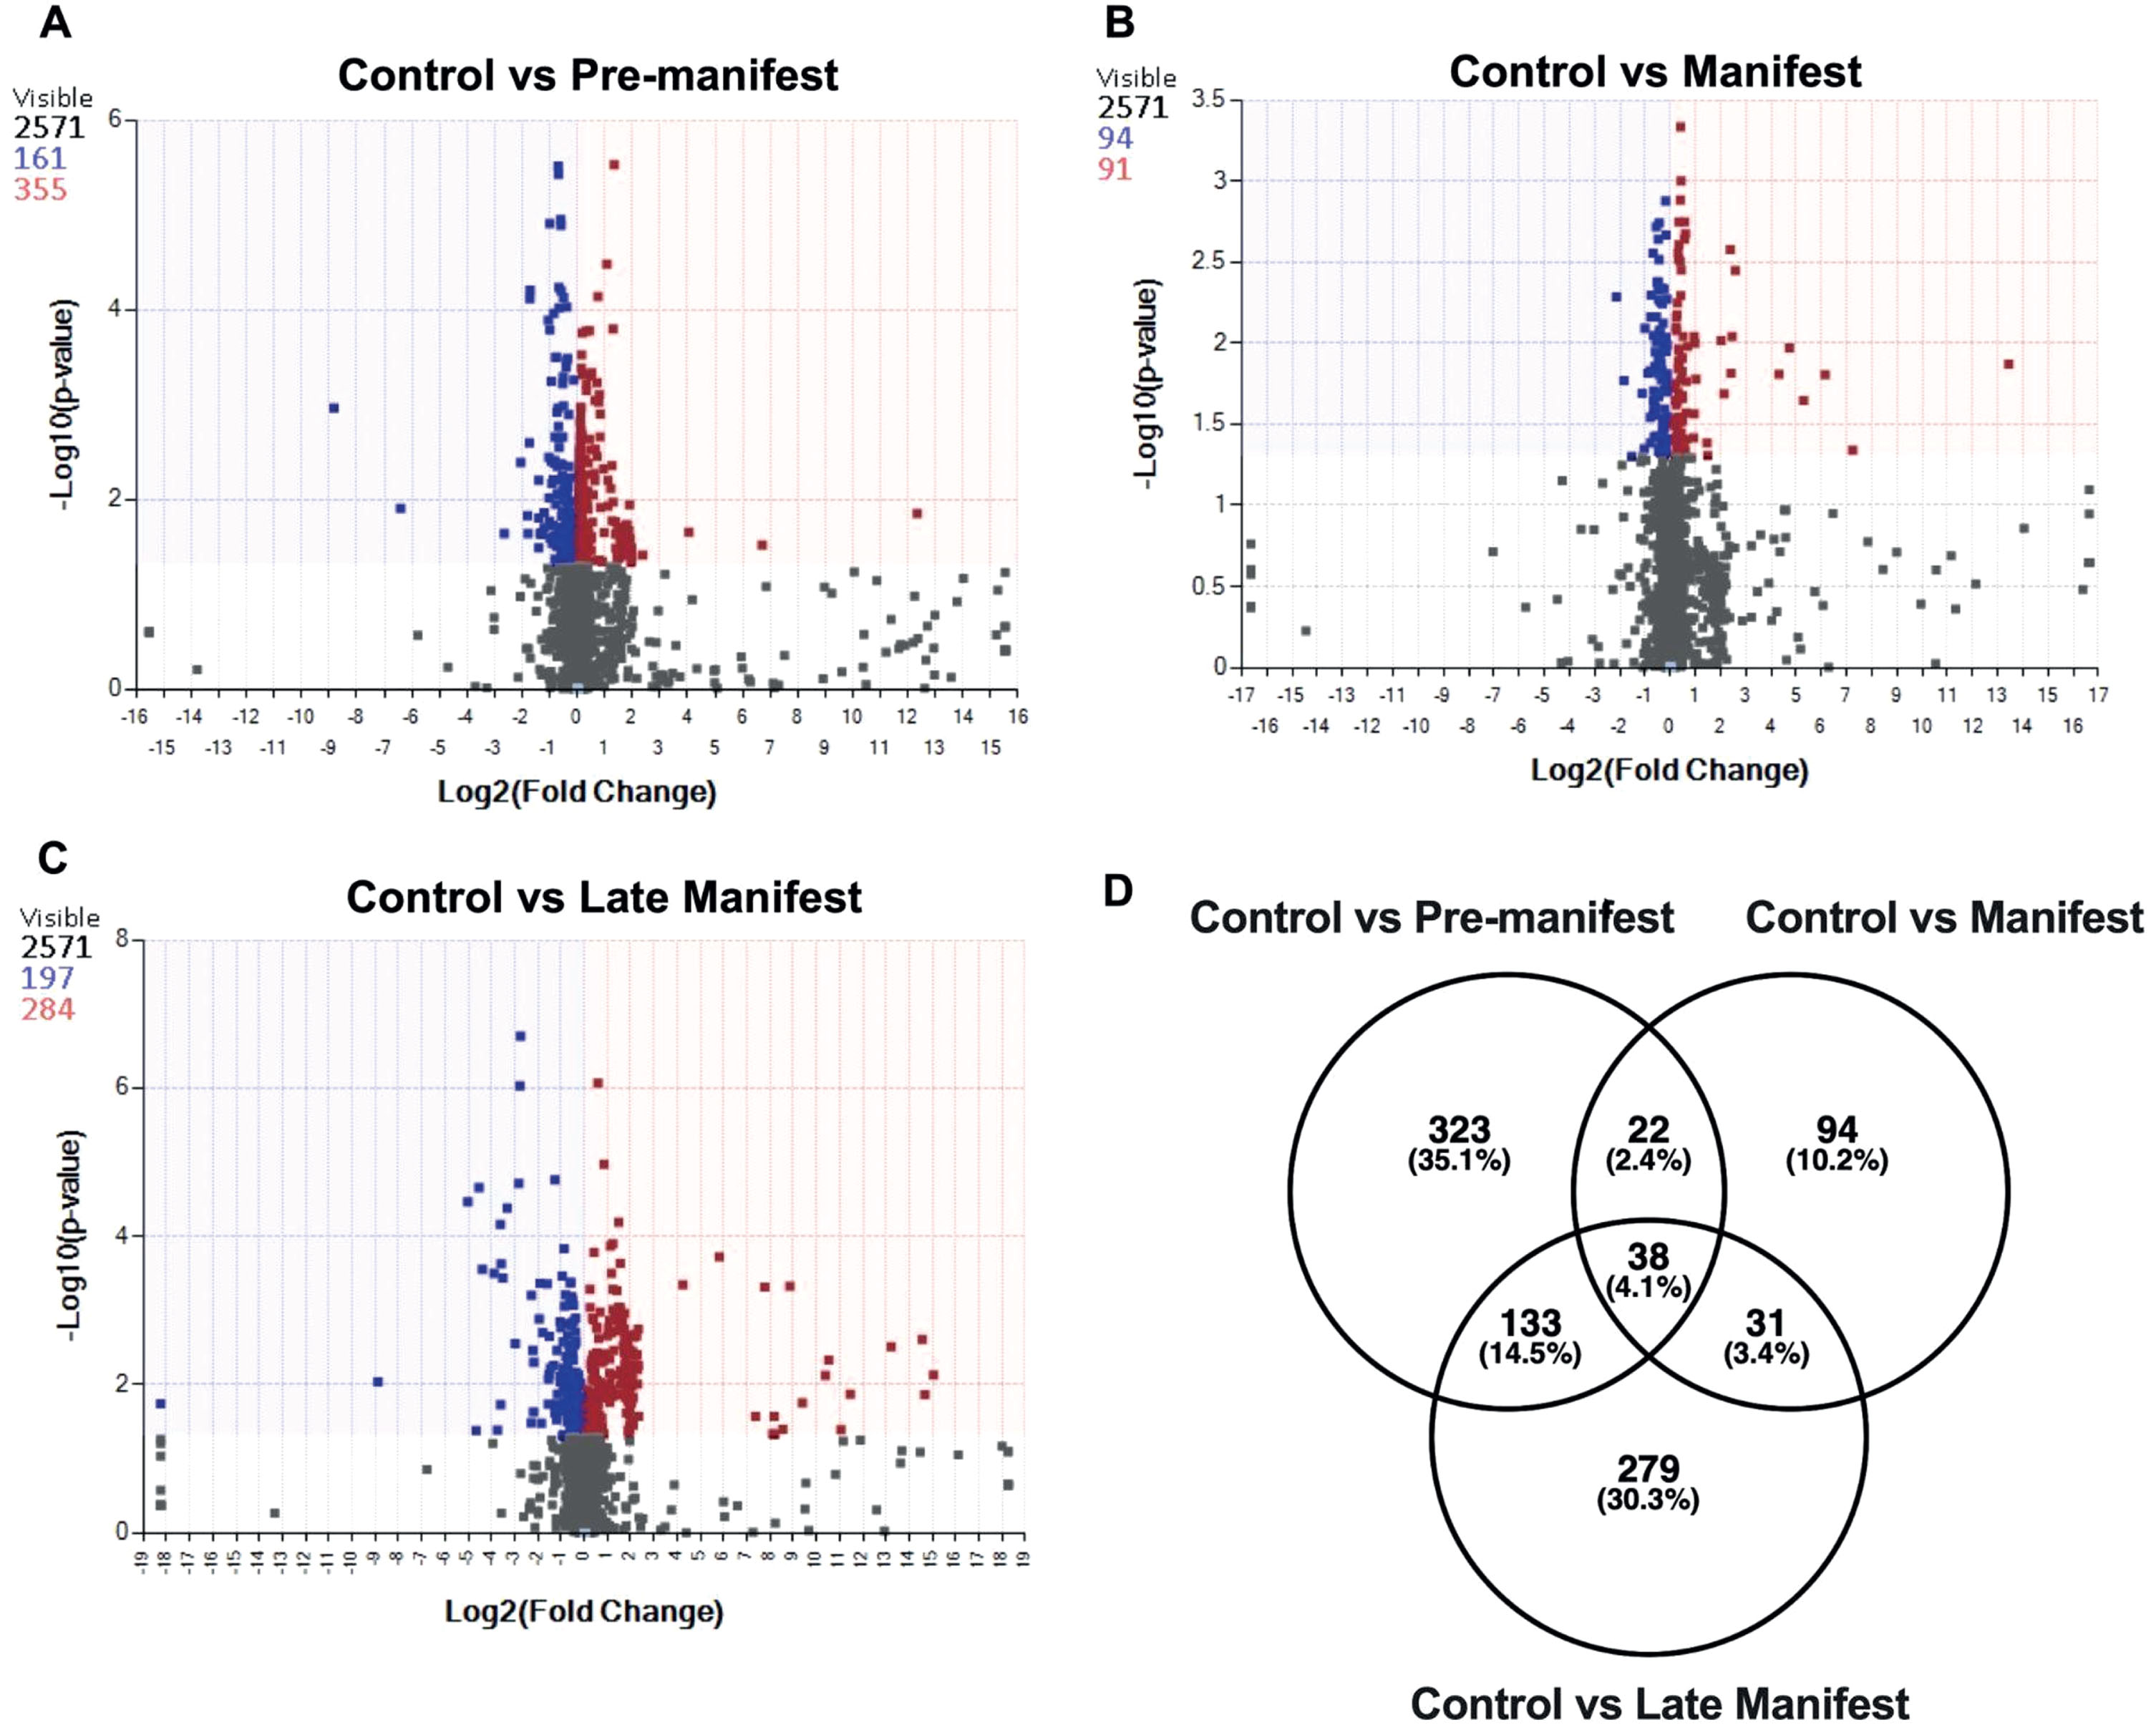
CSF metabolomic profile in controls and HD. The volcano plots show the distribution of metabolites based on pairwise comparison (significance criteria for p-value difference only). p-values are based on mean difference and variance across the number of sample replicates and are generated using ANOVA (analysis of variance). Differences between (A) control vs. PRE participants and (B) control vs. MAN participants and (C) control vs. LATE participants. Additionally, a Venn diagram (D) is utilized to display the overlap in the number (and percentage) of metabolites across group comparisons: control vs. pre-manifest, control vs. manifest and control vs. late manifest. The total number of features that met significance criteria for each pairwise comparisons, are colored blue (negative fold change compared to controls) or red (positive fold change compared to controls), the shading/colored regions represent p-values≤0.05.
Biochemical pathway analyses revealed select metabolic pathways enriched in different stages of HD progression: Control vs. PRE, Control vs. MAN, and Control vs. LATE (Table 3). Using the metabolomic profile, we observed that the top pathways enriched were related to urea cycle/amino group metabolism in control vs. PRE participants and control vs. MAN participants. Interestingly, urea cycle/amino group metabolism was not identified as one of the top pathways in controls vs. LATE pairwise comparison. Based upon the findings that urea cycle metabolism was altered early in the disease, we investigated the 21 and 18 compounds related to urea cycle metabolism in PRE and MAN participants. The 18 compounds altered in MAN participants overlapped with those 21 observed in PRE participants. Eight of these compounds were not expressed in any study group; however, are included in Table 4 for transparency. Surprisingly, a pairwise comparison did not identify any significant differences in these metabolites between Control and PRE participants (Table 4). We hypothesized that these findings were primarily because the identified metabolites were indirect contributors to the urea cycle (i.e., it did not include the primary metabolites associated with urea synthesis and recycling). As such, we next measured those specific compounds: arginine, citrulline, ornithine, and urea in the CSF of HD participants (Fig. 2).
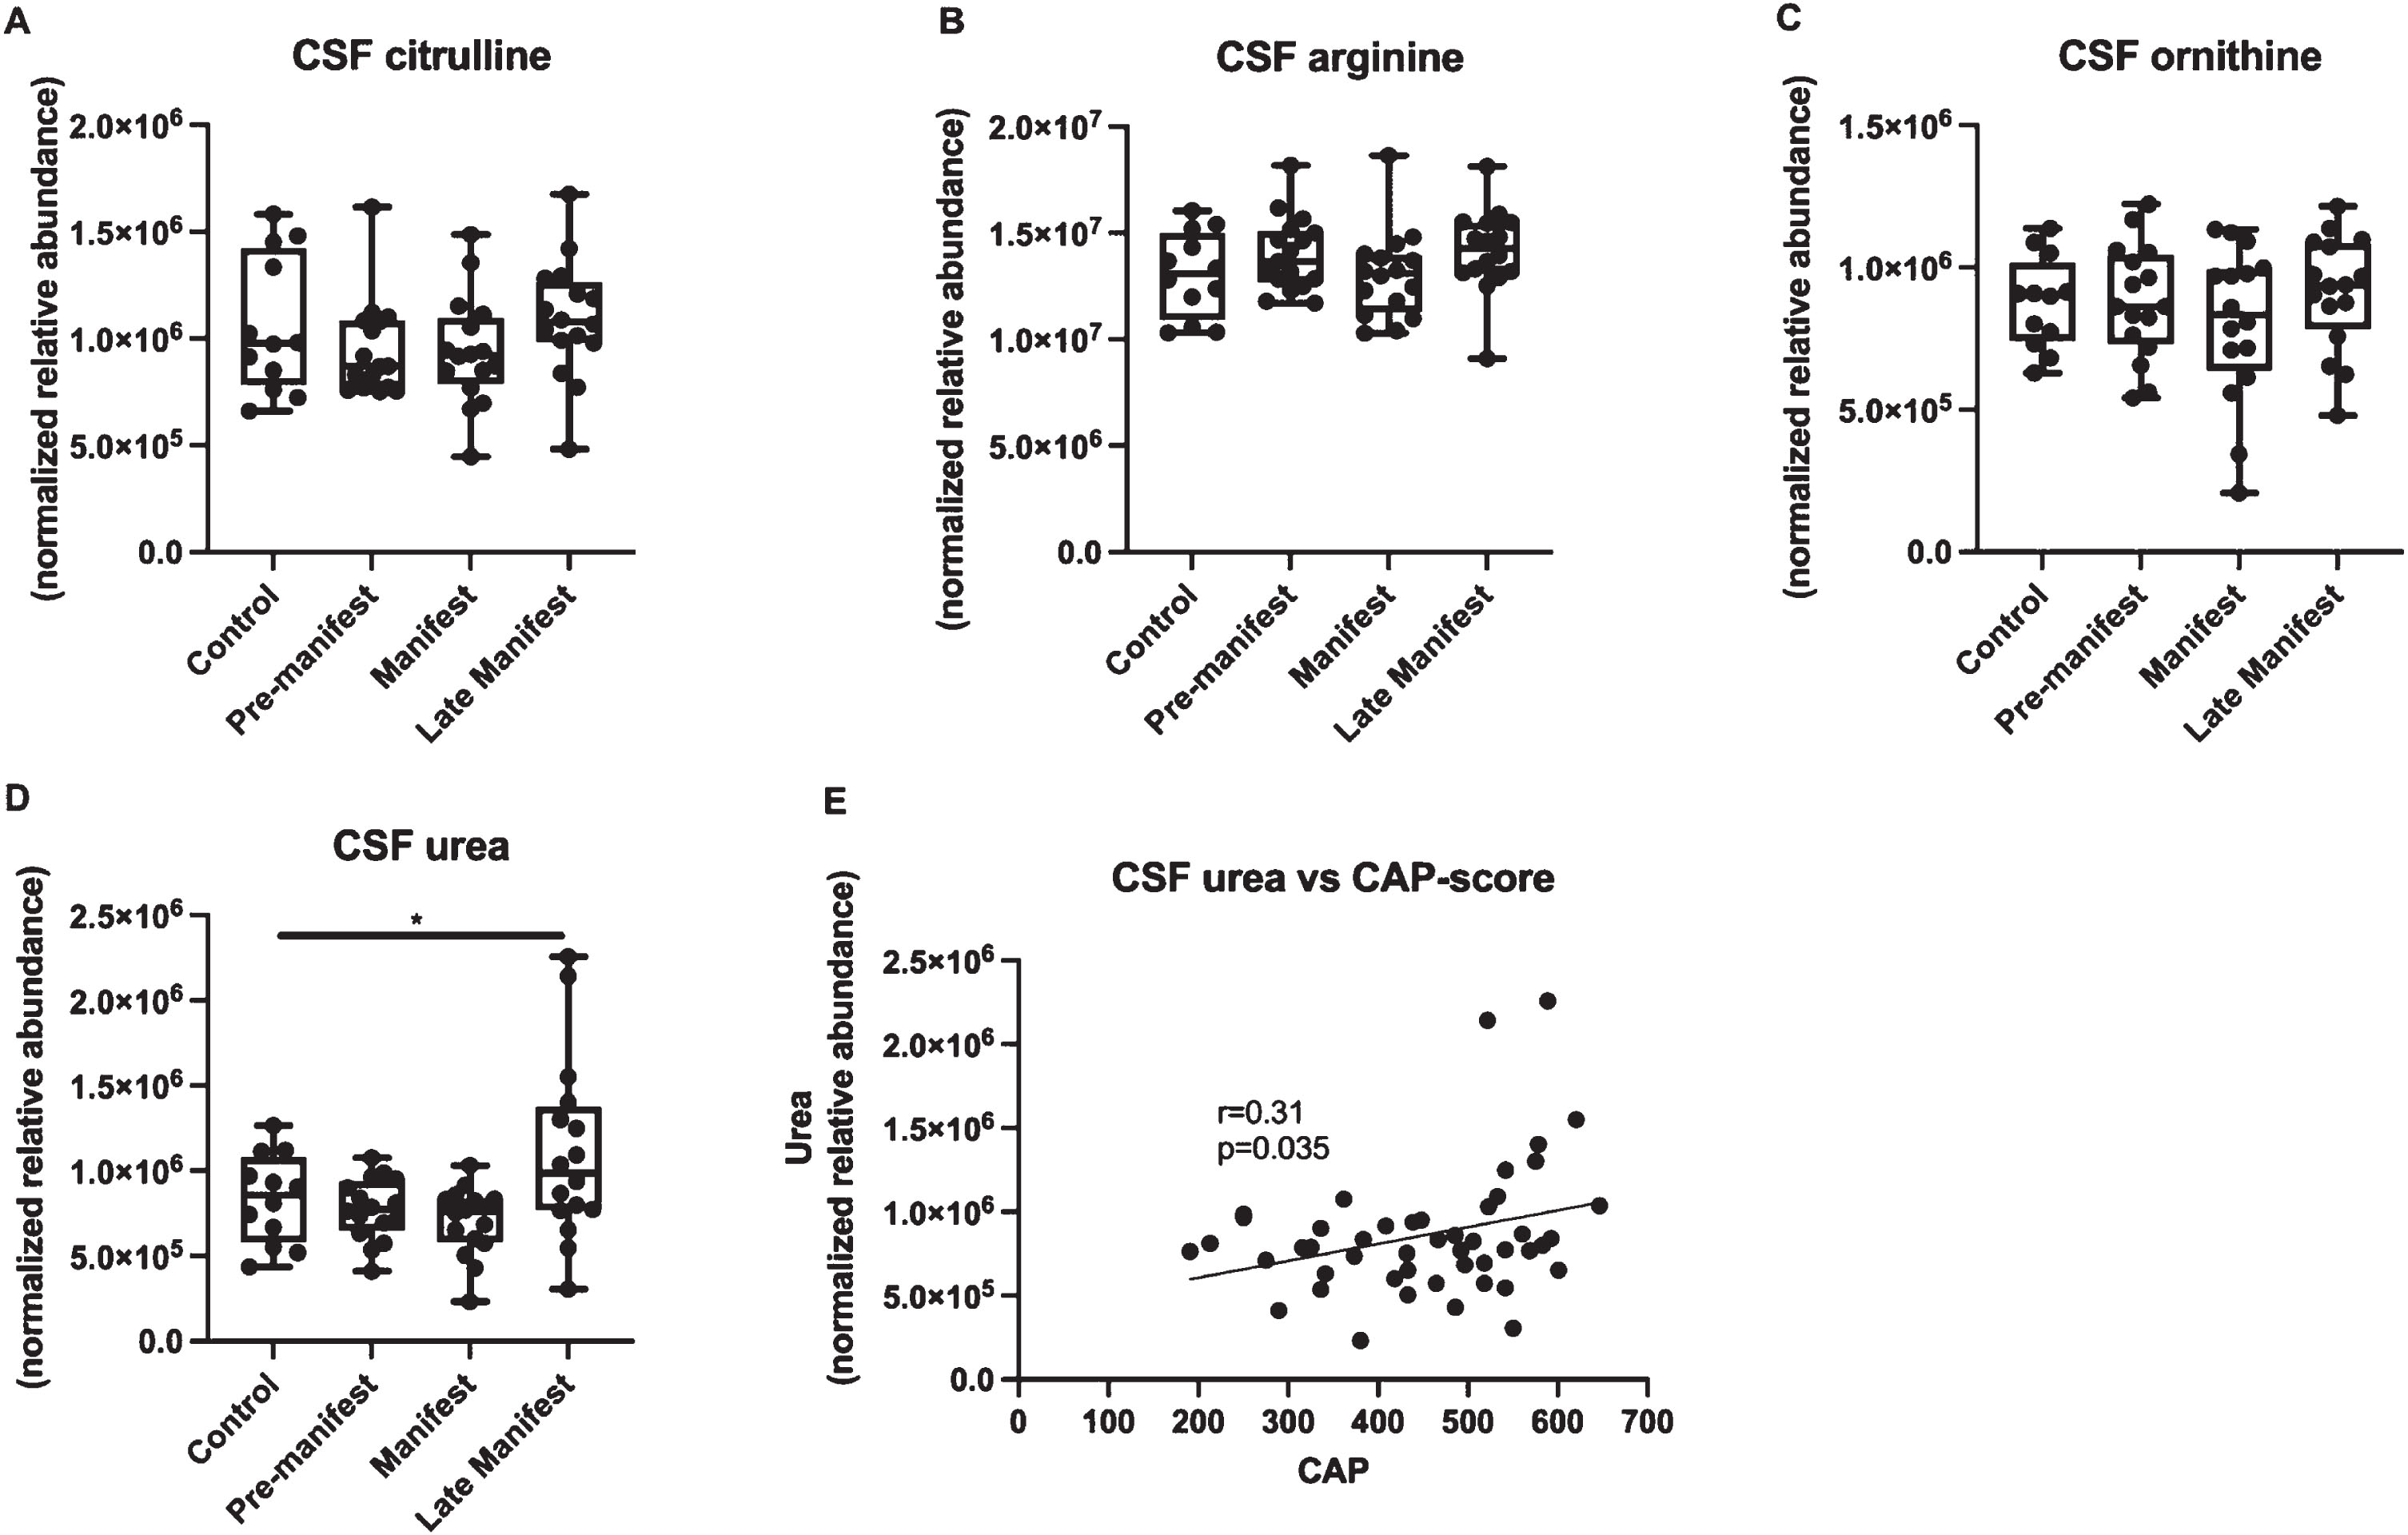
CSF urea cycle metabolite abundance levels between control and HD participants at different stages of disease. CSF (A) citrulline, (B) arginine, (C) ornithine, and (D) urea levels are shown as mean±min and max. An asterisk indicates a p-value < 0.05. Correlations between CSF urea and (E) CAP-score.
Pairwise comparisons between controls and PRE, MAN, and LATE participants identified the top 5 pathways enriched in CSF metabolome
Top 5 metabolic pathways enriched in pairwise comparisons between Control and HD groups. “N” indicates the number of participants in each comparison and “n” indicates the number of enriched metabolites for a particular biochemical pathway.
Expression of Urea Cycle Related Metabolites in HD CSF
Metabolites associated with “Urea cycle/Amino acid metabolism” in both PRE and MAN participants from the biochemical pathway analysis. Data is shown as the average relative abundance (avg) and standard deviation (SD). Metabolites with “N/A” indicate no detectable expression. p-value is reported for only the controls and PRE group comparison.
An assessment of the four urea cycle intermediates directly associated with urea synthesis across disease stages found no significant alterations between control and PRE or MAN participants (Fig. 2). We did observe a significant elevation in CSF urea in LATE participants compared to controls (Fig. 2D). We also observed a significant positive correlation between CSF urea and CAP-score (Fig. 2E).
DISCUSSION
Our study of the CSF metabolome across different stages of HD found several hundred metabolites altered compared to controls. Interestingly, we observed a relatively large number of metabolites altered in pre-manifest and late manifest individuals compared to individuals at mid-stage disease. We speculate that the changes in the number of metabolites altered across disease may reflect molecular compensatory mechanisms that become activated by mutant Huntingtin with disease progression.
Impairments in urea cycle metabolism have been implicated in several stages in HD [8, 28]. Urea is elevated in late-stage disease and in post-mortem tissue across several brain regions [16]. Animal models also demonstrate elevations in urea metabolites such as arginine, citrulline, and ornithine in early-stage disease [8, 27], although it is unclear when these changes occur in humans and if these can be measurable in CSF. A recent cross-sectional study in CSF in HD also found some evidence that arginine was elevated and correlated with measures of disease severity [9]. Because this study does not report absolute values for these metabolites, we are unable to relate these metabolites to those analyzed in our study. Given the strong premise of elevated urea established in transgenic rodent models, and our previous work demonstrating changes in essential metal levels in the CSF early in disease, we hypothesized that increases in urea cycle metabolites would occur early in HD—#x2014;#x2014;prior to motor symptom onset (i.e., pre-manifest). Instead, we observed changes in only CSF urea and this change occurred later in disease, which is consistent with data from post-mortem tissue [16]. However, we cannot preclude the possibility that urea is elevated in post-mortem tissue from earlier-stage HD patients, as this tissue source is not readily available. Additionally, we observed significantly greater variability in urea levels compared to other urea cycle metabolites; however, we found no biological or clinical justification to exclude these values. Surprisingly, we did not identify any significant deficit in the urea cycle metabolites arginine, citrulline, or ornithine. This finding does not replicate studies which noted elevated blood citrulline levels in HD patients and HD transgenic rodent models [28] and reduced striatal arginase enzyme activity in rodent models [8]. Instead, it suggests that pathology in other metabolic pathways earlier in the disease may result in elevations in urea in later stages. Further work is necessary to identify additional biochemical pathways resulting in elevations in CSF urea.
There are several limitations in this study that are important to acknowledge. The first of which relates to the lack of information regarding patients’ current medications. It is possible that some medications may impact the metabolomic profile. Secondly, the metabolomics work was a secondary analysis to the primary study endpoint which was examining levels of essential metal levels in CSF of HD participants. As such, we may have been underpowered to detect subtle changes in metabolomic profile in early pre-manifest disease.
The results of our study provide insights into the timing at which disruptions to urea cycle metabolism occur in HD. Our findings suggest that urea may not be a sensitive and/or specific measure of early disease stage in HD; however, our global metabolomics work reveals that in early-stage disease, there are modest changes in metabolites which regulate urea metabolism. A more in-depth investigation into these biochemical compounds may yield novel biomarkers for pre-motor manifest patients—#x2014;#x2014;to be used in the next phase of clinical trials for HD.
Footnotes
ACKNOWLEDGMENTS
Data used in this work was generously provided by the participants in the Enroll-HD study and made available by CHDI Foundation, Inc. Enroll-HD is a global clinical research platform intended to accelerate progress toward therapeutics for HD; core datasets are collected annually on all research participants as part of this multi-center longitudinal observational study. Enroll-HD is sponsored by CHDI Foundation, Inc., a non-profit biomedical research organization exclusively dedicated to developing therapeutics for HD. Enroll-HD would not be possible without the vital contribution of the research participants and their families. Data used in this work would not be possible without the vital contribution of the research participants and their families in the HD-Clarity and HD-CSF studies. HD-Clarity and HD-CSF are cerebrospinal fluid collection initiatives designed to facilitate therapeutic development for HD. HD-Clarity and HD-CSF are led by Dr. Edward Wild and sponsored by University College London. HD-Clarity is funded by CHDI Foundation, Inc., a non-profit biomedical research organization exclusively dedicated to developing therapeutics that will substantially improve the lives of those affected by HD.
FUNDING
The Medical Research Council UK (MR/M008592/1) funded HD-CSF. The work outlined in this manuscript project was supported by CTSA award No. UL1 TR002243 from the National Center for Advancing Translational Sciences. This work was supported in part using the resources of the Center for Innovative Technology (CIT) at Vanderbilt University (J.A.M) and R03NS125243 (S.D.S). Its contents are solely the responsibility of the authors and do not necessarily represent official views of the National Center for Advancing Translational Sciences or the National Institutes of Health.
CONFLICT OF INTEREST
The authors have no conflict of interest to report.