
Abstract
Background:
In recent years the functions of astrocytes have shifted from conventional supportive roles to also include active roles in altering synapses and engulfment of cellular debris. Recent studies have implicated astrocytes in both protective and pathogenic roles impacting Huntington’s disease (HD) progression.
Objective:
The goal of this study is to determine if phagocytosis of cellular debris is compromised in HD striatal astrocytes.
Methods:
Primary adult astrocytes were derived from two HD mouse models; the fast-progressing R6/2 and slower progressing Q175. With the use of laser nanosurgery, a single astrocyte was lysed within an astrocyte network. The phagocytic response of astrocytes was observed with phase contrast and by fluorescence microscopy for GFP-LC3 transiently transfected cells.
Results:
Astrocyte phagocytosis was significantly diminished in primary astrocytes, consistent with the progression of HD in R6/2 and Q175 mouse models. This was defined by the number of astrocytes responding via phagocytosis and by the average number of vesicles formed per cell. GFP-LC3 was found to increasingly localize to phagocytic vesicles over a 20-min imaging period, but not in HD mice, suggesting the involvement of LC3 in astrocyte phagocytosis.
Conclusion:
We demonstrate a progressive decrease in LC3-associated phagocytosis in HD mouse striatal astrocytes.
INTRODUCTION
Huntington’s disease (HD) is an autosomal dominant neurodegenerative disorder caused by expansion of a CAG repeat within the huntingtin gene encoding a polyglutamine repeat within the huntingtin (HTT) protein [1]. Forty or more glutamine residues within this repeat results in disease and is associated with accumulation of mutant HTT (mHTT), dysfunction of multiple cell types in the brain and neurodegeneration. The most overt alterations are observed within the striatum, with the loss of GABAergic medium spiny neurons [2]. Clinical symptoms include motor impairment, often chorea, and cognitive and psychiatric decline [2–4]. There is presently no disease modifying treatment for HD.
Role of astrocytes in HD
In 1985, astrocytes were implicated in the progression of HD, where increased numbers of reactive astrocytes were observed within postmortem HD brain tissue [2]. Additional changes within astrocytes include the aggregation of mHTT and the downregulation of glutamate transporters [5–8], potassium channels [9, 10], and altered calcium metabolism [11]. Studies of genetically engineered mouse models continue to build evidence that astrocytes are an important contributor to HD progression [12] and there is a progressive decline of normal gene expression and function of astrocytes in HD mice and human brain [13, 14]. Reduction of mHTT in astrocytes slowed disease progression in the BACHD conditional HD mouse model [15]. Benraiss et al. expressed mHTT in glia of wild type mice and observed HD-like phenotypes, suggesting specific astrocyte cell intrinsic responses to mHTT that may contribute to disease [16]. Further, this group demonstrated that transplantation of normal glia can slow the progression of the HD phenotype in R6/2 mice. However, our understanding of the functional changes that may occur within astrocytes is more limited [17]. Our results provide further understanding of how mHTT may impact normal astrocyte function and contribute to HD pathogenesis.
We recently reported the ability to image astrocytes as they initiate phagocytosis of neighboring lysed cells [18, 19]. Other studies also show that phagocytosis is an important function of normal astrocytes and reactive astrocyte responses, and qualify astrocytes as an active phagocyte in the CNS [20]. The goal of this study was to evaluate whether there are functional changes in the phagocytic response of HD astrocytes, and we found that primary astrocytes obtained from two different HD mouse models show progressively reduced phagocytic responses.
MATERIALS AND METHODS
Mouse procedures
All experimental procedures were in accordance with the Guide for the Care and Use of Laboratory Animals of the NIH and animal protocols were approved by the Institutional Animal Care and Use Committee at the University of California Irvine (UCI), an AAALAC accredited institution.
Primary astrocyte cultures
Primary cultures from R6/2 and zQ175 mice, hereafter designated Q175, were carried out as described [21]. Briefly, striatal tissue was collected in dissection solution (HBSS, 10 mM HEPES, 1 mM Na pyruvate, 0.6% sucrose, 1x AA (Antibiotic-antimycotic) and trypsinized in 0.25% Trypsin and 0.75 ml of DNaseI (10 mg/mL) in dissection buffer (HBSS,10 mM HEPES,1 mM Na pyruvate, 0.6% sucrose, 1x AA (Antibiotic-antimycotic) at 37°C for 30 min and triturated every 10 min. Tissue was passed through a 70μm cell strainer, and filtrate centrifuged at 500 g, for 5 min at 4°C. Debris and RBCs were removed using Miltenyi adult brain dissociation kit for mouse and rat (cat. 130-107-677) with gentleMACS Dissociator and Miltenyi protocol for debris and RBC removal. Pellets were resuspended in primary adult astrocyte growth medium (MEM, 20% FBS, 1xAA, 0.6% sucrose, 10 mM HEPES, 1 mM Na Pyruvate, 10μM FSK, 10 ng/ml GDNF, 1xB27, 1xN2). 50,000 cells were plated on 35 mm glass bottom dishes, pre-coated with gelatin and Matrigel on the glass area. Cells were cultured at 37°C in a 95% air and 5% CO2 incubator with feedings every other day. Cells were cultured for a minimum of 5 days prior to microscopy.
Transfection protocol
On DIV7, primary astrocytes (3-month Q175) were transfected with 1μg of the plasmids, pDEST-GFP-LC3B1 or pDEST-GFP, with 2μL of Lipofectamine 2000 (Invitrogen) in 100μL of OptiMEM and incubated for 48 h prior to imaging.
Image acquisition
A Zeiss inverted 200M microscope paired with a Hamamatsu Orca R2 CCD camera was used to acquire images. An Ibidi stage incubation system with temperature, humidity, and CO2 control was used to maintain ideal cellular conditions during imaging. The overall microscopy setup is discussed in further detail in Wakida et al. [18].
Either a Coherent Ti:Sapphire femtosecond laser emitting at 800 nm or a Coherent Nd:YVO4 nanosecond laser emitting at 532 nm was focused into the back aperture of a 40x, 1.3 NA objective. These lasers were used to kill/damage single astrocytes in close proximity to the responding cells that initiated phagocytosis. Laser optical path and parameters used for photolysis are discussed in detail in Wakida et al. [18].
Image and statistical analysis
Image J was used for image analysis. GraphPad Prism software was used for statistical analysis and graphical representation of data. Two-tailed p values for phagocytic response of astrocytes were determined by two proportion chi square tests.
RESULTS
Phagocytic response is impaired in HD astrocytes
We evaluated phagocytosis in striatal astrocytes derived from two HD mouse models: the fast-progressing R6/2 model [22] and a slow-progressing Q175 model [23]. For the fast-progressing R6/2 model, astrocytes were derived at an early stage from 3-week-old mice and at a later progressive stage from 12-week-old mice. Astrocytes were derived from the slow progressing Q175 model at an early stage of 3 months and a later highly symptomatic stage at 12 months. A short-pulsed laser focused into the back aperture of the objective was used to lyse an individual cell within the astrocyte network. Neighboring astrocytes directly attached to the lysed cell were observed for phagocytic vesicle formation (Supplementary Movies 1–4: Non-Transgenic (NT) and HD R6/2 w12, WT and HD Q175 12 month) for a 1-hour period following photolysis. We observed a significant decrease in phagocytic activity from both later stages of HD astrocytes (12-week R6/2 and 12-month Q175) when compared to astrocytes derived from wild type (WT) mice.
In the R6/2 model, 68% (44 of 65) of astrocytes derived from 3-week-old HD mice initiated phagocytosis. This was not significantly different from phagocytic rates of 75% (39 of 52 cells) for astrocytes derived from 3-week-old NT mice (p = 0.39 determined by two tailed chi squared analysis). HD astrocytes derived from 12-week-old R6/2 mice initiated phagocytosis at a rate of 27% (17 of 63 cells). Astrocytes derived from week 12 NT mice initiated phagocytosis at a rate of 52% (32 of 61 cells), significantly higher than astrocytes derived from R6/2 mice (p = 0.004 via chi squared 2 tailed analysis).
A similar trend was mirrored in astrocytes derived from the Q175 HD model. HD astrocytes derived from 3-month early stage Q175 mice displayed no significant difference to 3-month WT astrocytes (0 = 0.09 2 tailed chi squared analysis), where HD astrocytes initiated phagocytosis in 68% of observed cases (n = 47) vs. 51% of WT astrocytes (n = 49). In 12-month, progressive stages of Q175, we observed a significant decrease (p = 0.024 determined by 2 tailed chi squared analysis) in phagocytic rate in HD astrocytes at 33% (n = 39), as compared to 59% phagocytosis observed in WT astrocytes (n = 39). Figure 1 displays the graphical representation of the decreased phagocytic response in HD striatal astrocytes in both R6/2 and Q175 models, and images that track the formation of phagocytic vesicles.
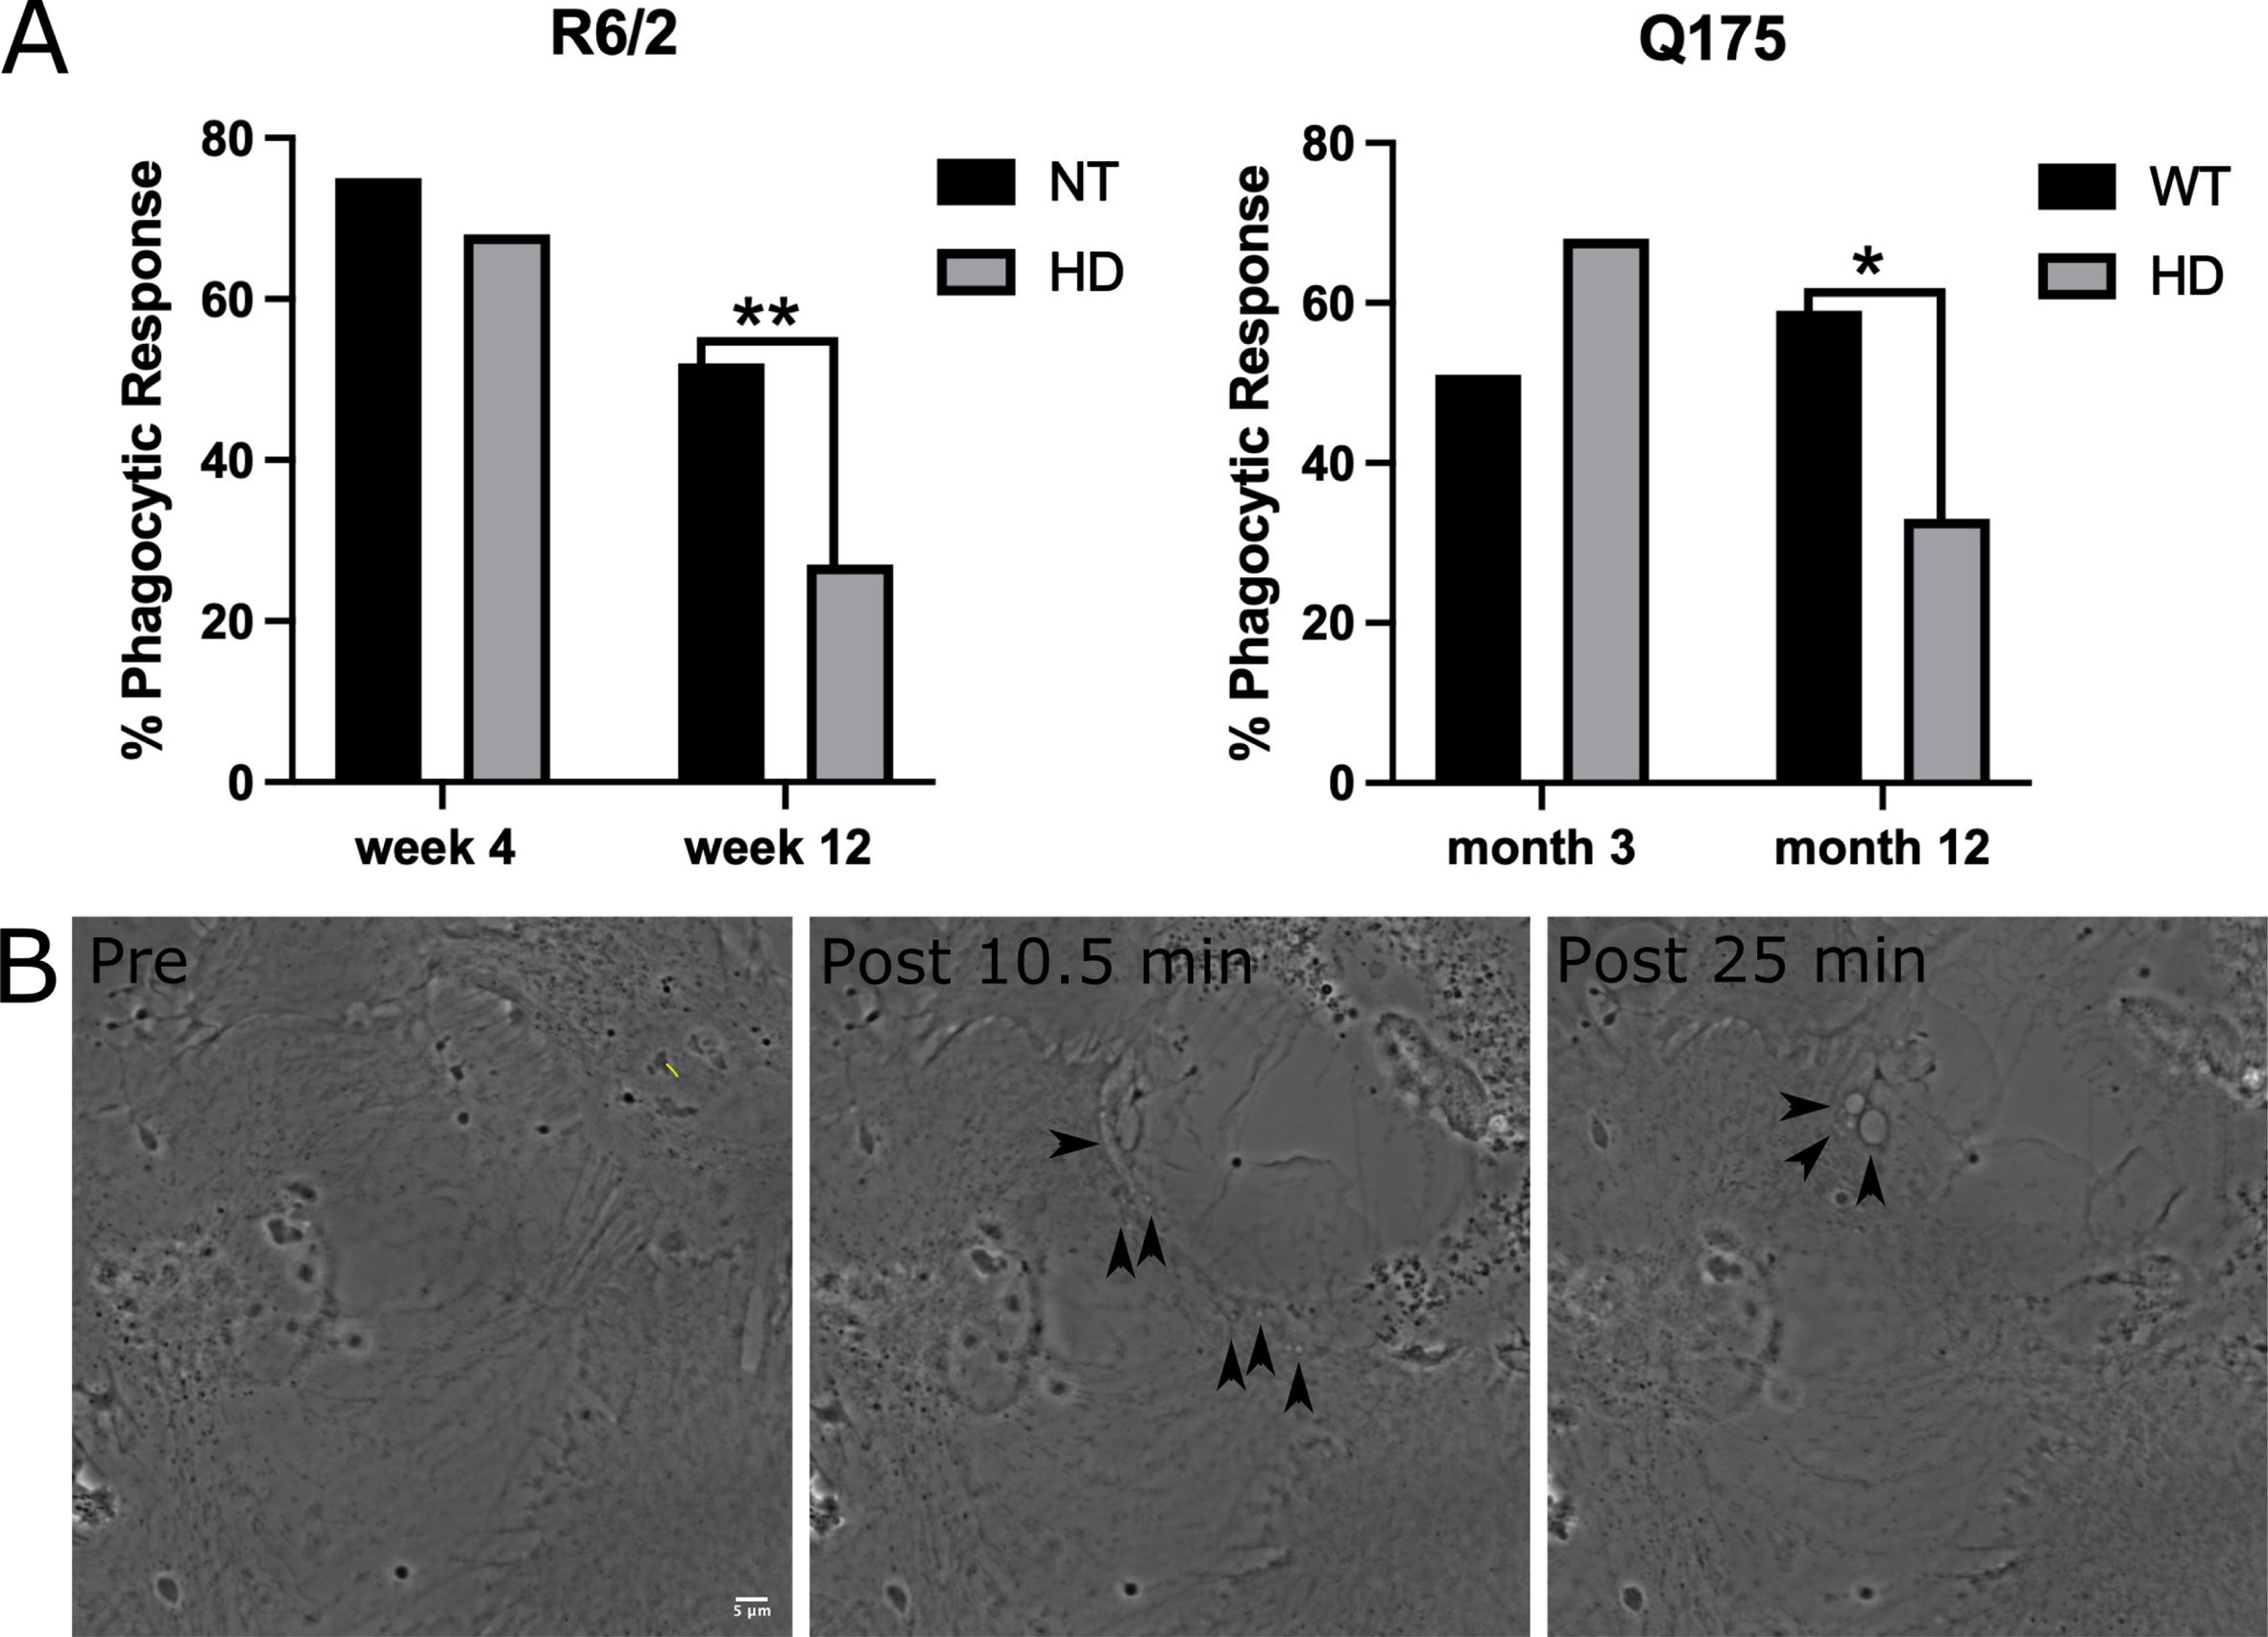
Phagocytosis response of astrocytes decrease in R6/2 and Q175 mouse models. A) Chi squared analysis test reveal no significant difference in phagocytosis between NT and HD astrocytes from an R6/2 mouse model at the earlier time point at week 4 (NT = 75%, HD = 68%, p = 0.39). HD astrocytes from week 12 display significantly lower phagocytic response at 27% vs. 52% observed in NT astrocytes (p = 0.004 via chi squared 2 tailed analysis). The same trend is observed in the Q175 mouse model, with no significant difference in phagocytic response was observed between WT (51%) and HD (68%) for astrocytes derived for 3-month-old mice (p = 0.09). Astrocytes derived from 12-month Q175 mice displayed a significantly lower phagocytic response at 33% when compared to WT astrocytes at 59% (p = 0.024). * refers to statistically significant p values where p≤0.05, ** refers to statistically significant p values where p≤0.01. B) Time lapse images of a neighboring astrocyte progressing through the phagocytic process in response to photolysis. The astrocyte at the top right was targeted with the laser at the yellow line denoted in the pre lysis image. Two post images acquired at 10.5 and 25 min following photolysis of a neighboring astrocyte (bottom left) responding via phagocytosis. Black arrows depict the formation of vesicles at the astrocyte’s responding edge.
The diminished phagocytic response in astrocytes from progressive stages of HD mice was further detailed by phagocytic vesicle analysis. We quantified the number of phagocytic vesicles formed per cell in astrocytes derived from the R6/2 mouse model for both week 4 and week 12 mouse stages. Figure 2 displays a significant decrease in the average number of vesicles per cell for HD astrocytes in week 12 (p = 0.034 via two tailed t test) at an average of 1.6 vesicles per cell (n = 21) when compared to 6.9 vesicles per cell formed in 12-week NT astrocytes (n = 22). No difference (p = 0.16 via two tailed t test) was observed in the formation of vesicles per cell from week 4-derived astrocytes with an average of 1.4 vesicles per cell for R6/2 astrocytes (n = 32) and 3.5 vesicles per cell for NT astrocytes (n = 23).
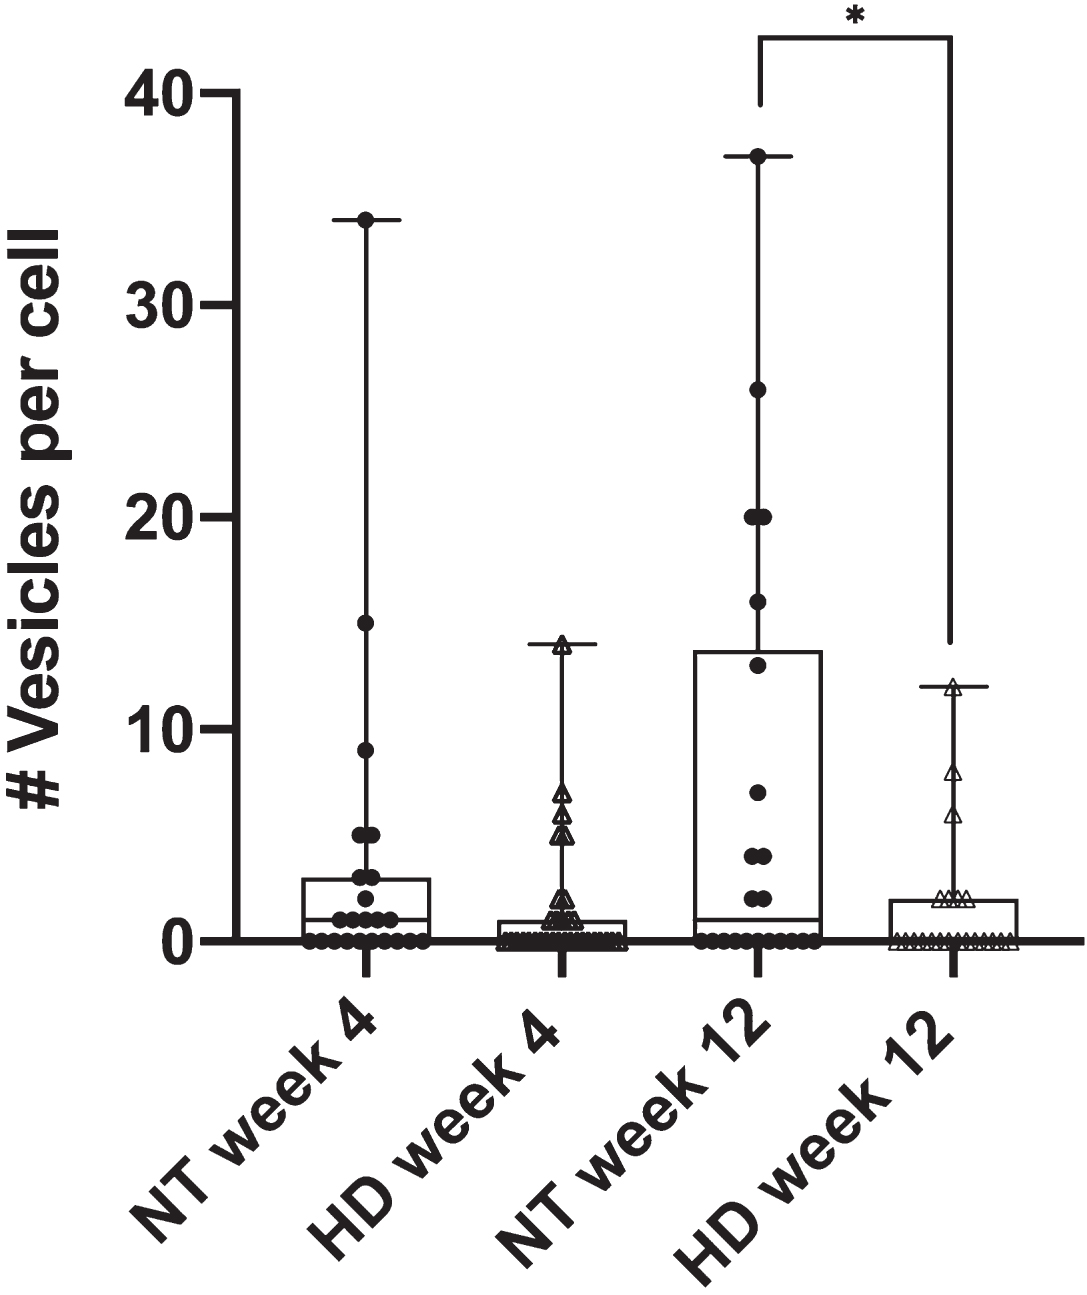
R6/2 HD astrocytes form significantly less phagocytic vesicles per cell in astrocytes derived from week 12 mice when compared to NT astrocytes (p = 0.03 via unpaired 2 tailed t test). NT astrocytes averaged 6.9 vesicles formed per cell (n = 22), vs. 1.6 vesicles per cell observed in R6/2 astrocytes (n = 21). No significant difference was observed in astrocytes derived from week 4 mice (p = 0.16 via unpaired 2 tailed t test) at 3.5 vesicles per cell for NT astrocytes (n = 23) and 1.4 vesicles per cell for R6/2 astrocytes (n = 32). * refers to statistically significant p values where p ≤0.05.
Microtubule-associated protein light-chain 3 (LC3) associated phagocytosis
LC3 localizes to phagosome membranes following the recognition of apoptotic, necrotic, or entotic cells. Further, LC3 is required for degradation of engulfed cell corpses [24]. To determine if LC3 is associated with the astrocyte phagocytic vesicles formed in response to neighboring cell death by photolysis, WT astrocytes were transfected with GFP-LC3 or GFP control and imaged following the photolysis of a neighboring, attached cell. Figure 3 and corresponding Supplementary Movies 5 and 6 highlight regions of the cell periphery adjacent to the lysed cell where phagocytic vesicles formed. We observed a strong increase in fluorescence associated with newly formed vesicles in GFP-LC3 expressing astrocytes, and to a lesser extent with GFP labeled astrocytes. Figure 3A highlights vesicle formation with GFP-LC3 fluorescence accumulation in astrocytes in the top row, in comparison to GFP accumulation to vesicles as a control in the second row. Black asterisks mark the center of newly formed vesicles.
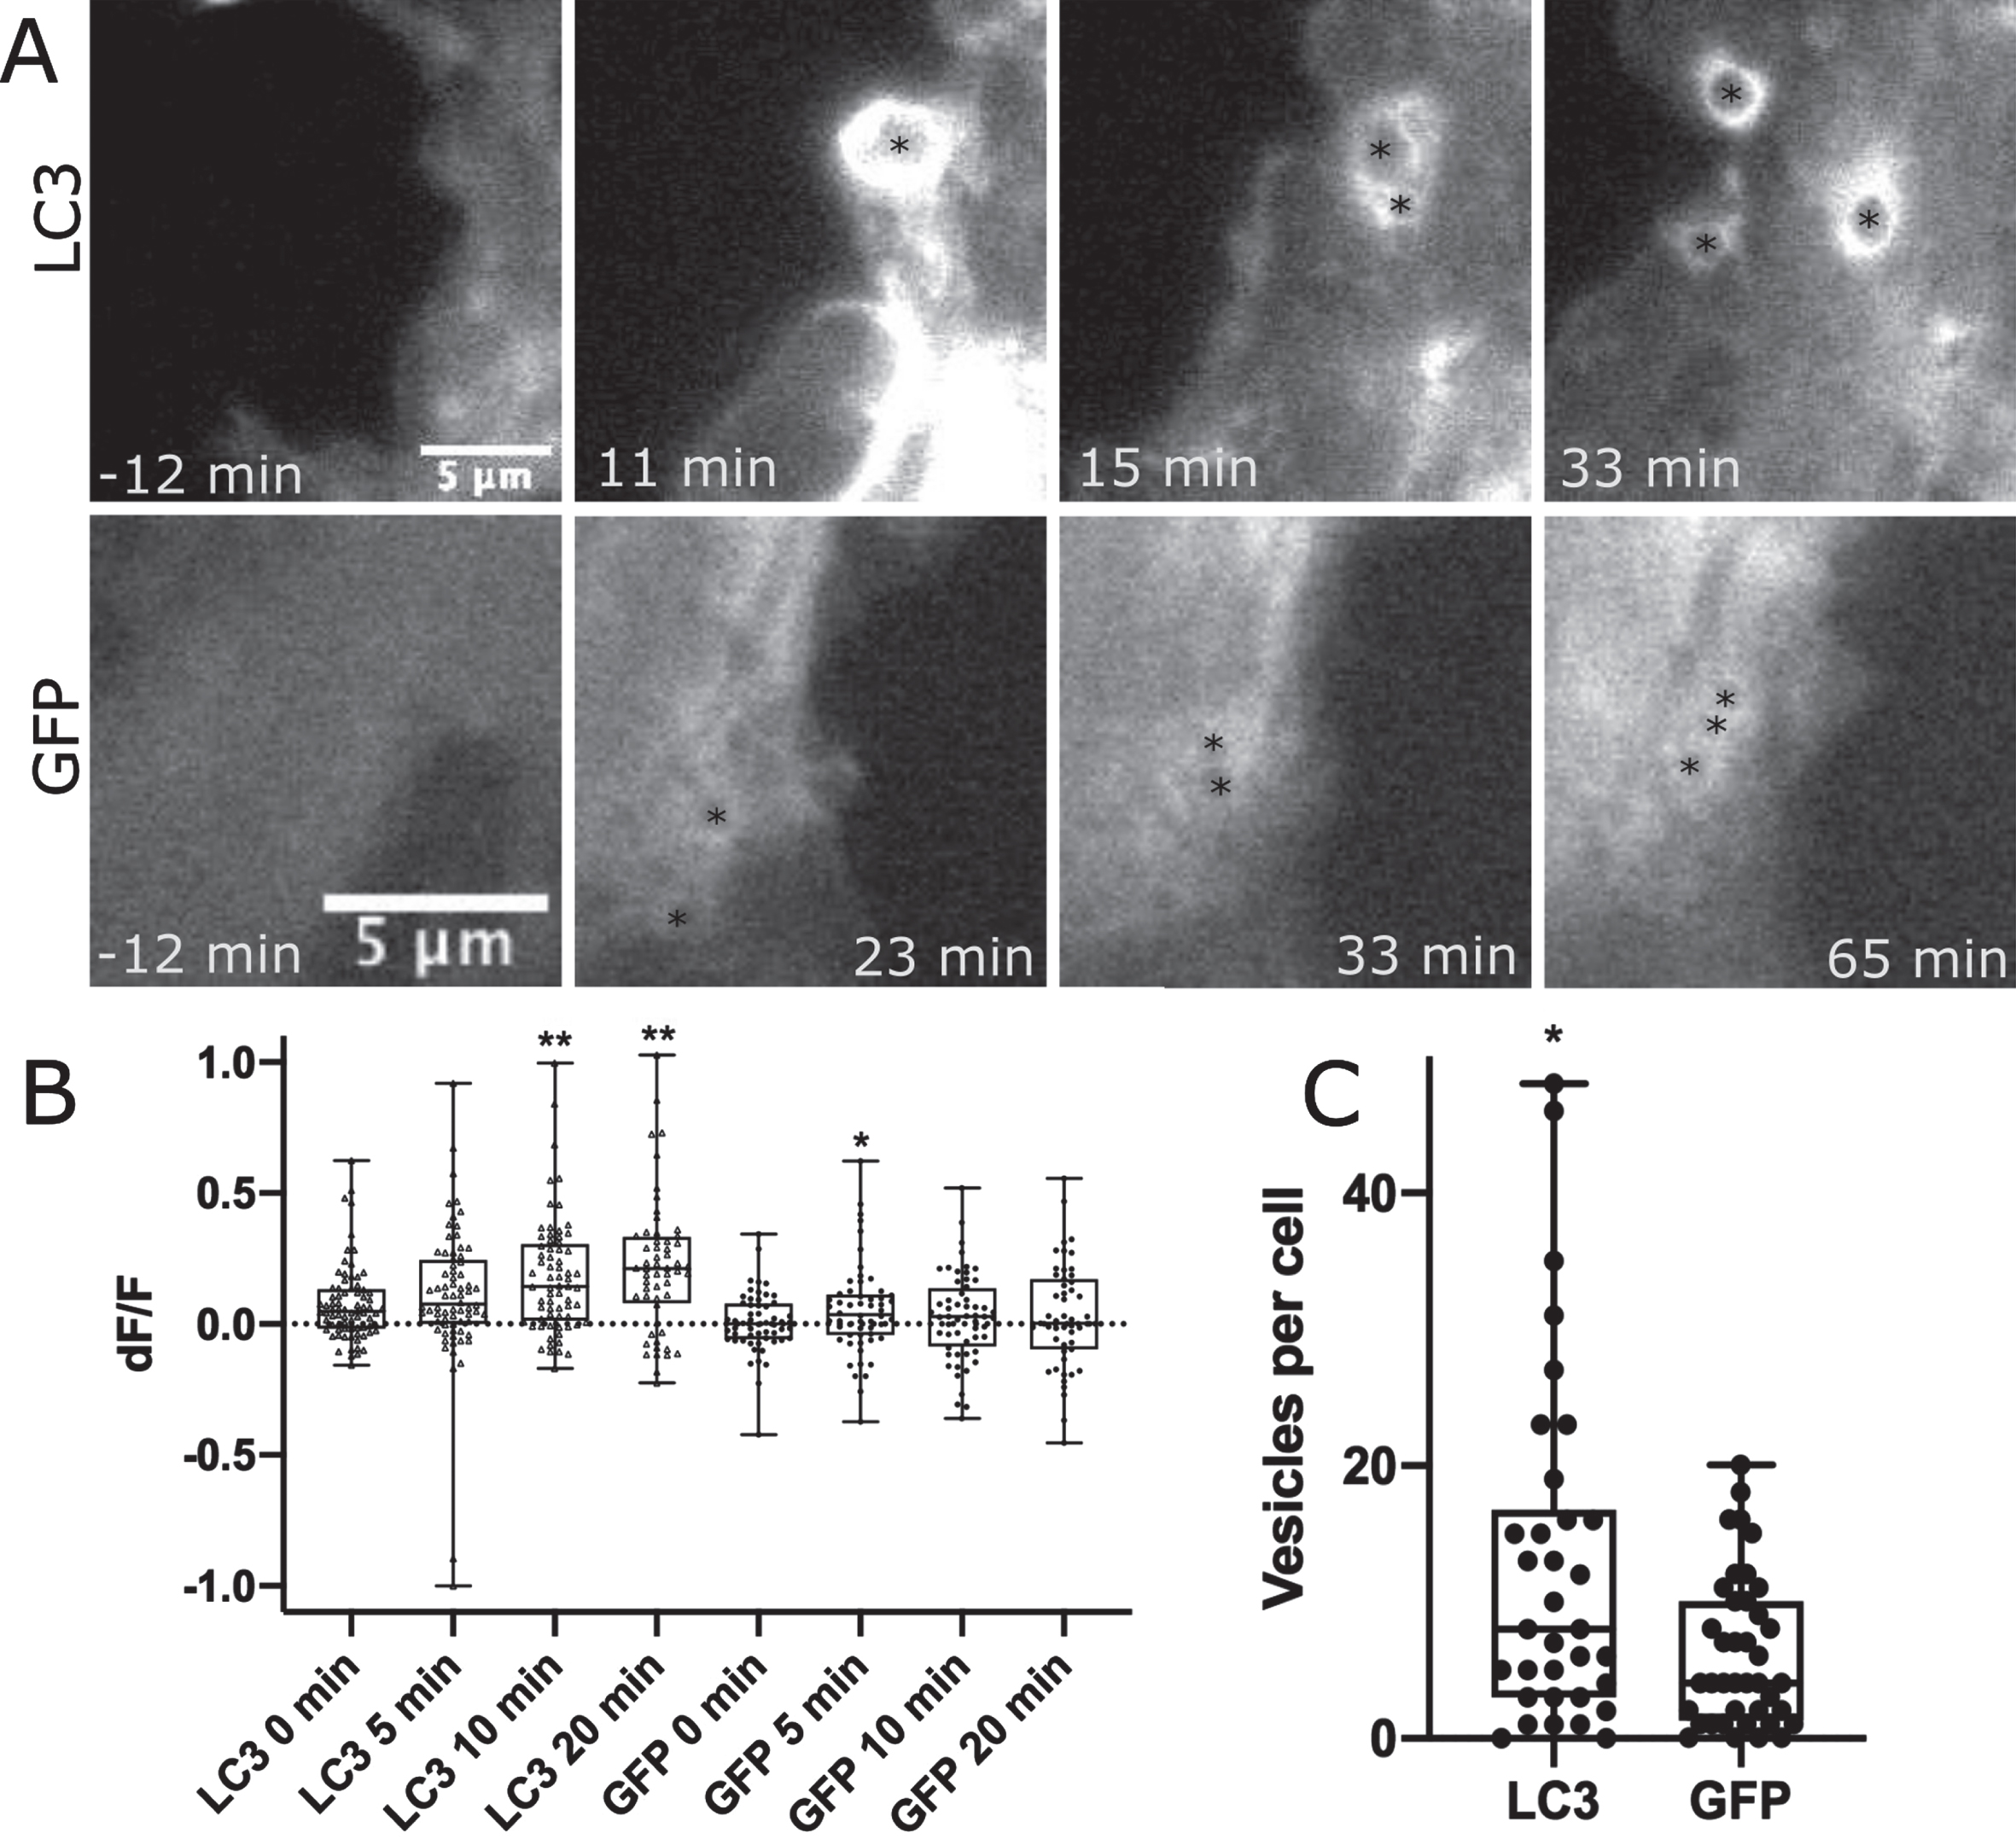
Phagocytic vesicles in WT astrocytes recruit GFP-LC3. GFP vs. GFP-LC3 kinetics in astrocytes during phagocytic vesicle formation and maturation. A) Highlight of phagocytic vesicle formation in astrocytes transiently labeled with GFP-LC3 and GFP control. We observe a large increase in GFP-LC3 localization surrounding phagocytic vesicles as depicted in the top row, and a smaller increase in GFP localization displayed in the bottom row. Black asterisks mark the position of phagocytic vesicles that form in astrocytes responding to photolysis. B) Quantification of GFP-LC3 and GFP signal associated with phagocytic vesicles at 0, 5, 10, and 20 min time points following vesicle formation. Box plot of change in fluorescence (dF/F) at four time points show a significant increase in fluorescence observed 10 and 20 min following vesicle formation for LC3 labeled astrocytes, peaking at 20 minutes post vesicle formation. GFP fluorescence peaked at 5 min following vesicle formation. * corresponds to p values 0.01–0.05. ** corresponds to p values < 0.01. C. GFP-LC3 transfected astrocytes produce significantly more vesicles per cell than GFP labeled astrocytes. GFP-LC3 transfected cells produce an average of 12.65 vesicles per cell (n = 34), significantly more than GFP labeled cells at an average of 6.2 vesicles per cell (n = 40). Data did not pass Anderson-Darling normality test, we used a Mann-Whitney two tailed unpaired test to determine a significant difference between GFP-LC3 and GFP by p = 0.024.
The mean fluorescence intensity was measured for intracellular regions at 0 min, 5 min, 10 min, and 20 min time points following vesicle formation. For each time point, fluorescence intensity values were divided by the mean fluorescence intensity of the same region just prior to vesicle formation resulting in change in fluorescence value (dF/F) for 78 GFP-LC3 associated vesicles and 56 GFP associated vesicles. dF/F values in Fig. 3B shows a dramatic increase in fluorescence intensity of GFP-LC3 associated vesicles: 0 min dF/F of 0.08, 5 min dF/F of 0.11, 10 min dF/F of 0.18, 20 min dF/F of 0.22. No significant change was observed when comparing 0- and 5 min time points (p = 0.14), but both the 10- and 20 min time points show a significant increase in fluorescence intensity for GFP-LC3 associated vesicles (10 min p < 0.0001, 20 min < 0.0001) as determined via two tailed Mann-Whitney test (data did not pass Anderson-Darling normality test p = 0.0002). This trend was not observed in control GFP expressing astrocytes with dF/F values peaking at 5 min: 0 min dF/F of 0.005, 5 min dF/F of 0.05, 10 min dF/F of 0.03, 20 min dF/F of 0.03. GFP associated vesicles at the 5 min time point are significantly brighter with p = 0.005 (determined by two tailed Mann Whitney test). This was the only time point of significant variation when compared to 0 min: 10 min p = 0.2, 20 min p = 0.28.
While the frequency of phagocytic response of astrocytes did not vary between GFP-LC3 transfected (84% or 26/31) and GFP transfected (81% or 30/37), there was a difference in the robustness of response as determined by the number of vesicles formed per cell following photolysis. Figure 3C compares the average number of vesicles formed per cell during the one-hour observation period following photolysis. The plot shows a significant increase in the number of vesicles formed in astrocytes expressing GFP-LC3 at 12.7 vesicles per cell (n = 34) vs. GFP at 6.2 vesicles per cell (n = 40) as determined by p = 0.02 in a two-tailed Mann-Whitney test (non-gaussian distribution determined by Anderson-Darling normality tests p < 0.001).
GFP-LC3 expression in Q175 astrocytes
When GFP-LC3 was expressed in Q175 astrocytes, GFP-LC3 fluorescence dynamics followed the same trend during vesicle formation and maturation. Figure 4 demonstrates that 3-month WT astrocytes (n = 25) consistently increase in average dF/F from 0.03 at 0 min, to 0.04 at 5 min, to 0.07 at 10 min, and 0.09 at 20 min. When compared to the 0 min time point, both the 10 min (p = 0.03) and 20 min (p = 0.02) time points were significantly higher in average fluorescence intensity via two tailed t test. The 5 min time point was not significantly higher with p = 0.58. Comparison of dF/F match the response in the WT astrocytes and GFP labeled cells. Astrocytes derived from 3-month-old Q175 mice displayed a similar trend of increased GFP-LC3 fluorescence intensity associated with vesicles with averages of 0.08 at 0 min, 0.06 for 5 min, 0.15 for 10 min, and 0.15 for 20 min (n = 14); however, this trend was not found to be significant by two tailed t-test when compared to the 0 min time point with p = 0.66 for 5 min, p = 0.37 for 10 min, and p = 0.4 for 20 min, suggesting that LC3-associated phagocytosis was slightly impaired relative to WT. GFP-LC3 fluorescence of vesicles derived from 12-month Q175 astrocytes were not analyzed due to the severe decrease in phagocytic activity resulting from both the age of the mice and the decrease in vesicles formed in HD astrocytes.
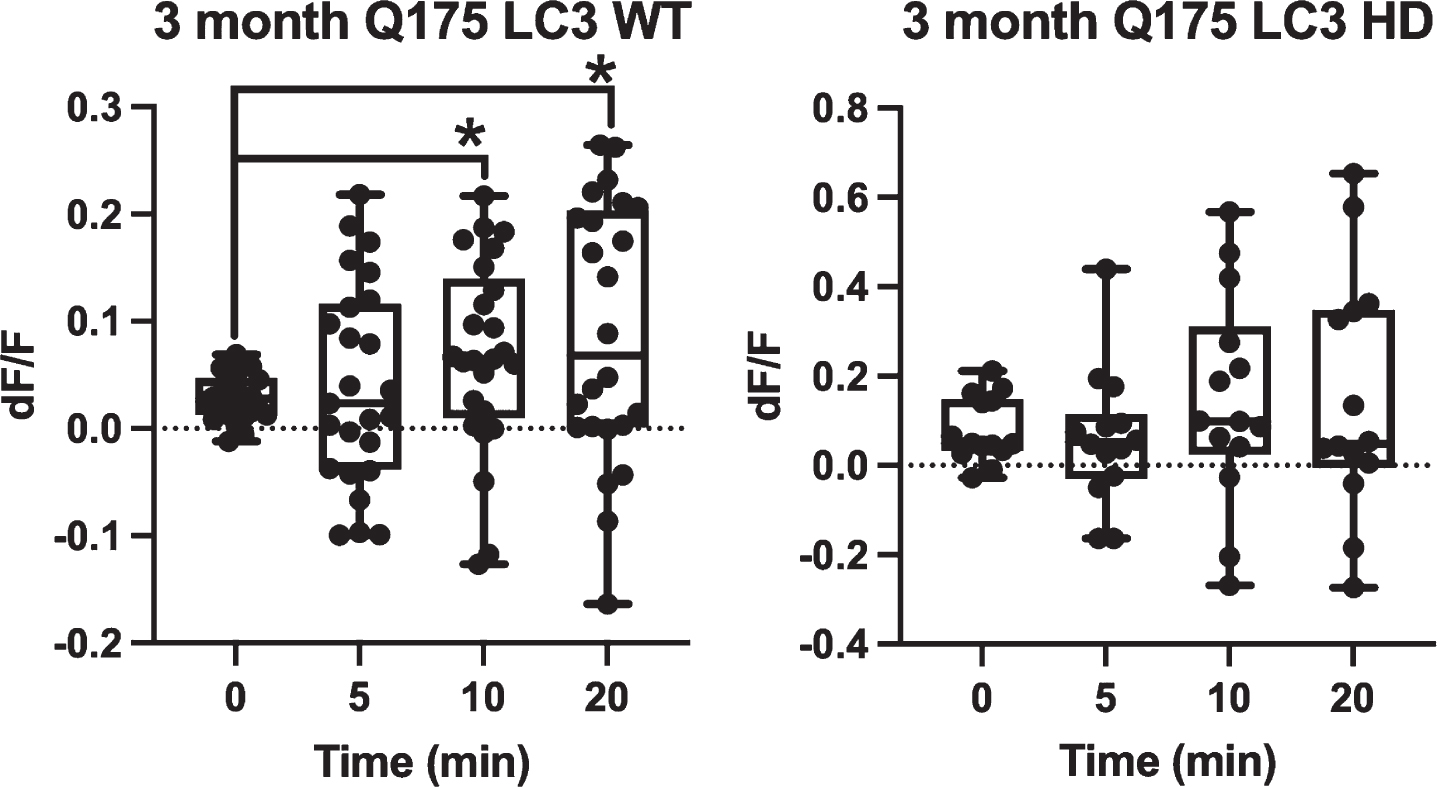
Q175 astrocytes do not show significantly increased GFP-LC3 accumulation surrounding vesicles over a 20 min observation period. GFP-LC3 expression surrounding newly formed phagocytic vesicles was quantified as dF/F values by dividing the average gray area corresponding to a vesicle region by the average gray area just prior to vesicle formation. This was done at 4 time points: 0 min (immediately after vesicle formation) 5 min, 10 min, and 20 min. For 3-month astrocytes derived from WT mice, we observe a significant increase at 10 and 20 min dF/F when compared to 0 min (p = 0.03, p = 0.02, respectively determined by two tailed t test). No difference was observed between 0 and 5 min dF/F (p = 0.58 determined by 2 tailed t test). 0.03 at 0 min, to 0.04 at 5 min, to 0.07 at 10 min, and 0.09 at 20 min. Vesicles formed in astrocytes from 3-month HD Q175 mice followed a similar increasing trend of dF/F values of 0.08 at 0 min, 0.06 at 5 min, 0.15 at 10 min, and 0.15 at 20 min. dF/F values from 5, 10, and 20 min time points did not differ significantly from the 0 min time point with p values 0.66 at 5 min, 0.37 at 10 min, and 0.4 at 20 min determined by two tailed t-test.
DISCUSSION
Phagocytic activity of striatal astrocytes has been implicated in the progression of neurodegenerative disorders, including HD [12, 16], Parkinson’s disease [25], and amyotrophic lateral sclerosis [26]. Astrocytes engulf amyloid plaque, envelope neurites associated with amyloid plaques, and clear synaptic debris and dysfunctional synapses to potentially reduce inflammatory impact [27]. As we continue to learn more about the active role astrocytes play in normal physiological states as well as in neurodegenerative disease, we need to better understand the functional capabilities of astrocytes. Data presented here aligns with other studies showing that astrocytes 1) are functionally defective in HD in a manner that may contribute to the accumulation of mHTT and dysfunctional synapses and 2) that non-mHTT expressing astrocytes may have the potential to limit the progression of HD and could be a potential therapeutic target for HD and other neurodegenerative disorders [14, 16]. Microglia are the main phagocytes of the nervous system [28]. Activated microglia can induce reactive astrocytes [29] and appear to contribute to pathogenesis in HD. However, a recent study has demonstrated that astrocytes possess a compensatory phagocytic function when microglia were absent or impaired [30]. Functional astrocyte phagocytosis is therefore necessary to phagocytose cellular debris, e.g., from dying neurons, and activated microglia and therefore critical to maintenance of a healthy functioning CNS.
This study provides evidence of diminished astrocyte functionality in HD mouse models. In later stages of both R6/2 and in Q175, we observe a significant reduction in phagocytosis that parallels ongoing HD pathogenesis. This was statistically significant in both the percentage of cells responding via phagocytosis and the number of phagocytic vesicles observed to be forming. The R6/2 model is genetically modified to develop an accelerated phenotype with early neurological phenotypes at age 7-8 weeks, leading to death at 12–14 weeks of age [22, 31]. The Q175 knock in model presents motor deficits as early as 6 months and cognitive deficits at 12–16 months [23, 31–33]. At early stages, we expect astrocytes are able to clear cellular debris with no impediment.
High variability in the number of phagocytic vesicles formed per cell is consistent with our current understanding of astrocytes. Most notably, astrocytic marker glial fibrillary acidic protein (GFAP) is expressed at differing amounts in individual cells within an astrocyte population [34]. GFAP is upregulated to varying amounts in astrocytes responding to an insult to the central nervous system [35]. Furthermore, astrocytes vary greatly in morphology [36], response to induced trauma [37], and calcium activity [38]. Our previous study linked calcium signaling with multiple steps in the phagocytic process [19], thus the variability in the degree that individual astrocytes respond to a photolysis insult is expected.
The increase in phagocytic response in vesicles per cell formed for late-stage WT astrocytes is consistent with previous studies that show increased GFAP expression, an astrocytic marker also linked to astrocyte reactivity [39–41], in aging astrocytes. The impairment of phagocytosis we observed in HD astrocytes diminishes a major mechanism to clear cellular debris, which could represent a way astrocyte function changes with the chronic expression of mHTT.
LC3-associated phagocytosis
Our results show LC3 association with phagocytic vesicles, suggesting that the astrocyte phagocytosis we observe is LC3-associated phagocytosis (LAP). We detected an increasing amount of GFP-LC3 surrounding phagocytic vesicles over a 20 min period in WT mice, whereas there was no significant increase in 3-month-old Q175 mice. The WT results agree with a previous murine study showing LAP peak 30 min to 1 h after phagocytosis [42]. Imaging constraints of our system only allowed for a 20 min observation period of fluorescence correlation vesicles at a large number to significantly analyze. This finding in part addresses the comment by Tremblay et al. that “no study has yet assessed whether LAP occurs in microglia and astrocytes, together with the consequences of LAP deficiency or dysfunction in the CNS” [43]. LAP is known to clear apoptotic cells in phagocytes including macrophages. In addition, LAP deficiency decreases the capacity of clearing dying cells [44], as we have modeled in this study and which may be impaired in HD. Our data suggests that LAP does indeed occur in astrocytes, an area of growing research interest and relevance to neurodegenerative disease.
Footnotes
ACKNOWLEDGMENTS
We gratefully acknowledge the generous gift of the GFP-LC3 plasmid from N. Mizushima. This work was supported by the following NIH grants: R01 NS089076, R01 NS090390 and R35 NS116872 (to LMT), 1F30AG060704-01A1, T32GM008620, Lorna Carlin Fellowship and T32AG000096 (to GMF), and the Hereditary Disease Foundation (to JSS). This work is also supported by the Air Force Office of Scientific Research under award number FA9550-20-1-0052 and ongoing support from the Beckman Laser Institute Foundation (to MWB).
CONFLICT OF INTEREST
The authors have no conflict of interest to report.