
Abstract
Huntington’s disease (HD) (OMIM 143100) is caused by an expanded CAG repeat tract in the HTT gene. The inherited CAG length is known to expand further in somatic and germline cells in HD subjects. Age at onset of the disease is inversely correlated with the inherited CAG length, but is further modulated by a series of genetic modifiers which are most likely to act on the CAG repeat in HTT that permit it to further expand. Longer repeats are more prone to expansions, and this expansion is age dependent and tissue-specific. Given that the inherited tract expands through life and most subjects develop disease in mid-life, this implies that in cells that degenerate, the CAG length is likely to be longer than the inherited length. These findings suggest two thresholds— the inherited CAG length which permits further expansion, and the intracellular pathogenic threshold, above which cells become dysfunctional and die. This two-step mechanism has been previously proposed and modelled mathematically to give an intracellular pathogenic threshold at a tract length of 115 CAG (95% confidence intervals 70– 165 CAG). Empirically, the intracellular pathogenic threshold is difficult to determine. Clues from studies of people and models of HD, and from other diseases caused by expanded repeat tracts, place this threshold between 60– 100 CAG, most likely towards the upper part of that range. We assess this evidence and discuss how the intracellular pathogenic threshold in manifest disease might be better determined. Knowing the cellular pathogenic threshold would be informative for both understanding the mechanism in HD and deploying treatments.
Keywords
BACKGROUND
Huntington’s disease (HD) is one of > 50 diseases caused by expanded short tandem repeats [1, 2]. In those diseases where the repeat is coding, as in HD, the repeat unit is usually CAG and this is translated to a homopolymeric glutamine tract in the encoded protein. There are nine such diseases, often referred to collectively as the polyglutamine diseases. The sections of these proteins containing expanded glutamine form cellular aggregates [3]. The polyglutamine diseases have disease-causing expansion lengths that are much shorter than those in diseases where the repeats causing the expansion are not translated [4, 5], implying a possible constraint on length at the level of the protein. While somatic expansion is critical in reaching the intracellular pathogenic CAG length threshold, the subsequent events leading to cell dysfunction and death have not been conclusively defined (Fig. 1). Much attention has focused on the expanded glutamine tract in the protein but it has never been conclusively proven that this elicits toxicity in cells in human disease, and the genetic evidence implicates CAG length rather than polyglutamine length as critical in HD pathogenesis [6–8]. Other potential pathogenic mechanisms that cannot be precluded include RNA-based toxicity as in myotonic dystrophy (OMIM 160900) [9], RAN translation [10] and aberrant exon 1 splicing [11]: all of these mechanisms would also be exacerbated by somatic expansion of the repeat in individual cells. Recent evidence of neurodevelopmental effects in HD [12], and early phenotypes in peripheral blood mononuclear cells [13, 14], may indicate other pathways impacted by the unexpanded CAG length, but the genetic evidence in HD subjects very clearly points to somatic expansion as likely to be important in disease manifestation.
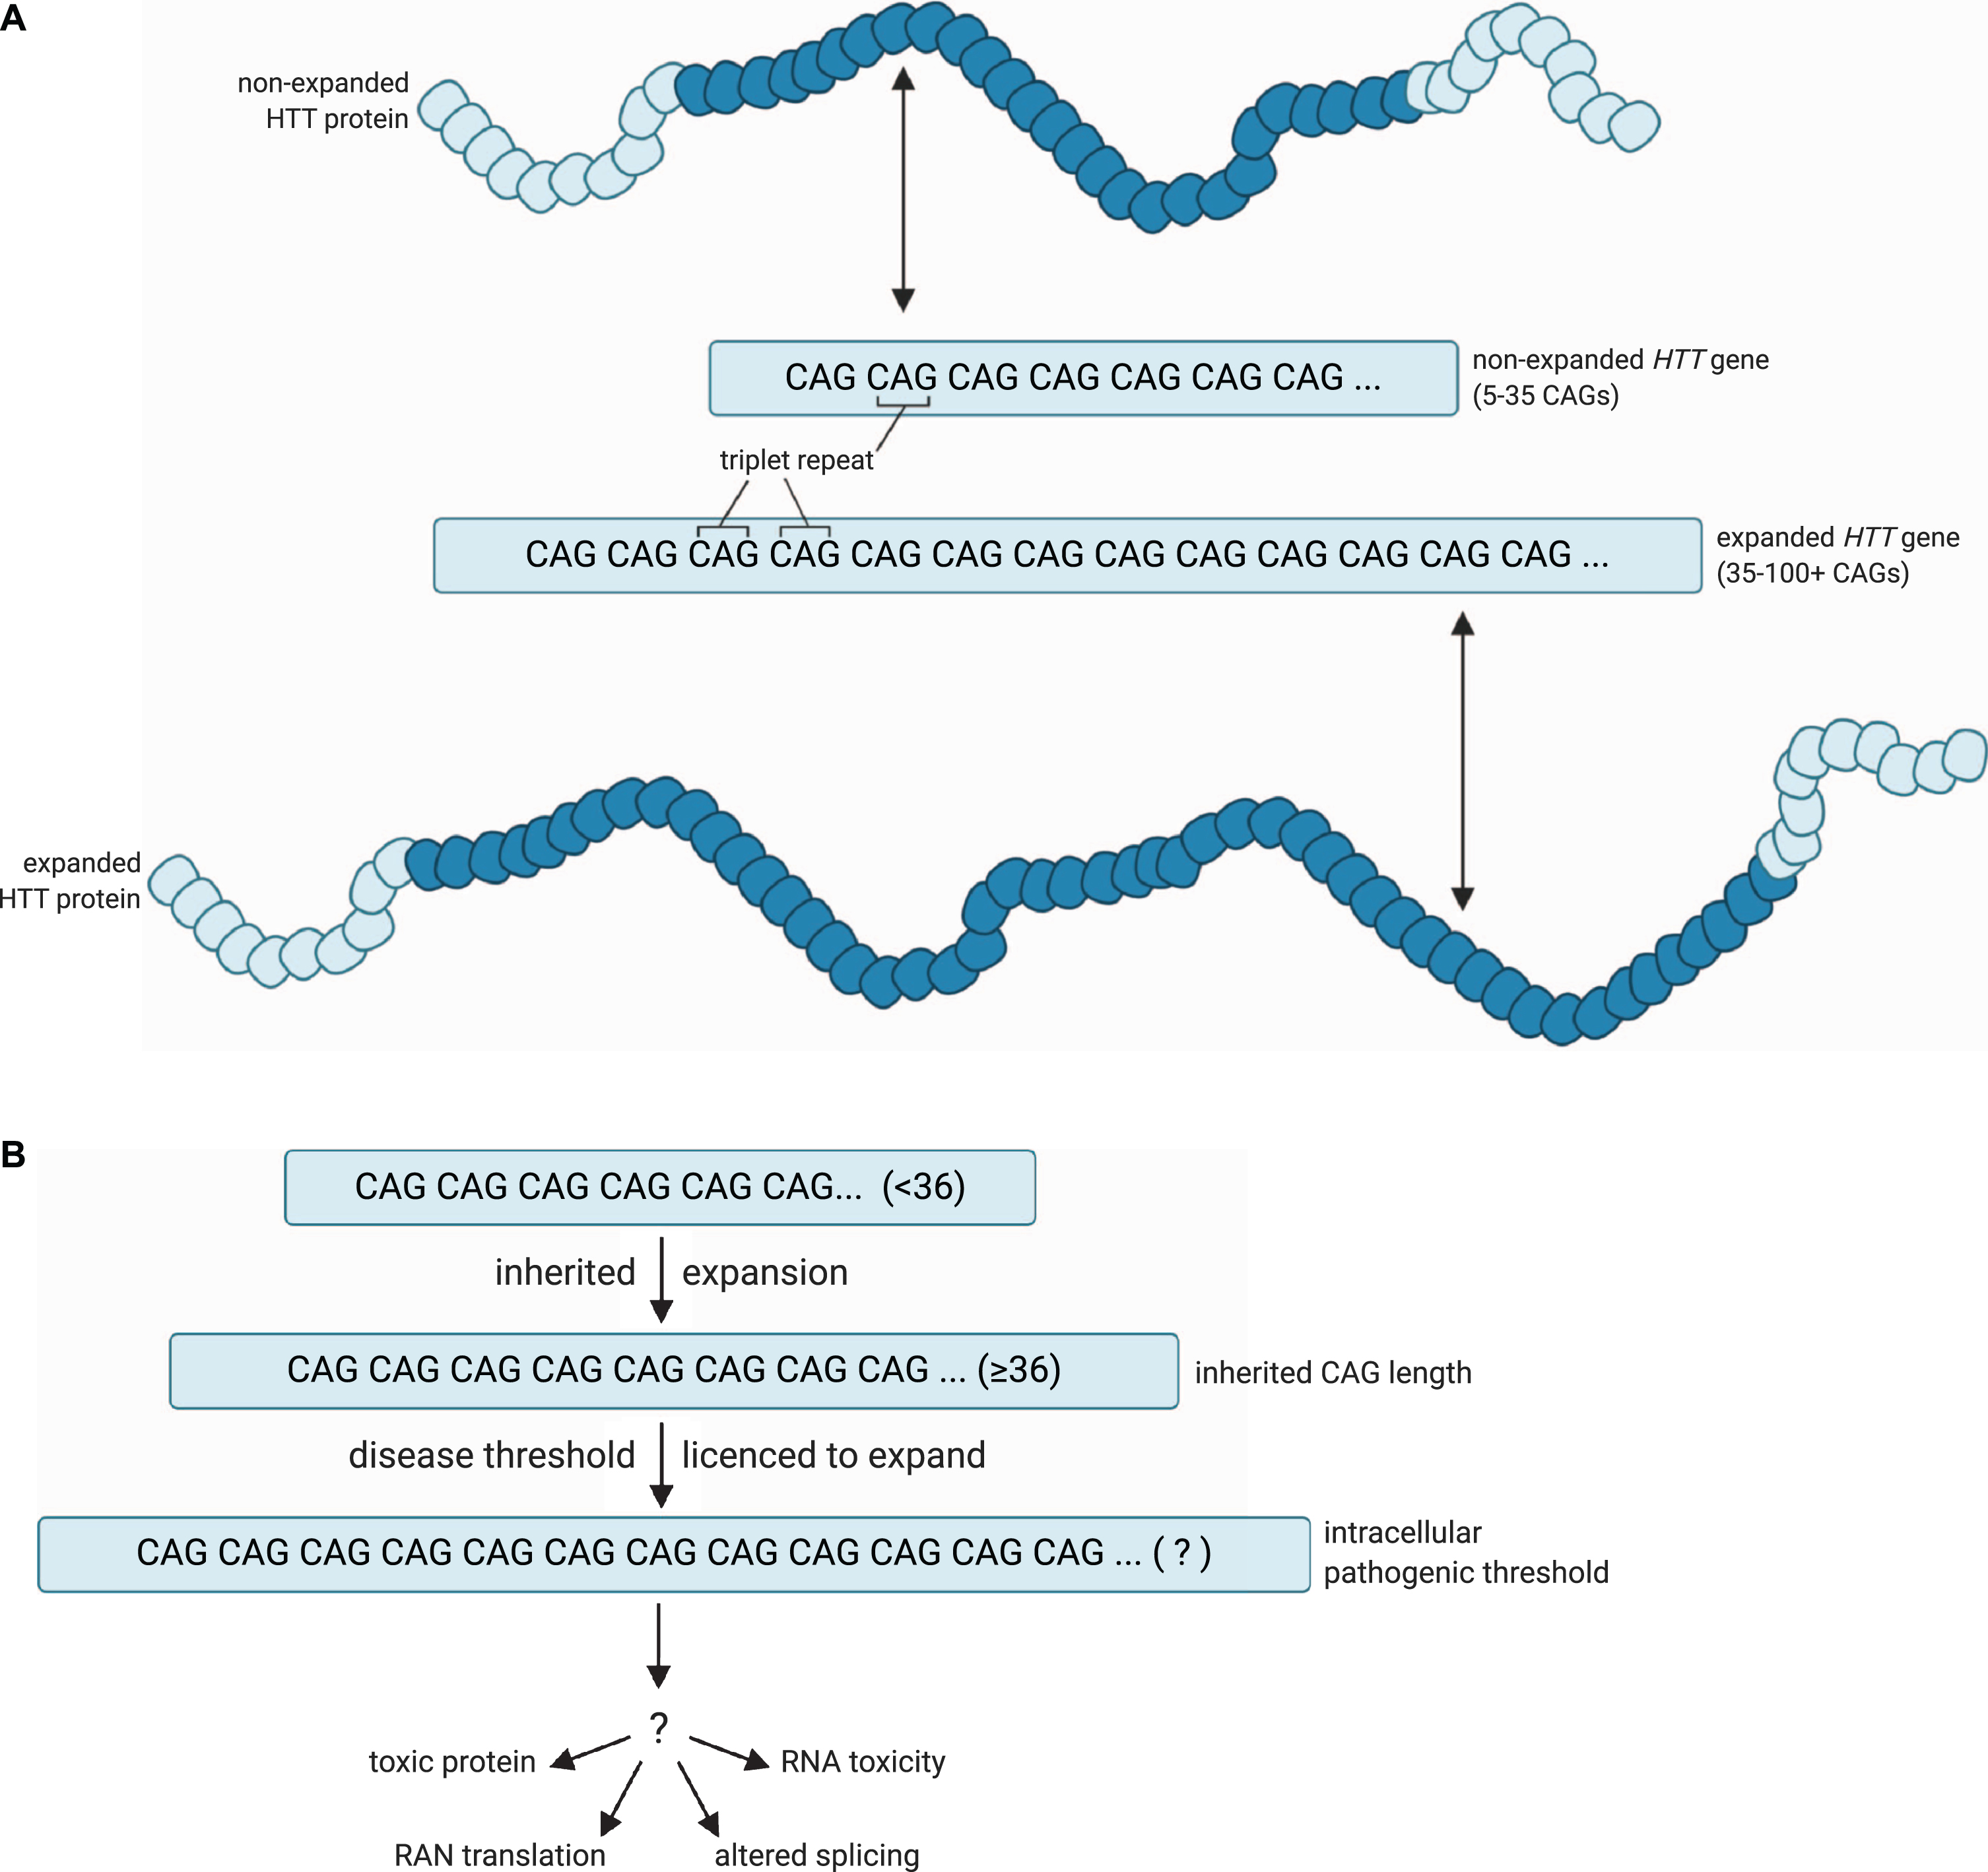
A model for the pathogenic threshold in HD. A) HD pathogenesis is largely determined by an expanded cytosine-adenine-guanine (CAG) trinucleotide repeat within exon 1 of the huntingtin (HTT) gene, which is translated into an expanded polyglutamine tract in the corresponding HTT protein. Wild-type HTT possesses 5– 35 CAG repeats (non-expanded HTT gene), and can undergo expansion into the disease range in the germline to create apparent de novo HD subjects, but ≥36 + repeats is associated with a significantly increased risk of developing HD (expanded HTT gene). B) An expanded HTT allele with 36 or more repeats is unstable and licenced to further expand in cells over the lifespan of the HD at-risk individual. HD symptoms would manifest and progress as increasing numbers of disease-relevant cells undergo somatic expansion beyond an unknown intracellular pathogenic threshold that renders the gene toxic in those cells. Figures created using BioRender.com. Figure 1A adapted from a figure by National Institute of General Medical Sciences, National Institutes of Health.
In HD, age at onset of disease is largely determined by the length of the CAG tract [15–17]. More recently, however, age at onset has been shown to be modulated by a series of genetic modifiers whose discovery has revolutionised the way we think about HD pathogenesis [7, 18– 20]. Two types of genetic modifier revealed so far have provided evidence that has made us rethink our notions of HD pathogenesis. First, some of the encoded proteins translated from these modifiers act directly on DNA and are most likely to exert their effect at the level of the mutated expanded DNA, through modulating the length of the CAG tract in both somatic and germline cells [18–21], and indeed, this has been shown experimentally in cell culture [22, 23]. Second, the exact sequence at the HTT CAG locus exerts a strong influence on age at onset of disease [6–8]. The length of the uninterrupted CAG tract correlates most closely with age at onset of disease and any interrupting bases that disrupt the continuous repeated sequence delay age at onset. Not all of the difference in onset age appears to be determined by uninterrupted CAG length at the HTT locus, in particular, having no CAA interruptions appears to hasten onset, while the effect of having more than one CAA at the 3’ end of the repeat tract is unclear [6, 7]. Together, these findings refocus attention on the causative repeat expansion at the level of the DNA, rather than the expanded glutamine tract in the mutant huntingtin protein that is translated from it.
A TWO-STAGE HYPOTHESIS OF DISEASE PATHOGENESIS
We know that further expansion of the HTT CAG tract occurs in the brain cells of HD subjects [24–26], that longer CAG tracts are more likely to expand [27, 28], and that the greater the expansion in brain the earlier the onset of disease [29]. These observations in humans validate previous findings in mice and provide a link between genetic data from human subjects and disease models of repeat instability [18, 30– 32]. These genetic data imply that at the point at which the CAG tract elicits toxicity in susceptible cells, which we refer to as the intracellular pathogenic CAG length, it is likely to be longer than the diagnostic disease-causing length of 36 CAG or more measured in the subjects’ blood. It is plausible that the inherited disease-causing threshold of 36 CAG in HD is the threshold beyond which further CAG repeat expansions are permissible in susceptible somatic cells (Fig. 1). It is also possible that there is a vicious cycle where alterations in DNA damage and repair exacerbate somatic expansion of the repeat [33]. So how can we define the intracellular pathogenic repeat length in such cells? Or at least the length that is pathogenic in a high enough proportion of the appropriate cell types to cause disease symptoms? This important information is lacking: defining such a threshold would be useful in clinical prognosis and clinical trials. A version of this interesting idea has been proposed previously by Kaplan and colleagues [34]. They postulated a mechanism where onset and progression of the disease are determined by the rate of expansion of the repeat tract in specific cells in the subject, and that the disease manifests only when the repeat tract has expanded beyond a certain threshold in a sufficient number of these cells. Progression is then determined by the rate at which more cells cross the pathogenic threshold for repeat length. The expansion rate and pathogenic threshold are estimated from clinical data (onset and repeat length of the inherited allele). The model assumes that the expansion rate is linear with respect to repeat length above an initial threshold, determined from clinical data (37 for HD). The assumption of linear expansion rate has not been confirmed experimentally, although Kaplan et al. [34] found that the onset predictions given by their model appeared to fit observed data for a number of repeat disorders, including HD, the polyglutamine tract mediated spinocerebellar ataxias (SCAs), myotonic dystrophy 1 (DM1, OMIM 160900) and Friedreich’s ataxia (FA, OMIM 229300). This model also predicts that earlier onset and longer CAG are correlated with faster progression, consistent with recent clinical observations [19, 35]. It may also explain why pre-clinical symptoms are evident up to 15 years prior to disease onset [36–39]. This premanifest period reflects a proportion of cells that have somatic expansion which induces neuronal dysfunction, but too few to manifest overt clinical symptoms (Fig. 2). It is also likely that with a slow degeneration of neurons during this period, there is functional compensation in the CNS [40, 41]. The new genetic evidence makes this a compelling hypothesis in the pathogenesis of HD and other repeat disorders. This prescient paper has notably only been cited eleven times in 13 years [34].
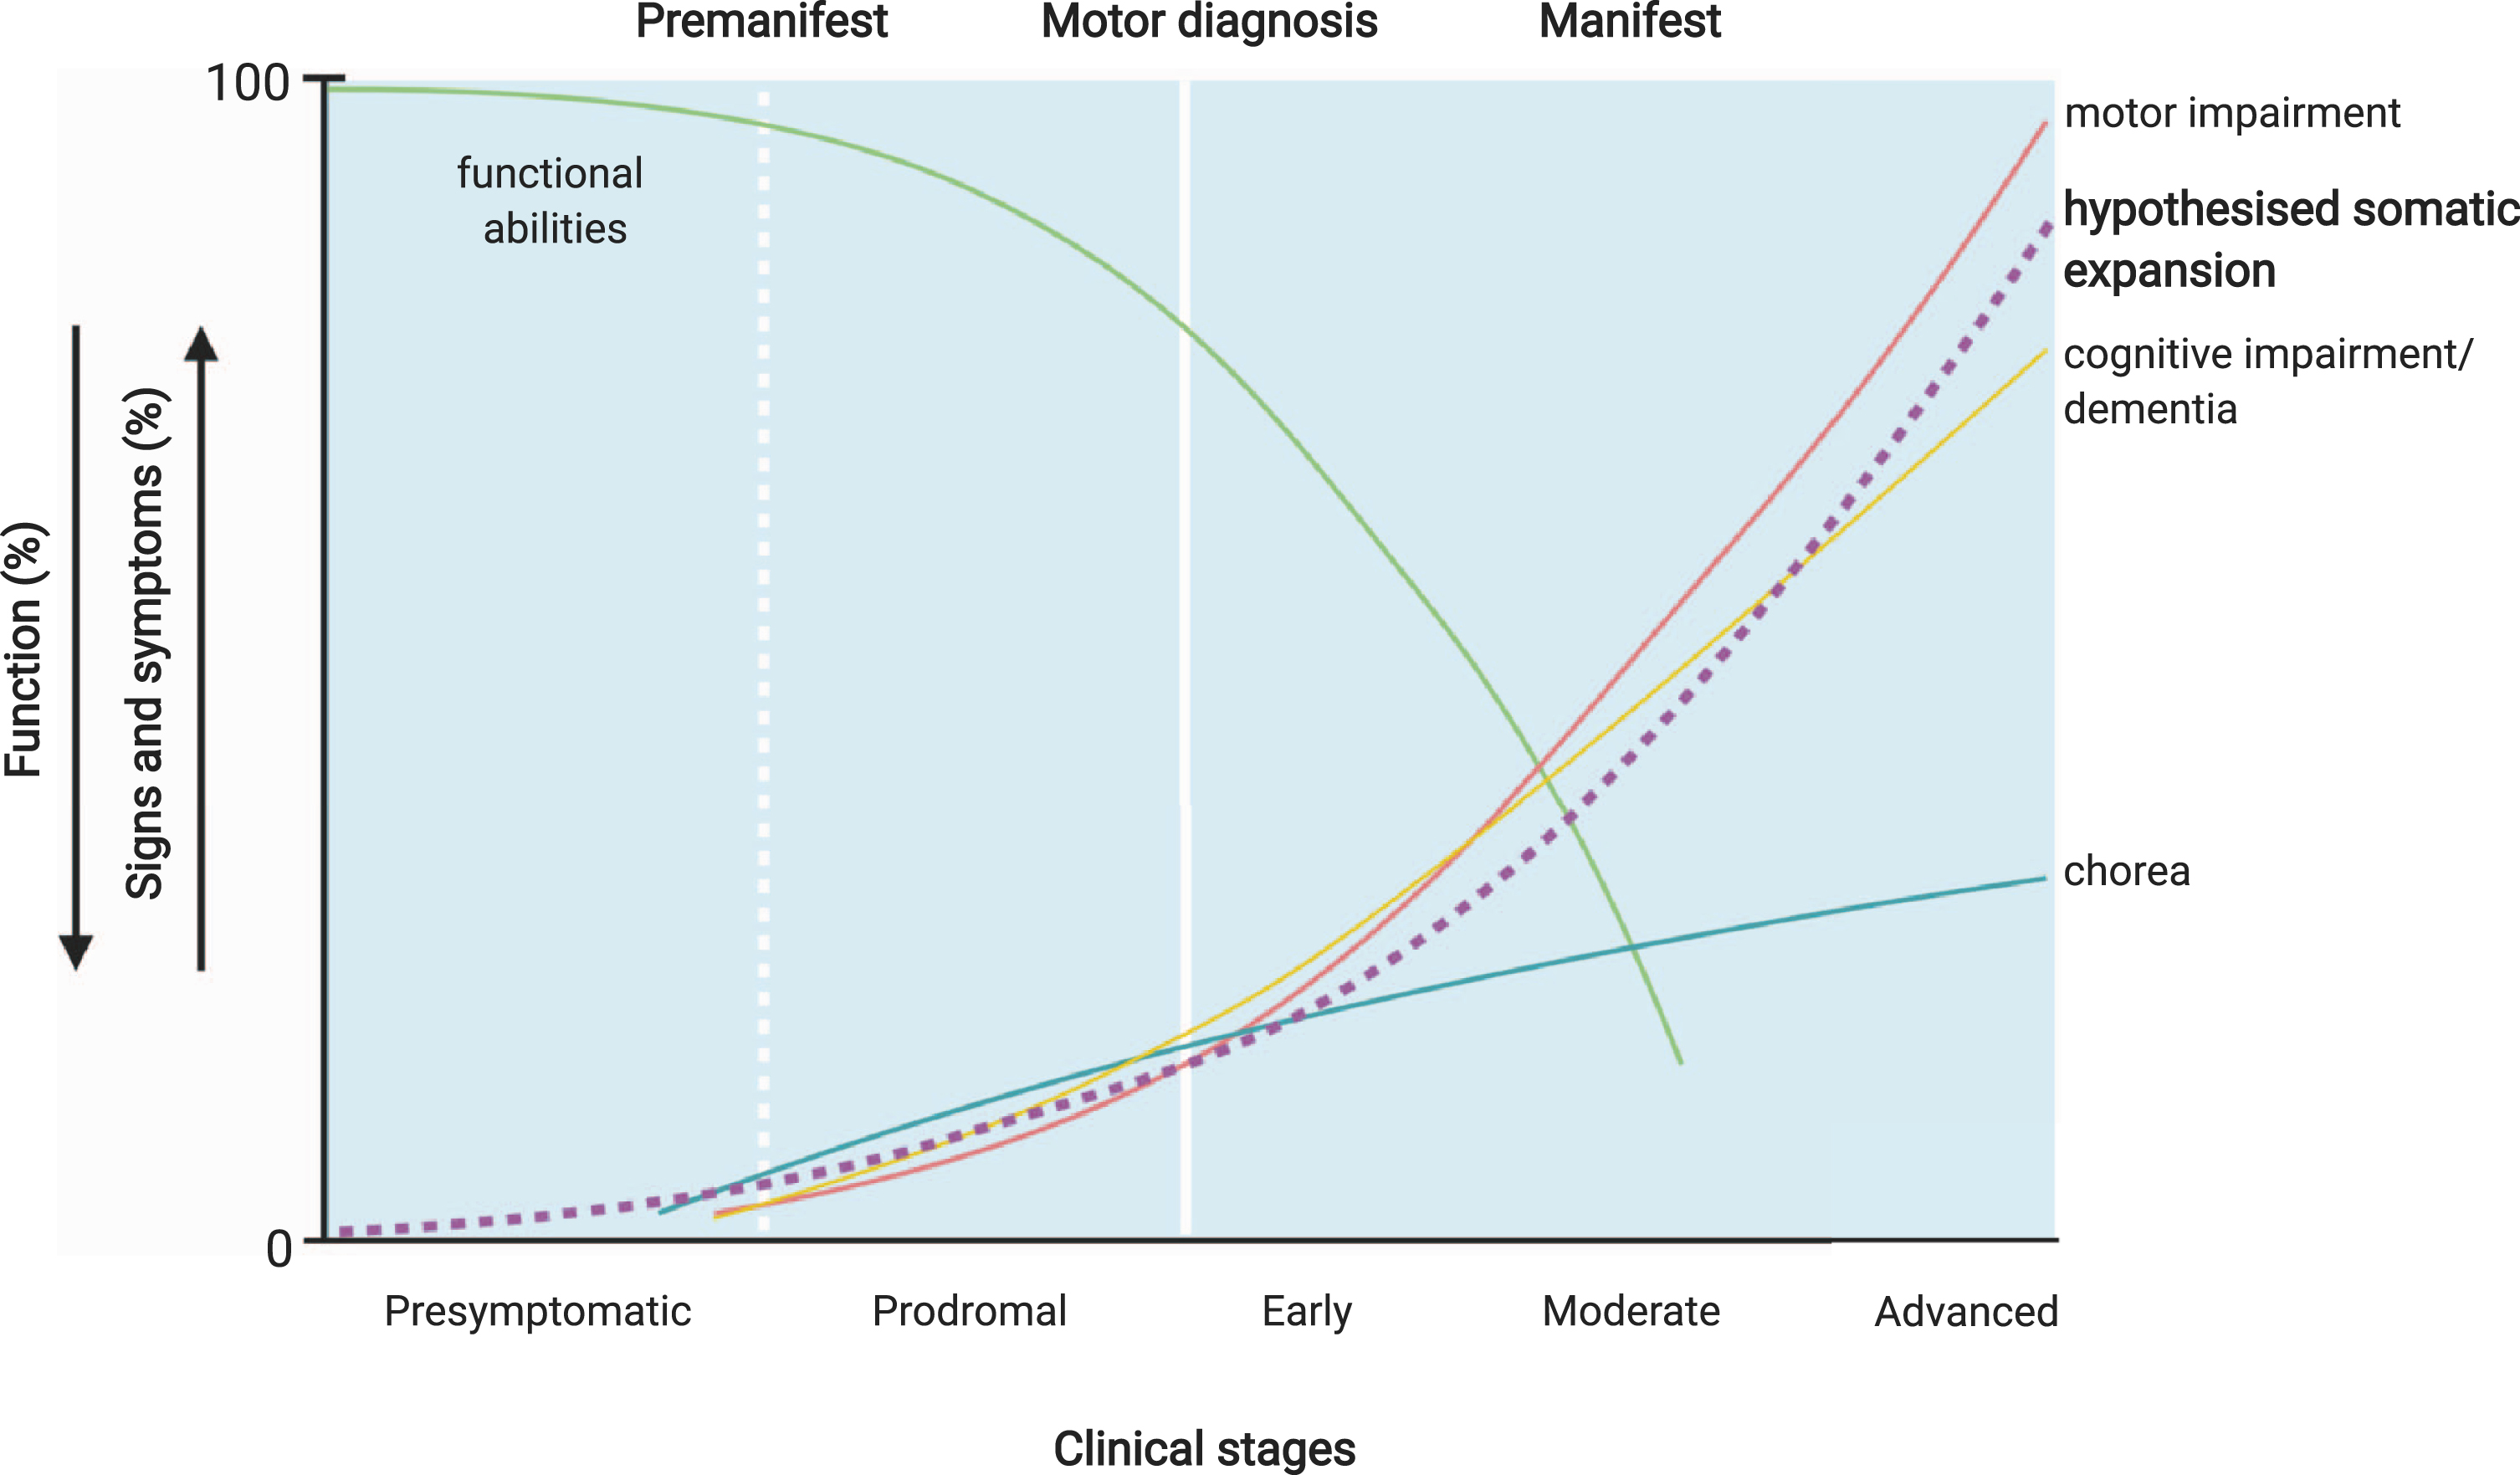
Potential relationship of CAG tract expansion and clinical Huntington’s disease events. The premanifest period of the disease may reflect the presence of a proportion of disease-relevant cells with sufficient somatic expansion to induce neuronal dysfunction, but too few to manifest overt clinical symptoms. Premanifest HD includes a presymptomatic period where no signs or symptoms are present, and prodromal HD, characterised by the onset of subtle signs and symptoms, which may be the result of the HTT CAG length expanding beyond an unknown pathogenic threshold in increasing numbers of disease-relevant cells. Manifest HD— characterised by chorea and gradual worsening of motor and cognitive difficulties— may then arise once a significant number of disease-relevant cells have passed this threshold. Somatic expansion in susceptible cell populations is likely to be occurring throughout the premanifest and prodromal stages of disease as indicated by the hypothetical dashed line, although the actual trajectory of this expansion will depend on the inherited repeat length and is likely to differ in different cell types. Therefore, the relationship between the trajectory of somatic expansion and clinical phenotypes is currently hypothetical. Figure adapted from Ross et al. [45] and Bates et al. [3] and created using BioRender.com.
The in silico modelling of Kaplan et al. [34] predicted that the intracellular pathogenic CAG length threshold in HD was 115 CAG. However, the confidence intervals for this threshold are wide (95% CI 93– 170 CAG), possibly due to the model being fitted to a relatively small sample (n = 336). Do we have any evidence that would allow us to determine whether 115 CAG is a reasonable estimate of the threshold, or to refine that wide confidence interval? This is critical, as under this scenario, the period of an HD at-risk subject’s life before such a threshold is reached is a window of opportunity for therapies that address the expansion of the repeat (Fig. 2). It is potentially a large window as expansion is likely to occur throughout life [26, 42– 44] and at-risk subjects remain largely indistinguishable from their non-HD at-risk peers for a substantial period of that time [39].
There are some potential clues to the intracellular pathogenic threshold. We might be able to improve the definition of the edge of the pathogenic thresholds using data from mouse models. In mouse models the repeat is normally expanded to 100 CAG or more in order to induce a disease-like phenotype in the short-lived mouse [46, 47]. Even in the presence of tracts of over 100 CAG in their Htt gene, mice may only develop subtle phenotypes late in their lifespan. Other diseases where a CAG tract is translated to a polyglutamine tract may also offer some clues about thresholds for intracellular CAG toxicity [4, 48– 50]. Possible inferences from these sources of evidence are discussed below.
EVIDENCE FROM HD ANIMAL MODELS
There are many animal models of HD generated in a number of different ways (Table 1). They can be divided into those expressing transgenes with a truncated section of human HTT carrying the CAG tract, or full length human HTT, and those with long CAG tracts replacing mouse Htt in one way or another [3, 51]. Instability of the repeat sequence has been seen in many of the mouse models and was noted in the first HD models ever reported, the R6 series [52, 53].
Animal models of Huntington’s disease with up to 100 CAG repeats
NSE, neuron-specific enolase; CMV, cytomegalovirus; PrP, prion gene promoter. Not reported means no data were available. No means somatic expansion was investigated and not seen.
Although there are multiple rodent models which have been deployed to help us understand the biology of HD and begin the search for therapies, many are limited in their ability to inform us of the effects of genetic modifiers of disease, as they often present with repeats well above the presumed intracellular pathogenic threshold and a severe phenotype. The most useful are those with relatively short repeats (Table 1) though they have differences in their genetic manipulations that make straightforward inferences about the threshold for intracellular pathogenesis complex. They all have either full length human HTT transgenes or human exon 1 replacing mouse exon 1. This may lead to differences in transcription and translation compared with humans. Often several copies of a transgene are present in a genome and RNA and protein expression levels are variable. While the human disease is completely dominant and expression levels of HTT seem irrelevant to disease manifestation and course [84], that is not true in all animal models where expression levels do appear to influence phenotype, as discussed below. Perhaps most challenging is that in many of these models a human HTT gene has been used with a long pure CAG tract. This will almost invariably lead to somatic expansion thus the intracellular pathogenic threshold we are interested in is a moving target— it will have expanded in individual cells from the inherited or engineered repeat length but by an unknown amount. Finally, somatic expansion itself can be transcriptionally mediated [85–87], meaning that alterations in transcription across an expansion prone-repeat may themselves alter levels of expansion.
An added complication is that very long repeats appear less pathogenic than shorter disease-causing repeats, and more prone to contraction than expansion [88], though it is not clear why [89, 90]. The earliest onset and most deleterious phenotypes are seen around 150 CAG with longer CAG tracts giving later phenotypic changes [89–91] though it should be noted that in mice with an inherited ∼150 CAG there is also somatic expansion and the repeat length in the susceptible cells is likely to be longer than 150 CAG. Very long repeat tracts form unusual DNA structures [2] that can inhibit transcription or translation of HTT, though there is evidence that the somatically expanded CAG tracts in DNA are transcribed and translated into expanded polyglutamine-containing mutant HTT (mHTT) [92]. Such very long repeat tracts might prevent downstream events that promote pathogenesis such as production of exon 1 fragments [11, 94] or nucleo-cytoplasmic shuttling [95]. Landles et al. [96] demonstrated that a version of the R6/2 mouse with 90 CAG, R6/2(CAG)90, showed earlier mHTT nuclear aggregation than an R6/2 line with 200 CAG, R6/2(CAG)200, but later phenotype onset. The R6/2(CAG)90 brains contained nuclear aggregates that had a diffuse punctate appearance and remained partly detergent soluble, which correlated with the onset of transcriptional changes, whereas the R6/2(CAG)200 brains had cytoplasmic aggregates that gave larger inclusion bodies which correlated with behavioural changes. Both lines of mice showed somatic expansion of the CAG tract, therefore the exact CAG tract length giving rise to these different molecular sequelae remains unknown. Further detailed studies in animals with less extreme repeat lengths such as this might well yield more insights into the pathogenic mechanism and threshold.
A number of models, still encoding glutamine but using a mixed CAACAG rather than a pure CAG tract, can help to establish a window for a pathogenic repeat length. The mixed CAACAG stabilises the repeat tract [78], preventing germline and somatic expansion.
The BAC HD model with 97 glutamines encoded by a mixed CAACAG tract fulfils this criteria— the mixed CAACAG tract prevents both germline and somatic expansion in mice but is still pathogenic (Table 1) [78]. These mice have 5 copies of the transgene integrated into their genome and express the BAC HD HTT at higher than endogenous levels, estimated at three-fold the level of transcript and 1.5– 2-fold the level of protein. They also notably show functional deficits, but no HTT-positive inclusions, and the translated mHTT protein is largely full-length and mainly located in the cytoplasm [78]. Other sequelae of the mixed tract may exert effects unrelated to CAG expansion: the CAACAG tract is likely to form different DNA structures to pure CAG tracts and this may well affect transcription at the locus. Differential codon usage may further affect translation efficiency of HTT: CAG is used to encode glutamine three times as frequently as CAA in brain tissue [97].
Given the BAC HD line with a stable tract of 97 glutamine-encoding codons has a phenotype [78] this sets an upper bound to the likely intracellular pathogenic length (Table 1). The HdhQ92 mouse with a human exon 1 pure CAG tract knocked into mouse Htt has a late behavioural phenotype and mHTT inclusions. This is one of the minority of HD mouse models that has been assessed systematically for the presence of somatic instability, which is seen especially in brain and liver [60, 99]. This means that the CAG tract length associated with the intracellular pathogenic threshold in these mice is unknown. Similarly the HdhQ72 and HdhQ80 models show some mild phenotypes but also show substantial somatic instability, again with high levels of instability in the striatum, consistent with the HdhQ92 mice [28, 72]. Other rodent lines with CAG tracts of less than 100 repeats might provide further clarification. However, in most of these somatic expansion is likely to occur, though it has not been reported, as a human HTT transgene with a long pure CAG tract was used to generate these mice (Table 1) [54, 100]. If expansion is occurring, in the germline or somatically, it is likely this will provoke changes in phenotype within a cohort. More interesting are the models reported by Levine et al. (1999) with 71 and 94 CAGs. Both have a (coding) interruption in the middle of the CAG tract [64]. The 71 CAG mice have no reported abnormal behaviour and the 94 CAG mice only some minor changes [64]. Given the interruption in the CAG array of the transgene it is likely that somatic expansion is attenuated in these mouse models. These animal models may well be either side of a threshold that defines pathogenesis, so it would be useful to investigate whether they display somatic expansion.
There are additional limitations in extrapolation from mice and other animal models to people [101]. Expression levels of the gene and protein are not necessarily at endogenous levels. Genetically the most accurate animal models are those with long CAGs knocked into their mouse Htt gene (Table1). Most contain a human exon1/mouse Htt chimeric sequence which has the disadvantage of not being a gene that appears in nature at all. There is an allelic series where only the mouse CAGCAA sequence encoding 7 glutamines is replaced in mouse exon 1 [102] (Table 1), but this may not show appropriate human-relevant downstream pathogenic events. Animals are not humans and have inherent limitations such as short lifespans and differences in underlying biology, seen in DNA repair systems and oxidative damage [103], that may well be important in determining the pathogenic threshold in particular models.
While both people with HD and the animal models of disease have development of phenotypic changes over time, animals do not have an age at onset of manifest disease, as at clinical diagnosis in humans. In both people and models the changes seen depend on what phenotypes are examined and how they are measured [38, 105]. The differences in disease manifestation in people are not reflected in mice, because laboratory mice are much less genetically diverse and live in a more uniform environment. Genetic variation in HD subjects influences the presentation of many non-motor symptoms for instance [106]. Most HD mouse models, despite possession of a repeat length that would give juvenile HD with its different clinical presentation, show a similar motor phenotype (though this may be an artefact of how this is measured) (Table 1) [47]. They also display very little frank neurodegeneration, though they often have smaller and lighter brains than their wildtype counterparts [46]. A series of matched knock-in lines with identical glutamine encoding stretches in Htt have been generated: one with pure CAG tracts and a parallel line with CAACAG alternating tracts [51]. These lines encode 45, 80 and 105 glutamines and should reveal the pathogenic threshold in mice provided expression levels are similar in the parallel lines, though the processing of m Htt may still be different in the mouse gene from the human gene. If extrapolating the pathogenic repeat threshold from mouse models is difficult, is it then possible to garner more relevant information from other human diseases caused by similar repeat expansions?
EVIDENCE FROM OTHER DISEASES
Repeat sequences are common in the genome and biologically functional [107] and there is a growing list of diseases caused by expanded repeated sequences in DNA [1, 108]. A series of neurodegenerative diseases are caused by expanded CAG sections in their coding sequence, invariably translated to a polyglutamine tract [109]. These diseases have some striking similarities: the repeat threshold at which disease is caused is in most cases a similar length [4, 48], they show a strong relationship of repeat length with age at onset of disease, many show somatic and germline expansion of their causative repeat [31, 110– 112] and they have similar genetic modifiers of their ages at onset [113] (Table 2). This implies that the underlying events leading to expansion of the CAG tracts in these diseases might have common mechanisms that can be used to inform all of these diseases, though the molecular pathogenic events downstream of the CAG tract may be specific to each disease.
Evidence from human CAG-repeat disorders
Table 2 shows the diseases caused by expanded CAG tracts where the repeat is definitely or likely to be translated to a polyglutamine tract in the cognate protein— it is perhaps of relevance that most of the polyglutamine protein products have a role in DNA repair [33, 114]. Only spinocerebellar ataxia 6 (SCA6, OMIM 183086) shows no evidence of somatic expansion of the CAG tract, though there is genetic anticipation in families, implicating germline expansion [115–117]. SCA6 may therefore be an exception, not requiring intracellular somatic expansion to elicit pathogenesis. The CAG tract disease range is shorter than in the other diseases, and the repeat occurs in CACNA1A, encoding a calcium channel. Nuclear inclusions are seldom observed [118–120], and as in SCA2 (OMIM 183090), are mainly cytoplasmic, thus it is likely that the cell toxicity in this disease is mediated through other, protein-based, mechanisms [121]. SCA7 (OMIM 164500), SCA12 (OMIM 604326), dentatorubral-pallidoluysian atrophy (DRPLA, OMIM 125370) and spinal and bulbar muscular atrophy (SBMA, OMIM 313200) show no repeat tract interruptions and all have at least some evidence of somatic expansion (Table 2). Interruptions are present in the CAG tracts of the causative genes for SCA1 (OMIM 164400), SCA2 (OMIM 183090), SCA3 (also known as Machado-Joseph’s disease, OMIM 109150), and SCA17 (OMIM 607136), though loss of interruptions is associated with disease-causing alleles in SCA2. These diseases are perhaps most informative in our quest to define the pathogenic CAG length range, as interruptions are known to stabilise expanded tracts, such that the inherited allele repeat length is likely to be the maintained in most cells. Information on the extent to which interruptions reduce the rate of expansion and delay age at onset could be used to modify the Kaplan model and thus improve the estimate of the pathogenic threshold.
SCA1 disease-causing expanded CAG tracts are 39 CAGs or more with no interruption, or 45– 81 with interruptions. Lack of interruptions gives earlier disease onset [135] and in uninterrupted alleles there is a strong length correlation with age at onset [127]. The interruptions are CAT, encoding histidine rather than glutamine, and the later onset of disease was assumed to be mediated by the resulting change in the protein [126], but it appears more likely to be mediated at the level of DNA by the somatic expansion widely seen in this disease [123, 179]. The pathology of SCA1 is concentrated in the cerebellum with a characteristic early and severe degeneration of the Purkinje cells [4] although recent evidence shows that subjects have widespread degeneration in deep cerebellar structures and the brainstem as well as cerebral pathology [180]. In postmortem SCA1 human brain, the highest levels of somatic expansion are not seen in the cerebellar regions and the Purkinje cells most affected in the disease [129], though at the end stage of disease the earliest affected cells may have been lost. Additionally, Purkinje cells are low in number compared with other cerebellar neurons [181], and thus rare, large expansions in these cells are likely to be underestimated when looking at whole cerebellar tissue. However, elegant work in mice has shown that it is likely to be protein interactions, particularly with capicua, that drive cell-specific intracellular pathogenesis in the Purkinje cells [182, 183]. Nevertheless, somatic expansion may drive other pathogenic events in SCA1: a similar genetic modification signal was seen in SCA1 as in HD, implying that age at onset is at least partly modulated by similar events in both diseases [113].
SCA2 is more complicated. Most CAG tract alleles have CAA interruptions, but may also be interrupted by CCG, encoding glycine. Pure CAG tracts over 34 CAG cause the ataxic phenotype of SCA2 [5, 145], but interrupted alleles in what would normally be considered the long normal or low SCA2 range (see Table 2), give a Parkinsonian or amyotrophic lateral sclerosis phenotype [138, 184]. No evidence of somatic expansion has been seen in the phenotypes associated with interruptions [149, 150] but it is seen in SCA2 [140].
SCA3 is perhaps the most interesting and informative of the SCAs with respect to the CAG length pathogenic threshold. Normal alleles may have repeat lengths up to 44 CAG, whereas disease-associated alleles range from 52– 75 CAG, with most disease alleles harbouring repeat lengths of over 60 CAG (Table 2) [48]. There is a window where no repeat lengths have been reported between the normal and disease ranges in SCA3 as in DRPLA, SCA12 and SCA17. The CAG tract is usually interrupted by two CAAs and there does not seem to be an association between the presence of interruptions and phenotype. Notably the somatic mosaicism observed is of the order of a few repeats even in the presence of CAG tracts of 70– 80, and expansions are more prevalent in peripheral tissues than in nervous tissue [153, 154]. Though these analyses are in relatively few brains and do not use techniques that would reveal individual large expansions, nevertheless this appears to be a more stable CAG repeat tract than in HD or SCA1 for instance, especially given the CAG tract length. This provides a repeat tract length for neurodegeneration of a minimum of 60 CAG in SCA3.
SCA17 is caused by an expanded mixed CAA/CAG tract in TBP. The normal repeat number in TBP is up to 40 CAG/CAA, reduced penetrance alleles have 41– 48 repeats, and full penetrance alleles carry more than 48 CAG/CAA repeats. These interrupted repeats have a complex structure [185, 186] (Table 2). SCA17 predominantly occurs in subjects who do not carry a central CAACAGCAA interrupting sequence. The instability of the expanded CAG repeat is dependent on repeat configuration, and CAA interruption is a limiting factor for further CAG repeat expansion [166]. There is some germline instability, raising the possibility that there is some somatic expansion also occurring despite the non-pure CAG tract.
There are limitations to extrapolating from other diseases. They have different pathologies and different susceptible cell types. Notably in most of these diseases regional pathology and somatic expansion are not correlated, but relatively few subjects have been analysed in anatomical detail and only one study conducted at the single cell level. This study, measuring somatic expansion in single cells in DRPLA, compared somatic mosaicism in cerebellar structures in early versus late onset patients [173]. Higher rates of expansion were more evident in late onset case than early onset cases, though this may well be a function of age [88, 187]. The frequency of expansions was highest in glial cells, with Purkinje cells lower and granular cells lower again. Relative levels of expression of the cognate genes in the most susceptible cells are not known, but are assumed to underlie differential spatial pathogenesis [121, 188], and transcription appears to be important in promoting somatic repeat tract length changes [85– 87, 189– 192]. Finally, surviving cells that are examined in post-mortem human brain may be resistant to the ongoing toxicity mechanisms and therefore uninformative about the intracellular pathogenic repeat length threshold.
MOUSE MODELS IN OTHER REPEAT DISORDERS
There are multiple mouse models of each non-HD polyglutamine repeat disorder, most of which have not had somatic expansion of the repeat surveyed systematically (Table 3). Most alleles were cloned from patients as transgenes or knocked into the endogenous mouse genes, and often required longer CAG repeat lengths than in humans to evoke a phenotype. As in HD animal models, transgenic mouse models of these diseases often demonstrate severe early-onset neuropathology and behavioural syndromes whilst knock-in mouse models tend to show milder late-onset phenotypes that perhaps parallel the disease more accurately, but are slower to produce phenotypes. Consistent with animal models of HD, animal models of other triplet repeat disorders tend to show increased disease phenotype as CAG repeat length increases, though this is influenced by the promoter used, transgene copy number and resultant transgene expression. Cemal et al. [193] generated a series of eight YAC SCA3 models and found that disease severity increased both with an increased CAG repeat tract length and an increased transgene copy number such that an animal with 72 CAG and one copy of the transgene developed symptoms later than an animal with 67 CAG repeats and two copies of the transgene.
Animal models in other repeat disorders
FL, full length; Prp, prion protein; NSE, neuron specific enolase; NIIs, neuronal intranuclear inclusions; DCS, diffuse cerebellar staining; DNS, diffuse nuclear staining; CI, cerebellar inclusions.
In some cases, allelic series have been ‘naturally’ generated through intergenerational expansions or contractions following extensive breeding [196– 198, 225]. These models allow us to explore the effect of CAG repeat length in a well-controlled system. One such system is a series of transgenic DRPLA mouse models carrying 76, 96, 113 and 129 CAG, whose motor deficits and cognition worsen with CAG repeat length and age. High levels of somatic expansion were observed in the cortex, liver and kidney of the Q76 mice [196], and although no behavioural phenotype was initially reported in the Q76 after 64 weeks, they showed reduced survival and body weight when compared with non-transgenic littermates [197] as well as neuronal intranuclear accumulation [196]. Again, repeat instability is likely to occur in all models, but was only examined in Q76 animals.
Genomic context is an important driver of repeat instability in these models. Early studies of independent transgenic mouse models of SBMA with 45 AR CAG repeats revealed no behavioural phenotype at this repeat length, but did highlight the importance of genomic context in mediating intergenerational repeat instability in mice possessing repeats at the lower end of the pathogenic range [249, 250]. Consistent with this, a knock-in mouse model of SBMA with 48 AR CAG repeats demonstrated no overt behavioural phenotype at 23 months but did show changes in gene expression. Genomic context also appears to govern intergenerational and somatic expansion in a mouse model of SCA7 [240].
Marked repeat instability has been observed in a transgenic mouse model of SCA3, CMVMJD94, which carries 94 CAG repeats [225]. Expansion was observed in multiple tissues, but within the brain mosaicism was most notable in the pontine nuclei, substantia nigra and striatum. Somatic instability correlated well with neuronal atrophy and gliosis in the pontine nuclei and substantia nigra, but pathological involvement was not seen in the striatum [225]. Another mouse model of SCA3, Ki91, and a mouse model of SCA1, Sca1154Q/2Q, also demonstrate similar tissue-specific patterns of repeat expansions, with notable expansions in the striatum [207, 224]. This extends to other repeats— the same tissue distribution of expansion is seen in models of myotonic dystrophy [187]. These data suggest that whilst repeat instability is not associated with cerebellar neuronal vulnerability in models of SCA, it is likely that repeat instability in areas other than the cerebellum might contribute to disease pathogenesis [259]. Intergenerational instability has been observed in numerous models of SCA3 despite the interrupted CAG tract; this could be due to the presence of a long uninterrupted stretch of CAG at the 3’ end of the tract [222, 227]. These findings suggest that somatic instability is occurring in these model systems.
Some models have allowed us to examine the substantial effect that inheriting only 1 or 2 CAG additional repeats may have on phenotype [225]. SCA3 mice with 83 CAG repeats did not demonstrate behavioural differences, yet SCA3 mice with 94 CAG repeats and similar expression levels demonstrated rotarod deficits and behavioural abnormalities from 16 weeks. It was concluded that the threshold for disease in this model was between 84– 94 CAG repeats. Analysis of data from two cohorts of Q94 also revealed an inverse correlation between the length of the CAG repeat tract and the time spent on the rotarod [225].
Whilst animal models have been invaluable in examining pathogenesis in these diseases, as in HD models, to date, it has been difficult to show directly that somatic expansions are causative to neuronal dysfunction, earlier age at onset and faster disease progression. Interpretation of results is difficult when repeat sequence and length are not clearly defined or have not been examined. Many of the issues that arise in the HD animal models also arise in animal models of other repeat disorders and for many of the same reasons. However, the conclusion from human CAG repeat disorders, and also the corresponding mouse models, would indicate that a repeat length of less than 100 CAGs is toxic to cells— at the shorter end of that estimated by Kaplan et al. [34]. Exactly where the intracellular pathogenic threshold falls remains unclear, but the evidence would place it at over 60 CAG. The question remains whether it is possible to define the intracellular pathogenic threshold more accurately.
WHAT EVIDENCE DO WE NEED TO REFINE OUR DEFINITION OF THE INTRACELLULAR PATHOGENIC THRESHOLD?
The parameters used to establish the CAG-length threshold for HD pathogenesis by Kaplan et al. [34] included the CAG size threshold for disease to arise, the subject’s inherited repeat length as measured in blood, and their current age: these data are available. However, they also require a measure of the cell group critical portion— of the most susceptible cell population(s), what proportion have died, or are dysfunctional, at onset of clinical disease? The final unknown, for HD and the other repeat diseases, is the basal expansion rate of the repeat over time. In HD, the cell group critical portion can be estimated from previous work that showed around half of the most susceptible D2R-expressing medium spiny neurons in the striatum have been lost at onset [260–262]. This parameter could likely be estimated in living subjects from imaging data, as recent well-standardised structural imaging and clinical data has been collected in prospective studies in both manifest and premanifest subjects [38, 263].
The basal expansion rate of the repeat in the most susceptible cells is much more difficult to measure or to derive from existing data. Given the likely stochastic nature of the allele expansion process and the data available in human brain which indicates very long repeats in some cells [24], this will be hard to estimate. However, the very long repeats could be rare events and indeed, could be protective in those surviving cells, as such repeat lengths are seen to reduce phenotype severity and delay onset in mice [90]. The most useful data are likely to come from single cell approaches in a combination of human and mouse brain. It would be ideal if all the data we needed could be derived from human brain, but this is unlikely to be sufficient as human postmortem brain is at the end stage of disease, and the only cells that can be surveyed are those that have survived. These are likely not representative of those that died earlier, and they may well themselves have been dysfunctional at death. Nevertheless, given this is likely a stochastic process there might be surviving cells at different points in the pathological trajectory that could be used in single cell experiments to define the pathogenic CAG tract length threshold. There are methods to sequence and size the HTT CAG tract accurately [264, 265], which could potentially be applied to single cells, but these would have to be tied to the single cell RNA gene expression data— achievable, but technically challenging.
Mouse brain is likely to offer a clearer picture of the dynamics of the pathological process, as tissues can be taken across the lifespan of the mouse and can be processed immediately to generate high quality single cell data. One major disadvantage of most HD mouse models is that they show little frank neurodegeneration, and in this respect do not recapitulate the human disease, but rather display neuronal dysfunction. However, for some analyses this is an advantage. Current data indicates that HD cellular dysfunction can be measured by single cell RNA-seq [266–268], though the disconnect between behavioural and gene expression changes observed by Landles et al. [96] may make this difficult to interpret. The barrier here is gaining a measure of HTT CAG tract length in individual cells and matching that up with the gene expression signature of the same cells— the same technical challenge as noted above in human brain but perhaps easier to overcome in mouse brain. Single cell studies in mouse brain would also be a way to answer a long-standing question in HD: do vulnerable neurons die because of intracellular pathological events induced by the CAG tract, as we argue here, or do they die because of aberrant intercellular events, or both [269–271]? In addition, mice with a shorter repeat length than those currently widely used in HD research will be necessary to examine the intracellular pathogenic threshold as they will need to start with a repeat length below that threshold. Another advantage of mice is that blood and brain somatic instability can be directly correlated. If this relationship can be established then it may be possible to extrapolate to human subjects where only blood is available.
Using the age at onset genetic modifier data obtain-ed in people might help to establish the pathogenic threshold. The effect sizes and directions of the known modifiers can be used to construct a polygenic risk score, which here consists of the sum of all known modifier alleles, weighted by the effect of each allele on onset [272]. This score can be used to predict somatic expansion in individuals without requiring expansion to be measured directly, thereby greatly increasing sample size, and may be incorporated into the Kaplan model [34]. This assumes that age at onset is a surrogate for measuring somatic expansion: Ciosi et al. [6] showed that individuals with higher blood DNA HTT CAG expansion have earlier HD onset and that the level of expansion in blood was associated with variants in selected genome-wide significant DNA repair genes from the modifier GWAS [7]. The question then becomes what is the relationship between blood DNA HTT CAG expansion and brain DNA HTT CAG expansion? Again, mice will be the model best able to test this directly. It would also be useful to have a prospective study of somatic expansion in blood in manifest and premanifest carriers to investigate how expansion increases over time and with proximity to onset: this could be performed in TRACK and TRACK-ON [38, 273] though studies of longer duration might be needed to establish longitudinal trajectories of repeat length. Then, if the relationship between expansion in blood and brain can be established experimentally, these trajectories may help infer the pathogenic HTT CAG threshold in the most susceptible cell populations in brain, likely to be neurons [25]. As larger genetic studies are performed in HD the various polygenic risk scores will become more accurate and account for more phenotypic variation. In particular, risk scores estimating somatic expansion directly will be important in improving inferences about the pathogenic CAG length threshold via the Kaplan model. This will require genome-wide association studies of somatic expansion with large sample sizes.
Given the recent interest in targeting somatic expansion of the expanded CAG in HTT, it behoves us to understand just how much of that expansion we need to prevent in order to substantially delay onset and slow the progression of disease. Evidence from animal models of HD and from other diseases caused by expanded CAG tracts place the threshold for cellular dysfunction above 60 CAG but below 100 CAG. Modelling in blood gives an expansion parameter that predicts age at onset [6] and this may prove a useful biomarker especially in clinical trials that target somatic expansion. While the prediction works well at a population level it is not currently clinically useful for individuals. There are substantial differences between individuals that could well be improved by using other peripheral tissues to measure expansion or by improving the model using genetics. As a first step, the CAG length and sequence themselves need to be more accurately measured [20, 274]. It should further be borne in mind that there are likely to be different repeat length dynamics in different cell types and the nature of the rate of expansion in different cell types is unknown. Cellular toxicity may be driven by different mechanisms in different cell types and different diseases. Specifically, in HD, in order to improve power in clinical trials, it would be very helpful to know how the HTT CAG expansion measured in blood relates to expansions in specific vulnerable cell types in the brain, and what influences that relationship. This might allow us to increase the power and shorten clinical trials by using a model that includes blood or other peripheral tissue HTT CAG expansion data, genetic data and imaging data. This could speed up getting treatments to the clinic [275].
CONFLICT OF INTEREST
LJ is a member of the Scientific Advisory Boards of LoQus23 Therapeutics and Triplet Therapeutics. JD, SP, NR and PH have no conflicts of interest.