
Abstract
Remote sensing inversion technology can be used for water quality parameter inversion to realize water quality monitoring in large scale space. The current research on water quality parameter inversion is only for a single satellite. In order to make full use of satellite image resources, the remote sensing images of GF-1B
Introduction
The Mulan River is located in Putian City, Fujian Province, with a total length of about 105 kilometers. Water conservancy facilities are scattered along the coast, providing sufficient water for people’s production and life. It is known as the mother river of Putian people. However, due to agricultural pollution and industrial sewage discharge, the water in the basin is polluted to varying degrees, which has an impact on people’s life and deviates from the beautiful vision of harmonious coexistence between people and the environment. Therefore, the timely monitoring of important water quality parameters of the Mulan River and the effective prevention of water pollution are of great practical significance to the people’s livelihood.
In view of the deficiency that early surface water quality monitoring is difficult to achieve large-scale monitoring, many scholars began to use remote sensing inversion technology to monitor water quality on a large scale. The essence of remote sensing water quality monitoring is to build an inversion model according to the relationship between the spectral characteristics of remote sensing images and water quality parameters [1], and then apply the inversion model to the water body in the remote sensing images to inverse the concentration of water quality parameters, so as to realize water quality monitoring. This method can realize the monitoring of water quality parameters in large-scale space, and has the advantages of convenience, quickness and low cost [2]. With the rise of remote sensing monitoring, some achievements of water quality parameter inversion have emerged. Filipponi [3] studied the remote sensing image of sentinel-2 satellite and analyzed Chl.a and TMS concentration changes of Po River in Italy by c2rcc algorithm, the processing chain proposed by him has practical value in river water quality monitoring and has significant improvements in identifying river spatiotemporal dynamics. Peterson et al. [4] constructed an extreme learning machine model based on Landsat remote sensing images, and used the model to invert and monitor the suspended solids in the Mississippi River. The method of quantifying suspended solids concentration proposed in the study has been experimentally proven to have advantages in suspended solids concentration prediction. Ansper et al. [5] used sentinel-2 remote sensing image to retrieve the Chl.a concentration of Estonian lake. They realized the spatiotemporal dynamic monitoring of Chl.a concentration and proved the applicability of Sentinel-2 satellite image data in inland water quality monitoring. GUO Hongwei et al. [6] respectively used three machine learning models to carry out inversion research on three water quality parameters of small water bodies, namely TP, TN and COD. They proposed a better water quality monitoring strategy for small water bodies. Lucas Silveira Kupssinskü et al. [7] proposes a machine learning technique to predict the concentrations of total suspended solids and chlorophyll-a. During the research process, this technique was applied to two different study areas, and the predicted results were both good. This has certain significance for establishing a universal inversion model for multiple regions.
At present, more and more high-resolution satellites are available, which provides convenience for remote sensing water quality monitoring. However, due to the influence of shooting cycle, shooting angle and weather reasons, few high-quality images of the same water area are captured by a single satellite, resulting in great difficulty in inversion modeling based on a single satellite. Therefore, it is of great significance to build inversion models based on multiple satellites. In this paper, the remote sensing images of GF-1B
Experimental sample acquisitions
Remote sensing image inversion needs to analyze the relationship between water quality parameters and spectral characteristics of remote sensing images. Therefore, two types of data are needed, one is the measured concentration of water quality parameters, the other is the spectral reflectance data of satellite remote sensing images, and these two types of data need to be matched in location and time to form the inversion samples.
The measured water quality data of this experiment are obtained from 11 online monitoring points set in the Mulan River, including longitude, latitude, chemical oxygen demand, ammonia nitrogen concentration, total phosphorus concentration, dissolved oxygen concentration and PH concentration. The time range of these data is from January 2020 to August 2021. The total phosphorus concentration and ammonia nitrogen concentration are important indicators for evaluating water pollution. Therefore, the measured concentration of total phosphorus and ammonia nitrogen are extracted and integrated with the spectral reflectance data to form experimental samples.
GF-1B
The band reflectance of the pixel corresponding to the actual monitoring point is extracted from the preprocessed remote sensing image. The extracted band reflectance and the measured ammonia nitrogen and total phosphorus data form a group of experimental samples. According to this method, a total of 24 groups of sample data are constructed. Among them, 18 groups of samples are selected as the training set to construct the inversion model, and the other 6 groups of samples are used as the test set to verify the inversion model.
GF-1B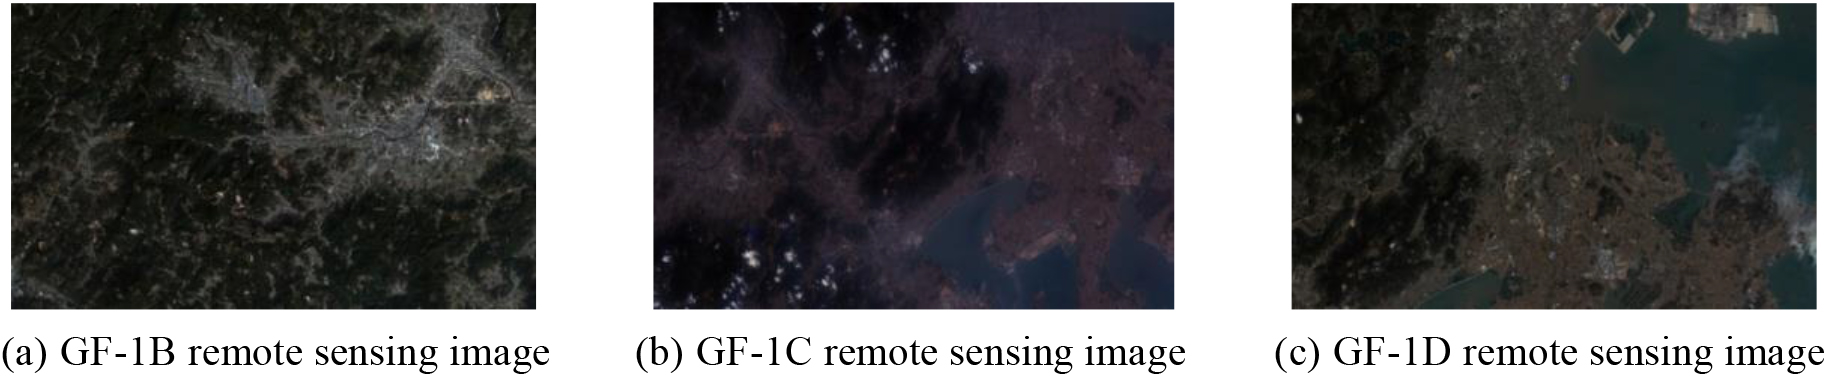
Preprocessed GF-1B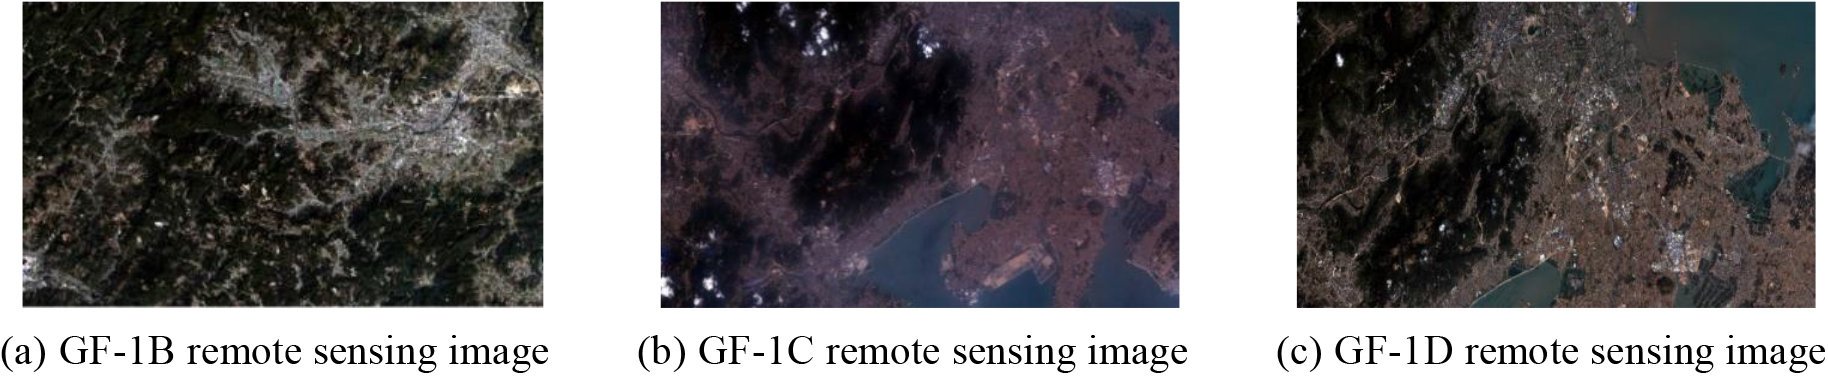
Characteristic band analysis
The remote sensing image of GF-1B
Correlation Analysis between band combination and total phosphorus concentration
Correlation Analysis between band combination and total phosphorus concentration
Correlation Analysis between band combination and ammonia nitrogen concentration
As shown in Table 1,
Linear regression is a widely used statistical analysis method, which can be used to determine the interdependence between variables. Many scholars used linear regression technology for inversion research, and achieved good inversion results. During the experiment, linear regression analysis is carried out on 18 groups of training set samples, with the characteristic band value as the independent variable [9] and the measured concentration of water quality parameters to be retrieved as the dependent variable. Multiple regression equations between dependent variables and independent variables are constructed, including linear regression equation, quadratic regression equation, cubic regression equation, growth regression equation, power function and exponential function. Different water quality parameters and characteristic bands correspond to different inversion models, so the inversion models of total phosphorus and ammonia nitrogen are constructed for each characteristic band.
The reflectance of characteristic bands is taken as independent variables, and the measured concentration is taken as dependent variable for linear regression analysis [10]. The constructed regression equation and corresponding evaluation parameters are shown in Tables 3 and 4. In the tables,
Total phosphorus linear regression inversion model and evaluation parameters
Total phosphorus linear regression inversion model and evaluation parameters
Ammonia nitrogen linear regression inversion model and evaluation parameters
Comprehensively considering the evaluation parameters of each regression equation in Table 3, it is found that the overall performance of the regression equation
Linear fitting diagram of total phosphorus inversion value.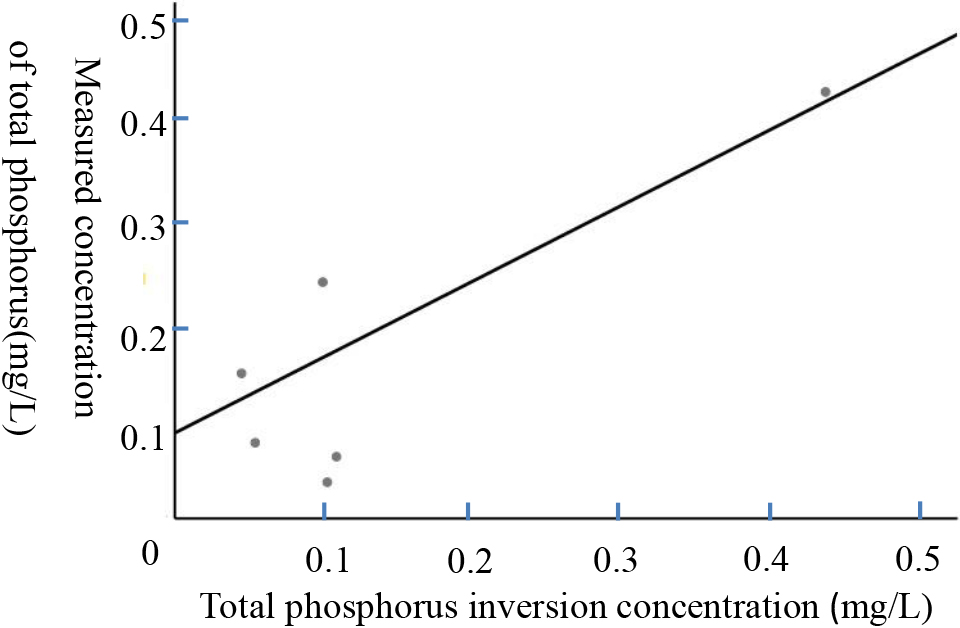
Linear fitting diagram of ammonia nitrogen inversion value.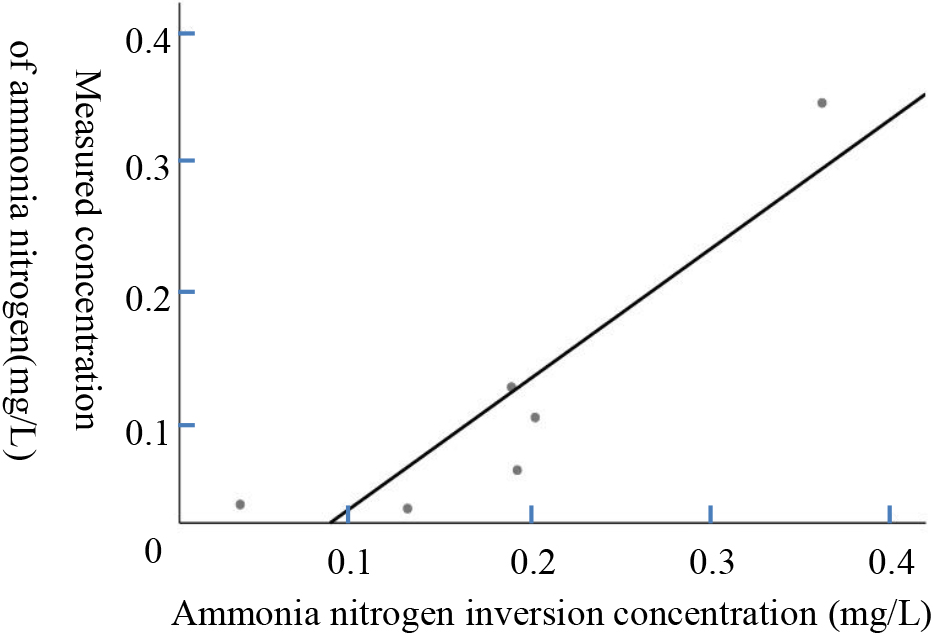
In order to verify the inversion accuracy of the inversion model, the method of cross validation is adopted. Eighteen of the twenty-four groups of samples are used as training sets to build the inversion model, and the remaining six groups of samples are used as test sets to verify the accuracy of the model. The inversion model
Evaluation parameters of inversion model
Evaluation parameters of inversion model
The inversion model of total phosphorus and ammonia nitrogen was applied to the GF-1D satellite remote sensing image on March 15, 2021, and the large-scale spatial distribution map of total phosphorus concentration (as shown in Fig. 5) and ammonia nitrogen concentration (as shown in Fig. 6) of the Mulan River in Putian urban area are obtained.
Large scale spatial distribution of total phosphorus concentration of the Mulan River in Putian urban area.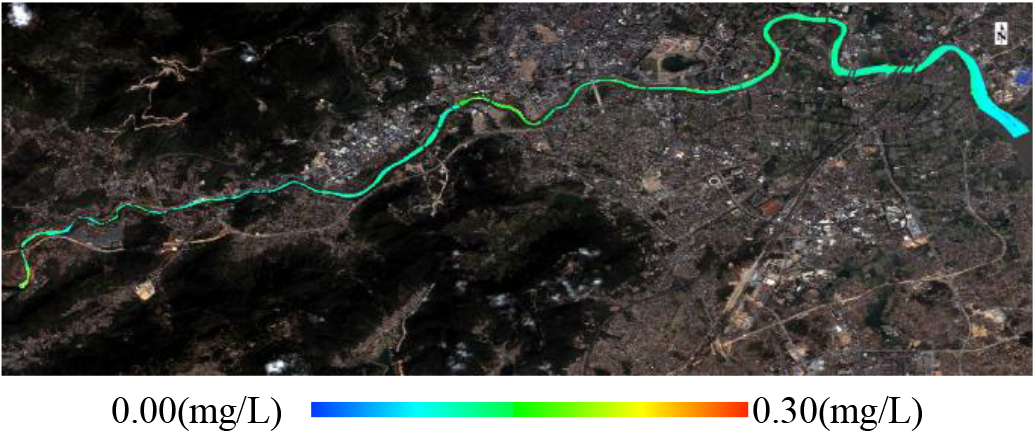
Large scale spatial distribution of ammonia nitrogen concentration of the Mulan River in Putian urban area.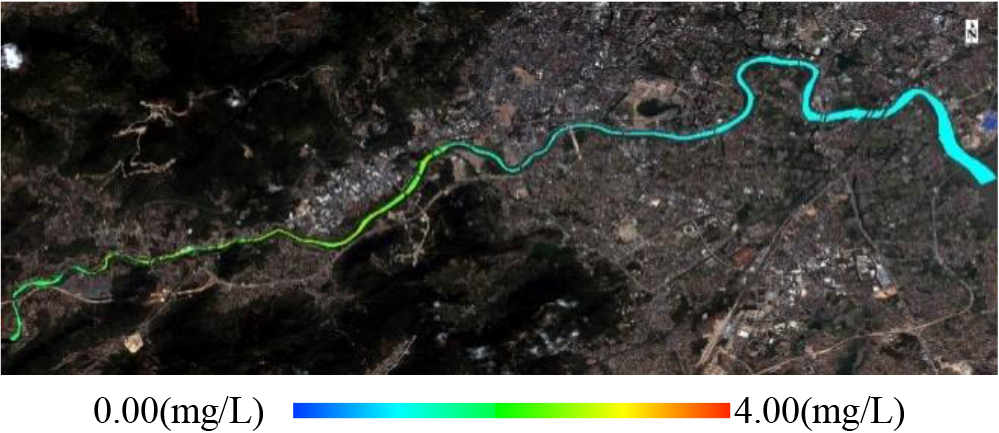
According to the analysis in Fig. 5, the total phosphorus concentration in Putian urban area of the Mulan River remains stable and at a low level as a whol In some areas, such as the southern section of Mulan Avenue and the section from the Mulan River Bridge to Gangcheng Avenue, due to the accumulation of sediment in this section, total phosphorus is adsorbed here, leading to an increase in local concentrations. The peaks reached 0.27 mg/L and 0.24 mg/L, respectively. The total phosphorus concentration in some areas along the northern coast of the river section in Licheng District is slightly higher, varying in the range of 0.10–0.20 mg/L. According to the survey, residential areas, industrial areas and commercial areas are scattered along the river, and the increase of total phosphorus concentration should be greatly affected by industrial direct discharge. According to Fig. 6, the ammonia nitrogen concentration in the Putian urban area of the Mulan River shows an overall trend of low in the east and high in the west. In the east, the ammonia nitrogen concentration in the reaches of Licheng District and Hanjiang District is relatively low, with a variation range of 0.34 to 0.61 mg/L. In the west, the concentration of ammonia nitrogen in the river section of Chengxiang District is relatively high, especially in the section west of the Mulan River Bridge, which is a farmland area, the river section is affected by agricultural pollution, with an ammonia nitrogen concentration of 3.37 mg/L. The concentration of ammonia nitrogen in the southern section of Mulan Avenue in the west has once again decreased, with a maximum peak of 0.77 mg/L.
Classification and distribution of total phosphorus water quality of the Mulan River in Putian urban area.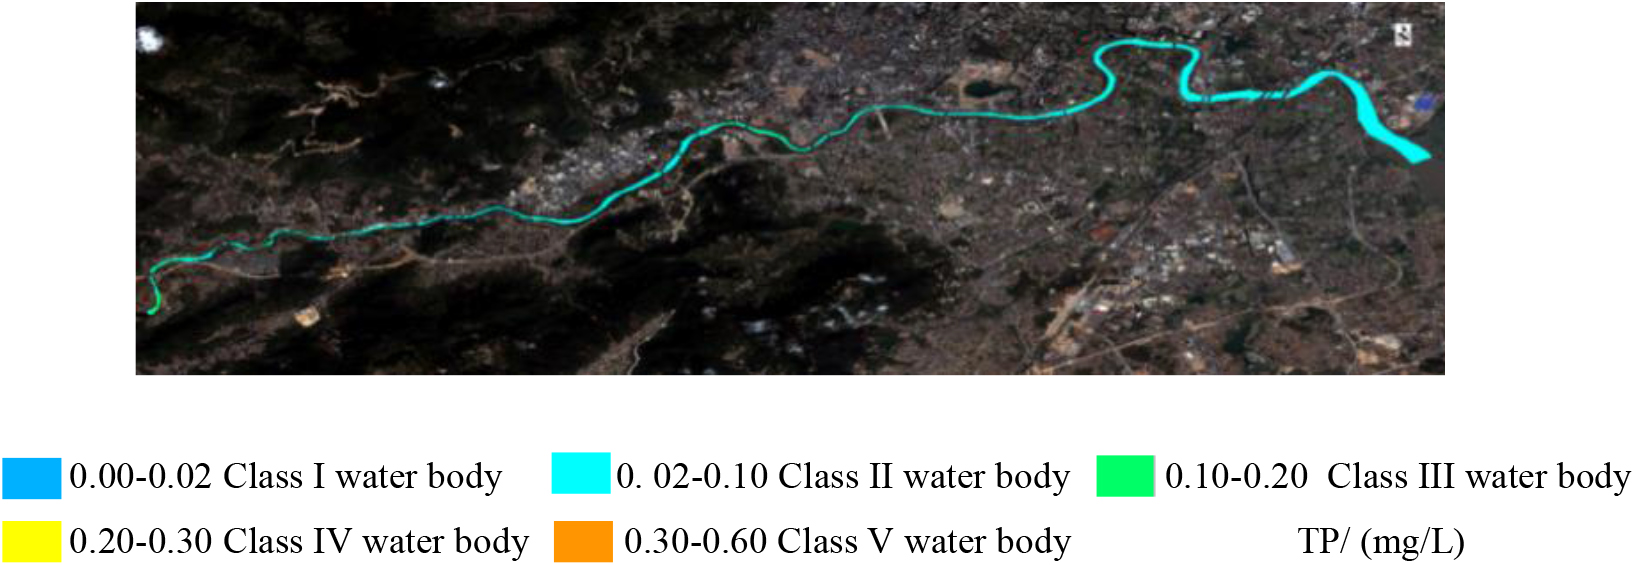
Classification and distribution of ammonia nitrogen water quality of the Mulan River in Putian urban area.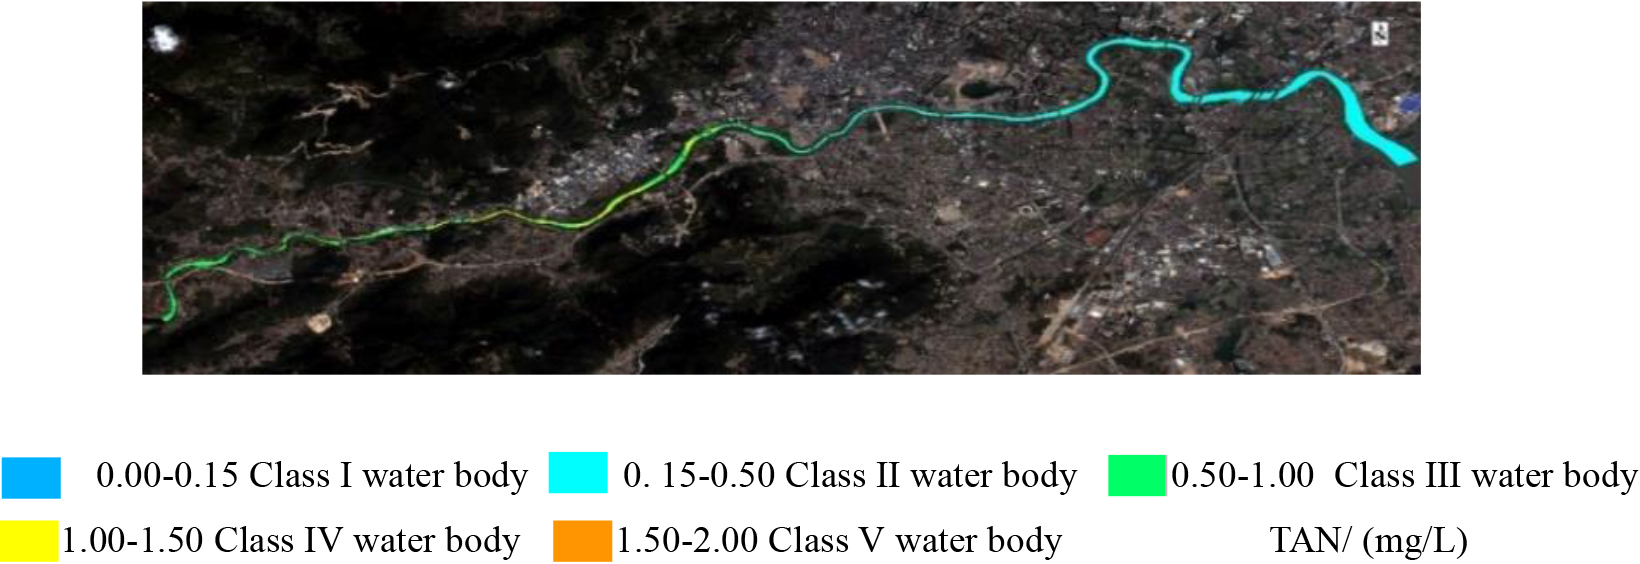
Furthermore, the total phosphorus concentration and ammonia nitrogen concentration of the Mulan River in Putian urban area are divided according to the evaluation standard of surface water environmental quality standard bd3838-2002. The divided results are shown in Figs 7 and 8 respectively. According to Fig. 7, the water quality classification of total phosphorus of the Mulan River in Putian urban area is generally good. Except that the section south of Mulan Avenue meets the class III water quality standard, other water bodies meet the class II water quality standard, indicating that the total phosphorus content of the Mulan River in Putian urban area meets the water quality standard of domestic drinking water. According to Fig. 8, the difference of ammonia nitrogen classification of the Mulan River in Putian urban area is obvious,the ammonia nitrogen content in the river sections of Licheng District and Hanjiang District reaches the class II water quality standard. The ammonia nitrogen content in the river section of Chengxiang District is significantly higher, the water quality of the section south of Mulan Avenue meets the Class III standard, and the section west of the Mulan River Bridge can only meet the class IV water quality standard, indicating that the ammonia nitrogen content of the Mulan River in Putian urban area is generally high, and the water quality grade of ammonia nitrogen is low.
It can be seen that the water quality of the Mulan River in Putian urban area ranges class II to class IV. This shows that the water quality of the river has been improved in recent years with the strengthening of the governance, but there are still pollutants exceeding the standard in some water areas. The water environment needs to be further improved in order to meet the functional division of the river, people’s pursuit of a better life and the needs for ecological environment protection.
The remote sensing images of GF-1B
This research can monitor the water quality of the Mulan River in large scale in real time, which is more convenient and quick in analyzing the water pollution, and has application value in the monitoring and protection of water environment. Due to the limited experimental data, the accuracy of inversion is affected to some extent. In the future, we will continue to collect experimental data, increase the number of inversion samples, further conduct experimental modeling, and improve the accuracy of GF-1B
Footnotes
Fund
The work is supported by 2023 Scientific and technological Research Project of Higher Education Institutions in Hebei Province (Grant No.ZC2023123) and S&T Program of Hebei (Grant No.21370103D and 21373301D).