
Abstract
As the goal of “double carbon”, integrated energy systems aiming at the development of low-carbon economy are developing rapidly, and carbon capture and other emission reduction technologies are gradually gaining more extensive development space. For controlling carbon emissions and enhance the consumption of renewable energy. This work proposes to introduce carbon capture technology in the framework of integrated energy system and optimize the energy dispatching of integrated energy system in multiple time scales, and design a multi-time scale optimization model of integrated energy system with carbon capture. Based on the basic architecture of a low-carbon integrated energy system, this study analyzes the power characteristics of each unit of the integrated energy system, which consists of thermal power units, gas turbines, electric boilers, batteries, gas storage, heat storage, etc. By studying the energy conversion and storage processes of each unit, a power model of each unit of the integrated energy system is established. On this basis, the relationship between carbon emissions and unit output of thermal power units and gas turbines was studied, and a carbon emission model for the energy supply unit in the comprehensive energy system was established. At the same time, in order to solve the problem of carbon emission reduction under the day ahead scheduling plan of the integrated energy system, considering the emission reduction goals and system operation security factors, the study analyzed the economic model and carbon emission model of the integrated energy system, established the day ahead low-carbon scheduling model of the integrated energy system, and reasonably planned the output of each unit that can achieve the carbon emission reduction goals on the premise of meeting the balance of supply and demand. The innovation of the research method of this paper is that this paper establishes a multi time scale rolling optimization model under the emission reduction goal of the integrated energy system. Based on the day ahead scheduling scheme obtained in the day ahead low-carbon scheduling phase, the day ahead plan is first revised through 4 h rolling scheduling in the day; Then, with the goal of minimizing the adjustment amount, fine tune the unit output within 15 minutes to provide a daily output plan for subsequent low-carbon emission reduction targets. The outcomes indicate that in the practical application, the carbon emission of the optimized model in the peak hour 11:00 to 12:00 phase is 118 tons, which is 7 tons less than the 125 tons of the traditional model. In summary, it demonstrates that the studied multi-timescale optimization model of integrated energy system with carbon capture has good application. We have studied and analyzed the low-carbon implementation mechanism of coordinated cooperation in multiple time scales, and constructed a multi time scale rolling optimization model, laying a theoretical foundation for subsequent low-carbon scheduling research. This enables the system to formulate more accurate and reasonable scheduling plans, while improving the low-carbon performance and economic benefits of the system, providing reference for the low-carbon development of the power system.
Keywords
List of abbreviations
Formula list
Introduction
As the boost of people’s pursuit for a better life, providing energy supply while ensuring sustainable development of the ecological environment has become a key research element in the field of energy development. Integrated energy systems (IES) can integrate electricity and natural gas (NG) systems for diminishing carbon emissions (CE) by the complementary utilization of electricity and NG [1]. However, there are many different types of equipment in the IES for electricity and NG energy conversion (ENC), and the energy supply methods and renewable energy supply methods are complex and uncertain [2]. For realizing the low carbon (LC) economic management of the IES, the IES is designed for optimizing the multi-timescale operation of the carbon capture (CC) IES in day-ahead (DA) LC dispatch, CE modeling and intra-day real-time LC dispatch [3]. Considering the safety risk of system operation and the goal of energy saving (ES) and emission reduction (ER), a DA LC scheduling model of the IES is established for taking into account the safety risk. Through a comprehensive analysis of the CE model and the economy model of the IES, a LC DA dispatch model (DM) of the IES is established, which can achieve the supply-demand balance and the CE reduction target with reasonable planning [4].
In this context, a multi-timescale optimization model (OMO) of the IES with CC is studied to achieve better ES and ER. The second part is a review of the current research on the conversion and output of IES and energy sources (ESO) at home and abroad; the third part is a study on the multi-timescale OMO of IES with CC, and the first part is a study on the DA LC dispatch of IES with CC, and the second part constructs a DA LC DM of IES with security risks. Section 4 is the validation of the multi-timescale OMO for IES with CC.
Related works
An IES is an energy cycle operation system that allows multiple ESO to be coupled with each other and multiple loads to be combined. Li et al. [5] presented a two-tier optimal model with community IES and electric vehicle charging station (EVCS) in order to achieve energy supply and demand balance, which utilizes a special mechanism and transforms the model into a mixed-integer linear programming model using sequential arithmetic theory. and conducts simulation tests. The results show that the method successfully balances the benefits between community IES and EVCS. Shen et al. [6] proposed a microturbine based dynamic IES in order to coordinate three kinds of systems in various time scales. The system uses singular regression theory to dynamically interact the three energy systems and analyzes the dynamic at three time scales boundary layer of the model. The relevant outcomes demonstrate that the model is workable for coordinating the three energy systems at time scales. Zhou et al. [7] present a special distribution model constructed using a reinforced fuzzy set that contains a matrix of uncertain chance events in the fuzzy set to more accurately evaluate the true distribution probabilities in order to address the resilient operation of integrated heat and power in extreme weather, and the model is The model is validated in three test systems. The test outcomes indicate that the model enhance the algorithm operation with strong robustness. Dawood et al. [8] proposed a hydrogen energy system covering four stages: production, safety, storage and use, in order to investigate renewable clean energy. The results show that the four stages within the system show interdependence, proving the effectiveness of the method.
The problem of conversion and output between ESO is fundamental to the utilization and reform of ESO. Banerjee et al. [9] proposed the converting of solar energy (SE) into chemical energy (CHE) capable of producing high-energy chemicals in order to find sustainable ESO. the study analyzed the basic concepts of polymer photocatalysis and examined covalent organic frameworks such as conjugated polymers, carbon nitrides, and covalent triazines. The findings suggest that the emerging field of soft photocatalysis of SE into CHE has unlimited scope for development. Zhang et al. [10] proposed to design a novel renewable ESO using the osmotic pressure in seawater and river water for enhancing the ENC efficiency. The method customizes nanofluidic channels with ion transport dynamics, and converts the osmotic potential energy into power for output. The results show that the nanofluidic channel is capable of reverse electroosmosis, demonstrating the feasibility of the method. Wang et al. [11] proposed to design a photocatalytic system using semiconductor materials in combination with environmental remediation technology in order to improve SE conversion efficiency, which utilizes bismuth-based photocatalysts for light utilization and analyzes the progress of each nanomaterial in photocatalytic activity. The results show that the use of bismuth-based nanomaterials for photocatalytic scenarios is prospective. Angulo et al. [12] proposed the idea that bubbles in precipitation electrodes affect energy transfer by improving the ENC efficiency, and carried out an analytical study for the effect of bubbles on the electrochemical system, and simulated the electrochemical processes resulting from the bubble evolution based on the bubble evolution process. The results show that bubbles affect the activation as well as the energy efficiency conversion of electrodes with too large concentrations. Carbon capture technology plays an important role in achieving a zero carbon economy. Penu et al. explored the latest developments in membrane based carbon capture technology, including membrane gas separation (MGS) and membrane contactors (MC). The technical status and latest developments of membrane materials were discussed. Then the main challenges of plasticization and physical aging in MGS, as well as wetting phenomena in MC, were discussed, and attractive suppression attempts were made. The results show that membrane. based carbon capture technology has great prospects and challenges at very high CO2 concentrations [13]. Baena-Moreno et al. proposed a modern carbon capture and storage (CCS) technology to reduce the adverse effects of greenhouse gases emitted by power plants on the climate. This technology compared the main capture strategies, including post combustion, pre combustion, and oxygen combustion processes, and also solved the problem of storing and transporting CO2 from one location to another. The results showed that: This technology can capture over 90% of the carbon dioxide generated by power plants and is effective [14].
In summary, the above research on integrated energy systems provides comprehensive energy system solutions for different purposes and needs, which can balance energy supply and demand, coordinate energy systems at different time scales, improve algorithm efficiency, and achieve the production, storage, and use of hydrogen energy. At the same time, various solutions have been proposed for the conversion and output issues between energy sources, including converting solar energy into chemical energy, designing new renewable energy sources using osmotic pressure, improving photocatalytic efficiency using bismuth based nanomaterials, and the impact of bubbles on electrochemical systems. However, the above research content does not focus on energy conversion and energy scheduling with low-carbon goals. IES depend on the conversion and output of various ESO, but it is quite rare to introduce CC technology in the framework of IES of electricity and gas for multi-timescale energy optimization with the goal of LC economy.
Multi-timescale OMOing of IES accounting for CC
This chapter investigates the LC dispatch of IES in view of CC technology, and constructs a LC DM of IES by day, considering the security risks, and validates and analyzes the model through experiments.
LC dispatch study of IES with CC
With the continuous development of social economy, the CE of domestic power industry is rising year by year, and the CC methods used in thermal power plants (TPP) today are oxygen-rich combustion technology, pre-combustion capture and post-combustion capture (POCC) [13]. POCC is the most widely used and developed CC method, as it does not require large-scale adjustments to the power generation system and power system, but only partial modification of the flue gas system of coal-fired units. When converting a coal-fired unit into a CC unit, only two parts, the CC device and the power generation system, need modifying, and the internal ENC distribution method of the coal-fired unit will be changed after the modification [14]. The structure of the CC system is illustrated in Fig. 1.
The structure of the CC system.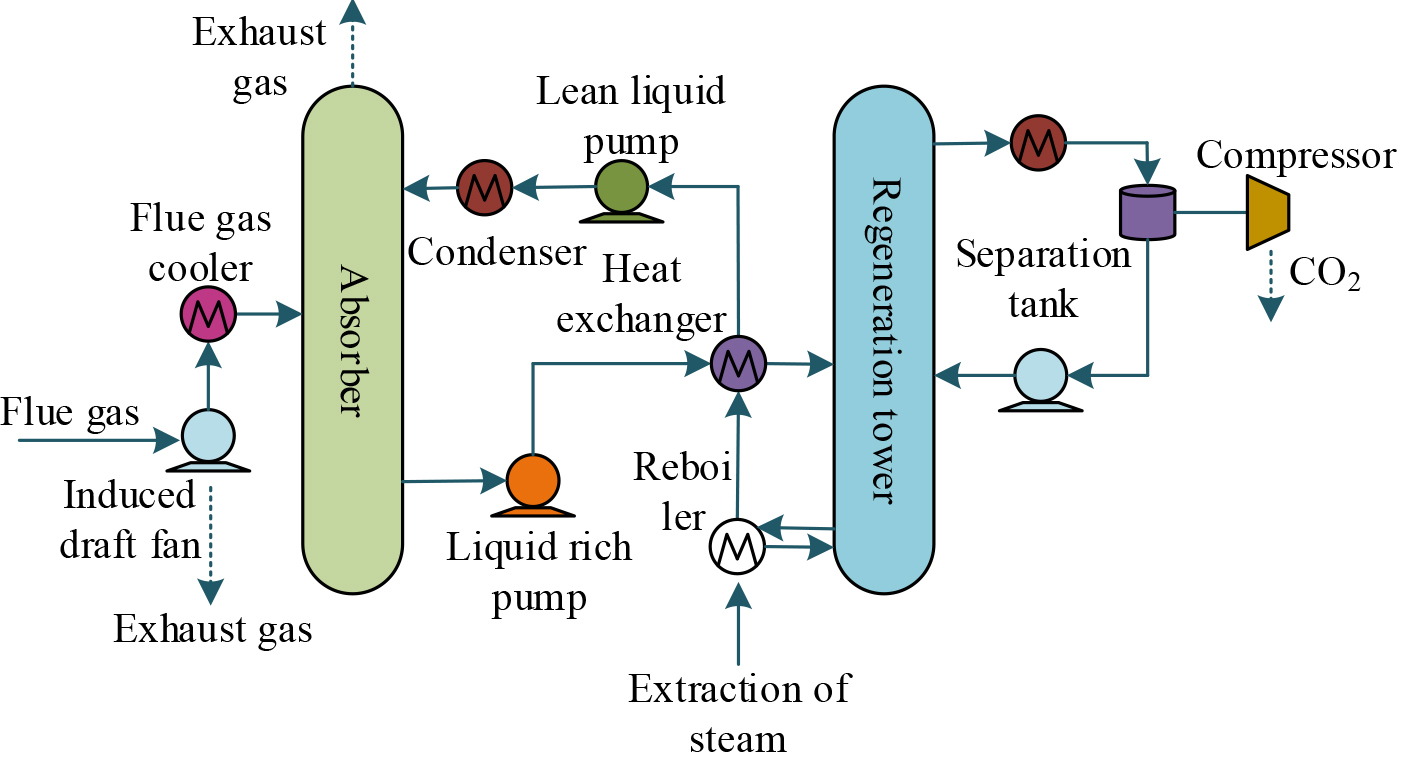
Figure 1 Demonstrates that the carbon capture system structure includes two operating modes: flue gas separation operation and liquid storage operation. The flue gas separation operation refers to the flexible adjustment of carbon capture energy consumption and net output power by controlling the flue gas bypass to adjust the proportion of flue gas directly discharged into the atmosphere. Liquid storage operation refers to the process of decoupling the carbon dioxide absorption process that determines the amount of carbon capture and the solution regeneration process that determines the energy consumption of carbon capture to a certain extent, by introducing a solution storage device to make the rich liquid absorbed from the absorption tower no longer equal to the rich liquid entering the regeneration tower at the same time. The gaseous carbon dioxide emitted from coal-fired power plants is absorbed by an absorption tower, transforming it into carbon dioxide compounds. This compound is then transported to a regeneration tower for heating, where carbon dioxide can be resolved from the solution and sent to a compression device for collection. The remaining solution is returned to the absorption tower for secondary circulation, thereby reducing carbon dioxide emissions. The structure of CC system is mainly composed of CC unit equipment such as compressor, regeneration tower and absorption tower. The ECO of the CC system is separated into two parts: operation ECO and maintenance ECO, where the maintenance ECO is the ECO generated by the operation of the CC unit, so the ECO is not related to the size of the unit or the operation condition of the unit, and the value of the maintenance ECO can be regarded as constant [15]. The operational ECO is the ECO generated by the CC, so the value of operational ECO is relevant to the operation situation of the CC system. The modeling of CC ECO is shown in Eq. (1).
In Eq. (1),
The comprehensive energy system proposed in this article needs to achieve the two goals of minimizing carbon emissions and minimizing comprehensive operating costs while meeting energy needs. The optimal scheduling model for carbon emissions in the comprehensive energy system is shown in Eq. (3).
In Eq. (3),
A comparison of the NO power of CC PP.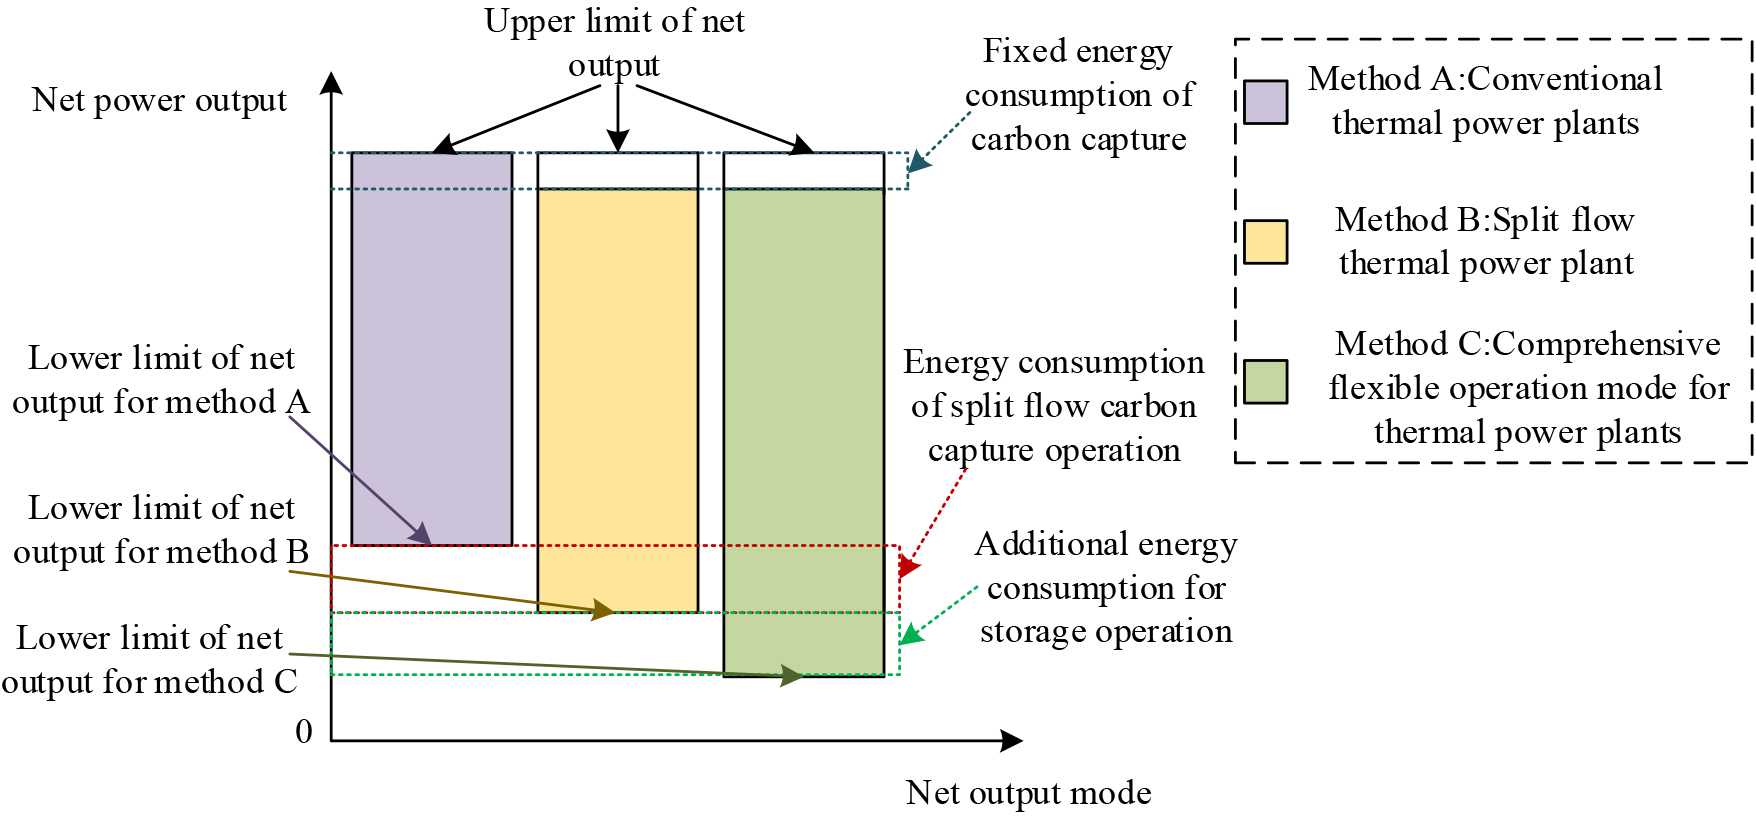
In Eq. (4), represents the operation and maintenance cost of the wind turbine,
Existing CC PP operation could be divided into three types of operation: integrated flexible operation, split operation and storage operation [16]. Among them, the reservoir operation method is the operation method used in conventional PP. Conventional generating units are often constrained by the minimum NO power, and regulating the CC ECO could diminish the lower limit of NO power of conventional generating units. A comparison of the NO power of CC PP is demonstrated in Fig. 2.
As shown in Fig. 2, the split-fLC capture operation method can expand the operation range and reduce the CE by reducing the minimum NO of CC. In contrast, the integrated flexible CC operation method can capture the carbon resolved in the solution, and thus can achieve the purpose of improving the CC ECO. Therefore, it is optimal to use the integrated flexible operation method for the construction of the integrated energy CC system. For addressing the above problems, a LC DM of the IES is constructed in view of the integrated energy CC system, considering the system function balance constraint, system reliability constraint and unit output constraint, etc., to meet the ES and ER of the IES in the condition of supply-demand balance. The objective is to achieve ES and ER under the condition of supply-demand balance. The DA scheduling plan of the IES is arranged according to the CE reduction of the units and the timeliness of the units’ output. The relevant details of DA scheduling are demonstrated in Fig. 3.
The relevant details of DA scheduling.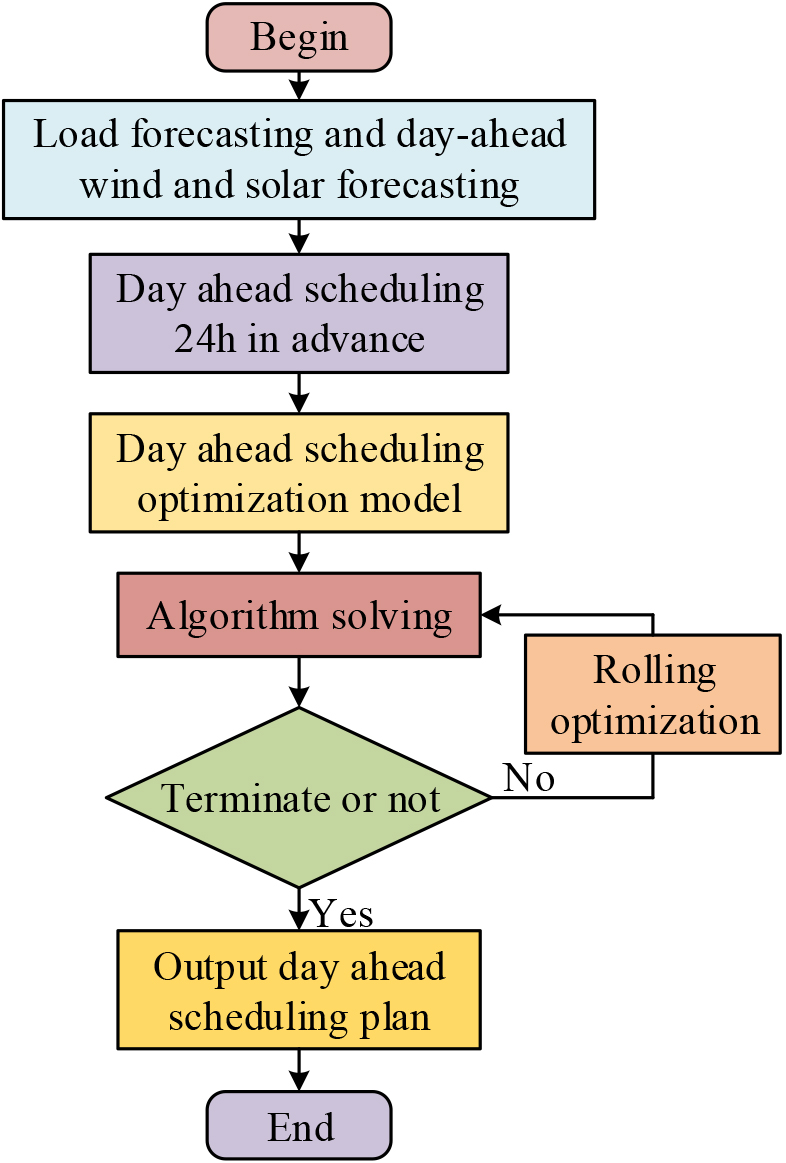
Figure 3 demonstrates that in the design of the DA scheduling process, the load forecast data and output forecast data of renewable ESO obtained are pre-processed first, and then a DA LC scheduling OMO is constructed based on the CE target and economic target, and finally the model is solved using the special multi-objective optimization algorithm, and whether the optimal solution (OS) is reached is judged.
The IES is mainly utilized for achieving low CE reduction by diminishing the operation of gas turbines and thermal power units (TPU), but if the IES relies entirely on renewable energy for energy supply will cause system instability [17]. Therefore, when considering the effect of low CE reduction in the IES, it is also essential for considering the minimum output value for ensuring the secure operating, i.e. the CE’s limit value. The predicted minimum output value of CE unit is demonstrated in Eq. (5).
In Eq. (5),
In Eq. (6),
The LC DM of the IES day before considering the security risk.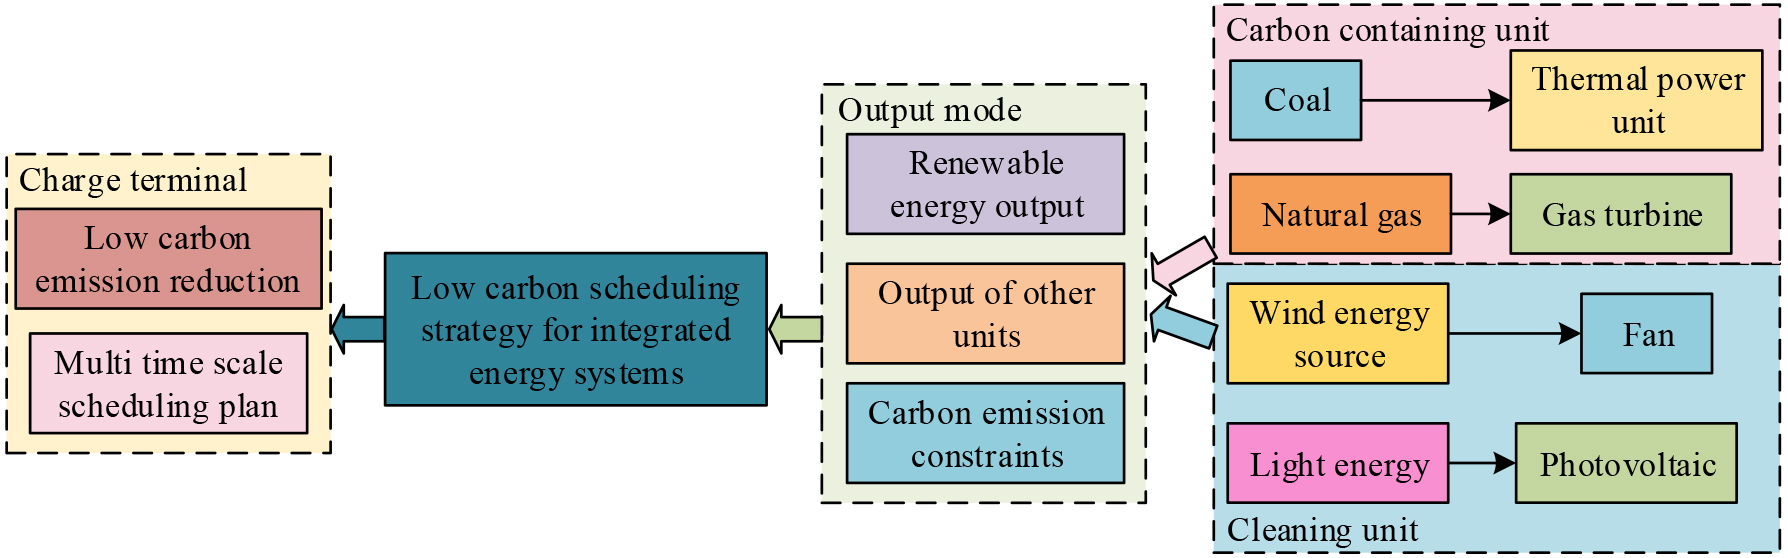
As shown in Fig. 4, the LC DM of the IES day before considering the security risk is used to carry out LC dispatch by first converting clean energy and fossil energy into thermal energy and electrical energy through the units. Then, the power characteristics of TPU, renewable ESO and gas turbines in the IES are studied, and the CE model and the power model of energy supply units are constructed, and the upper and lower limits of CE reduction are set in the light of the limits and indicators of CE. Equation (7) demonstrates the relevant expression of the IES.
In Eq. (7),
In Eq. (8),
In Eq. (3.2),
In Eq. (10),
In Eq. (11),
The schematic diagram of multi time scale rolling optimization.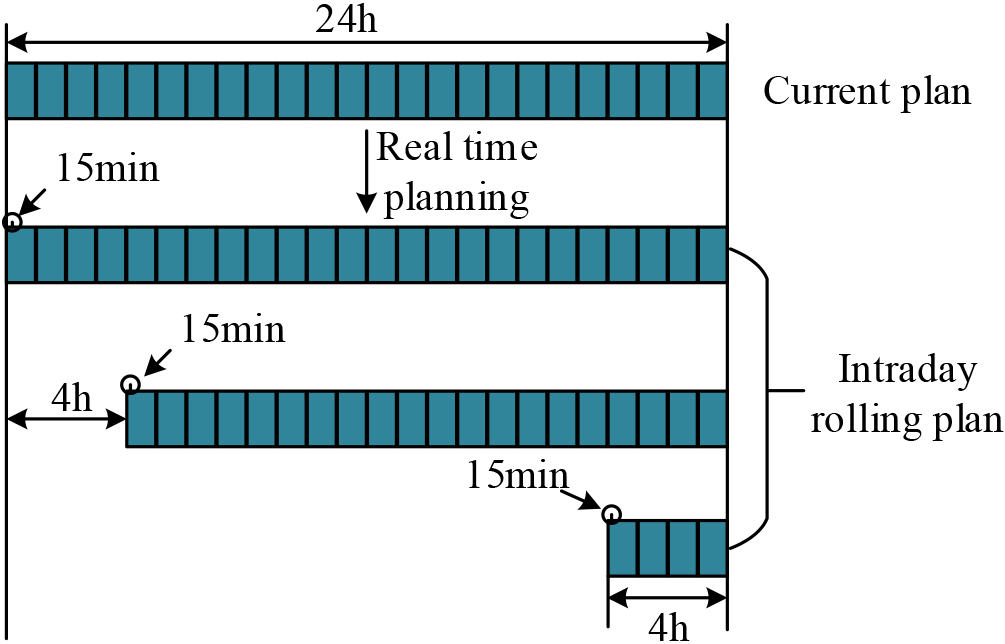
As shown in Fig. 5, the three stages of the multi time scale low-carbon scheduling model are as follows: in the first stage, the rolling plan is reset for the next 4 h scheduling every 1 h based on the day ahead scheduling plan by setting the adjustment target and carbon emissions of the unit, and the real-time low-carbon scheduling is adjusted every 15 min based on the real-time carbon emissions feedback through the real-time carbon emissions assessment; In the second stage, the output plans of each unit are adjusted under the minimum carbon emission target [21]. The real-time feedback model of carbon emissions is considered to constrain and adjust the unit output based on the data feedback from carbon emissions. Then, a real-time scheduling model is established with the minimum adjustment amount of equipment as the objective function, and the constraint conditions are basically the same as the rolling plan constraints; In the third stage, the output comparison diagram and carbon emission comparison diagram of each equipment at multiple time scales are provided through numerical simulation. The analysis of the unit output timeliness in the LC dispatch of the IES can be solved by using the improved simulated annealing multi-objective optimization algorithm (SAMOOA). The flow of the improved SAMOOA is shown in Fig. 6.
The flow of the improved SAMOOA.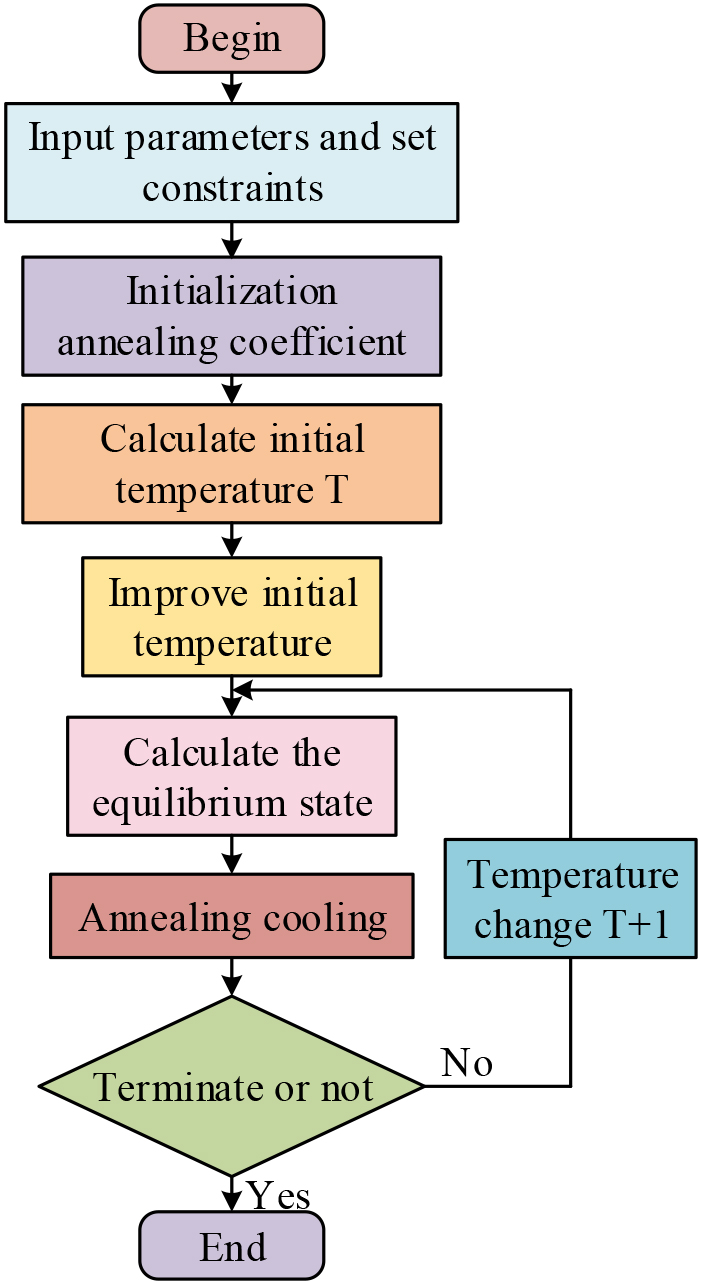
As shown in Fig. 6, the algorithm adds a memory function in the initialization phase, while improving the initial temperature based on the global fitness value [22]. The simulated annealing multi-objective algorithm is suitable for large-scale combinatorial optimization problems, and it can gradually converge to the global optimal solution to avoid falling into local optima when seeking the optimal solution. The comprehensive energy system low-carbon scheduling model established in this chapter not only has multiple objective functions and constraints, but also needs to consider future real-time carbon emissions issues. Only using simulated annealing multi-objective algorithm can no longer adapt to the optimization scheduling problem in this chapter. To obtain the optimal solution of the multi-objective function in this chapter, it is necessary to improve the simulated annealing multi-objective algorithm [12]. The expression of the simulated annealing algorithm is shown in Eq. (12).
In Eq. (12),
In Eq. (13),
In Eq. (14),
In Eq. (15),
In Eq. (16),
In Eq. (17),
Predicted output data of daily scenery and daily load
Research on building a simulation environment for a comprehensive energy system in the Gym toolkit of Open AI, with computer hardware configured as Intel (R) Core (TM) i5-4460 and 6-core 12 thread memory of 64GB. The electricity, heat load, and power generation data in the system are generated based on the open-source CREST model. The experiment used actual operating data from a certain region in Liaoning Province as the data source, with sample data including energy use data from 2019 to 2020. For verifying the performance of the IES multi-timescale OMO with CC, the CE data of the IES multi-timescale OMO are simulated and validated. The operating parameters of the IES equipment are demonstrated in Table 1. From Table 1, it can be seen that the comprehensive energy system includes equipment such as batteries, electric boilers, heat storage tanks, waste heat boilers, thermal power units, and gas turbines. The capacity configuration parameters of the comprehensive energy system equipment are up to 300 kW and down to
Operating parameters of comprehensive energy system equipment
Operating parameters of comprehensive energy system equipment
The predicted power output of the typical daily scenery and daily load is plotted based on the energy use data of the northern region, as illustrated in Fig. 7. Figure 7a showcases that the output power (OP) of PV units is 0 during the period from 1:00 to 4:00 and from 20:00 to 24:00. The peak OP of PV units is reached during the period from 11:00 to 14:00, with a maximum OP of 90 MW. The peaks occur in the phases of 11:00 to 14:00 and 19:00 to 21:00. Therefore, it can be seen that the low period of electricity consumption (ELC) is from 1:00 to 4:00, the peak period of ELC is from 11:00 to 14:00 and 19:00 to 21:00, and the rest of the period is the usual period of ELC.
Forecast data output chart of typical daily scenery and daily load.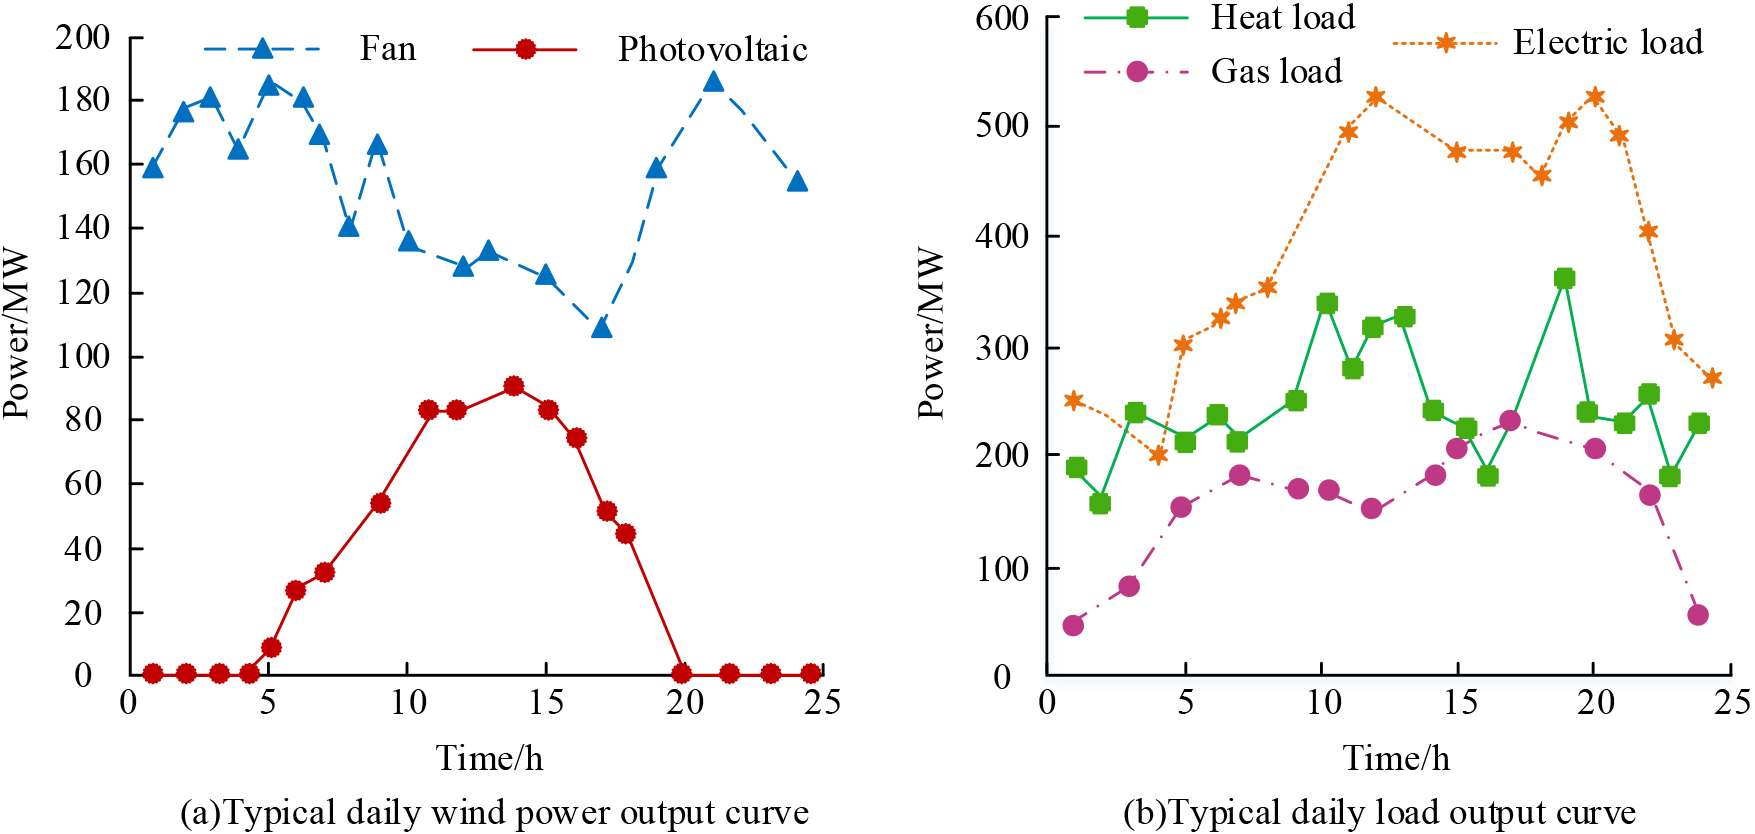
For verifying the performance of the multi-timescale OMO of IES with CC in practical application, the analysis is carried out according to two scenarios, because the electricity purchase price presents different prices at different times. The economic-based dispatching method is set as scenario A, and the LC dispatching method to reduce CE is set as scenario B. According to the supply and demand characteristics of the IES, the dispatching balance diagram of the electric load under the two scenarios is indicated in Fig. 8. Figure 8a demonstrates that the TPU and gas turbines are the ones that produce the most power in scenario A. From the power supply scenario, the demand of electric load from 9:00 to 22:00 is larger. Figure 8b illustrates that in Scenario B, considering the LC issue, the OP of TPU is obviously diminished, and the most OP is gas turbines and wind power, while the OP of electricity to gas is increased within the OP, and the equipment of electricity to gas will produce methane for satisfying the requirement of gas load, which can realize the complementarity of multiple ESO in the integrated energy, thus diminishing the operation cost and achieving the reduction of the purpose of CE reduction.
Dispatching balance diagram of electricity load in two scenarios.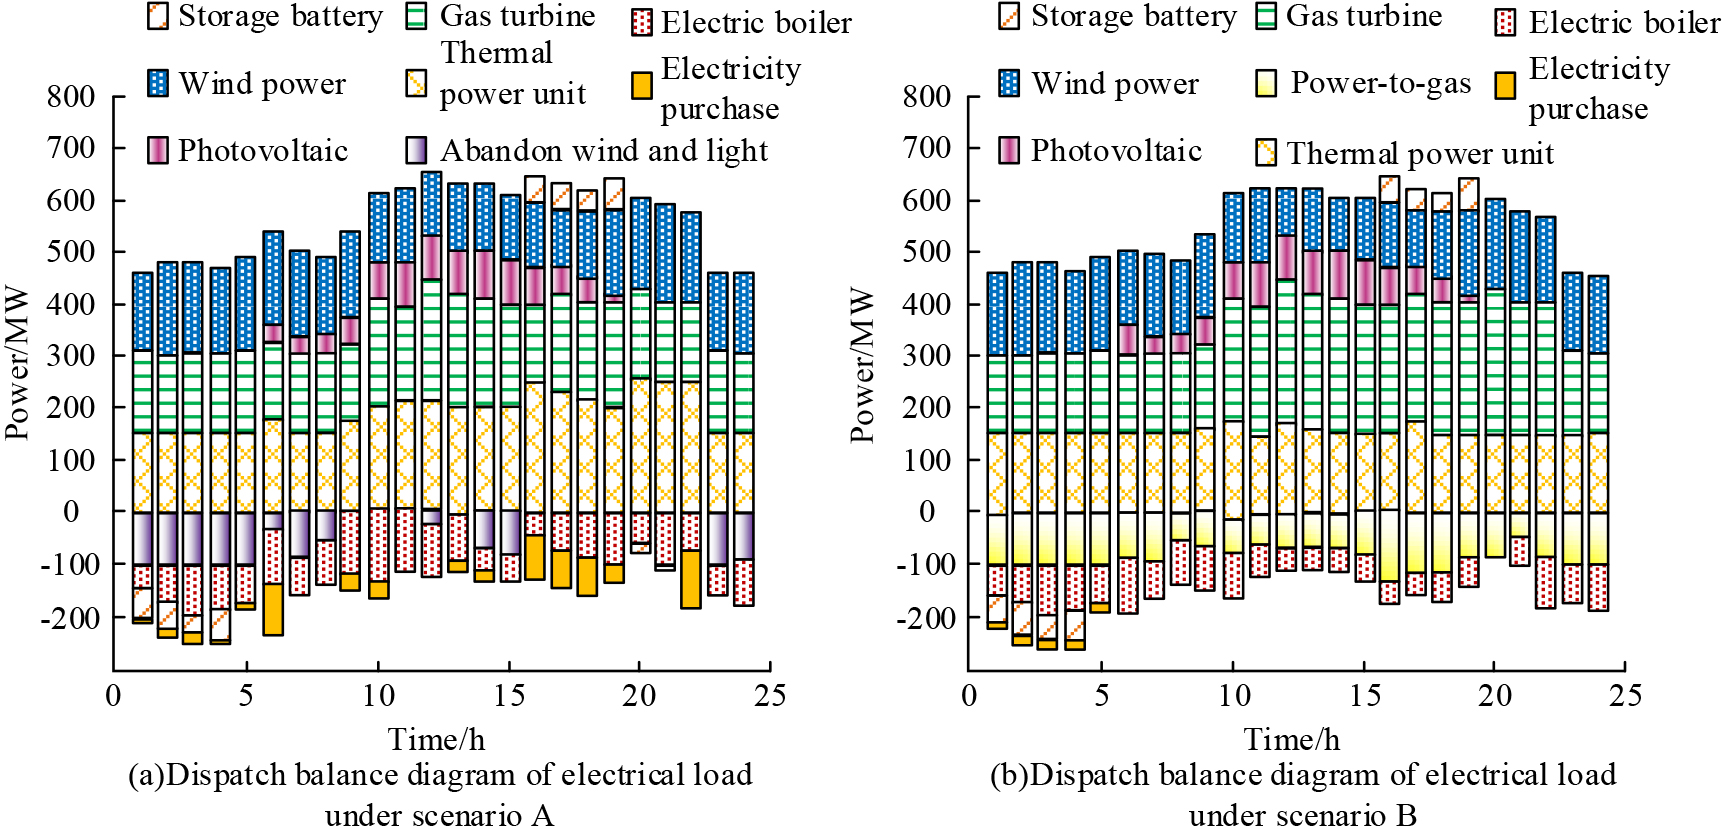
Comparison of CE in two scenarios.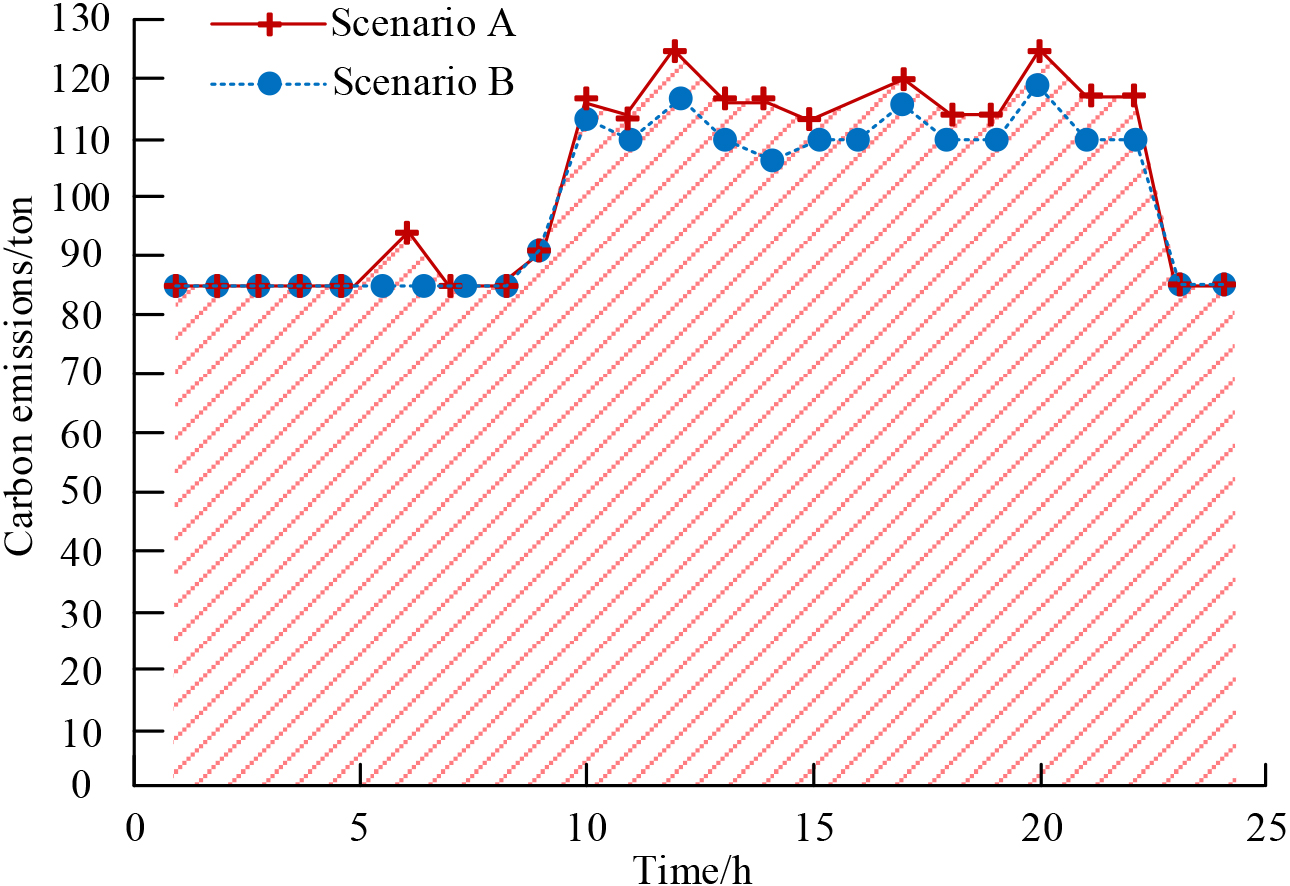
In order to compare the effect of CE under the two scenarios more clearly, the comparison graph of CE under the two scenarios is drawn as indicated in Fig. 9. Figure 9 demonstrates that the CE of scenario B is obviously smaller than scenario A. It reveals that the peak of CE is at 12:00 and 20:00, and the CE of scenario A reaches 124.5 tons at 12:00, which is 6.23% higher than that of scenario B (117.2 tons). At 20 o’clock, the CE of Scenario A is still 124.5 tons, which is 4.01% higher than that of Scenario B (119.7 tons). It reveals that the LC economic scheduling method, which takes into account the reduction of CE, effectively reduces CE compared with the economy-based scheduling method.
The main sources of energy supply in an IES are gas turbines and TPU, which are also the source of CE, with the main fuel for TPU being large amounts of coal. Therefore, in order to reduce CE, it is essential for controlling the scheduling of thermal units. In the real-time scheduling plan for constraining the thermal units can be adjusted with the adjustment amount as the minimum target. The unit power of the two scenarios under multi-scale optimization is demonstrated in Fig. 10. Figure 10 illustrates that the OP of Scenario A and Scenario B are the same during the phase from point 0 to point 15, indicating that both scenarios achieve the ER target at point 15. From Fig. 10a, it can be seen that the OP of rolling dispatch (RD) is 195 MW during the phase from 16:00 to 17:00, which is 10 MW higher than the 185 MW of real-time dispatch (RTD), indicating that Option A increases the OP of thermal units after reaching the ER target in order to pursue economics. Figure 10b demonstrates that the OP of 185 MW is not increased from 16:00 to 17:00 for DA, rolling and real-time dispatching, indicating that Scenario B still arranges the thermal units’ OP according to the ER plan after reaching the ER target in order to pursue the ER effect.
Unit power of two schemes under multi-scale optimization.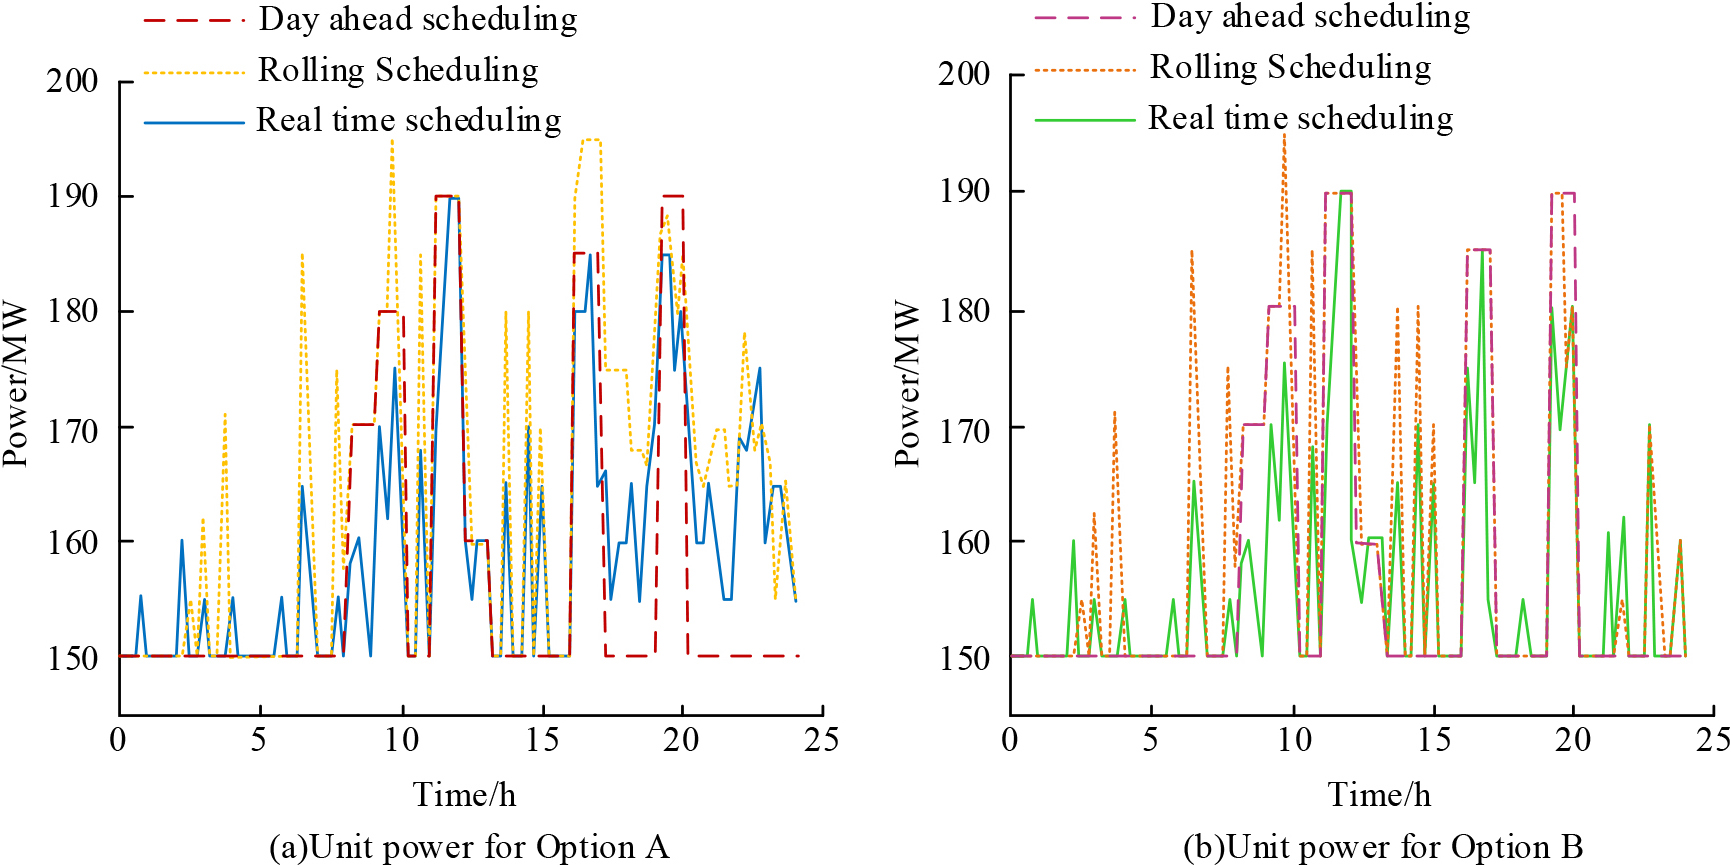
In order to observe the CE after multi-scale optimization, the comparison of CE after multi-scale optimization under the two scenarios is plotted as indicated in Fig. 11. Figure 11 illustrates that the CE of Scenario A and Scenario B are the same during the phase from 0 to 15 points, indicating that the DA scheduling of both scenarios is the same before reaching the ER target. From Fig. 11a, it can be seen that the CE of the DA dispatch, RD and RTD of scenario A at 15:00 are 110 tons, 118 tons and 114.5 tons, respectively. The CE peak at 19:00, when the CE of the DA dispatch, RD and RTD of Scenario A are 120 tons, 122 tons and 118 tons, respectively. Figure 11b demonstrates that the CE of the DA dispatch, RD and RTD of Scenario B are 109.8 tons, 117.8 tons and 114.5 tons respectively at 15:00, where the DA dispatch and RD are both reduced by 0.2 tons compared with Scenario A. The CE of scenario B at 19:00 are 119.9 tons, 119.9 tons and 117.5 tons for DA scheduling, rolling scheduling and real-time scheduling, respectively, which are reduced by 0.1 tons, 2.1 tons and 0.5 tons respectively compared with scenario A. The combination can be seen that the CE have been reduced after multi-scale optimization.
CE after multi-scale optimization under two schemes.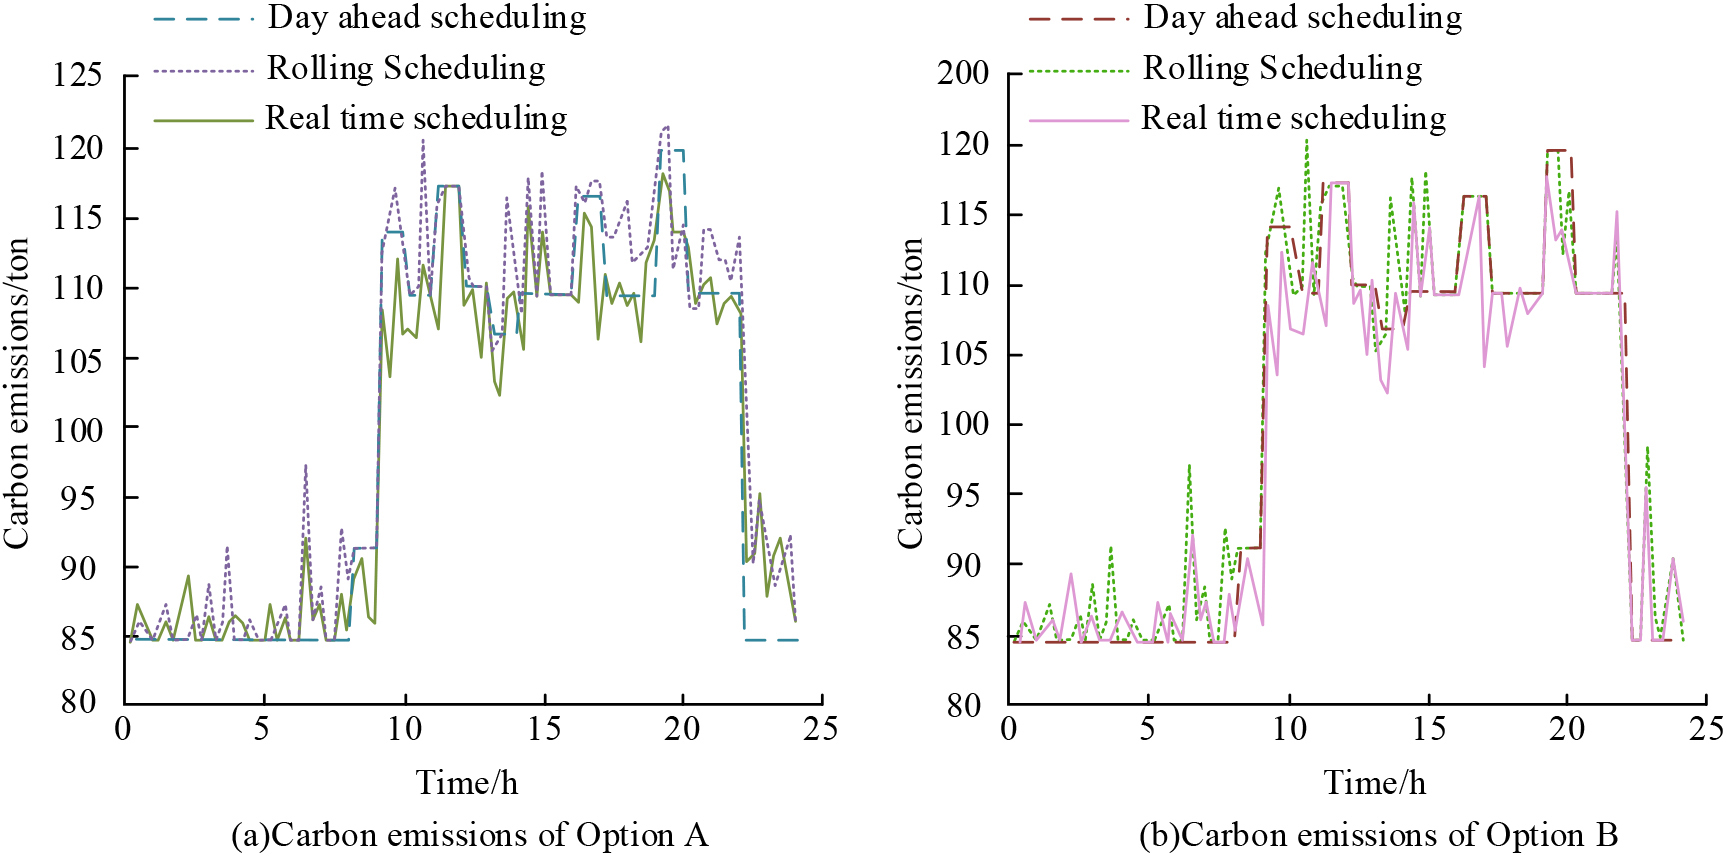
In order to clearly observe the superiority of the ER effect of the multi-timescale OMO of IES with CC, the CE of the model and the conventional IES in real applications are compared as demonstrated in Fig. 12. Figure 12 illustrates that the CE of the multi-timescale OMO with CC are significantly lower than those of the conventional model, with both models emitting 85 tons of carbon from 0:00 to 5:00, and 118 tons of carbon from 11:00 to 12:00 during the peak period, a reduction of 7 tons compared to 125 tons of the conventional model. Therefore, it illustrates that the multi-timescale OMO of the IES with CC achieves the ER effect.
Comparison of CE.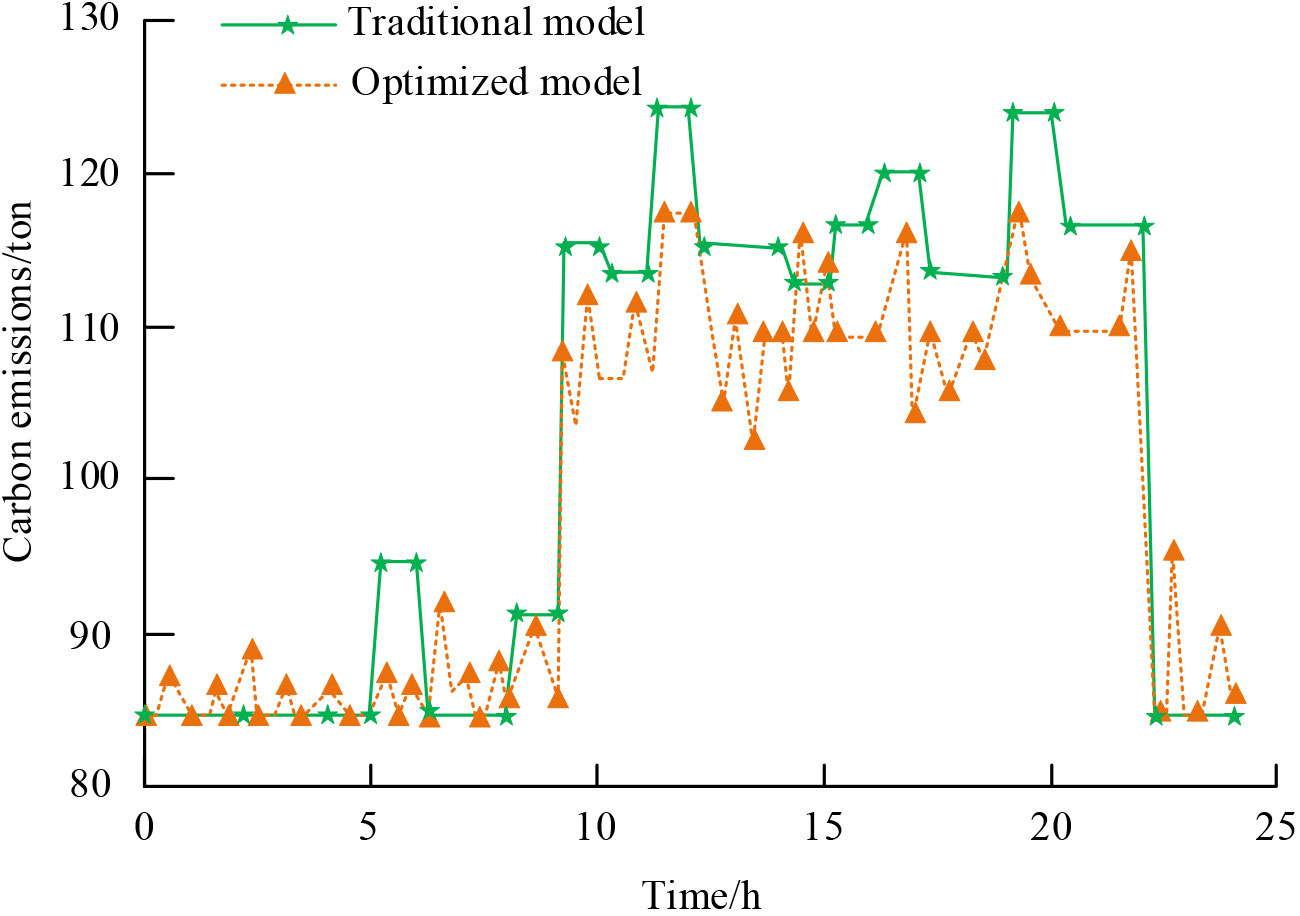
In order to verify the optimization scheduling results of the comprehensive energy system, the optimization scheduling results of the electrical power and thermal power of the system were compared and analyzed, as shown in Fig. 13. From Fig. 13a, it can be seen that thermal power units, wind turbines, gas turbines, and thermoelectric units in the power grid meet the demand for electricity load. During the peak hours of wind power output at night, the electricity load is relatively low. From Fig. 13b, it can be seen that gas turbines and thermoelectric units meet the demand for thermal load in the heating network. Overall, it can be seen that the optimized scheduling results of the comprehensive energy system can meet the electrical and thermal load requirements of the equipment.
Optimization scheduling results of electrical and thermal power.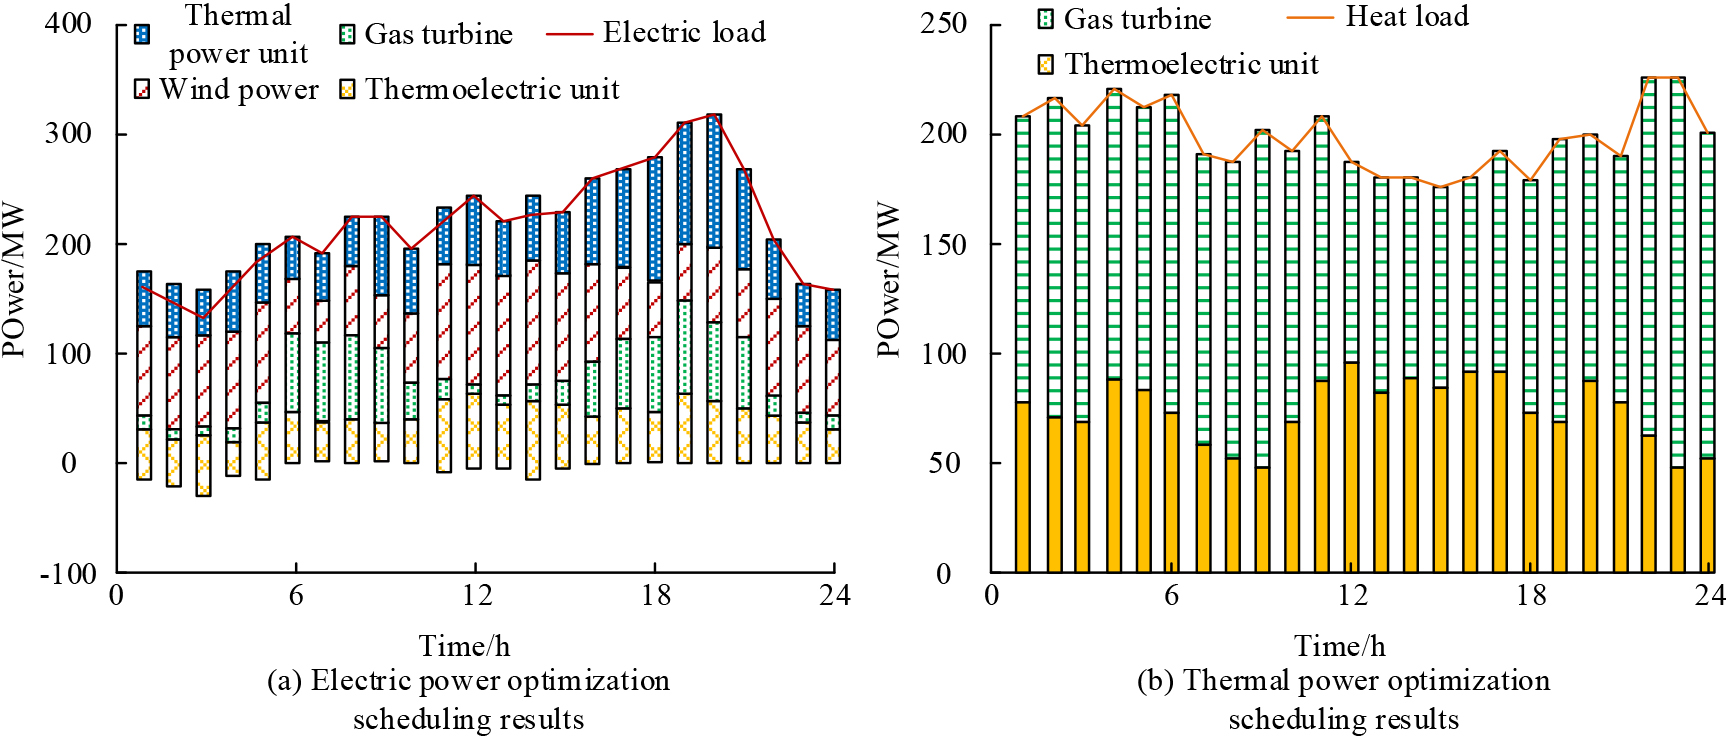
Comparison of carbon emissions between integrated energy systems and other advanced models.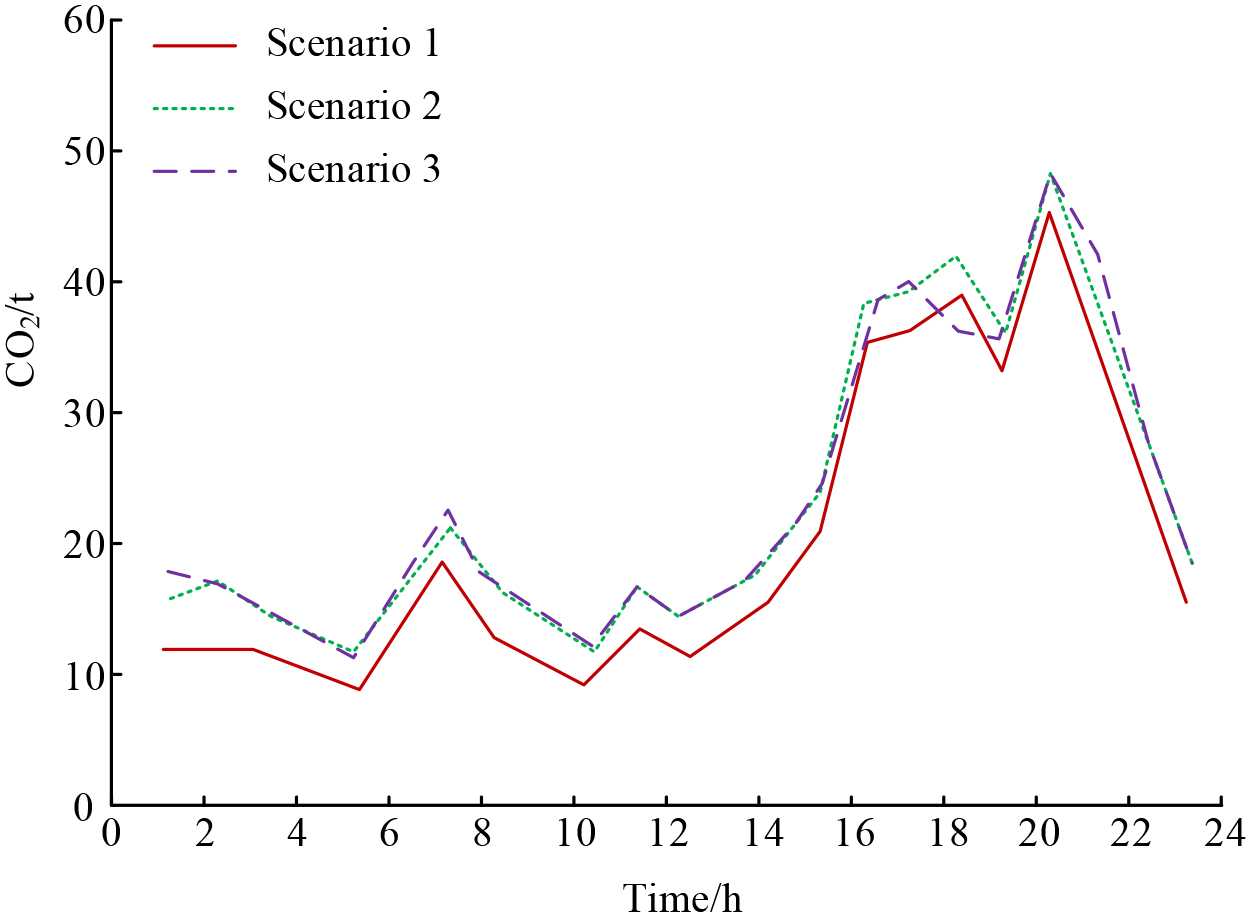
In order to further verify the operational feasibility of the integrated energy system for carbon capture, a comparative analysis was conducted between the integrated energy system and other advanced models. Set the multi time scale optimization model of the carbon capture comprehensive energy system studied in this article as Model 1, the energy system model considering power supply reliability constraints as Model 2, and the energy system model considering comprehensive demand response as Model 3. Compare and analyze the carbon emissions of the three models. The carbon emissions of the comprehensive energy system and other advanced models are shown in Fig. 14. As shown in Fig. 14, the carbon emissions of Scenario 1 are significantly lower than those of the other two models, while the carbon emission trends of the other two models are almost consistent. Therefore, it can be seen that the multi time scale optimization model of the carbon capture integrated energy system is effective in reducing carbon emissions.
Against the backdrop of China’s proposal for the “dual carbon” goal, the low-carbon transformation of the power system is urgent. For reaching low CE reduction, the study introduces CC technology on the basis of the IES framework, and optimizes the energy dispatching of the IES in multiple time scales, and constructs a multi-time scale OMO of the IES considering CC. In order to further improve the operational flexibility and low-carbon efficiency of the system, the study fully utilizes the advantages of flexible regulation of carbon capture power plants. A comprehensive flexible operation mode of flue gas bypass and solution storage has been installed in the system design to achieve energy time shift of carbon capture energy consumption. And a daily rolling low-carbon scheduling model has been established. Utilize daily 4-hour rolling scheduling and 15 min real-time scheduling to optimize low-carbon scheduling and management of the comprehensive energy system. The results show that the low PCO period is from 1:00 to 4:00, the peak PCO period is from 11:00 to 14:00 and 19:00 to 21:00, and the rest of the period is the normal PCO period. The CE of Scenario B at 12:00 is 117.2 tons, which is 6.23% less than that of Scenario A. The CE of Scenario B at 20:00 is 119.7 tons, which is 4.01% less than that of Scenario A. The CE of scenario B’s DA dispatch, RD and RTD at 15 o’clock are 109.8 tons, 117.8 tons and 114.5 tons, respectively, with both DA dispatch and RD reduced by 0.2 tons compared with scenario A. At 19:00, the CE of the DA dispatch, RD and RTD of Scenario B are 119.9 tons, 119.9 tons and 117.5 tons, respectively, which are reduced by 0.1 tons, 2.1 tons and 0.5 tons respectively compared with Scenario A. The comprehensive energy system low-carbon scheduling method proposed in this article has been verified to be effective in improving the utilization rate of renewable energy and reducing carbon emissions. In practical application, the CE of the optimized model during the peak hour from 11:00 to 12:00 phase is 118 tons, which is 7 tons less than the 125 tons of the traditional model. Verified the feasibility and rationality of low-carbon scheduling for comprehensive energy systems based on multiple time scales. In summary, it illustrated that the multi-timescale OMO of IES with CC achieves the goal of low CE reduction.
But the data used in the experiment are energy use data in the northern region, so the experimental results are not comprehensive, and further improvement is needed in this regard. At the same time, the research and design of the model framework is relatively large, and carbon trading technology is still in the process of development. Therefore, the research in this article can be further improved from the following aspects. Firstly, the system designed in this article is mainly from the perspective of energy optimization, so the sales revenue generated from carbon capture and the cost of storage have not been considered. Therefore, future research can further consider the economic benefits of carbon trading comprehensively. Secondly, the current allocation method for carbon emission quotas in the power system adopts the baseline method, but with the continuous development of the carbon trading market, the proportion of paid allocation will gradually increase. Therefore, subsequent research can design a comprehensive energy system based on different carbon emission rights allocation methods.
Footnotes
Acknowledgments
Supported by the 2023 Open Fund Project of the National Key Laboratory of Power Grid Safety (Research on low-carbon operation method of integrated energy system considering carbon capture, DZB51202301406).
National Key Laboratory of Power Grid Safety and Nanchang University are the co-first affiliation of this paper.