
Abstract
The new crown pneumonia epidemic is raging, in the context of global integration, the scope of the impact of this sudden event spread around the world, the stock market has not been spared, the financial risk has increased dramatically compared with the past, the emergence of the epidemic has led to the spread of investor panic, March 2020, the U.S. S&P 500 index appeared in the four plunge, and led to the market trading meltdown, the world’s financial markets have had an extremely serious impact. The study of the impact of Xin Guan Pneumonia on the company’s stock returns is not only conducive to enriching the theoretical study of public health emergencies, but also conducive to improving the coping strategy, stabilizing the general economic market, and enhancing the public’s awareness of risk response. This paper compares the effect of the four intelligent algorithms of chaotic particle swarm algorithm, chaotic bee colony algorithm, chaotic fruit fly algorithm and chaotic ant colony algorithm combined with neural network on the prediction of the stock price trend of Yunnan national culture, and the study shows that the speed of convergence of the chaotic particle swarm optimization neural network and the speed of descent is better than that of the two models of chaotic fruit fly and chaotic bee colony, and the coefficients of decision of the chaotic particle swarm optimization neural network are higher than that of the other three models, and the errors are lower than the other three models. Indexes are lower than the other three models and have high accuracy in stock prediction of Yunnan ethnic culture, this finding emphasizes the potential of PSO-BP model to provide robust stock market prediction, which is important for both investors and policy makers in dealing with volatile market conditions.
Keywords
Introduction
The stock market is an important channel for enterprises to raise capital for production, and at the same time, changes in stock market prices directly affect the stability of the financial market and the healthy development of the economy. As a result, accurate stock price prediction can be more effective in avoiding future risks for decision makers; for regulators, it can strengthen the control of the stock market, timely regulation and guidance of the stock market, and provide firm confidence and strong protection for the sustainable development of the economy. Stock price prediction, on the other hand, is to predict the development prospects of the stock market through the regularity of the stock market development and its history and current situation, relying on a large amount of stock market information and accurate statistical survey data, and applying all kinds of scientific methods to predict the development prospects of the stock market.
Hongbao Cao, Jinrui Peng, Jiaojiao Hui (2023) conducted a simple descriptive statistical analysis and established an evaluation model of the current status of the dissemination of intangible cultural heritage based on factor analysis and BP neural network on the basis of the data of Shaanxi Province. The results show that the communication status of intangible cultural heritage in Shaanxi Province is in the “general” stage [1]. Qipeng Ding (2023) selected 20 science and technology innovation board enterprises, based on BP neural network to build science and technology innovation board financial risk evaluation model, after training and testing the sample data, the model constructed for science and technology innovation board listed companies financial status has a better prediction effect, the evaluation results of the science and technology innovation board enterprise decision-making layer for the company’s financial risk to make early warning has a good role [2]. Dorigo and Stutzle (2004) described the current status of intangible cultural heritage dissemination in Shaanxi Province. Stutzle (2004) introduced ant colony optimization and studied its most important applications. Ant colony optimization algorithms have great potential for application and development in many fields such as production planning and scheduling, business operations, financial management, electronics, communications, automatic control, optics, biology and so on [3]. Xinhui Duan and Wenxin Li (2021) introduced the method of chaotic mapping and shrinkage factor to improve the traditional PSO particle swarm algorithm, and dynamically adjusted the weights of the particle swarm to improve the global search ability at the initial stage of the particle swarm, the local search ability at the later stage, and the speed of convergence, and the results show that the improved PSO-BP prediction method is better than the BP neural network, the PSO-BP wind speed prediction method, and the PSO-BP algorithm that only introduces the shrinkage factor, and the PSO-BP algorithm that only introduces the shrinkage factor. Factor of PSO-BP algorithm, which verified the correctness of the algorithm improvement and made the prediction error reduced [4]. Xiujuan Duan (2019) proposed and designed a network security risk assessment system based on chaotic particle swarm optimization BP neural network, and the experimental results show that the system can better coordinate, and deal with the problems arising in the assessment process, and will not be affected by the trend, periodicity, and stochasticity, and it can better perform the effect of network security assessment, improve the accuracy of the assessment, and reduce the relative error [5]. Kennedy and Eberhart (1995) proposed the concept of optimizing nonlinear functions with particle swarm algorithms, the evolution of several paradigms is outlined, and applications including nonlinear function optimization and neural network training are proposed, and the relationship between particle swarm algorithms and artificial life and genetic algorithms is described [6]. Haibiao Liang (2023) proposed the BP neural network principle, applicability, reasonableness, and the use of MATLAB software tools to establish the assembly construction project cost estimation model, finally, on the basis of collecting and organizing the data of similar engineering indexes, he completed the training and improvement of the BP neural network estimation model, and by comparing the predicted value of the estimation model with the actual value, he verified that the BP neural network model in the By comparing the predicted and actual values of the estimation model, the applicability and reliability of the BP neural network model in the estimation of assembled building projects were verified [7]. Aolin Liao (2023) considered the use of differential integrated autoregressive moving average model (ARIMA) and BP neural network model for modeling and analyzing the house price in Beijing from 2009 to 2022, and compared the prediction results of ARIMA-PSO-BP combination model, ARIMA model, BP neural network model and PSO-BP neural network model on the test set, and found that the prediction accuracy of the combination model is higher, among which the parallel combination model based on residual inverse method has the best prediction effect and the lowest prediction error [8]. Chenwei Liu, Jian Sun, Bingbing Lei (2023) introduced a nonlinear decreasing dynamic inertia weighting strategy in the particle updating method to balance the local search and global search. Then, a chaotic mapping strategy was introduced to generate a new solution by perturbing the mutation in the location of the optimal solution, which improves the algorithm’s ability of jumping out from local optimums, and improves the overall performance of cloud data [9]. Jianjun Li, Jia Fu, Yu Yang (2023) used chaotic particle swarm algorithm and collaborative filtering algorithm fusion, the traditional particle swarm algorithm to add chaotic perturbation and adjust the inertia weight with iteration, clustering optimization of the user, and verified that collaborative filtering recommendation algorithm based on chaotic particle swarm clustering optimization has a lower average absolute error and higher accuracy compared with other algorithms [10].
Tao Liu, Shen Wang, Jiajing Wu (2023) took a subway shield project in Hangzhou as an example, using BP neural network, analyzed and predicted the indicators of underground electricity equipment system and distribution system indicators in subway tunneling project, which provided a certain reference for the monitoring and prediction of the indicators of intelligent electricity consumption in subway shield [11]. Mingyang Mao and Shengchao Xu (2023) proposed a particle swarm optimized BP neural network-based discretization algorithm for continuous attributes of rough sets, using particle swarm algorithm to improve the weights and thresholds in the BP neural network, and classifying information systems with continuous attributes based on the optimized BP deep neural network, and the experimental results showed that the proposed method can better achieve the discretization of continuous attributes, and the classification accuracy and convergence speed are both good and good under different algorithms. The classification accuracy and convergence speed of the proposed method are high, indicating that the method has strong application prospects [12]. Pan (2012) proposed a fruit fly optimization algorithm that is simpler than the complex optimization methods proposed by previous scholars. The function of the algorithm was tested repeatedly throughout the process of finding the maximum and minimum values of the function, while the population size and characteristics were studied. The results show that the RMSE values of the generalized regression neural network model optimized by the Drosophila optimization algorithm have good convergence, and the model also has good classification and prediction ability [13]. Jianxin Xu, Wei Sun, Chao Ma (2023) proposed an optimization algorithm based on improved particle swarm for the path planning problem of unmanned aerial vehicles in complex multi-obstacle environments and used chaotic particle initialization to diversify the particle swarm and enhance the stability of the algorithm, and the results show that when performing unmanned aerial vehicle path planning, the improved particle swarm algorithm can effectively solve the problems of traditional particle swarm algorithms in the complex multi-obstacle environment [14]. Junqi Yang, Xiaojun Fan, Yuehua Zhao (2023) used PSO-BP neural network model to simulate and predict the carbon emissions in Shanxi Province, and introduced particle swarm optimization algorithm to improve the prediction accuracy of BP neural network effectively. The prediction results showed that under three scenarios, namely the baseline scenario, the low carbon scenario and the enhanced low carbon scenario, the carbon emissions in Shanxi province peaked in 2032, 2029 and 2027, respectively [15]. Jing Zhang (2023) proposed a financial management early warning optimization model based on chaotic particle swarm algorithm of neural network with the starting point of avoiding economic losses of enterprises, which improved the reliability of the early warning results, and she controlled the degree of aggregation of particles to avoid the occurrence of the local extreme value to ensure the early warning results of the model. The test results show that the convergence is completed when the number of iterations is 50, and the value of the degree of adaptation is 0.0005; the global optimization search performance is good, with excellent early warning reliability [16]. Lingbo Zhang (2022) selected the annual report data of listed companies that were publicly punished by the Securities and Futures Commission for financial counterfeiting in the Chinese market during 2010–2020, and used BP neural network to establish a prediction model of financial counterfeiting of listed companies to determine whether there is counterfeiting according to the model prediction results, and the model not only improves the accuracy of the prediction of financial counterfeiting relative to the traditional prediction model of financial counterfeiting but also avoids the problem of the lack of interpretability of the neural network. This model not only improves the accuracy of financial fraud prediction, but also avoids the “black box” disadvantage of neural networks, which lacks explanatory power [17]. Peisi Zhong, Xiangwen Wang, Chao Zhang (2023) proposed an improved chaotic particle swarm algorithm to optimize the excitation trajectory of a robot, improve the optimization effect of the algorithm and use it to optimize the excitation trajectory of the robot, and carry out the recognition of dynamics parameter based on neural network. Simulation results show that the robot dynamics parameters are recognized with high accuracy [18].
By reading the literature in recent years, we can see that the bp neural network model has a better prediction effect on the financial status of the listed companies in the science and technology innovation board, and the chaotic particle swarm algorithm can enhance the stability of the algorithm. In this paper, we apply the chaotic particle swarm to study the impact of the epidemic on the stock of Yunnan culture (Stock code: 831239) and construct the prediction model, to analyze and predict the stock market trend of the Yunnan national culture industry under the influence of the epidemic.
Research method and research design
Research method
Drosophila Algorithm Optimization Neural Network (FOA-BP): By combining the Drosophila algorithm and the BP neural network regression prediction model, we achieve accurate regression prediction of multivariate inputs. The goal of the foa-bp algorithm is to optimize the weights and thresholds of the BP neural network. In particular, foa-bp utilizes the Drosophila algorithm to explore optimal weight values and critical values to minimize the error between the BP neural network output and the actual observation. Drosophila algorithm is an optimization algorithm based on the food collection behavior of fruit flies, which simulates the strategy of fruit flies to find food, and achieves the best combination of weight value and threshold in the process of repeatedly optimizing the weight value and threshold. The BP neural network is used to make regression prediction, and the output is predicted by the combination of input variables.
Ant colony algorithm optimization neural network (ACO-BP): The ant colony algorithm (ACO) is a bionic intelligent optimization algorithm inspired by the process of ant foraging. The basic idea of optimizing BP neural network with ant colony algorithm ACO is to first take out the elements of the weight matrix and threshold vector to form the path coordinates of the ant population. Because the shorter the path an ant takes to the food source, the higher the pheromone content on the path, the mean squared error is used as the ant’s fitness value. Finally, the shortest path determined by the ant population is used as the optimal initial weight and threshold parameters, and then assigned to the BP neural network for training and testing, and the error comparison is compared with the BP neural network prediction before optimization.
Artificial Bee Colony Algorithm Optimization Neural Network (ABC-BP): Artificial Bee Colony Algorithm Optimization Neural Network (ABC-BP) is an optimization method based on bionic intelligence. Artificial bee colony algorithm (ABC) is a kind of global optimization solution formed by simulating the efficient collection of high-quality honey sources by bees, mainly composed of leading bees, following bees, and detecting bees, and the optimization process can be divided into 3 stages, leading bee stage, following bee stage, and detecting bee stage, which has the advantages of strong optimization ability and fast convergence speed. Aiming at the problem that the traditional BP neural network will randomly generate the initial parameters and bring about easy to fall into the local optimal solution, a hybrid algorithm of artificial bee colony algorithm to optimize the BP neural network is proposed, and applied to optimize the weight and bias parameters of the neural network.
Particle Swarm Optimization Neural Network (PSO-BP): The particle swarm optimization algorithm is used to optimize the weights and thresholds of BP neural networks. The particle swarm optimization algorithm simulates the foraging behavior of a flock, iteratively calculating the position and velocity of each particle to find the global optimal solution. Data regression prediction using optimized PSO-BP neural networks. By passing input data to the network, the network calculates based on optimized weights and thresholds and outputs corresponding continuous predictions. The optimized network is able to more accurately predict the values of new unknown data. The data regression prediction method based on particle swarm optimization algorithm to optimize BP neural network can combine the global search ability of particle swarm optimization algorithm and the nonlinear fitting ability of BP neural network to achieve more accurate and accurate numerical prediction.
The specific process of chaotic theory optimizing particle swarm algorithm is as follows:
The process of chaotic theory optimizing particle swarm algorithm.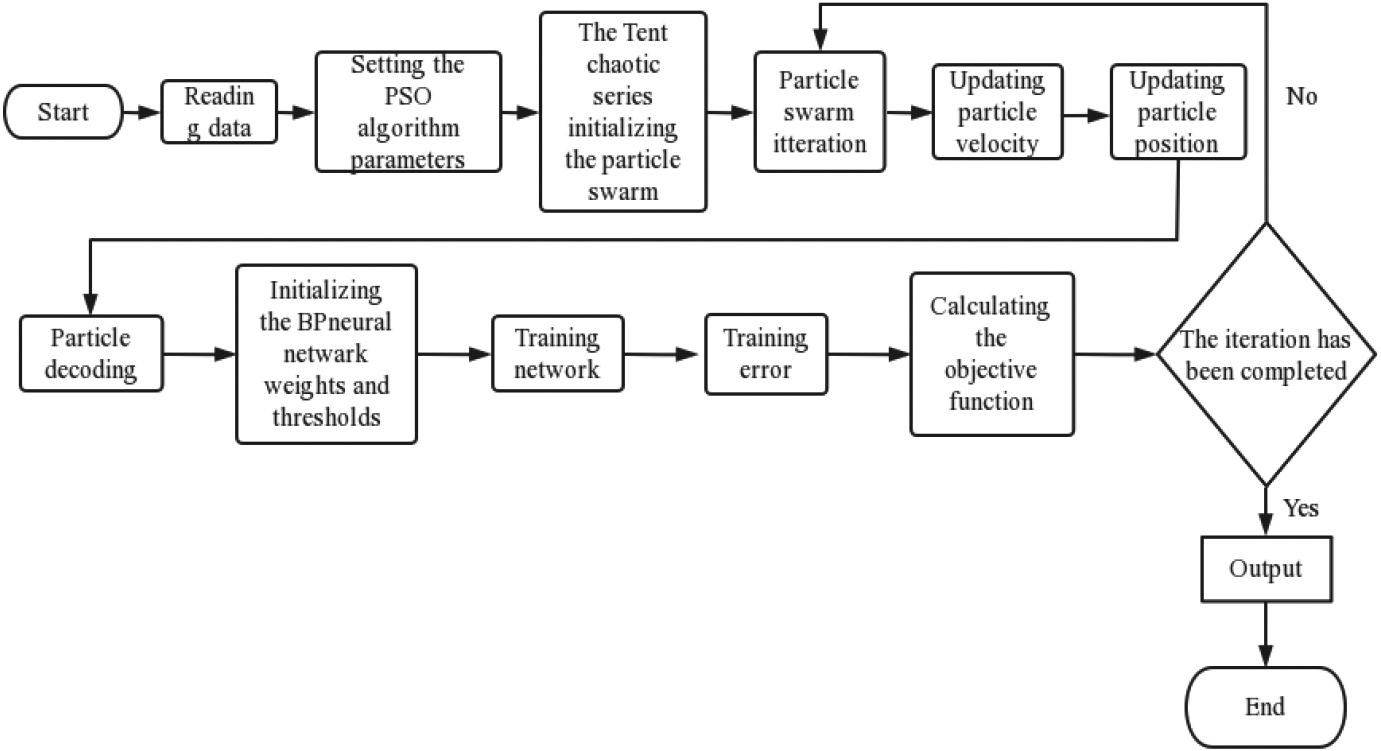
As shown in Fig. 1: first, the data is read, then set the PSO algorithm parameters, then initialize the particle population with Tent chaotic sequence, then update the particle velocity, then update the particle position, then update the particle decoding, initialize BP neural network weight and threshold, then train the error, then calculate the target function, if the iteration is finished; if the iteration is not finished, continue the particle population iteration, and then complete the synchronization operation.
Through real number encoding, the position vector of each particle is obtained, which corresponds to the decision variable of each dimension. The objective function value is calculated by using the corresponding decoding method, and the optimization of the objective function is completed by constantly updating the velocity and position vector. Because the weight and threshold of BP neural network are real numbers, it is more convenient to use real number encoding, which has higher efficiency. The length of the code is determined by the problem to be optimized. If there are n points, the encoding length is n, and the genes are n real numbers arranged in order. The range is within the interval specified by the upper and lower limits of the independent variables. For example, if the encoding length
For PSO-BP neural network, the encoding length
The process of chaotic particle optimization algorithm
Chaotic initialization encoding
(1) The tent chaotic series is firstly generated according to the following formula
Tent chaotic map is defined as:
The series
The chaotic random number
Where psox is the position of the particle,
A population of n particles searches a d-dimensional space (the number of dimensions of each particle). Each particle is expressed as:
The historical optimal value pi found by oneself, The optimal value of all particle search
The particle velocity update formula is as follows:
The particle position update formula is as follows:
Where
C1 is the weight coefficient of the particle tracking its own historical optimal value, which represents the particle’s own knowledge, so it is called “cognition”. It is usually set to 2, and it is set to 1.8 in this example.
C2 is the weight coefficient of the particle tracking its group optimal value, which represents the particle’s knowledge of the whole group, so it is called “social knowledge”, often called “society”. It is usually set to 2, and in this example it is set to 1.7.
And
R is a coefficient added to the velocity when we update the position, and this coefficient is called the constraint factor. It is usually set to 1.
The particle code is directly assigned to the weight and threshold matrix of BP neural network, and the predicted value is obtained by BP neural network prediction. After comparing with the actual value, the fitness of each particle is obtained by taking the sum of squared errors as the objective function.
Analysis of empirical results
Data sources and data processing
This text collected the opening price (first set of data) and closing price (second set of data) of Yunnan Culture stock from January 03, 2017 to December 08, 2021, all the data are from Flush software, and processed the data in a way that lags one period, For example, column Y is the original data, column X1 is one period behind for column Y, column X2 is one period behind for column X1, column X3 is one period behind for column X2, column X4 is one period behind for column X3, and column X5 is one period behind for column X4. We use X1-X5 as the input variables of the stock price prediction model (X) and column Y as the output variables of the stock price prediction model (Y) for a total of 1200 data.
Comparison of trends between opening price and closing price.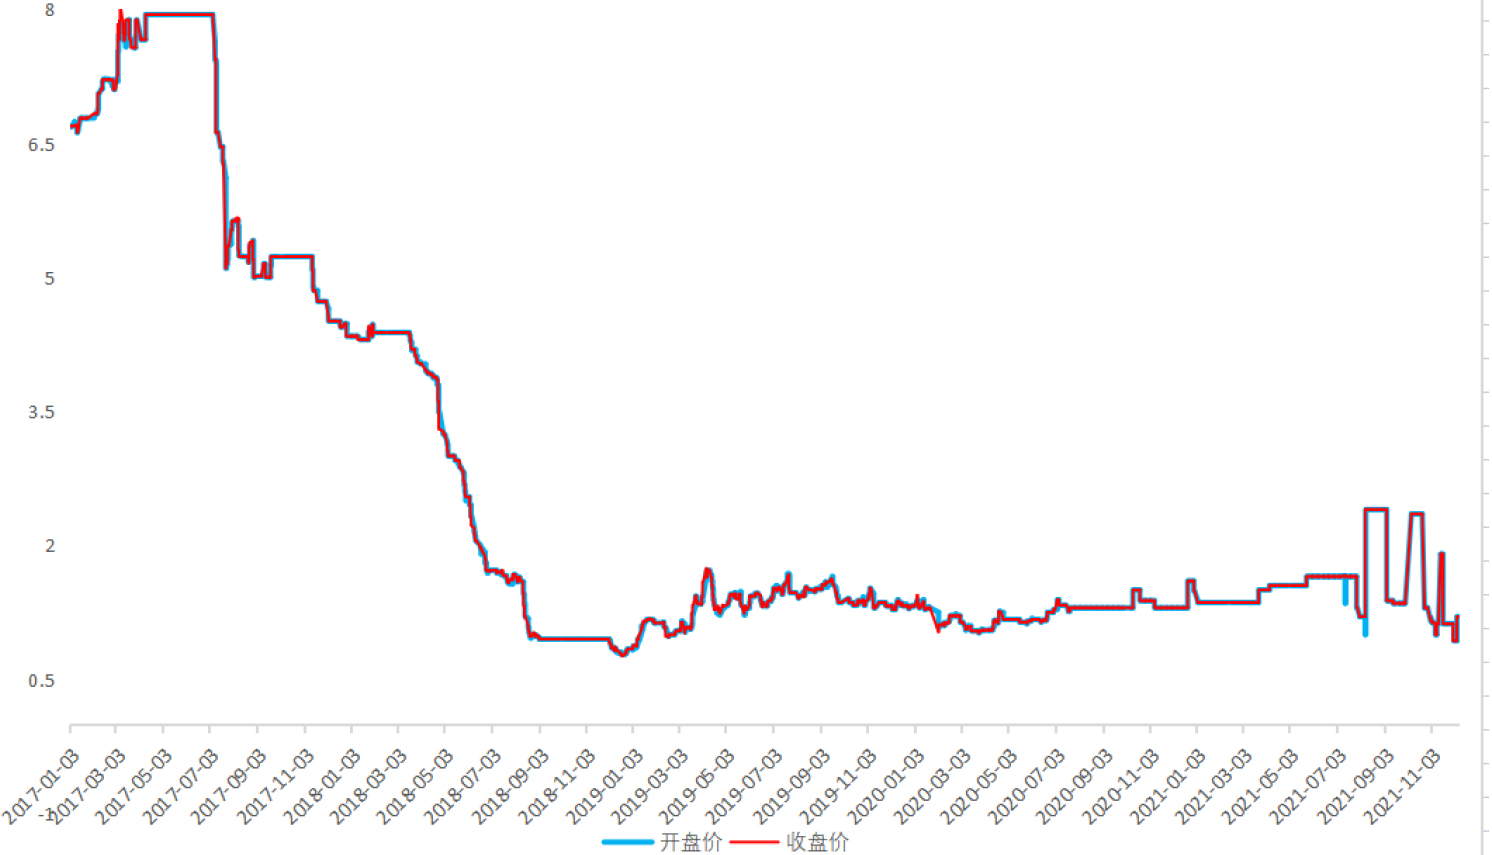
We collected the opening price (the first set of data) and closing price (the second set of data) of Yunnan ethnic culture stock from January 03, 2017 to December 08, 2021. After comparing the trend chart, it is found that from June 2017 to August 2018, the opening and closing prices of Yunnan ethnic culture stock show a significant downward trend. This is caused by the decline of the flagship brand of Yunnan ethnic culture. In 2019, Yunnan ethnic culture explored new markets, looked for new cooperation channels, and increased the tour business with high profits. From August 2018 to December 2019, it showed a small range of fluctuations from 0.79 to 1.72, with an overall upward trend. However, since the outbreak of COVID-19 in early 2020, the opening and closing prices of Yunnan ethnic culture stock have shown a significant cliff decline, and after February 2020, they have shown a tortuous upward trend. Finally, due to the amortization amount of Lijiang Yunling Theater included in the current profit and loss and the impact of COVID-19, it showed a trend of drastic fluctuations from August 2021 to December 2021.
Establish evaluation indicators
In terms of forecasting model construction, this article construct four models of chaotic particle swarm, chaotic ant swarm, chaotic bee swarm, and chaotic fruit fly for comparison, five evaluation indicators, namely, coefficient of determination (R-Square), mean square error (MSE), root mean square error (RMSE), mean absolute percentage error (MAPE), and mean absolute deviation (MAD), were calculated from the output values of the forecasting models to the actual values as indicators for evaluating and analyzing the forecasting ability of the four forecasting models.
We calculate the opening and closing prices of Yunnan Culture stock for two sets of data using each of the above four algorithms, and use five evaluation indicators to compare the predictive ability of the four models, where the formulas for each of the five evaluation indicators are
R-Square, its formula is:
Mean Square Error, MSE, its formula is:
Root Mean Square Error, RMSE, its formula is:
Mean Absolute Percentage Error, MAPE, its formula is:
Mean Absolute Deviation, MAD, its formula is:
Particle swarm optimization neural network error convergence plots for opening prices.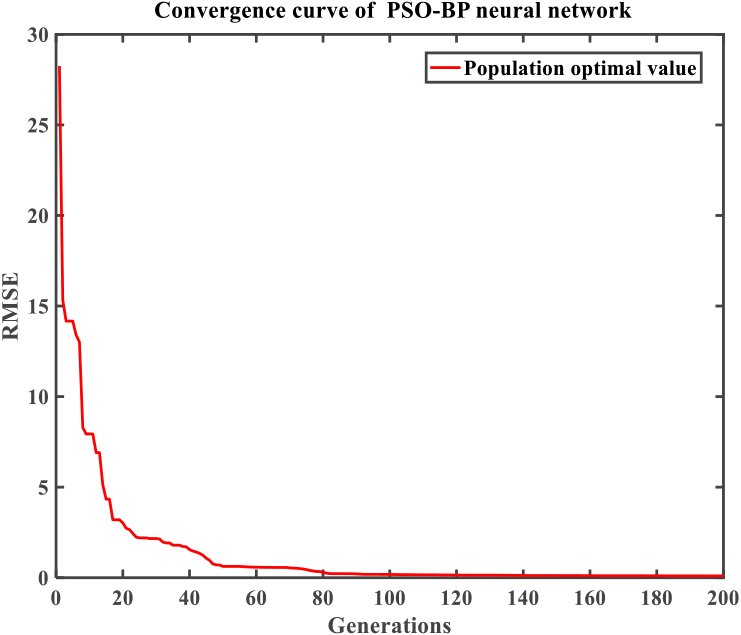
Ant colony algorithm optimization neural network error convergence plots for opening prices.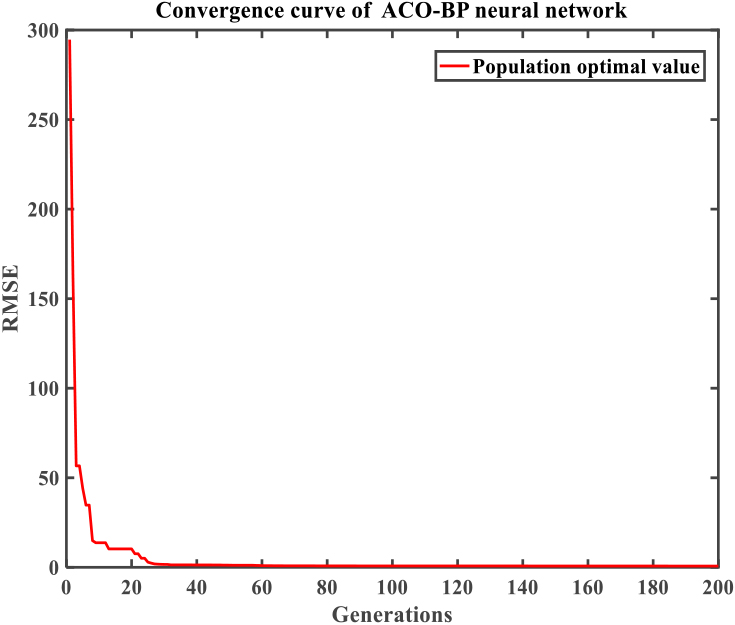
Artificial bee colony algorithm optimization neural network error convergence plots for opening prices.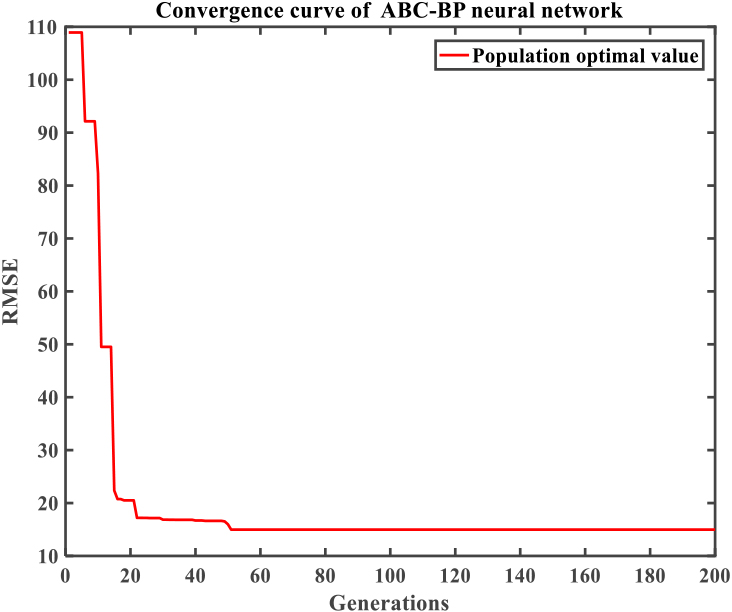
Drosophila algorithm optimization neural network error convergence plots for opening prices.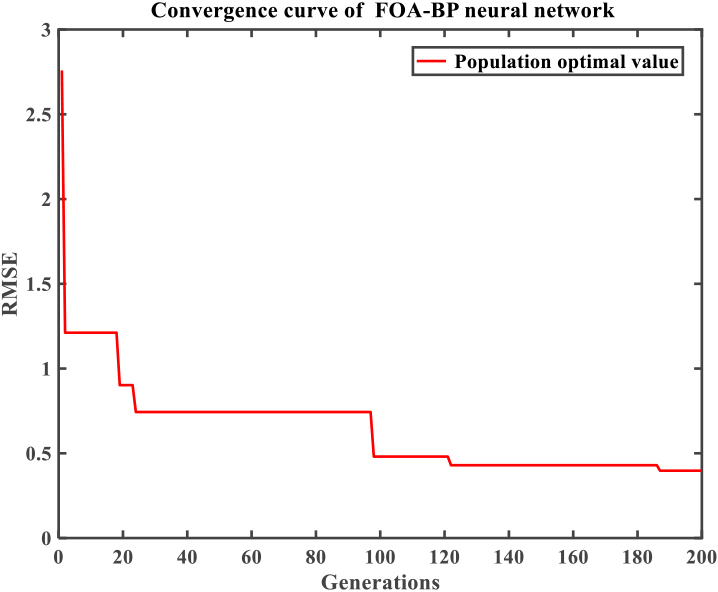
Particle swarm optimization neural network error convergence plots for closing prices.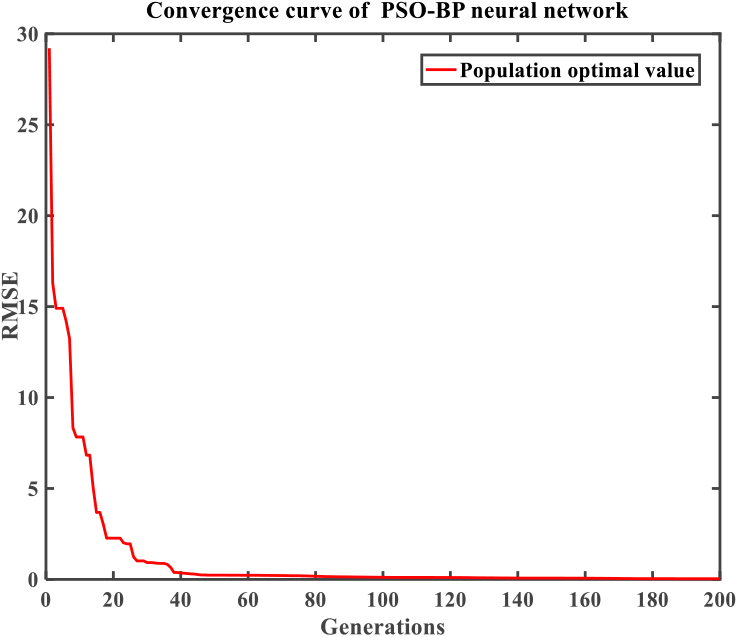
Ant colony algorithm optimization neural network error convergence plots for closing prices.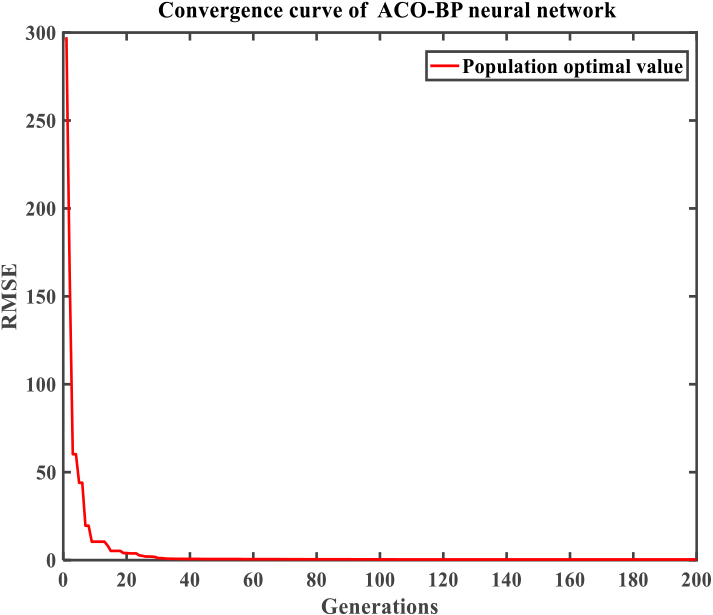
Artificial bee colony algorithm optimization neural network error convergence plots for closing prices.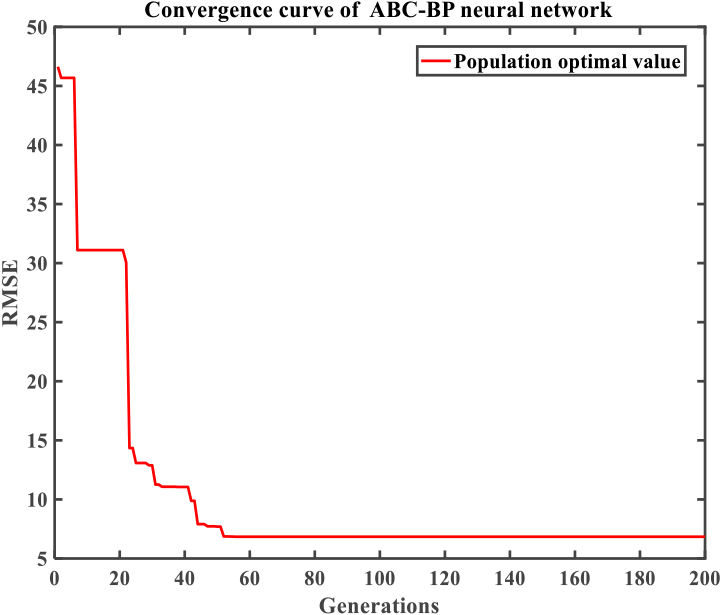
In terms of predictive model construction, this paper uses the self-editor of MATLAB to forecast the error term. According to the opening price (the first set of data) to calculate four kinds of model error convergence graph as shown in Figs 3–6 above, it can be seen that, relative to other three kinds of models, the convergence of using chaotic ant colony optimization algorithm is the earliest, the decline velocity is the fastest, and the error decline trend is the most stable. It converges at about the 30th iteration, followed by chaotic particle swarm optimization algorithm, which converges at about the 80th iteration. When the iteration infinitely tends to 0, the RMSE of the chaotic particle swarm optimization algorithm infinitely tends to 30, while the RMSE of the chaotic ant colony optimization algorithm infinitely tends to 300, and the error is 10 times that of the chaotic particle swarm optimization algorithm. At about the 10th iteration, the RMSE of the chaotic particle swarm optimization algorithm is below 10, and the RMSE of the chaotic ant colony optimization algorithm is obviously above 10. It can be seen that the error of using chaotic particle swarm optimization algorithm is smaller than those of the other three models, and the accuracy is relatively high. Therefore, compared with the other three models, the stock price prediction model established by chaotic particle swarm optimization algorithm has better prediction ability.
The error convergence plot of the four models calculated according to the closing price (the second set of data) is shown in Figs 7–10. It can be seen that the chaotic ant colony algorithm has the earliest convergence, the fastest decline speed and the most stable error decline trend compared with the other three models. It converges at about the 25th iteration, followed by the chaotic particle swarm, which converges at about the 40th iteration; the RMSE of the chaotic particle swarm algorithm tends to 30 indefinitely when the iteration tends to 0, while the RMSE of the chaotic ant colony algorithm tends to 300 indefinitely with 10 times more error than that of the chaotic particle swarm algorithm, and at about the 20th iteration, the RMSE of the chaotic particle swarm algorithm is below 5 and the RMSE of the chaotic ant colony algorithm is obviously above 5. It can be seen that the error of the chaotic particle swarm is smaller than the other three models, and the accuracy is relatively high. Therefore, the use of chaotic particle swarm algorithm to establish a stock price prediction model has better prediction ability than the other three models.
Index analysis
Among the five evaluation metrics, the closer the metrics 2 through 5 are to 0, the more accurate the model is. The closer the 1st indicator is to 1, the higher the accuracy of the model. The results of the opening price analysis of Yunnan Culture stock are shown in Table 1:
Results of the five evaluation indicators of the opening price
Results of the five evaluation indicators of the opening price
Drosophila algorithm optimization neural network error convergence plots for closing prices.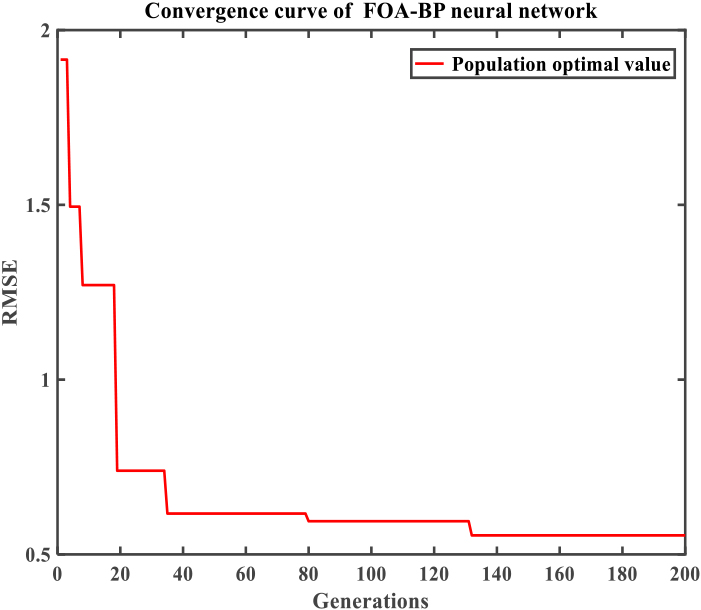
Results of the five evaluation indicators of the closing price
It can be seen from Table 1 that among the five evaluation indicators of the models obtained by using the first set of data to perform the four algorithms, the MSE obtained by the chaotic particle swarm (PSO-BP) algorithm is 0.00206, the RMSE is 0.04539, the MAPE is 2.06896, and the MAD is 0.00206. It is 0.03184, which is lower than the other three models; and the R2 is 0.98492, which is also higher than the other three models. As can be seen from Table 2, among the five evaluation metrics of the models obtained by the four algorithms using the data of group 2, the MSE obtained by the chaotic particle swarm (PSO-BP) algorithm is 0.00075, the RMSE is 0.02741, the MAPE is 1.32063, and the MAD is 0.01998, all of which are lower than the remaining three models; and the R2 is 0.99090, which is also higher than the remaining three model. Therefore, the chaotic particle swarm algorithm has a better prediction ability than the other three models.
Summary
By searching for information, we found that the stock “Yunnan Culture” has a relatively profound representation in the folk dance art enterprises, and this stock is listed on the New Third Board Market, with a small transaction volume, which has deep research significance. Therefore, we used the four algorithms of chaotic particle swarm algorithm, bee colony algorithm, fruit fly algorithm and ant colony algorithm, and used the opening price of the “Yunnan Culture” stock from January 03, 2017 to December 8, 2021. Compared with the closing price data, the size of the five indicators of R2, MSE, RMSE, MAPE, and MAD of the four models, the convergence speed of the neural network convergence graph, and the degree of stability of the decline are compared and analyzed. The results show that:
From the evaluation indicators: whether it is the opening price or the closing price, the MSE, RMSE, MAPE, and MAD obtained by the chaotic particle swarm (PSO-BP) model are all lower than the other three models, while R2 is higher than the other three models. Therefore, for the stock of “Yunnan Culture”, the use of chaotic particle swarm algorithm to establish a stock price prediction model has better prediction ability than the other three models. From the iterative graph: whether it is the opening price or the closing price, the error of the chaotic particle swarm is smaller than that of the other three models, and the accuracy is relatively high. Therefore, the use of chaotic particle swarm algorithm to establish a stock price prediction model has better prediction ability than the other three models. Overall: the optimal values of R2, MSE, MSPE, and MAD for predicting the opening and closing prices of the stock “Yunnan Culture” were obtained during the training of the PSO-BP model, which is a model suitable for this study and has practical application.
Although the chaotic particle optimization neural network proposed in this paper has better prediction ability in stock model validation, it still has the following shortcomings:
Although the overall effect of chaotic particle swarm is the best compared to the other three models, the convergence speed and decline speed have some disadvantages compared to chaotic ant swarm. In this paper, the stock of Yunnan Culture is chosen as the research object, which is listed in the New Third Board market and has a small trading volume, which has a deeper research significance to a certain extent, but also because of the small change in the stock price and a shorter research time.
Data availability
The datasets used and/or analyzed during the current study are available from the corresponding author on reasonable request.
Ethical approval
Written approval for the publication of this paper was obtained from the Hubei University of Arts and Science and all authors.
Footnotes
Conflict of interest
The authors declare no potential conflicts of interest with respect to the research, authorship, and/or publication of this article.