
Abstract
Instinctive response was produced for protecting drivers from injury when facing incoming collisions. For better understanding it’s influence of lower extremity injury, this study proposed an approach to analyze the collision injury considering the instinctive response posture and musculoskeletal characteristics. 20 male drivers were recruited for an instinctive response test in driving simulator and their lower extremity postures and muscle activation of 8 major ones at the collision moment were collected. The difference between different postures and muscles were analyzed and their influence on injuries were investigated by collision simulation. Results showed that increased possibility for the right leg holding on the air or even on the accelerator pedal with increased emergency level at the collision moment. Significant difference existed in different muscles between different postures. The introduction of instinctive response changed the driving posture and musculoskeletal characteristics, which further influence the lower extremity injury. This study help understanding the accurate behavioral and injury procedure and providing support for design a better restraint systems.
Introduction
According to the statistic results, vehicle accidents still happened frequently [1]. Annual statistics report of traffic accident in People Republic of China showed that 173880 cases were reported in 2018, which car to car accidents account for 70.99% [2]. Among them, frontal crash is one of the most common crash types with high frequency and severe injury.
Through persistent efforts, lethal head and chest injuries in frontal collision accidents have been significantly reduced. However, due to the inability of seat belts and airbags to adequately protect the lower extremities, lower extremity injuries have become the most common form of injury in automobile collisions [3]. The higher the AIS (Abbreviated Injury Scale) level, the more severe the injury, with a total of seven levels based on the degree of injury. Statistical analysis of traffic accidents involving vehicles with different restraint systems reveals that the lower extremities are the most frequent site of AIS2
During driving, drivers will exhibit various seating postures due to factors such as maneuverability and comfort. When confronted with emergency situations, drivers will exhibit instinctive responses to protect their safety, such as releasing the accelerator pedal, moving to the brake pedal, and pressing the brake pedal. Most existing research considering driver posture focuses on the impact of out-of-position scenarios on motion control and collision injury. Behr analyzed drivers’ braking behavior when faced with emergency situations from a relatively microscopic perspective and summarized a set of standard braking postures [7]. A finite element (FE) model of the foot and leg was developed to improve understanding of injury mechanisms of the ankle and subtalar joints during vehicle collisions and to aid in the design of injury countermeasures [8]. However, drivers’ response postures are constrained by their reaction capabilities, which are affected by external factors such as emergency severity and internal factors such as gender. Therefore, it is necessary to study the influence of the position of the driver’s lower extremities at the moment of collision on their injuries.
During a collision, the presence of instinctive responses causes drivers to adopt emergency braking, leading to changes in muscle physiological states for self-protection [9, 10]. This muscle activation feature (Electromyogram, EMG), which expresses the changes in skeletal muscle characteristics, affects the kinematic and dynamic responses of drivers during a collision [11]. Mühlbeier et al. quantitatively examined the subjects’ neck muscle activity during low-velocity left-frontal-oblique impacts to gain further insights into the neuromuscular mechanism [12]. The results suggested that muscle activation can reduce the pitch angle of the head, and active muscle response helps to decrease the risk of neck injuries in low-severity frontal collisions, while it may increase the risk in high-severity collisions. Nie et al. demonstrated through a computational biomechanical analysis of 32 muscle activation states that active muscle response may elevate the risk of lower extremity injuries [13]. Graci et al. quantify the influence of age on key occupant kinematic, kinetic, and muscular responses during evasive swerving in on-road testing [14]. Li et al. established a model that simulates emergency responses of drivers during frontal impacts by mimicking active muscle contraction [15]. The results indicated that muscle contraction during impact increases the additional load on the lower extremities and elevates the risk of lower extremity injuries. Concerning femur injuries, muscle contraction adds approximately 1 kN axial load to the femur, and the synthetic bending moment of the femur also increases by around 10–40 Nm. Xiao et al. studied the changes in lower extremity knee joint injuries under load impact environments caused by active muscle function [16]. The results revealed that with the use of active muscle function, the vulnerable areas of the lower extremities shift towards the middle of the long bones, and the defects of the knee joint also enlarge. Therefore, when conducting injury analysis, it is necessary to consider the muscle activation of the driver’s lower extremities [17].
As a complex biological system, drivers’ skeletal muscle characteristics and posture exhibit a certain coupling relationship. Therefore, when analyzing injuries, it is essential to comprehensively consider their coupled influence. This study first designed an experiment on instinctive response to analyze the spatial distribution of drivers’ lower extremities during collision and collected their skeletal muscle characteristics. Subsequently, the independent influence of instinctive response-induced posture changes on injuries and the combined impact of posture and skeletal muscle characteristics on injuries were assessed through collision simulation analysis.
Experimental design
Experimental conditions and procedure
Statistical data indicate that in China, two-way, two-lane road types account for 95.1% of all road types. According to the Road Traffic Accident Statistics Annual Report, illegal overtaking, driving in the wrong direction, unlawful lane changes, illegal meeting of vehicles, and failure to yield as required are significant causes of traffic accidents [19].
Therefore, building upon the research of McGehee et al., this study constructed a 5 km long straight section of a two-way, two-lane road in a driving simulator as the foundational scenario [20]. Test subjects drove at a specific speed on this roadway, while several vehicles traveled in the opposite direction on the adjacent lane. To prevent drivers from having advance knowledge of suddenly appearing obstacle vehicles, the spacing between vehicles in the opposing traffic flow was set at 5 meters. To avoid drivers misjudging hazardous situations, only the test vehicle traveled in the test lane. Obstacles were placed along the right edge of the test lane to prevent volunteer drivers from making steering maneuvers. At a certain distance from the test vehicle, a vehicle from the opposing lane would abruptly cut into the test lane, prompting the volunteer driver to perform an emergency braking maneuver based on their instinctive response. Notably, the selection of which vehicle from the opposing lane would cut into the test lane during the experiment was random, ensuring that the driver’s braking operation was based on instinctive response without any prior anticipation or psychological preparation.
Pre-collision scenario.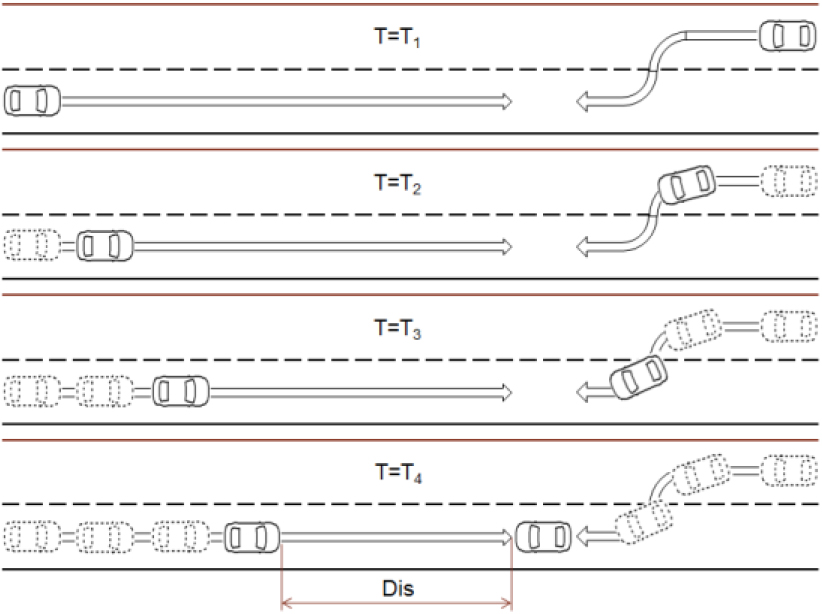
The schematic diagram of the pre-collision scenario is shown in Fig. 1. At time T1, both the subject vehicle and the obstacle vehicle initiate simultaneously, rapidly accelerating to a designated speed (Vo) and traveling at a constant velocity. At time T2, the obstacle vehicle begins to change direction, preparing to merge into the subject vehicle’s lane. At time T3, the obstacle vehicle begins to straighten out, and at time T4, it fully enters the subject vehicle’s lane. At the moment the obstacle vehicle fully enters the subject vehicle’s lane, the distance between the two vehicles is set as Dis.
In the simulated collision experiment, the subject vehicle’s speed (Vo) and the relative distance (Dis) between the subject vehicle and the obstacle vehicle are used to characterize the urgency of the pre-collision scenario. The relative distance is defined as the instantaneous distance between the two vehicles when the obstacle vehicle fully enters the subject vehicle’s lane. The higher the speed and the shorter the relative distance, the greater the urgency. In the experiment, the subject vehicle’s speeds are set at 25, 50, 75, and 100 km/h, and the relative distances are set at 20, 40, 60, and 80 m, yielding a total of 16 scenarios.
Each driver is required to perform experiments for all 16 scenarios, and to minimize the influence of learning effects on the experimental results, each scenario is tested only once, and the order of appearance of these scenarios is randomized. During the experiment, the subject vehicle’s speed must be maintained within
Considering factors such as the physiological health and ethics of the subjects, high-risk pre-collision scenarios cannot be tested in real-vehicle field experiments. Therefore, a pre-collision scenario was constructed on a vehicle performance simulator in the State Key Laboratory of Automotive Simulation and Control at Jilin University. The vehicle performance simulator virtually replicates the driver-vehicle-road system, allowing real drivers to test driver behavior without risk. The road environment is displayed through projection and stitching, providing drivers with a 360∘ panoramic view. The driving simulator incorporates a complete sedan, including a steering wheel, accelerator pedal, brake pedal, and vehicle instrumentation, which the driver can operate to control the vehicle. To measure the forces applied by the driver to the pedals during driving, an EVT-14W small pedal-type force sensor, manufactured by Shanghai YouRan Sensor Company, was installed on both the accelerator and brake pedals, with a range of 0–100 kg. The external and internal schematic diagrams of the vehicle performance simulator are shown in Fig. 2.
Vehicle performance simulator.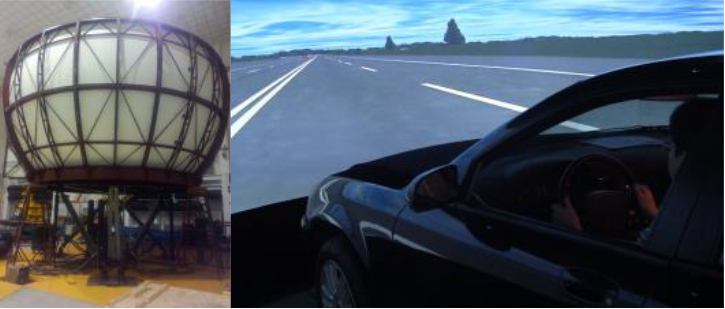
The wireless physiological recorder used in this study is the MP150 model, produced by the American company BioPac, as shown in Fig. 3. This device has multiple physiological data acquisition channels, capable of simultaneously collecting electrocardiogram, electroencephalogram, electromyogram, electrodermal activity, respiration, and other physiological signals, or simultaneously collecting electromyographic signals from multiple muscles. In addition, the device has multiple digital input and analog output channels for receiving signals from other sensors or synchronizing signals, enabling synchronization with other data acquisition devices and improving data accuracy. Different devices were synchronized through a uniform step signal sent by the driving simulator at the beginning of the simulated scenario, so all the devices were in the same time schedule.
Wireless physiological recorder.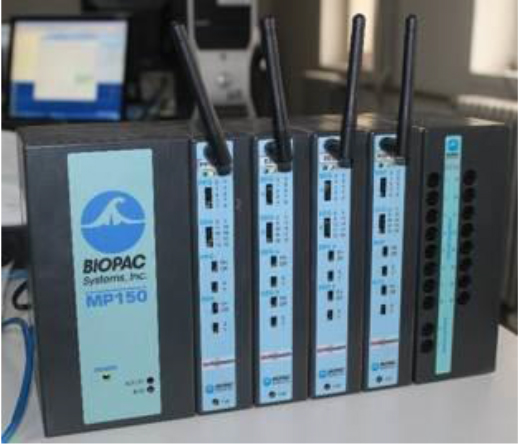
To more effectively describe the motion characteristics of drivers’ lower extremities, it is necessary to select representative primary muscles for electromyographic signal measurement. Extensor muscles are any muscles that stretches or extends an arm, leg, or other bodily part and flexor muscles are any muscles whose contraction serves to bend a joint or limb. Based on human anatomy and previous research, and in order to ensure that the ankle, knee, and hip joints are all affected by extensor and flexor muscles during movement, this study selected eight primary muscles for investigation, as shown in Fig. 4: (1) Tibialis Anterior (TA, ankle joint flexor); (2) Soleus (SOL, ankle joint extensor); (3) Gastrocnemius (GAS, ankle joint extensor and knee joint flexor); (4) Vastus Medialis (VM, knee joint extensor); (5) Vastus Lateralis (VL, knee joint extensor); (6) Rectus Femoris (RF, knee joint extensor and hip joint flexor); (7) Hamstrings (HAM, knee joint flexor and hip joint extensor); (8) Gluteus Maximus (GM, hip joint extensor) [21, 22, 23].
Primary lower extremity muscles.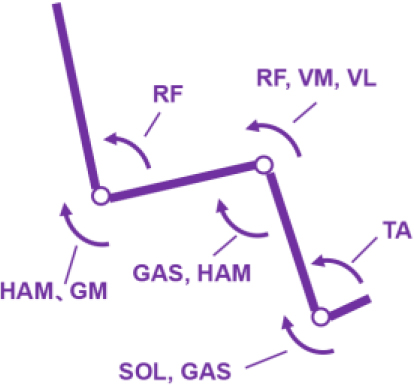
The instinctive response of drivers is greatly influenced by individual differences. In order to minimize the impact of drivers’ own conditions on the experimental results, this study imposed restrictions on drivers’ gender, age, and driving experience. Twenty male volunteers aged between 23 and 28, with an average age of 25.5 (1.6) years, were recruited for the experiment, representing young drivers. These drivers possessed valid driver’s licenses and had 2 to 4 years of driving experience, with an average of 2.9 (1.4) years, classifying them as novice drivers. Moreover, they had no special diseases or habits such as alcoholism, and their vision or corrected vision was normal. Prior to the experiment, the subjects were required to ensure adequate sleep to avoid fatigue. All participants received guidance on the driving test procedure and signed an experimental protocol specifying the safety responsibilities and use of experimental results.
Data processing
During the experiment, the driver’s control parameters for the vehicle and the electromyographic signals of their lower extremities were synchronously collected. Vehicle control parameters were primarily acquired by an automobile performance simulator, including the vehicle speed Vo (km/h), throttle pedal opening (%), brake pedal opening (%), and the distance (m) between the vehicle and the obstacle. The action forces Fap (N) and Fbp (N) exerted by the driver on the accelerator and brake pedals were obtained through small pedal force sensors.
Electromyographic signals were collected using a physiological recorder. After collection, the electromyographic signals were denoised through a Chebyshev band-pass filter with a frequency range of 10–350 Hz. To facilitate synchronous data processing and analysis, the sampling frequency of all data collection devices, including the automobile performance simulator and the physiological recorder, was uniformly set at 1000 Hz.
The Root Mean Square (RMS) value of EMG is widely used to describe the level of muscle activation. However, due to the variability of human skeletal muscle characteristics, we cannot directly obtain the muscle activation level from the RMS value of the electromyographic signal. In medicine, the Activation (A) of a muscle is defined as the current electromyographic signal’s RMS value divided by the RMS value of the electromyographic signal during Maximum Volunteer Contraction (MVC):
Where, represents the current electromyographic signal’s RMS value, and represents the RMS value of the electromyographic signal during MVC.
Therefore, two hours before the formal experiment for each driver, a calibration test for Maximum Volunteer Contraction was conducted on the eight main muscles of the driver’s lower extremities. The testing method referred to previous research [24] and is not elaborated upon here.
When facing emergencies of different severity, there are two positional relationships between the vehicle and the obstacle vehicle: the vehicle is fully braked, or the vehicle collides with the obstacle vehicle. In the experiment, the probability of collision was 62.81% (201 out of 320 trials), and the probability of complete braking was 37.19% (119 out of 320 trials). In this study, the analysis will primarily focus on the instinctive response posture and muscular characteristics of drivers under collision conditions.
Instinctive response posture
In the face of emergency conditions, drivers will have an instinctive braking response to protect their safety. During the braking process, the time required for the lower extremity to move from the brake pedal to the accelerator pedal must be taken into account. As a collision may occur at any moment after the appearance of an obstacle, the right leg may be located in: (1) the accelerator zone: the driver has a braking intention but cannot brake yet; (2) the air zone: the driver is performing the braking action but has not generated braking force; (3) the braking zone: the driver has begun braking. TCOL is defined as the moment when the vehicle and the obstacle vehicle collide (relative distance Dis is zero), and the reaction time course is divided into three zones (corresponding to three different right leg postures), as shown in Fig. 5: (1) accelerator zone (TOBS to TG0): at the time of collision, the lower extremity is on the accelerator pedal; (2) air zone (TG0 to TBON): At the time of the collision, the lower extremities are in the air; (3) braking zone (TBON to TBT): At the time of the collision, the lower extremities are on the brake pedal.
In the present study, the left leg of the driver remained on the footrest throughout the experiment, as the vehicle integrated into the driving simulator utilized an automatic transmission, eliminating the need for a clutch pedal.
At the moment of collision, the frequency of the driver’s right leg assuming different postures is shown in Table 1. The probability of the right leg being in the accelerator zone was 9.45% (19 out of 201 trials), in the airborne zone was 15.42% (31 out of 201 trials), and in the braking zone was 75.13% (151 out of 201 trials).
Properties of raw materials
Properties of raw materials
Reaction time course partitioning.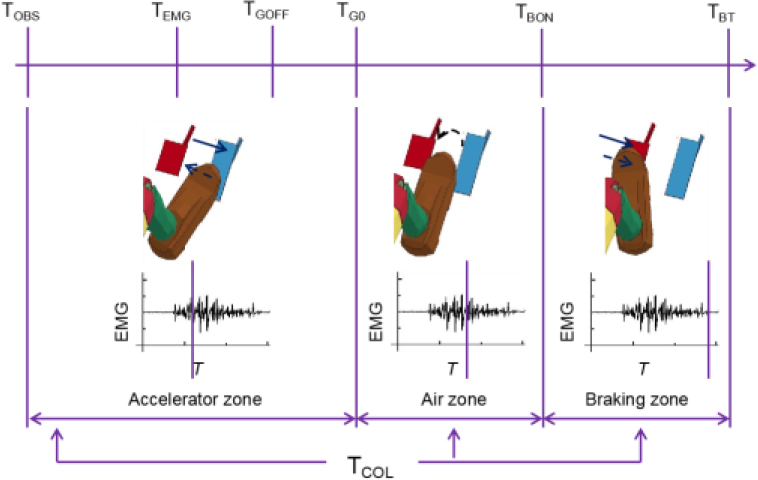
In the simulated collision experiment involving real drivers conducted in this paper, the musculoskeletal properties of both the left and right legs were measured, and the muscle activation characteristics of the left and right legs were statistically analyzed. First, the mean and standard deviation of the muscle activation level (ACOL) at the moment of collision were calculated. Under the same lower extremity condition, a one-way analysis of variance was performed on the ACOL with posture and muscle as variables. During the statistical analysis, the significance coefficient was set to 0.05.
The mean and standard deviation of ACOL for the 20 male volunteers with lower extremity posture and muscle as variables are shown in Fig. 6. In the figure, “&” and “*” represent significant differences between different genders and different lower extremities, respectively; P1 denotes the lower extremity on the accelerator, P2 on the airborne, and P3 on the braking.
Muscle activation level for different muscles under different postures at the moment of collision: (a) right leg; (b) left leg.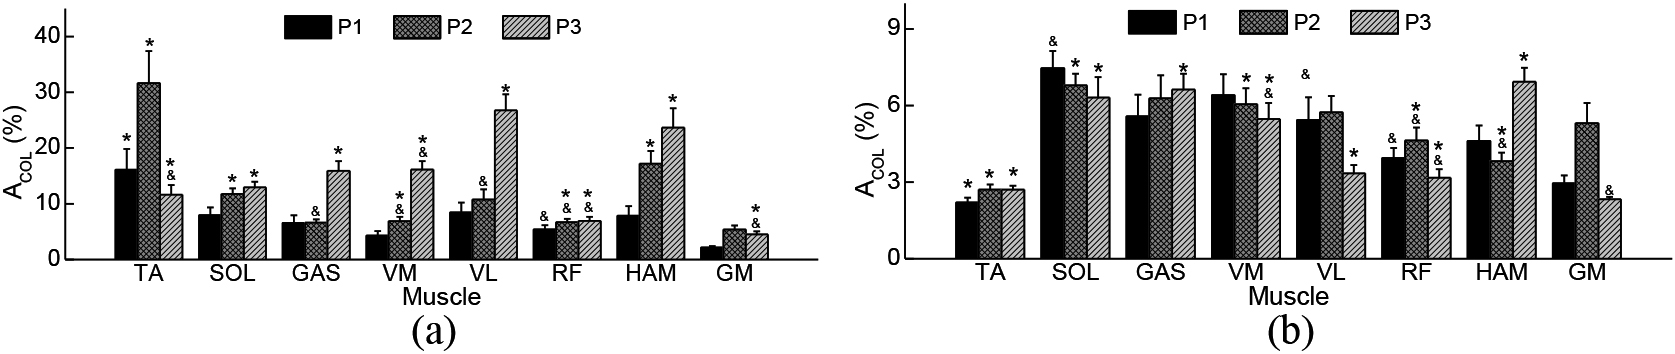
First, the ACOL of the male’s right leg was analyzed. For the same muscle, when the lower extremity is in different postures, there are certain differences between the ACOL of most muscles. There is a significant difference (
For the male’s left leg ACOL, there are significant differences (
In summary, as the emergency level increases, namely, the increase of the vehicle speed (Vo) and the decrease of the relative distance (Dis) between the vehicle and the obstacle, the muscle activation level of the driver’s right leg rises during the collision. However, if the situation is highly urgent, the driver may not be able to respond and enters the collision phase in a normal driving posture, resulting in a decrease in the muscle activation level of the driver’s right leg.
Significant differences in muscle activation exist when the lower extremities are in different postures, especially for the right leg of both males and females. The ACOL of SOL, VM, VL, and HAM are significantly higher in the braking phase than in the throttle phase. SOL is an ankle extensor, while VM and VL are both knee extensors, and HAM is a hip extensor. During the braking action, the range of motion is larger, and thus, these four muscles require greater activation.
As an ankle flexor, the right leg TA is the first muscle to respond during the braking action. Compared to the aerial and braking phases, the posture of the right and left legs is most similar in the throttle phase. Since the right leg needs to perform the braking action, the ACOL of TA is larger. In the aerial and braking phases, compared to the left leg, which is always on the floor, the right leg generates a larger range of motion. Therefore, for most muscles, the ACOL of the right leg is higher than that of the left leg in these two situations.
Muscular characteristics and vehicle control properties of the driver’s right leg at collision
(a) Frontal collision simulation environment with lower extremity muscle and (b) the collision pulse.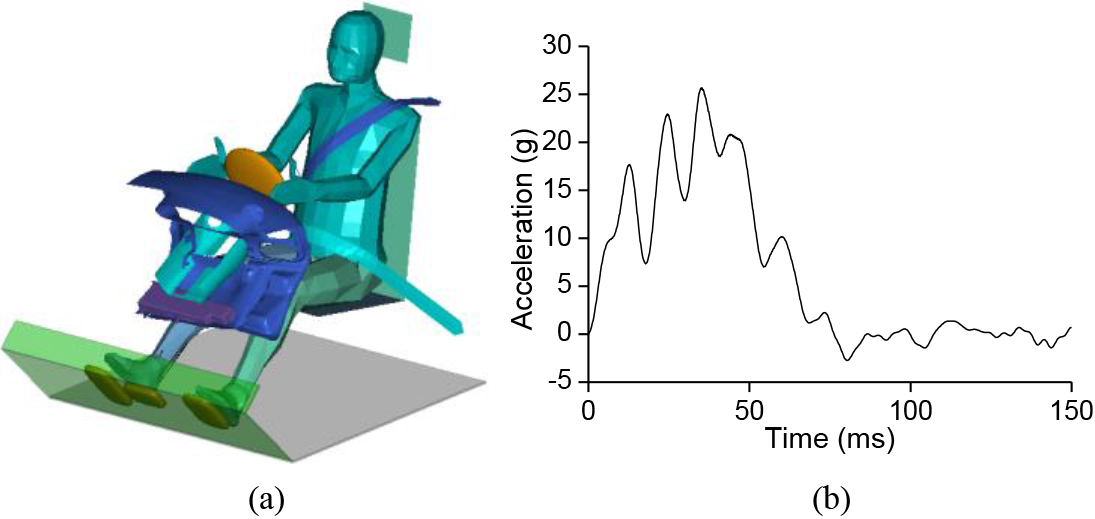
Simulation environment
To study the influence of driver’s instinctive posture and skeletal muscle characteristics on lower extremity injuries in frontal collisions, a frontal collision model is established. The model includes instrument panel, pedal, seat, driver, and seatbelt models, as shown in Fig. 7. The instrument panel assembly and pedal assembly are similar to real vehicles, featuring throttle pedal, brake pedal, and footrest; the seat model consists of headrest, backrest, cushion, and floor; the seatbelt model adopts a finite element and multi-rigid body hybrid model. The driver uses the MADYMO 50th percentile Facet human body model integrated with lower extremity muscle tissue, and the lower extremity muscle tissue adopts the Hill-type model, with muscle force consisting of active and passive forces.
Scenario and parameter definitions
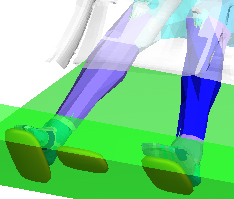
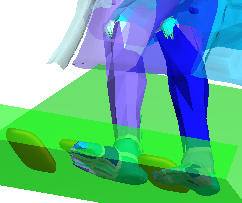
Firstly, to investigate the impact of instinctive response on lower extremity injury, we selected a typical scenario involving a male driver’s collision posture at a Vo of 50 km/h and Dis of 20 m. During the collision, the probability of the driver’s right leg being in the accelerator area was 10.0% (2 out of 20 trials), in the air zone was 20.0% (4 out of 20 trials), and in the braking area was 70.0% (14 out of 20 trials). The left leg remained on the footrest. Consequently, in the simulation model, the driver’s right leg was placed on the accelerator, in the air, and on the brake, while the left leg was placed on the footrest.
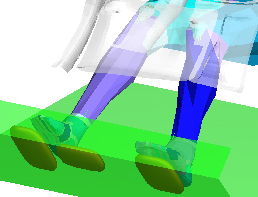
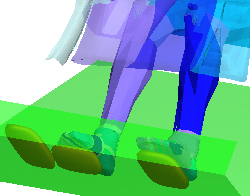
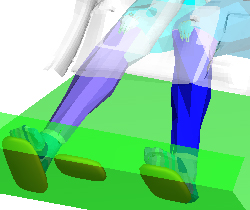
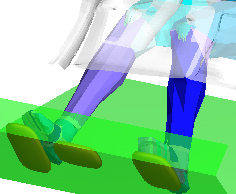
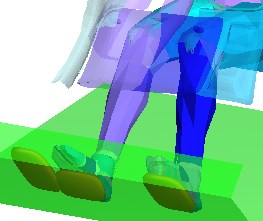
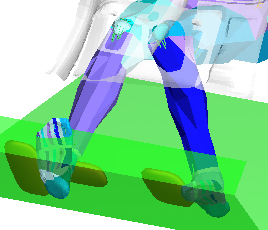
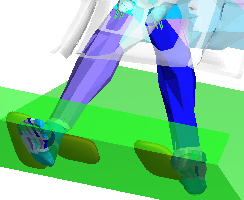
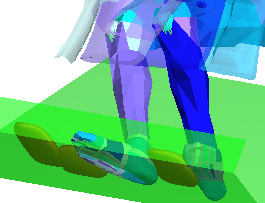
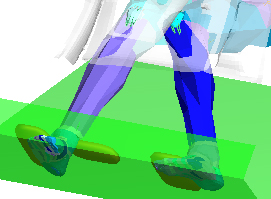
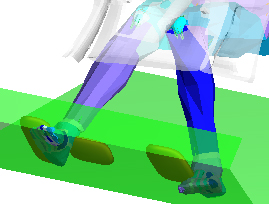
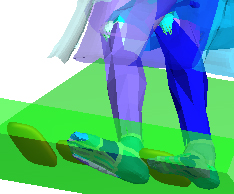
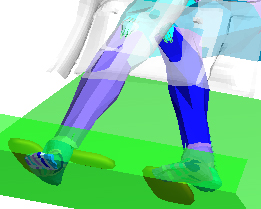
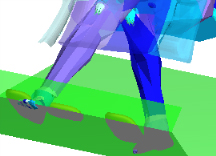
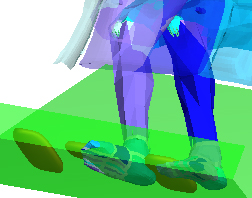
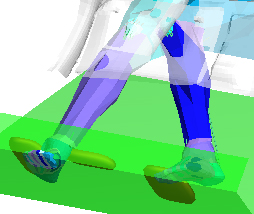
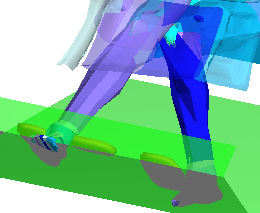
Lower extremity movement posture during collisions at different foot positions
Lower extremity movement posture during collisions at different foot positions
Footnotes
Acknowledgments
The authors acknowledge the National Key Research and Development Program of China (Grant: 2022YFB2503302, 2022YFB2503005), Innovation Projects of China Automotive Engineering Research Institute (Grant: CPYFA202207], Innovation Projects of Intelligent Connected Technology of CAERI (Grant 1032).