
Abstract
With the rapid development and widespread adoption of wearable technology, a new type of lifelog data is being collected and used in numerous studies. We refer to these data as informative lifelog which usually contain GPS, images, videos, text, etc. GPS trajectory data in lifelogs is typically categorized into continuous and discrete trajectories. Finding a point of interest (POI) from discrete trajectories is a challenging task to do and has caught little attention so far. This paper suggests an LP-DBSCAN model for mining personal trajectories from discrete GPS trajectory data. It makes use of the hierarchical structure information implied in GPS trajectory data and it is suggested a variable-levels, variable-parameters clustering method (LP-DBSCAN) based on the DBSCAN algorithm to increase the precision of finding POI information. Finally, the Liu lifelog dataset is subjected to a systematic evaluation. In terms of GPS data that are not evenly distributed geographically, the experimental results demonstrated that the proposed algorithm could more accurately identify POI information and address the adverse effects caused by the global parameters of the traditional DBSCAN algorithm.
Introduction
The importance of personal big data and lifelog data lies in their ability to provide valuable insights into individuals’ behaviors, preferences, and patterns. These datasets offer a wealth of information that can be leveraged for various purposes, such as personalized recommendations, targeted marketing strategies, and advancements in healthcare and well-being. Understanding and analyzing personal big data and life log data can lead to enhanced decision-making, improved services, and a deeper understanding of human behavior in the digital age.
With the rapid advancement of science and technology, we have paid attention to a class of personal stored data that primarily includes personal health data, lifelog data, etc., which refers to the Personal Big Data (PBD) [1, 2]. The obvious distinction between PBD and Big Data is that PBD refers to data generated by a specific person, and this kind of data is also of great importance. One of the sources of PBD is lifelog, and individuals can digitally record various aspects of their daily lives [3, 4, 5]. As a result, lifelog is produced for various scenes and purposes [6, 7, 8, 9]. Another of the typical PBD representatives is lifelog, which possesses all the traits associated with big data, including diversity of data, enormous scale, and little information in each data unit. However, the data exhibits privacy-related characteristics [10, 11], and there are many issues with the collection, management, storage, processing, and presentation of lifelog [12, 13, 14, 15].
There are many ways to record lifelogs today, which include writing blogs or tweeting, uploading images or videos to social media sites and applications, cell phone recordings, etc. These methods can allow us to take the action of recording actively. When those data, including GPS data, is generated during the implementation of life records, we can use it to analyze the locations or areas of interest to users. For instance, we take photos during social occasions and post them on Twitter, which includes geolocation information. POI is known as an information point, and it is any non-geographically significant point on a map, which contains location and other attributes information. As a result, POI detection is crucial for uncovering user behavior patterns and preferences. However, WeChat, Twitter, and other social media are not exclusively used to record personal lifelog, which is inclined to express users’ personal opinions. Currently, no long-term public dataset is dedicated to recording lifelog worldwide.
The lifelog typically contains the user’s GPS track information, which is divided into continuous and discrete types. The difference between the two types of GPS track information is the different time granularity. The former typically takes seconds or minutes as the basic unit, and this kind of data typically comes from portable GPS positioning devices or smartphones, while the latter typically takes hours or days as the basic unit. This kind of data typically comes from the lifelog [1, 16].
Data sources for interest point mining are classified into various types, such as textual information from social networking sites [17, 18, 19] and GPS track information [20, 21, 22, 33], which can be used for exploring travel purposes [22, 23], movement pattern detection [24], discovering hotspot areas [18, 19, 20, 21, 25, 26, 27, 28, 29, 30, 31, 32], spatial structure analysis [34, 35], etc. The following section mainly focuses on the use of smart devices, such as cell phones, which collects user GPS track information in the literature [26, 27, 28, 29, 30, 31, 32]. Those classes of studies are analyzed individual travel behavior and evaluated the activity space by improving the clustering algorithm in different aspects, which clusters the raw data to obtain POI. For instance, the literature [26] converts indoor location data into residential point sequences with rich semantic information, and combines the weighted edit distance algorithm to measure the similarity of trajectories, realizes trajectory clustering of indoor positioning data, and can effectively discover customers’ behavioral pattern in indoor environments. In the literature [27], data from 95 respondents and POI were analyzed and introduced as indicators. Finally, it was shown how GPS-based accessibility metrics in activity space could be used to investigate travel behavior. In the face of cyberspace, the literature [28] suggested adopting a clustering method called NS-DBSCAN that can precisely identify regions with a high concentration of cyber events. Based on nearly 6 months of cell phone tracking data, the literature [29] used a spatiotemporal detection algorithm to cluster and identify 93 locations that are popular with leisure travelers. To establish a foundation for encouraging healthy aging in cities, the literature [30] collected the activity space of 76 older adults for evaluation using smartphone GPS for 102 consecutive days. By comparing the similarity of Wi-Fi measurements, the literature [31] combined Wi-Fi and GPS to identify POIs and user behavior patterns. The literature [32] used smartphones for trip endpoint recognition and proposed a clustering algorithm based on spatiotemporal density, which considered both spatiotemporal travel track point density. Secondly, it further proposed three optimization models to optimize the recognition results.
In conclusion, there is a dearth of research on discrete GPS data, and the majority of current research on lifelog data has been done on continuous GPS data. Additionally, there are notable differences between continuous and discrete GPS data sets. Compared to continuous data, discrete data are more likely to be concentrated in specific areas and have apparent distributional differences. In the lifelog data we gathered, for instance, some densely populated areas have many data, such as Shenyang City in Liaoning Province, where there are 8265 pieces of data, and some sparsely populated areas have very little data, such as Siping City in Jilin Province, where there are only 680 pieces of data, and Dalian City in Liaoning Province, where there are only 38 pieces of data. However, these areas may also be very important to users. When using the DBSCAN method with discrete GPS data, the clustering effect is poor if the same global set of parameters is used. In order to extract POIs of discrete GPS data from lifelog data, a variable-levels, variable-parameters, and density-based clustering method (LP-DBSCAN) is designed and applied to the Liu lifelog dataset. Compared to the conventional density-based clustering method, the experimental results are shown that the accuracy of clustering results is increased, and the scalability and robustness of the algorithm are ensured.
The organization of the remaining sections of this article is as follows. Section 2 provides a brief introduction to the problem definition and the meaning of symbols. In Section 3, an improved algorithm model is proposed. Section 4 presents the clustering results and evaluates the effectiveness of the LP-DBSCAN algorithm on the dataset. Finally, Section 5 concludes this study, discussing the impact of the proposed algorithm on current research and providing some suggestions for future studies.
Problem statement
POI extraction is used a discontinuous lifelog dataset with GPS data, which is the issue that will be studied in this paper. The original data is first clustered, followed by an analysis of the clustering outcomes to determine the user’s area of interest. Finally, those data have extracted the POI.
For the convenience of description, relevant terms and symbols are defined as follows:
The GPS track information database
The easiest and most effective way is to stratify the data containing GPS information, which is to divide it by administrative regions. For example, the administrative division of the United States includes National level, State level, County level, and Municipal level. In China, it can be divided by country, province, city, and county. As shown in the following Table 1.
Examples of division by administrative region
Examples of division by administrative region
In this paper, clustering is conducted using the LP-DBSCAN algorithm, based on
The DBSCAN or its improved algorithm is typically used to solve the problem of clustering GPS points to extract POI [11, 24, 25, 29, 30, 31, 34, 35]. However, the accuracy of this algorithm when applied to this kind of problem is not high, and there will be two defects. The first is that the algorithm clustering is not variable level. If the clustering results are divided according to administrative regions to draw the clustering tree, all clustering results (leaf nodes) are at the same level. The second is that globally predetermined parameters are used, which cannot be changed dynamically based on where GPS points are distributed geographically. In order to improve the robustness by using the characteristics of the data set, this paper proposes an algorithm model with variable levels and variable parameters based on the traditional DBSCAN algorithm to solve the above problems.
(1) Variable levels
The balance of data distribution can meet strict criteria according to the conventional DBSCAN algorithm. GPS data has a close relationship with the division of geographic regions, and this relationship can be applied to GPS clustering analysis as an a priori knowledge. This relationship can be seen through the analysis of the intuitive visualization of the data, which reveals obvious regional differences in the distribution of GPS points. The number of GPS coordinates in various regions varies significantly, so the data are firstly split into coarse-grained categories based on the number of GPS coordinates in the region.
This paper performs a hierarchical top-down decomposition of the provided dataset, which is inspired by the hierarchical clustering algorithm [28, 36]. According to the relationship between samples
To achieve a better clustering effect, this paper firstly clusters
(2) Variable parameters
This section proposes a DBSCAN-based variable parameters partitioning method for further refinement of the data after the initial partitioning described above. In order to further achieve clustering of a large number of unbalanced samples, on the basis of the DBSCAN method, it is modified for its use of global parameters.
This section dynamically changes the parameters for exact clustering based on the local density of the samples. Specifically, this method takes each leaf node of the clustering tree obtained in the previous subsection as the input of the algorithm and defines the region radius as
The algorithm divides the GPS data according to the administrative level information (province, city, district, etc.). For all clusters in a certain layer, it compares the current amount of data in the cluster and the threshold value. No further division is needed if the amount of data is not greater than the threshold value. The parameters can be directly calculated and input into DBSCAN for cluster analysis. Otherwise, continue to the next layer, and the model diagram is shown in.
Model diagram of variable levels and variable parameters.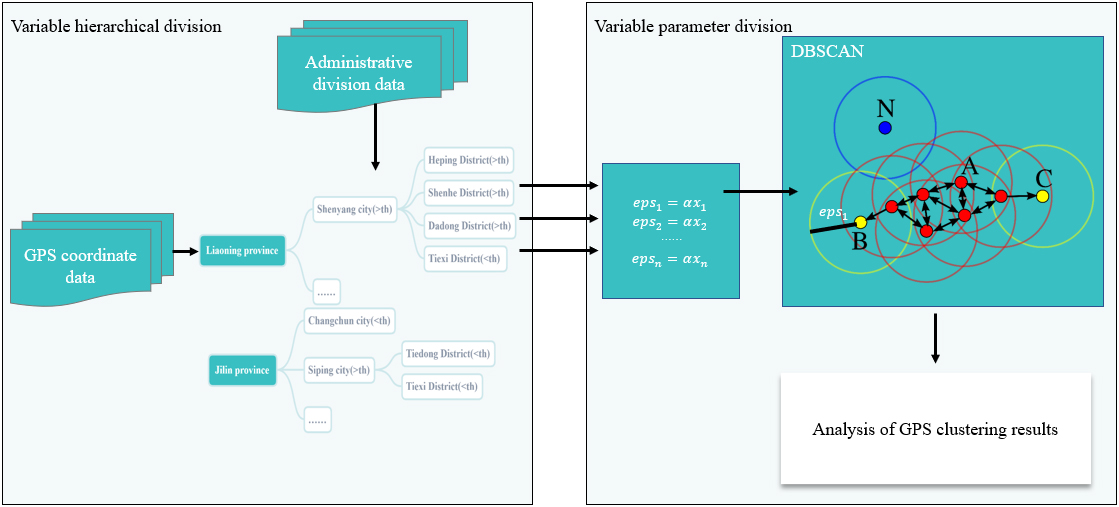
The LP-DBSCAN algorithm specifically filters the number of coordinates by setting a threshold list
In this paper, we adopted the Liu lifelog dataset to verify the algorithm’s effectiveness. The dataset was collected between 2011 and 2022 using an App developed by our team, which actively collected data through voluntary reporting. The dataset consists of 25,737 real data entries, including six attributes: ID, date, longitude, latitude, description, and address. Since the dataset contains multiple authors’ information, we selected data from only one author for analysis. Therefore, we pre-selected 10,252 data points. After conducting algorithm testing on these 10,252 GPS information data points and preprocessing the data, the final actual amount of data used for testing was 10,237 points.
First, preprocess the dataset, including manually removing noisy data caused by GPS positioning offset and writing code to remove duplicate data caused by software issues or shaking. After observing the data, it is found that there will be missing values, and the methods to deal with missing values are generally no processing, deletion, and filling. We cannot know the real latitude and longitude information of the missing data rows, which cannot use other data for filling and repairing. Therefore, we can only carry out deletion operations. The latitude and longitude information in the dataset is transformed into hierarchically structured data as extended attribute columns, such as country, province, city, district, and street, which is through the web map interface.
We have proved the effectiveness of the algorithm by testing the traditional DBSCAN algorithm and the LP-DBSCAN algorithm on the same data set. The traditional algorithm takes the radius eps, and the minimum number of samples Minpts as input parameters, and the LP-DBSCAN algorithm is used the minimum number of samples Minpts, variable levels division threshold
Clustering results of LP-DBSCAN algorithm
Clustering results of LP-DBSCAN algorithm
DBSCAN clustering results: Eps 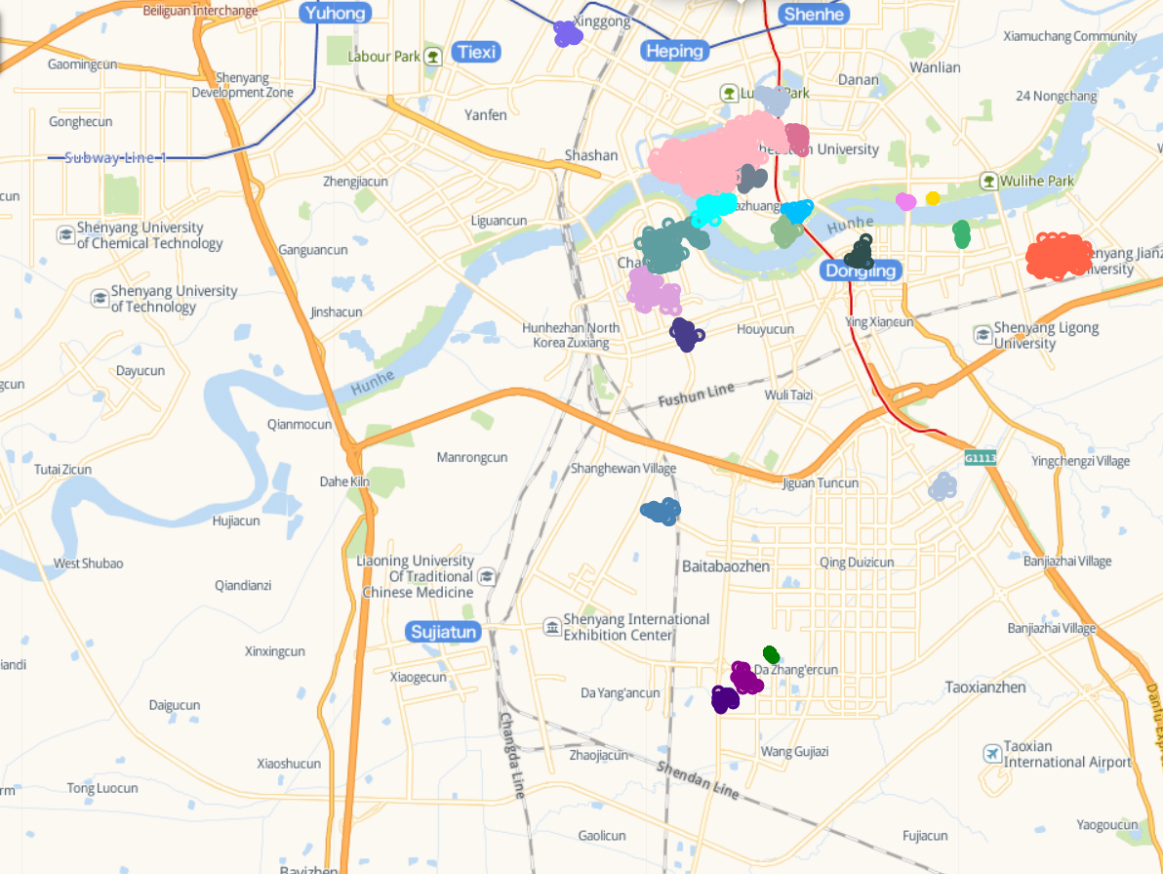
Clustering results of the DBSCAN algorithm
LP-DBSCAN clustering results: 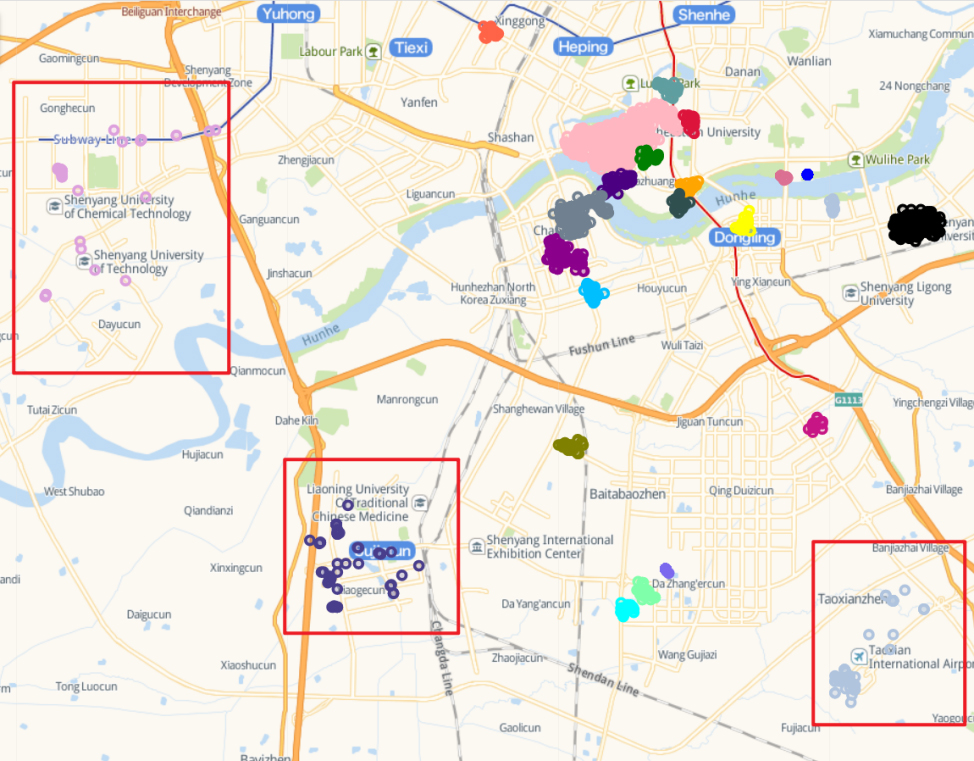
The discrete lifelog has a certain randomness, and the GPS data distribution is not regular. The clustering results in Table 2 show that the GPS points with too sparse distribution are identified as noisy points. Since GPS point clustering differs from other types of point clustering, the evaluation indexes, such as Silhouette Coefficient or Calinski-Harabasz Index, cannot accurately reflect the good or bad clustering results, so they are not calculated in this paper.
In this paper, we have calculated the accuracy rate, which refers to the probability
However, the accuracy rate can only roughly estimate the feasibility of a particular set of parameters, which needs to be judged manually. Figures 2 and 3 present some of the results obtained using the two algorithms and plotting them on a map for visual display.
The traditional DBSCAN algorithm is provided in Fig. 2. It is used globally unique parameters as input for clustering, which incorrectly sets some points as noise points. However, these points may precisely form the user’s region of interest, such as the region with some POIs, such as the Shenyang University of Chemical Technology, Shenyang Second Hospital of Traditional Chinese Medicine, Shenyang Taoxian International Airport, etc. However, the idea of variable parameters of LP-DBSCAN algorithm can overcome such shortcomings.
POI 1 of LP-DBSCAN algorithm clustering results.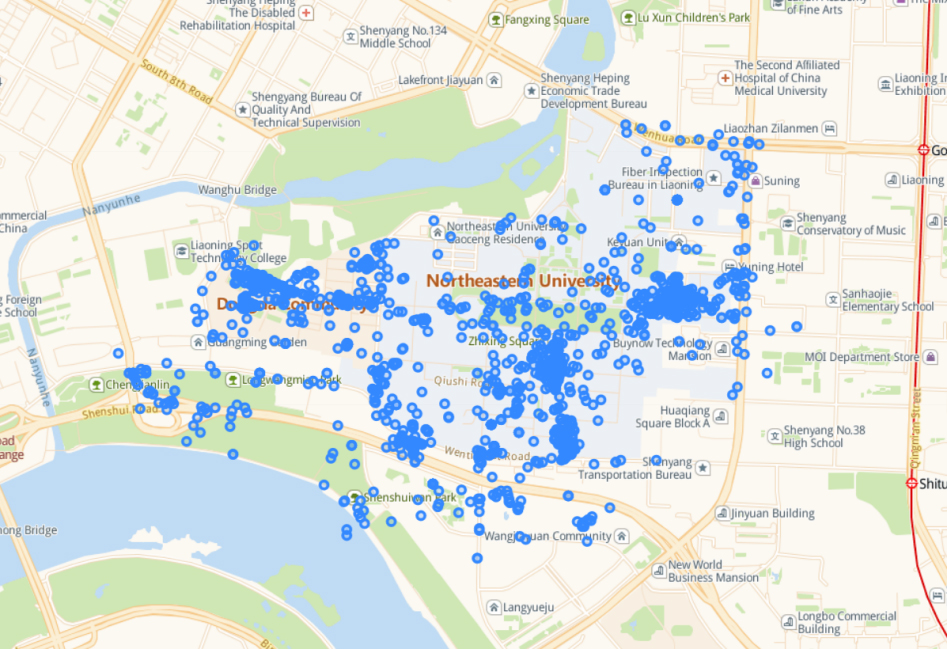
POI 2 of LP-DBSCAN algorithm clustering results.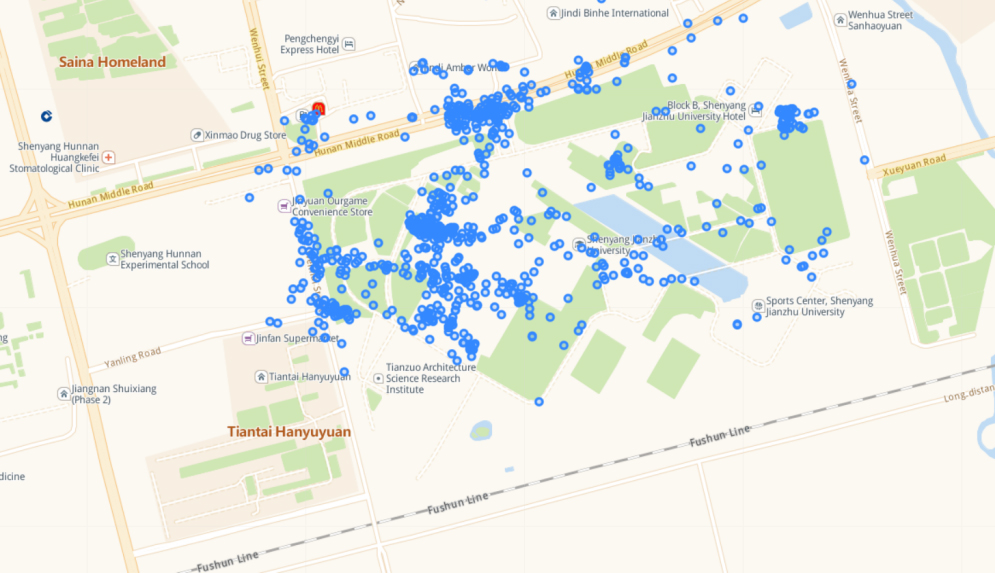
Screenshots of the visualization of the LP-DBSCAN algorithm’s clustering results are shown in Figs 4 and 5. One of the lifelog authors frequently travels to the two areas, as shown in two figures. it was determined that both were indeed included in the POI information for this city. There is no significant difference in the number of noise points between the results obtained from the two algorithms. Additionally, during data preprocessing, we are unable to identify the noise points, thus making it impossible to perform any preprocessing. However, the LP-DBSCAN algorithm can attempt to overcome the limitations of conventional algorithms in locating POIs.
The experimental results show that the LP-DBSCAN algorithm can extract the user’s interest points geographically, which unevenly distributed GPS point set well compared with the traditional DBSCAN algorithm. The division accuracy is significantly improved to obtain effective division results.
To address the issue of low accuracy when extracting POI from personal behavior trajectories, particularly discrete trajectories, this paper proposes the LP-DBSCAN algorithm. The LP-DBSCAN algorithm considers not only the density of the sample neighborhood but also the hierarchical structure of administrative divisions implied by GPS data. This algorithm includes two aspects: variable levels and variable parameters. Different threshold values are set for clusters at different levels, and different eps parameters are set for clusters that need clustering. Finally, a clustering tree structure is generated. The advantage of this method is that the GPS points can be reasonably clustered by using the uneven distribution of the data itself to finally obtain the user’s POI. Even though the algorithm suggested in this paper has a high accuracy in obtaining POI, there will still be a lot of noisy points. In the future work, the area where the noise points with low access frequency are located should be analyzed to make appropriate improvements to the algorithm. So as to further reduce the impact of noise points and improve the performance of the algorithm. We can further study the application of this method in other fields. For example, we could explore applying the method to urban planning to help analyze people’s travel behavior and hotspots in cities. In addition, we can also consider applying this method to social media data to extract users’ points of interest and activity patterns.