
Abstract
Based on panel data of 31 provinces in China from 2000 to 2019, this study explores the complex dynamic interaction between scientific and technological innovation, industrial structure transformation and economic development by building PVAR model. After GMM estimation, impulse response function analysis and variance decomposition analysis, the following conclusions are drawn: Technological innovation has a significant promoting effect on economic development, and economic development can also promote technological innovation; Technological innovation has a positive impact on industrial structure transformation, while industrial structure transformation has a slight negative impact on technological innovation; Economic development can lead to industrial structure transformation, but the impact of industrial structure transformation on economic development is not significant.
Introduction
After decades of rapid development, China’s economy has entered a new normal of changing from high-speed growth to medium high-speed development. Poor innovation output efficiency, lagging industrial development and unreasonable industrial structure, insufficient economic growth momentum and the quality of economic growth to be improved, these are the three major problems to be solved in economic development of China. Improving innovation capability and efficiency, promoting the transformation and upgrading of industrial structure and reshaping the driving force of economic development are important ways to solve the above problems. At the same time, the strategic goal of “building a modern economic system” was first put forward at the 19th National Congress of CPC. It is undeniable that the top priorities that affect the success of this goal have two: focusing on industrial system construction, and focusing on innovation driven. The key link of industrial system construction is to promote the transformation and upgrading of industrial structure, while the key point of innovation driven is to pay more attention to scientific and technological innovation. Under the background of the impact of the COVID-19 pandemic on the global economy, studying on the dynamic interaction between scientific and technological innovation, industrial structure transformation and upgrading, and economic development will not only help to achieve long-term stability and high-quality development of economy, but also play an outstanding role in accelerating construction of an innovative country.
Literature review
In the past, many scholars have studied the relationship between technological innovation, industrial structure transformation, and economic development from different perspectives. They pointed out that innovation is the process of destroying old industries and creating new ones, as well as the gradual evolution of industrial structure and economic growth [1, 2, 3]. The theory of the four elements of growth was proposed, emphasizing the promoting effect of technological innovation on economic growth [4]. New products created through technological innovation are conducive to the formation of new industrial sectors and can change the existing industrial structure [5, 6].
Some scholars have constructed econometric models of industrial structure changes and economic growth, and found that the rationalization and upgrading of industrial structure have a positive impact on economic growth [7]. They believe that the impact of innovation on the process of upgrading industrial structure mainly comes from three aspects: self enhancement, R&D investment, and whether innovation efficiency can reach the production possibility boundary [8]. The quantity of innovation has the greatest promoting effect on the upgrading of industrial structure, while the quality of innovation has a smaller effect when the threshold is not reached. The upgrading of industrial structure can also promote the coordinated development of the quantity and quality of innovation [9]. Technological innovation and industrial structure upgrading are interdependent, and only by matching each other can economic growth be better promoted [10, 11].
On the basis of the existing research literature, this paper has the following improvements: First, most of the definitions of indicators for the transformation and upgrading of the industrial structure in the existing literature are only for one aspect, either focusing on the upgrading of the industrial structure, or studying the rationalization of the industrial structure. Few literatures take it into account comprehensively. This paper combines the two into a comprehensive indicator, which can more comprehensively reflect the level of industrial structure transformation. Second, most scholars only study the relationship between the two variables of them, and few scholars study the three variables in the same model, and most scholars only consider the unilateral influence of them, and few scholars analyze the interaction between them. In this paper, the three variables are brought into as a whole to study the interaction between them. Third, there is little literature in the existing literature to analyze the dynamic relationship between them. This paper uses the dynamic panel model PVAR to analyze the short-term and long-term dynamic interaction between the three variables in order to get some objective and true conclusions, and make some suggestions for high-quality economic development.
Indicator selection and model construction
Indicator selection
Scientific and technological innovation indicator
Common indicators that can measure scientific and technological innovation capability include expenditure of research and experimental development (R&D), sales revenue of new products, patent applications, etc. The expenditure of R&D only represents the investment in scientific and technological development. Due to the different efficiency of transforming R&D investment into output, it cannot measure the actual scientific and technological innovation ability. Due to the different accounting standards, the sales revenue of new products is not easy to obtain. Therefore, this paper takes the number of patent applications as an indicator to measure the scientific and technological innovation ability. In order to avoid data fluctuation and reduce its heteroscedasticity as much as possible, this paper takes the logarithm of the patent application number and records it as lnPAT.
Industrial structure transformation indicator
Industrial structure transformation is divided into two aspects: industrial structure upgrading and industrial structure optimization. The upgrading of industrial structure refers to the transformation of industrial structure from a lower form to a higher form. In order to make the measurement more accurate and truer, considering the fact that the growth rate of China’s secondary industry is relatively slower than that of the tertiary industry, this paper selects the ratio of the output value of the tertiary industry to that of the secondary industry for measurement. The greater the value, the deeper the evolution of the regional industrial structure and the upgrading of the industrial structure.
The optimization of industrial structure refers to the optimal allocation of resources through the adjustment of industrial structure. This paper refers to the method of Chunhui Yu (2011) and combines the rationalization index of industrial structure to construct the formula of industrial structure optimization. The reverse indicator TL is processed in a positive way, taking the reciprocal of TL, so that its direction is the same as that of the upgrading indicator of industrial structure:
In Eq. (1),
Then the indicators reflecting the advanced and optimized industrial structure are standardized, which can eliminate the interference caused by the differences between dimensions and the different value ranges; Finally, use the equal weight method to form the comprehensive indicator: ISO.
As this paper uses provincial panel data, different regions have different population sizes, so the per capita GDP is used to measure the level of economic development, which can better reflect the differences in the level of economic development in different regions. In order to eliminate the impact of inflation on price changes, this paper divides the per capita nominal GDP by the price ratio index with fixed base period, which makes the measurement of economic development more accurate. Similarly, in order to reduce the heteroscedasticity of the data, this paper takes the logarithm of PGDP and records it as lnPGDP.
Indicator data sources
The data used in this paper are from China Statistical Yearbook, China Trade Union Statistical Yearbook, the website of the National Bureau of Statistics and some provincial and municipal yearbooks. The range of data is from 2000 to 2019, and the sequence length is 20 years.
Model construction
Panel vector autoregression (PVAR) model combines the advantages of VAR model and panel data, which not only reduces the requirement for data time length, effectively controls unobservable individual heterogeneity, but also solves endogenous.
Variable problem, and analyze the dynamic response of variables under different impacts. The relationships between scientific and technological innovation, industrial structure Transformation and economic development are relatively complex, so a flexible analysis tool PVAR model is used to analyze the dynamic relationship between the three variables. Before establishing PVAR model, it is necessary to select the optimal lag order. If the lag order is too long, more sample data will be lost, and if the lag order is too short, the test results will be unreliable. The 2 order lag model is established according to the minimization principle of AIC, BIC and HQIC.
Where
Stationarity test
Stationarity test
Stationarity test
Notes: *, **, and *** represent a significant correlation at the 10%, 5%, and 1% levels.
Before modeling, it is necessary to conduct unit root test to judge whether each indicator series is stable. This paper weighed the advantages and disadvantages of various test methods, and finally selected LLC test, IPS test, Fisher ADF test and Fisher PP test to test the sequence stationarity.
As shown in Table 1, at a significance level of 5%, the three original indicator sequences cannot reject the original hypothesis, which means that the three indicators: lnPAT, ISO, and lnPGDP are non-stationary sequences. The differential dlnPAT, dISO, and dlnPGDP sequences reject the original assumption that the sequence is stationary at the 1% significance level, and the three sequences are first-order integrals, satisfying the premise of cointegration.
In this paper, Johansen Fisher method is used for cointegration test. From Table 2, we can see that there are three cointegration relationships from the obtained Trace Statistics and the Max-eigen Statistic at the 5% significance level, so it meets the premise of PVAR model.
Johansen fisher panel cointegration test
Johansen fisher panel cointegration test
The GMM method takes the lagging variable as the tool variable. The estimated results of the lagging second-order PVAR model in this paper are shown in Table 2, which reveals the interaction between scientific and technological innovation, industrial structure transformation and economic development.
GMM estimation result of PVAR model
GMM estimation result of PVAR model
Notes: *, **, and *** represent a significant correlation at the 10%, 5%, and 1% levels.
From Table 3, it can be seen that lagging behind the first phase of technological innovation has a positive impact on economic development and industrial structure transformation, which is also statistically significant. However, the impact of industrial structure transformation lagging behind the first or second phase on technological innovation and economic development is not statistically significant.
Impulse response analysis refers to the dynamic response of other variables after a standard deviation impact on variables, which can more clearly and intuitively display the dynamic interaction effect between variables. The impulse response function is constructed based on the parameters of PVAR model. This paper adopts Monte Carlo (Monte Carlo simulated 500 times to obtain the confidence interval of parameters, and obtained the impulse response diagram as shown in the figure. The middle curve in the figure represents the estimated value of IRF points, the upper and lower curves represent 95% and 5% confidence intervals, the horizontal axis represents the number of response periods, and the vertical axis represents the changes under the impact of other variables. This paper selected 20 periods of impact, and it can be seen that all curves tend to converge after 20 periods of impact, and the model is stable according to the stability test, so the pulse The analysis of impulse response is of economic significance.
Impulse response diagram.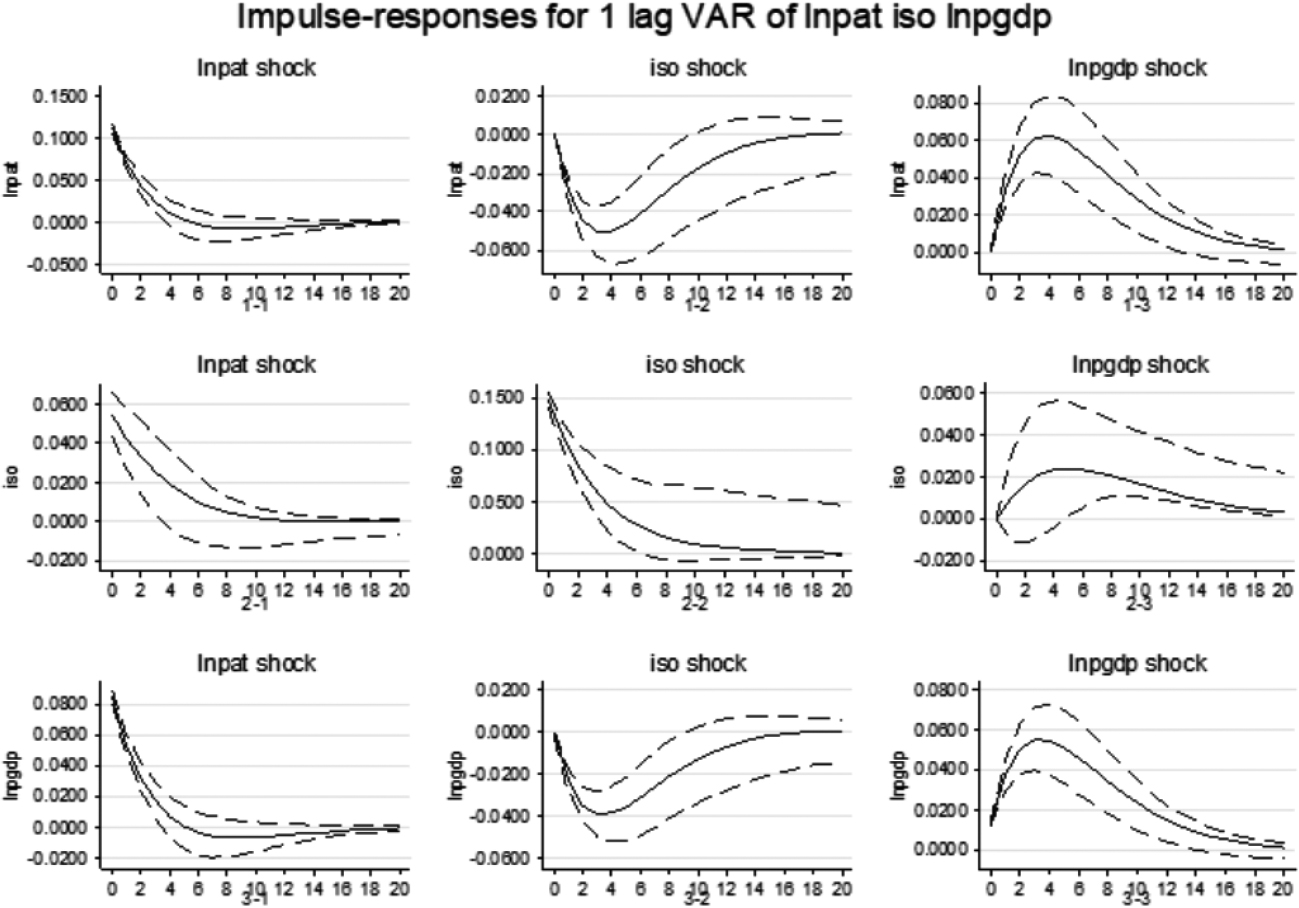
It can be seen from Fig. 1-3 and 3-1 that technological innovation and economic development promote each other, and errors are 5% on each side generated by Monte-Carlo with 500 reps. Economic development reaches its maximum in the period of impact of scientific and technological innovation, and then gradually weakens and tends to zero, which indicates that the promotion of scientific and technological innovation level on economic development gradually weakens over time; After a standard deviation of economic development, scientific and technological innovation doesn’t respond in the same period, reaching a peak in the fourth period, indicating that the impact of economic development on the level of scientific and technological innovation is positive, but there is a certain lag, which may be due to the time lag in the process of improving R&D investment brought about by economic development and converting it into achievements.
From Fig. 2-3 and 3-2, it can be seen that after the impulse of economic development, the industrial structure transformation did not show any response during the same period, rising to its peak in the fourth period and then gradually weakening. This indicates that the impact of economic development on the industrial structure transformation is positive and lagging. However, the impact of industrial structure transformation on economic development is negative. Perhaps China’s economic development is mainly driven by the secondary industry, and the transformation of industrial structure will also bring pain to economic development. From Fig. 1-2 and 2-1 in Fig. 1, it can be seen that technological innovation can promote the transformation of industrial structure, but cannot significantly improve the level of technological innovation. This indicates that technological innovation plays an important role in economic development and industrial transformation.
Variance decomposition is to further evaluate the importance of different structural shocks by analyzing the contribution of each variable shock to the endogenous variables on the basis of impulse response function analysis.
The result of variance decomposition
The result of variance decomposition
It can be seen from the columns 2 to 4 in Table 4 that the scientific and technological innovation was completely affected by itself in the first phase, but since the second phase, the impact of its own gradually decreased, and the impact of industrial structure transformation and economic development gradually increased. The impact of economic development on scientific and technological innovation accounted for 46.2% in Phase 10, while the impact of industrial structure transformation accounted for 20.3% in Phase 10.
It can be seen from the columns 5 to 7 in Table 4 that in the first phase, the industrial structure transformation was mainly affected by itself, and the contribution rate was still as high as 90% in the 10th phase, which indicates that the industrial structure transformation has a self-strengthening mechanism. The impact of economic development and scientific and technological innovation on the transformation of industrial structure increased with time, reaching 4.3% and 5.6% in the 10th phase.
It can be seen from the columns 8 to 10 in Table 4 that in the first period, the economic development was mainly affected by itself, but gradually weakened. In the 10th period, the contribution rate was 54.9%. The impact of scientific and technological innovation and industrial structure transformation on economic development increased rapidly, and the contribution rate of them reached 27.1% and 17.9% in the 10th period, which indicates that the impact of scientific and technological innovation on economic development is the first in the 10th phase.
This article establishes a PVAR model to study the macroeconomic panel data of various provinces in China, and analyzes the dynamic interactive relationship between technological innovation, industrial structure transformation, and economic development. The research results indicate that technological innovation is an important driving force for promoting economic development and industrial structure transformation. Economic development has a positive impact on technological innovation and industrial structure transformation, while industrial structure transformation has no significant positive impact on economic development and technological innovation.
Based on the research findings, the following policy implications are proposed. Firstly, technological innovation leads economic development. Improve the mechanism for technological innovation and create a favorable environment for technological innovation; The second is the coordinated development of technological innovation and industrial structure transformation. Promote the integration and development of technological innovation and traditional industries; Thirdly, the government should handle the relationship between industrial structure transformation and economic development. By adjusting the industrial structure, we will increase the proportion of scientific and technological innovation industries. Forming a virtuous cycle.