
Abstract
The high profit of regional investment is often accompanied by high risks, and the prior assessment of investment risks is conducive to avoid investment risks. However, the traditional evaluation methods usually only focus on individual risk factors, and it is difficult to evaluate and manage risks on the whole. Therefore, the study introduces deep learning algorithm, first build regional investment risk evaluation index system, then according to the characteristics of risk evaluation, design based on deep learning regional investment risk evaluation model, the final use parameter based migration learning algorithm and composite correlation coefficient to improve the evaluation model, solve the problem of insufficient training samples. The test results showed that the randomly selected 50 test samples with two different risk assessment models were 0.80 and 0.86, the deep learning algorithm tested 0.84, and the transfer learning improved model tested was 0.92, with the highest accuracy. This shows that the deep learning regional investment risk evaluation model improved by transfer learning effectively solves the problem of insufficient training data and improves the accuracy of prediction evaluation. In the field of venture capital, the model can help investors to evaluate and predict investment risks more accurately and improve the effect of investment decisions.
Introduction
Under the background of accelerating globalization and rapid economic development, capital flows frequently across regions. With the acceleration of globalization and rapid economic development, the cross-regional flow of capital is becoming more and more frequent. Regional investment refers to investors investing capital in economic activities in a particular region with the aim of obtaining higher returns [1]. However, investment has risks, and the factors affecting the return on investment include the regional economic development level, social culture and policy environment, including [2]. The risk varies greatly between different regions for investment, and choosing low-risk regions for investment is an effective way to avoid investment risks. By evaluating the investment risk of a region, investors can develop a reasonable investment strategy [3, 4]. The level of investment risk also has an important impact on the retention of existing investors in the region [5]. In the field of regional investment, the establishment of a scientific risk assessment model is very important to reduce investment errors [6]. With the increase of investment risk, how to accurately assess the risk of regional investment is an important issue in the field of venture capital. In this context, this study proposes a regional investment risk evaluation method based on deep learning and migration learning algorithms, aiming to provide investors with more accurate risk assessment methods and investment decision support.
This study is divided into four sections: Section 2 provides a review of the current status of research on risk evaluation models and migration learning theory. The third section proposes a regional investment risk evaluation model based on deep learning and migration learning approaches. In the fourth section, the risk evaluation model is experimentally validated and the experimental results are analyzed.
Literature review
With the acceleration of globalization and the rapid development of economy, the risk of frequent capital cross-regional flow also increases, and the accurate assessment of regional investment risks has become an important basis for investors to formulate strategies and make decisions. Many researchers have combined investment risk assessment with computer technology to construct different algorithms to assess risk. Marhavilas et al. [7] proposed new risk assessment and analysis methods based on the joint collaboration of multi-guideline decision (MCDM) process, certainty (DET) and randomness (STO) process, etc. Mixed subanalysis and fuzzy extension to measure different risks. This study is conducive to the risk analysis of regional economic investment analysis, reducing the probability of risk occurrence, and improving the scientific level of project decision-making. Ang et al. [8] conducted a comparative analysis of methods for evaluating regional investments. On the basis of numerous analytical methods, four methods were selected for analysis. The four methods are: cost assessment method, rating method, holistic method and qualitative analysis method. The results of the study show that the existing assessment methods have limitations for evaluating regional investments. Using high-resolution disaster, exposure, and vulnerability models to assess hurricane risk, Nofal et al. [9] used a novel approach to combine storm surge and wave vulnerability functions with an existing set of wind vulnerability, and proposes a combination of cloud computing and information fusion technologies for the risk assessment system. The experimental data show that environmental protection and energy are aggravated in the share of fixed assets investment and the investment trend continues to rise. Wang et al. [10] proposed an optimization model for shipping safety portfolio selection based on investors’ risk preferences. The model introduces value-at-risk and combines the expectation criteria to construct a dual-objective model through which the associated costs are optimized. The simulation results show that the desired and value-at-risk objectives do not correspond and can reduce accident losses in extreme cases.
Some researchers have proposed applying cluster analysis and deep learning models to risk evaluation. Kim et al. [11] proposed a new probabilistic mapping model that adapts dynamic Bayesian networks to perform clustering analysis on temporally discrete system space, and the mean drift clustering algorithm is used to cluster datasets from similar scenarios. The experimental results show that the risk effect quantification of control unit configuration changes will lead to verification of dynamic system security and improved. Lagasio and Quaranta [12] applied cluster analysis and compound correlation coefficients to study 1237 bank business models based on different endogenous and exogenous factors. The results of the study showed a strong preference for retail banking and traditional banking, and the choice of specific business models remained stable. Transfer learning After continuous optimization of transfer learning framework, many scholars also use it as one of the means to solve the risk prediction problem. Liu et al. [13] proposed a transfer learning based method for grassland fire risk evaluation. The method firstly selected two grasslands, Xilinguole and Hulunbeier, as the study area and extracted five representative indicators, with Xilinguole as the source domain and Hulunbeier as the target domain. Secondly, the mapping relationship between fire indicators and fire risk degree was established by migration learning. The experimental results show that the prediction accuracy can reach 87.5% using the migration learning method, and the accuracy of prediction is high. It is beneficial for managers to have a clear understanding of fire risk and take corresponding risk management measures to reduce grassland fire risk and reduce losses.
In summary, venture capital has high risk and pursuit of profitability, and excellent risk evaluation models are important. The cluster analysis algorithm based on the composite correlation coefficient can classify the samples using the information of multiple variables in a comprehensive way, and the results are more intuitive. Transfer learning based algorithms in risk evaluation can be a good solution to the problem of little or inconsistent data. However, there are few studies that combine the two for investment risk evaluation. Based on this background, this study will firstly construct a risk evaluation index system, and then build a new risk evaluation model for regional investment risk assessment based on the cluster analysis algorithm combined with the migration learning algorithm. The aim is to provide more accurate risk assessment methods to improve investment returns and reduce investment losses, and to provide investment decision support for scientific and efficient management.
Regional investment risk evaluation model design based on deep learning and migration learning approach
This section firstly constructs a regional investment risk evaluation index system, secondly constructs a risk evaluation model using cluster analysis, and finally improves the model by combining the migration learning algorithm.
Regional investment risk evaluation index system construction
In order to construct the regional investment risk evaluation index system, the mapping relationship between risk factors and evaluation results is established by identifying regional investment risk factors, refining and decomposing the factor item layer and factor layer, and quantifying the attributes of each factor in a standard way [14]. The compilation of regional investment risk evaluation indexes follows three basic principles of stratified setting, operability and core focus. The impact categories are selected by collecting relevant literature, official data, government documents and other relevant information at home and abroad, and sorting and classifying them. The first-level indicators of regional investment risk evaluation are formed by combining the opinions of economists’ seminars and enterprises’ research. On the basis of the primary indicators, they are finely decomposed to get the item layer and factor layer of the evaluation system. Finally, the first-level indicators, second-level indicators and third-level indicators are summarized, the assignment criteria of each indicator are set, their economic attributes and qualities are determined, and the regional investment risk evaluation index system is established, whose framework structure is shown in Fig. 1.
As can be seen from Fig. 1, the top layer of the risk evaluation index system is the category layer, which is used to reflect the broad category of risks of regional investment; the refinement of the category layer gets the project layer, which reflects the risk sources of a certain category; the bottom layer of the evaluation system is the factor layer, which is an explicit examination of the risk sources. On the basis of following the theoretical analysis of the risk investment environment system and the principles of index system compilation, the regional investment risk evaluation index system is constructed through literature summarization and extensive research, and the various types of indicators are shown in Table 1.
Statistical table of regional investment risk evaluation index system
Statistical table of regional investment risk evaluation index system
Risk evaluation index system.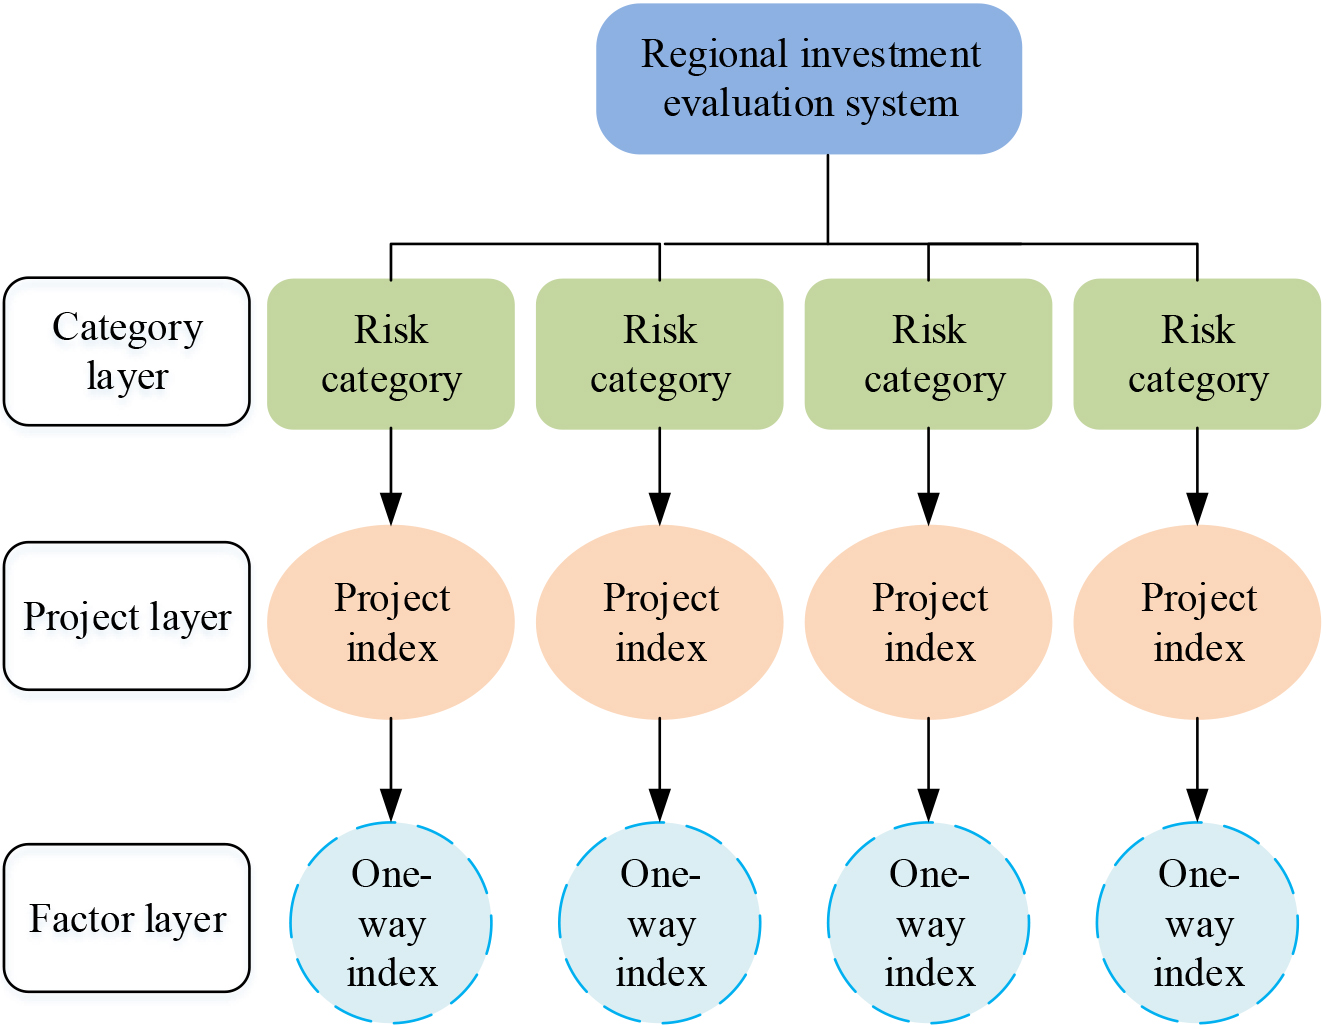
As can be seen from Table 1, the regional investment risk evaluation index system divides regional investment risks into five major categories: political environment, human environment, social environment, financial environment, and basic resources. The risk evaluation index system contains a total of 5 major categories of primary indicators, 12 secondary indicators and 19 tertiary indicators.
With the rapid development of deep learning technology, the proportion of deep learning in areas such as language translation, face recognition and image detection is gradually increasing [15]. Compared with traditional learning methods, deep neural networks have powerful fitting ability to data [16]. Based on the construction of the regional investment risk evaluation index system, the impact factors are simulated and trained by combining deep learning networks, and the risk evaluation model is constructed. Firstly, according to the qualities of regional investment risk, a suitable neural network structure is selected. The commonly used deep learning neural networks are deep confidence networks, recurrent neural networks and convolutional neural networks [17]. Because the Convolutional Neural Network (CNN) has the advantages of low training difficulty, relatively simple model structure, strong feature extraction ability and fast convergence compared with other common neural networks. In this study, CNN is chosen, and its structure is shown in Fig. 2.
Convolutional neural network principle.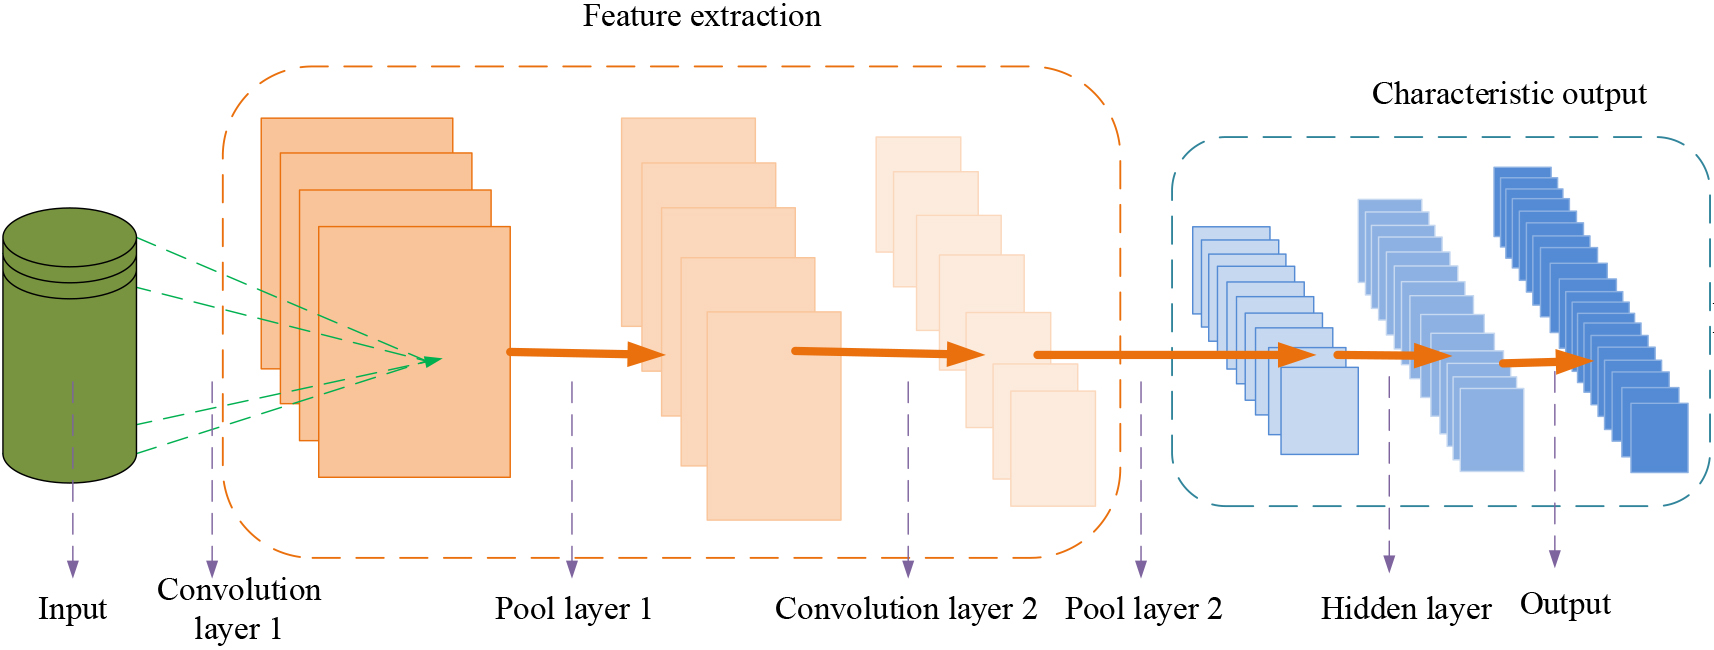
As can be seen in Fig. 2, CNN contains convolutional, pooling and output layers, and each layer contains multiple weight parameters. CNN utilizes a deep architecture for feature extraction, with each feature mapping forming a plane and multiple features forming a convolutional layer. After the convolutional layer is processed, the features are fed into the pooling layer for data processing. The convolutional layer and the pooling layer are combined to form a convolutional group, and the convolutional layer extracts the features layer by layer, and the extracted features are output through the output layer. After selecting a suitable neural network structure, the topology of the deep learning network is then constructed. Table 1 is transformed into the input sample data set X. The features of the input data are extracted by feedforward computation judgment, and then the continuous dimensionality reduction is achieved by passing layer by layer. Since the data after dimensionality reduction is increasingly abstract R, it can be used for computation. Assuming that the network structure of risk evaluation has L layers, the activity values of the risk evaluation feature values of
In Eq. (1),
In Eq. (2),
In Eq. (3),
Structure diagram of venture capital deep learning network.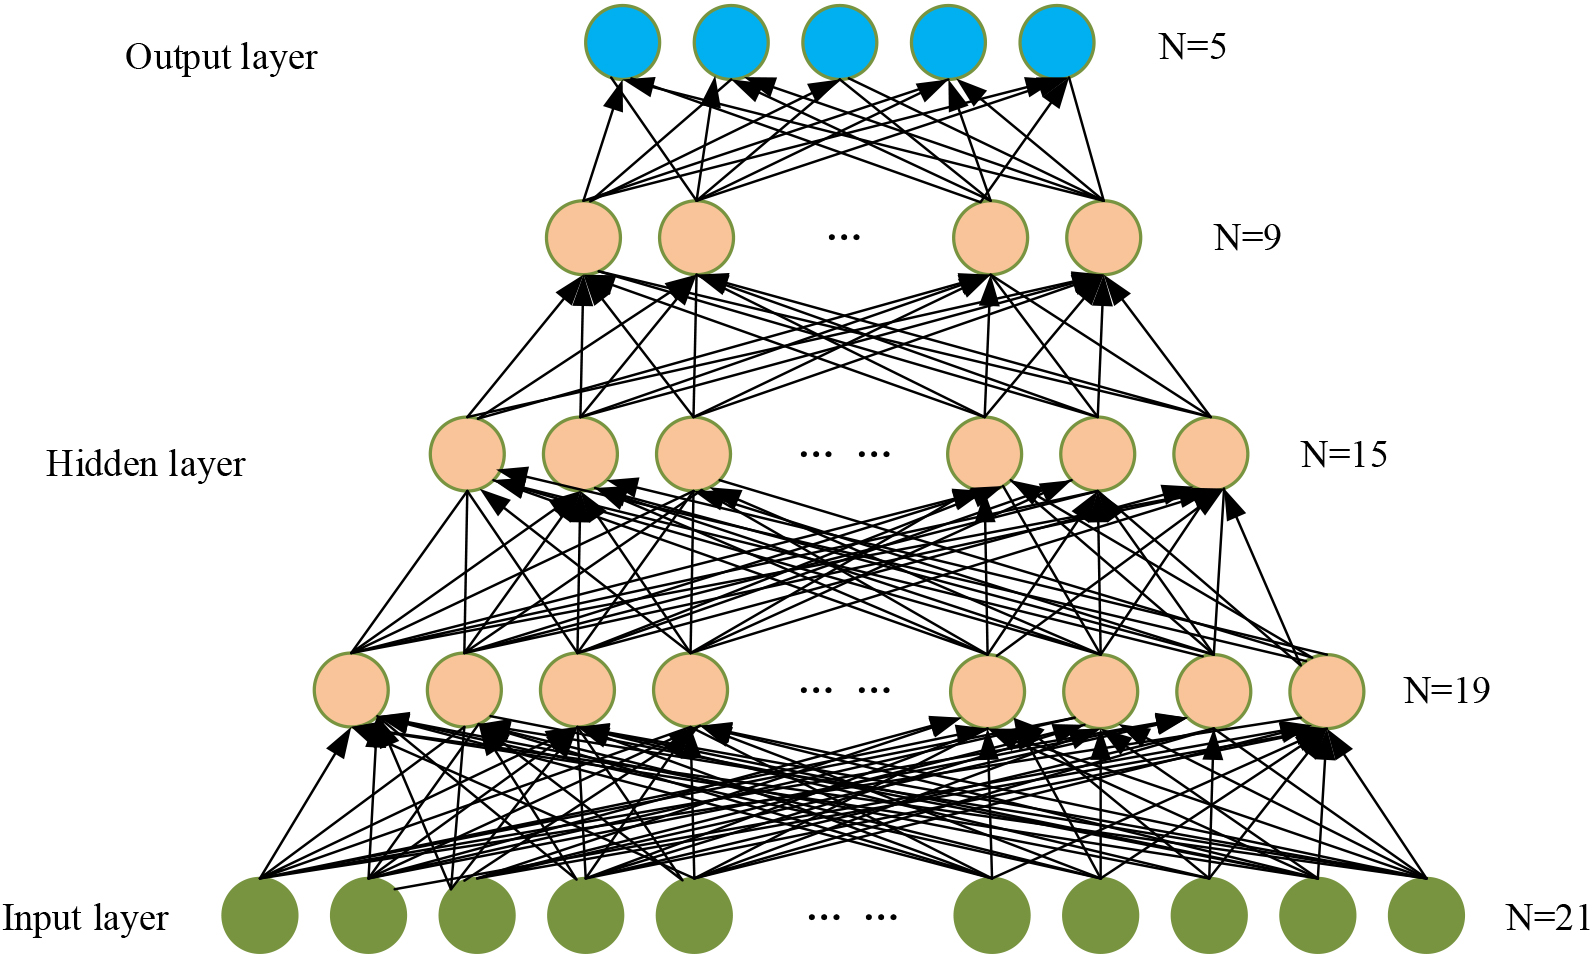
As can be seen from Fig. 3, the 19 factors of the risk system are used as variables to form the input layer of the deep learning network, which is trained and debugged by the hidden layer, descending the dimensionality step by step, and finally outputting the output data. The layer-by-layer information relay output obtained from
In Eq. (4),
In Eq. (5), M contains the weight matrix of each layer and b contains the bias vector of each layer,
In Eq. (6),
In Eq. (7),
Equation (8) is then mathematically transformed to obtain Eq. (9).
Similarly, the error term
In Eq. (10),
The derivative of the ReLU activation function is given in Eq. (12)
Equation (12) is the derivative of the ReLU activation function.
Equations (13) and (1) can be combined to obtain Eq. (14).
When the evaluation model based on deep learning is used for regional investment analysis and evaluation, it suffers from the problem of low accuracy of evaluation results in the case of insufficient training samples and inconsistent distribution of test samples. To solve this problem, this section will improve the deep learning model by incorporating the migration learning algorithm. Transfer learning is often used to solve the problem of insufficient training data, and it can reduce the training time of the model by migrating the learned knowledge into the model to be trained after fine-tuning. In this study, a deep learning model for investment risk evaluation of a municipal company is used as a logarithm for parameter migration learning. The model parameters trained by a large amount of data in the source domain are applied to the target domain for the target domain data prediction task, and the principle is shown in Fig. 4.
Transfer learning schematic diagram.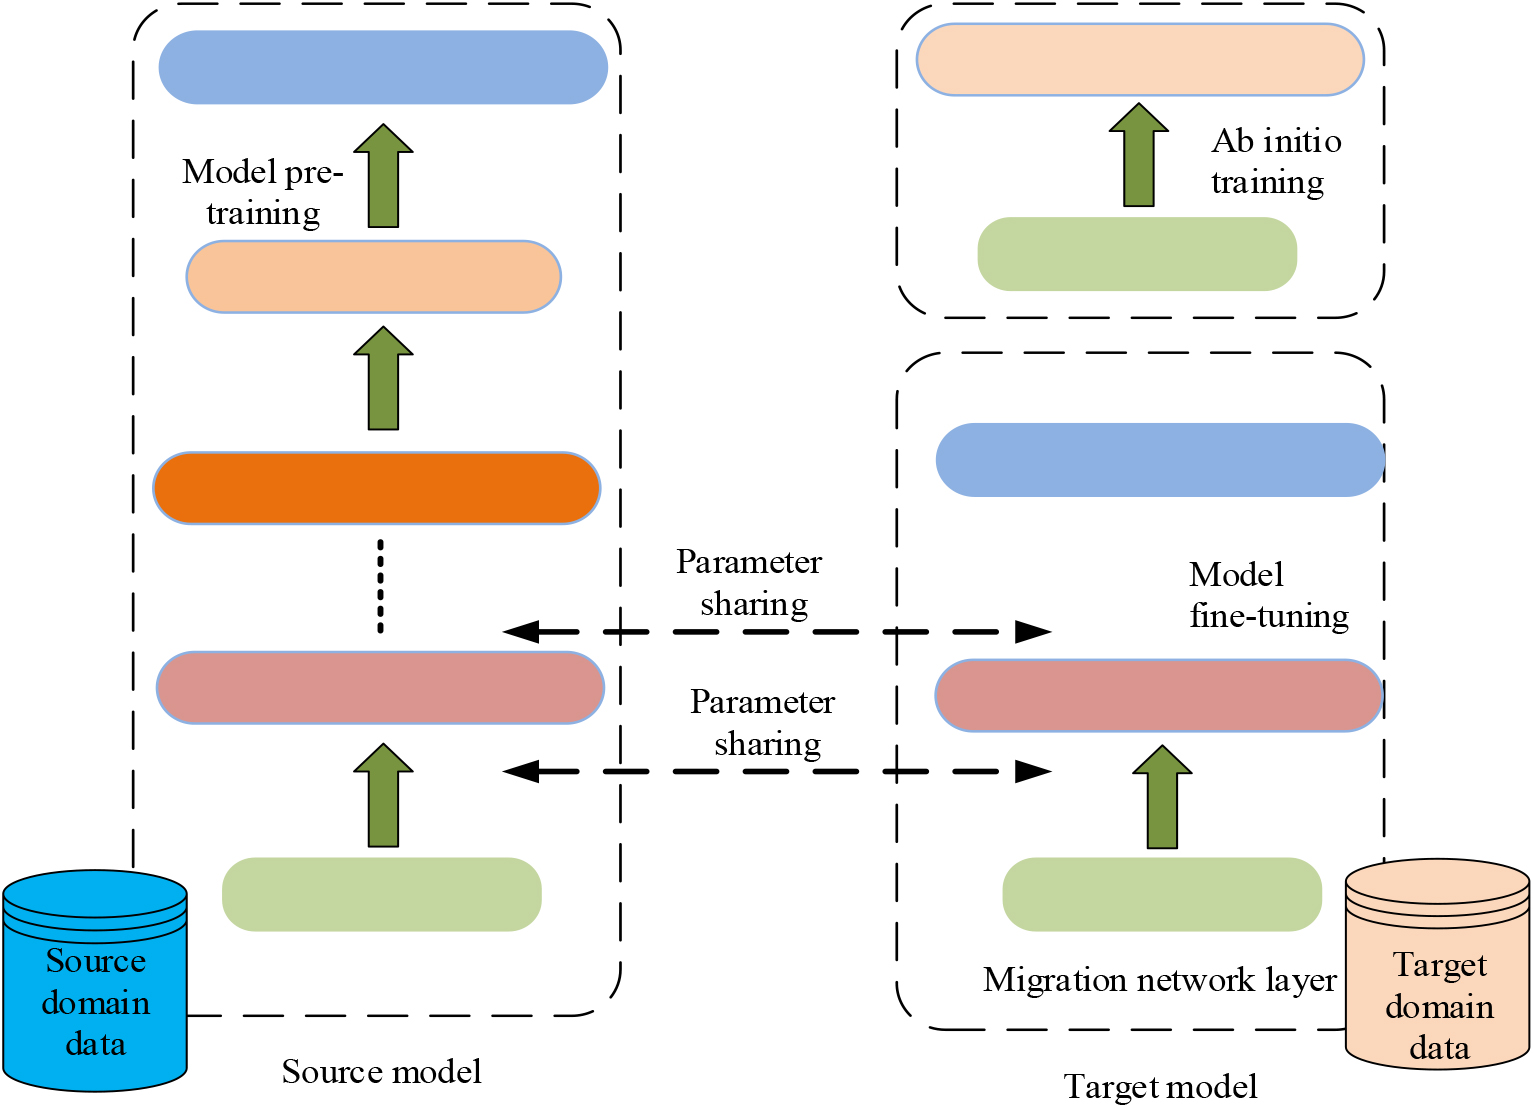
As can be seen from Fig. 4, transfer learning consists of source domain and source task, target domain and target task. It accelerates the convergence of the model and achieves knowledge migration by fine-tuning the model to migrate the knowledge acquired in the source domain in solving the task to the target domain. The more similar the characteristics of the source and target domains are, the better the migration effect is. The feature values of the 19 factors in the index system are used as the input quantity of the learning model, and the five risk levels are used as the output quantity. According to the input sample data set R in Section 2, samples are drawn from the divided total set according to a certain proportion, and the drawn sample set is X. The trained learning model is used to test the drawn data. And the samples are migrated by migration learning to constitute new training samples. Finally, the improved model is used to perform risk evaluation on the new data set, and the process is shown in Fig. 5.
Model training process.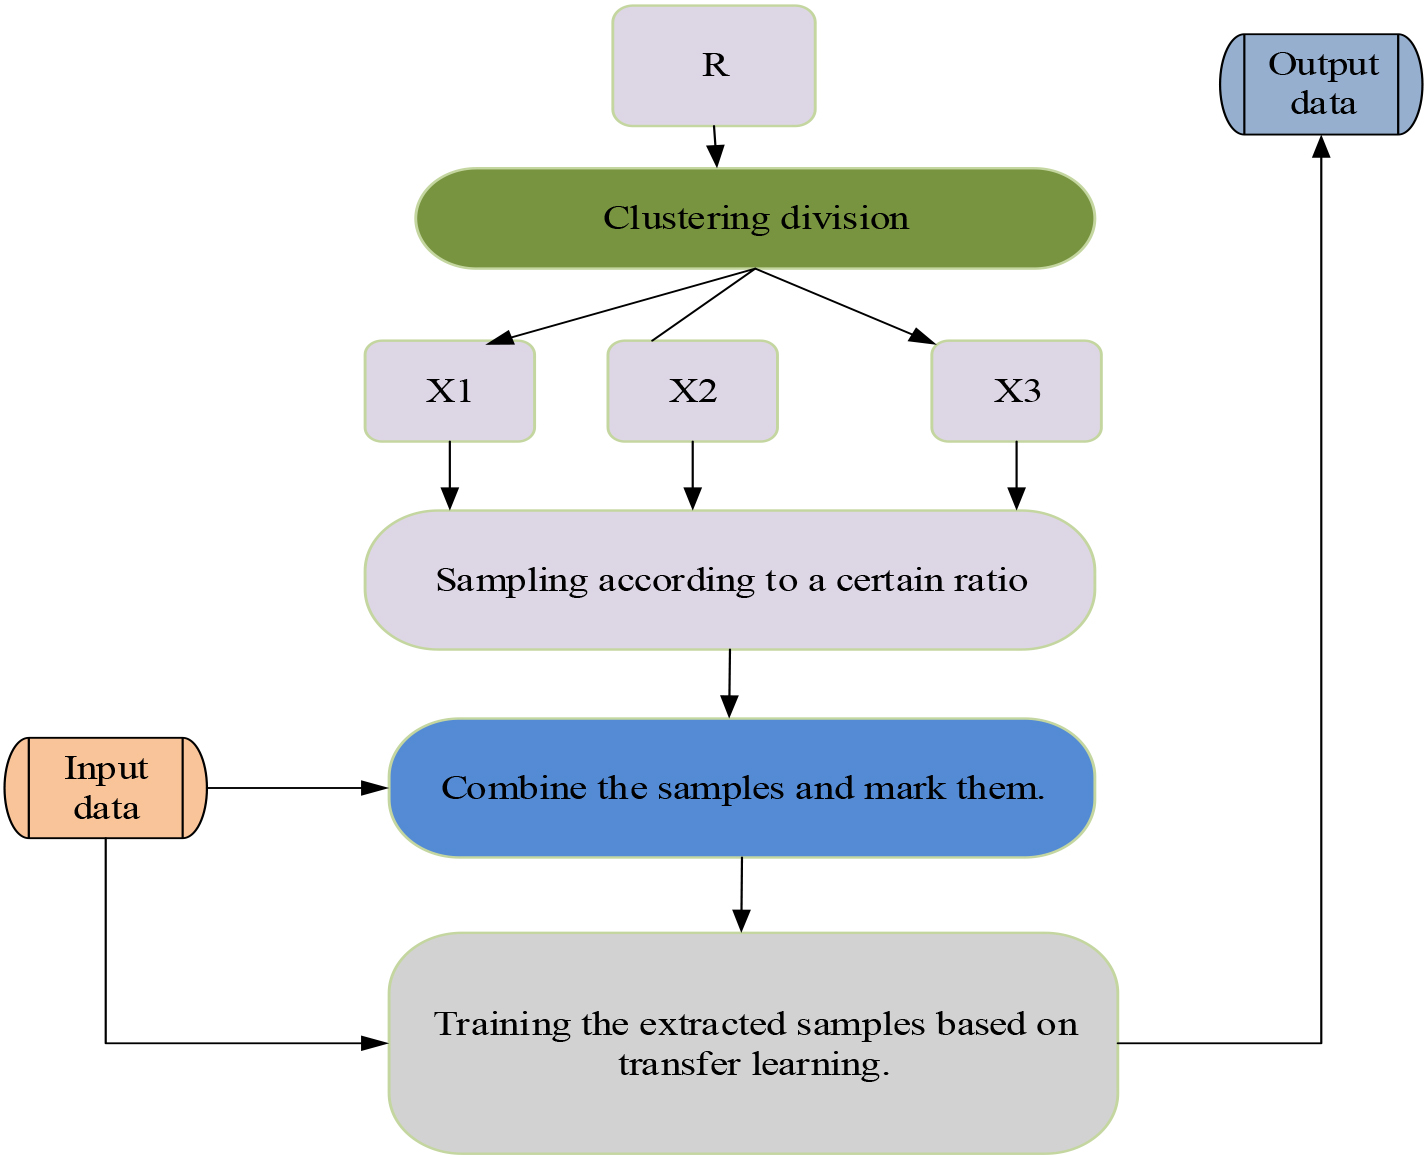
From Fig. 5, it can be seen that the improved model firstly has collected the data set R to draw samples in a certain ratio to obtain the X-sample data set. Secondly, the extracted data are trained using the learning model, and the required data are input after migration learning. Finally, the obtained data are brought into Eq. (5) for risk assessment. After performing the risk assessment, a similarity analysis of regional investment risk indicators is finally required. This study combines the Pearson correlation coefficient to determine the importance of the indicator fluctuation trend of the indicator, and the Pearson correlation coefficient is shown in Eq. (15).
In Eq. (15), the Pearson correlation coefficient describes the closeness of the association between two fixed distance variables. The closer the composition of the risk structure of investments in different regions, the higher the correlation coefficient. However, the simple correlation coefficient ignores the magnitude of the variable level, and even if the magnitudes of the two variables are very different, the simple correlation coefficient is still higher as long as the fluctuation trends are similar. In order to provide a better expression of magnitude, the composite correlation coefficient is used for judging in combination with the Euclidean distance. The formula expression of the composite correlation coefficient is shown in Eq. (16).
In order to verify the effectiveness of this designed risk evaluation model in regional investment risk evaluation, the risk evaluation model needs to be trained and determined. Firstly, suitable samples and data sets are selected to train the model, and secondly the deep learning risk evaluation model and the improved risk evaluation model pair using migration learning are compared and analyzed.
Analysis of the impact of evaluation indicators on the results
The venture capital model was selected from data related to 34 provinces and cities in China from 2017–2022, which were obtained from the China Statistics Bureau and the China Financial Yearbook, among others. There are 1226 samples. 120 samples were randomly selected as the training sample subset according to the ratio of
Data table of regional investment risk indicators in 2019
Data table of regional investment risk indicators in 2019
As can be seen in Table 2, communication conditions, labor law protection, tax programs and policy support have a large impact on the regional investment risk in China. However, the unit and scope of the selected index data are often not unified, so it is necessary to process the non-quantify the data. In this study, we mainly normalized and deaveraged the data, as shown in Fig. 6.
Schematic diagram of data de-averaging and normalization preprocessing.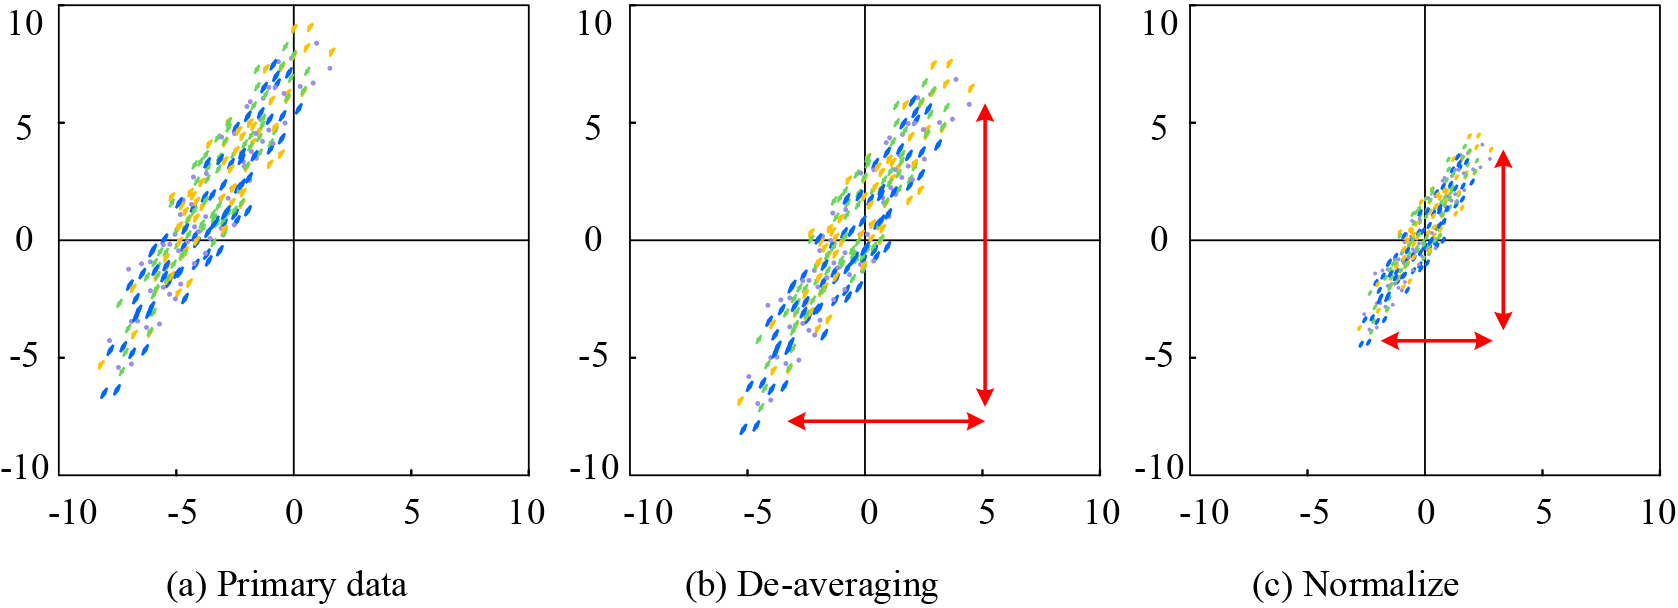
As can be seen in Fig. 6, de-meaning is centering the input data to zero for each dimension, and normalizing is normalizing each magnitude to the same range. The interference of the difference in the range of the data taken is reduced by averaging and normalizing the data. Risk factors have an impact on the risk of the assessment area, and the impact of risk factors on risk level determination is shown in Fig. 7 in detail.
Influence of risk factors on risk grade determination.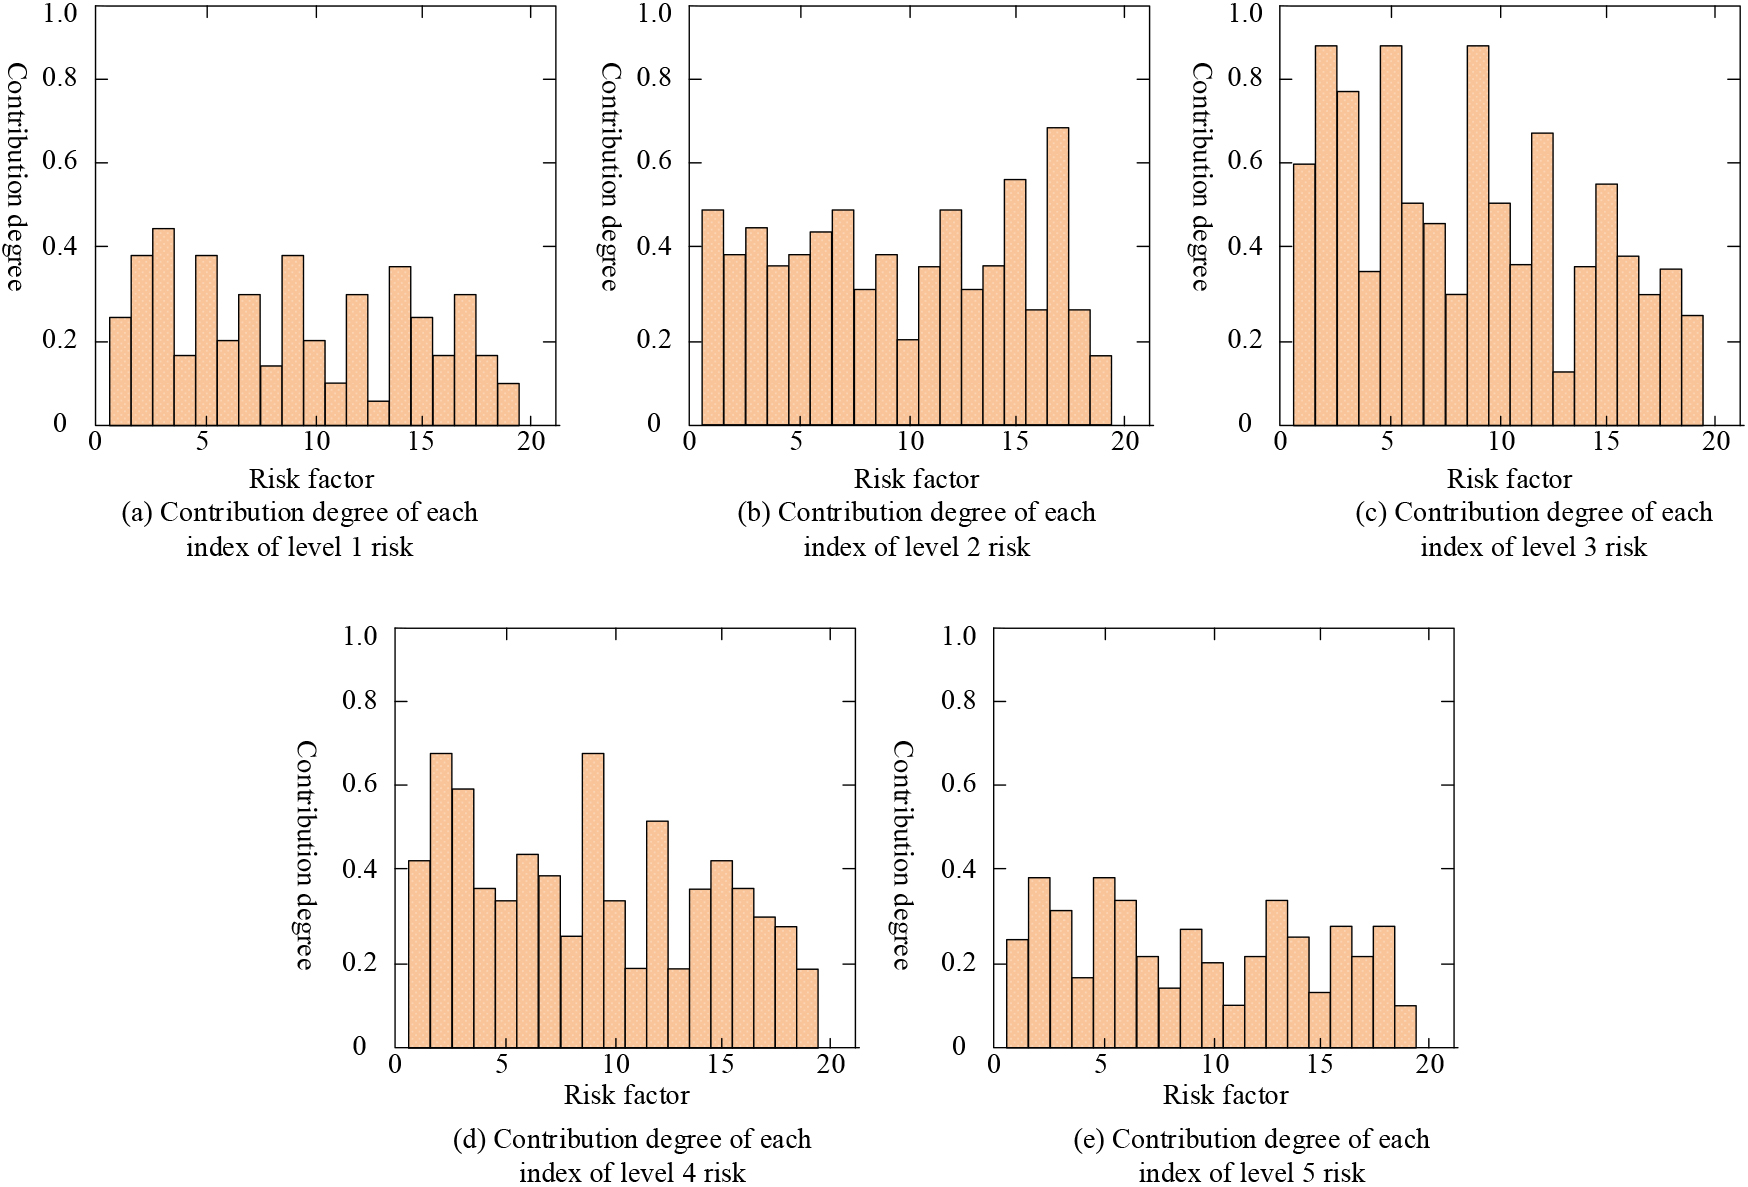
In Fig. 7(a), the highest contribution coefficient of factor 3 is 0.42, while when the risk grade changes, it is 0.41, 0.68, 059, and 0.26 in the plots (b), (c), (d), and (e), respectively. When the risk level changes, the contribution of the same index also changes. Although the final risk level is determined by the individual risk indicators together. The indicators with larger contribution coefficients have relatively larger weights, but the sensitivity to the risk level determination is also higher when the coefficient value is changed. In contrast, indicators with small contribution coefficients have almost no sensitivity and have less influence on the evaluation results.
The sample provincial and municipal risk evaluation dataset is defined as Finrisk and the regional investment risk evaluation dataset is Zonrisk, and the mapping relationship between financial characteristics and risk characteristics is trained using the deep architecture. Then the model is used to evaluate the regional investment risk of 34 provinces and cities in China, and finally 50 randomly selected test samples are tested using different methods of comparison, using the novel hybrid intelligence model in references [20, 21] and the integrated decision support model III model based on regret theory and ELECTRE for comparison experiments. The training results of the models in this study are shown in 8.
Comparison between data set self-training and transfer learning pre-training.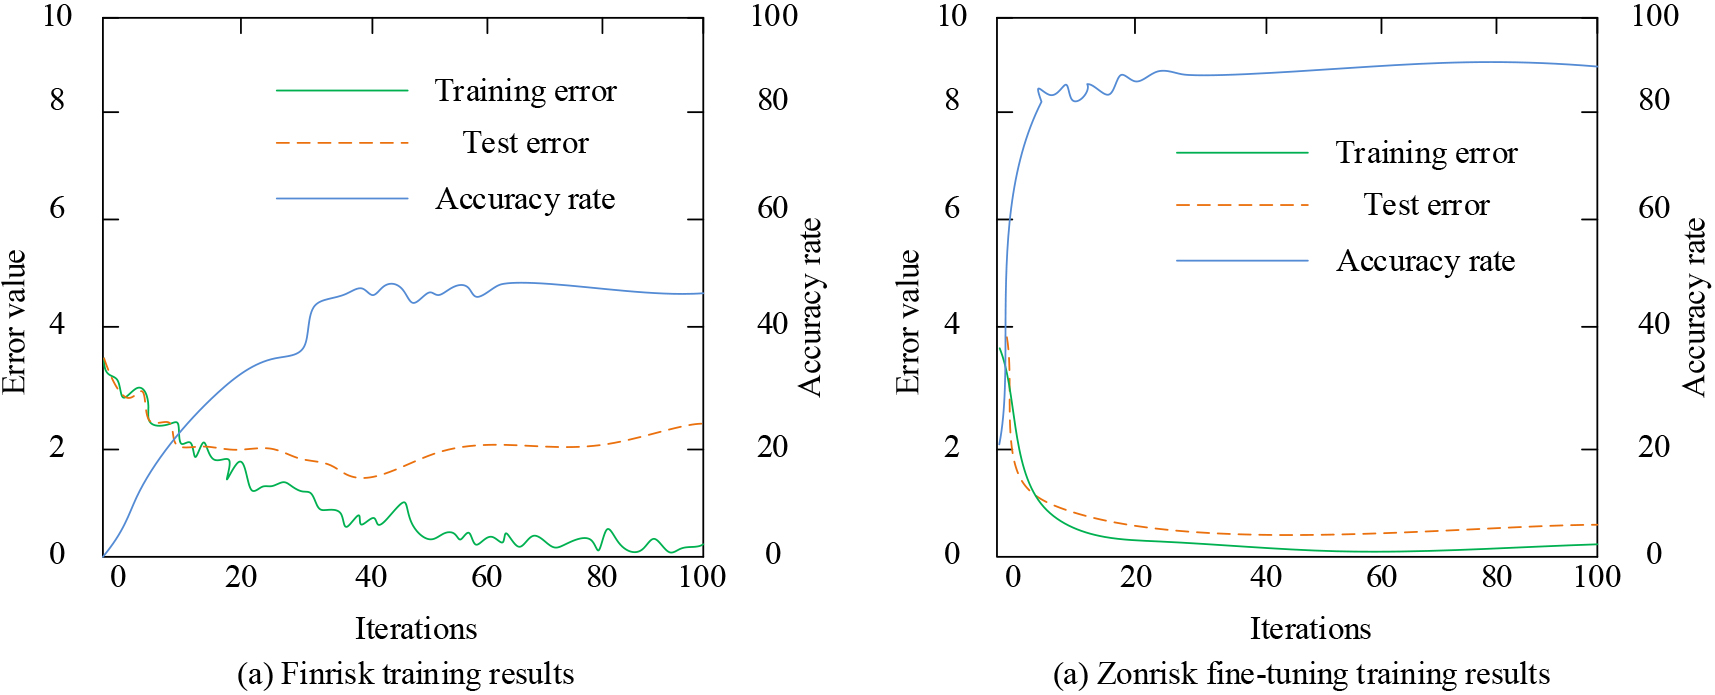
Figure 8, Figure (a) and (b) plots reflect the training error, test error and accuracy of Finrisk self-training and Zonrisk pre-training, respectively. The accuracy of Finrisk self-training model is at 46%, while Zonrisk pre-training can reach 85% accuracy after Finrisk fine-tuning. The comparison of the different effects of the two training sets illustrates that the use of parameter-based network migration learning significantly improves the convergence of the model and the accuracy on the test set. The processed data were applied to the regional investment risk evaluation model to assess the risks of 34 provinces and cities, and the results are shown in Fig. 9.
Risk assessment results in different provinces.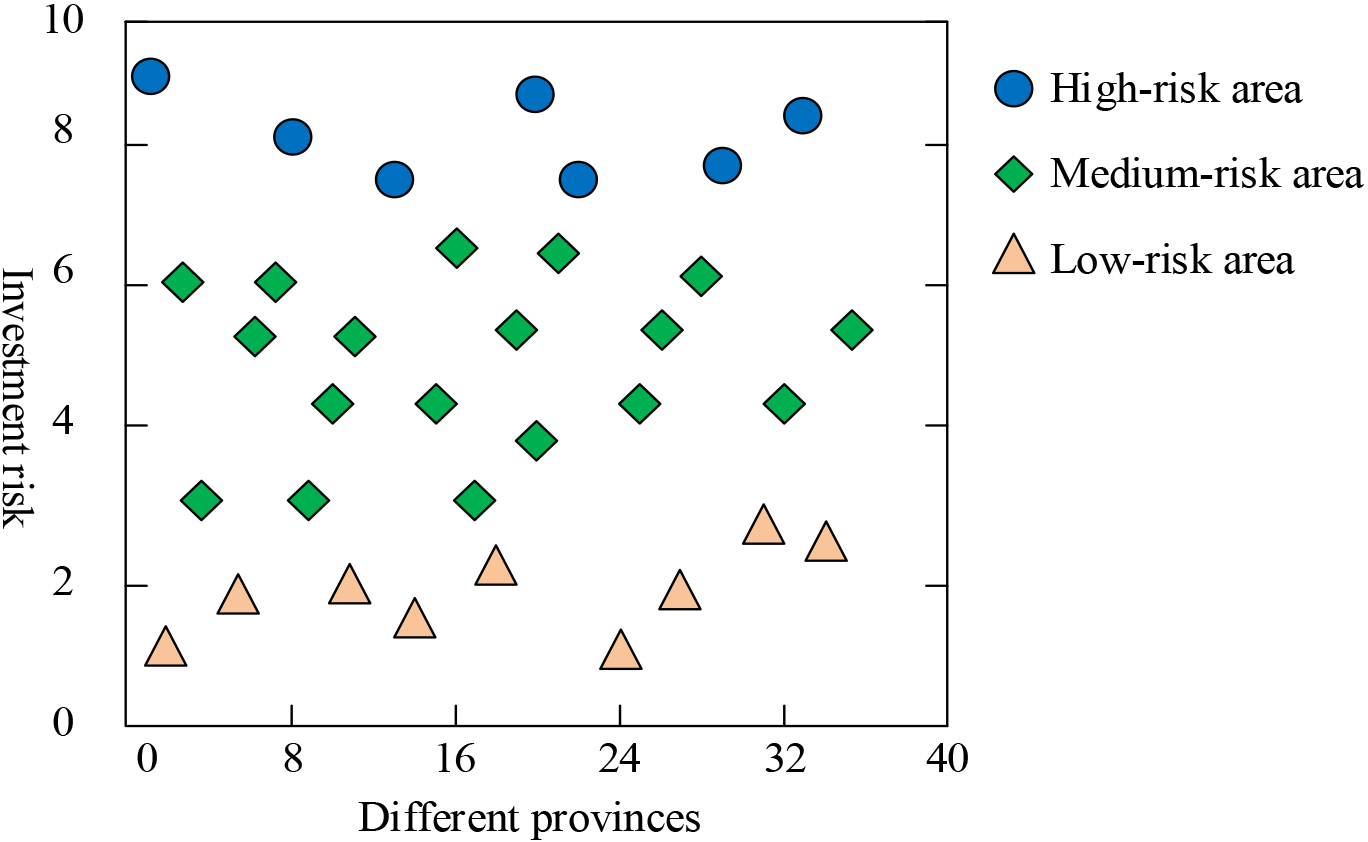
As can be seen from Fig. 9, the development of regional investment risk environment in 34 provinces and cities in China is extremely uneven, with most regions being in moderate risk, including 9 places in low-risk regions and 7 places in high-risk regions. Southeast coastal provinces and cities such as Jiangsu, Zhejiang, Beijing, Shenzhen and Shanghai are in low-risk areas, where the investment environment is relatively well developed and can effectively support the development of venture capital. The provinces and cities of Hubei, Hunan, Henan, Hebei and Sichuan are in the medium-risk region in terms of investment environment. While the venture capital environment in western regions is relatively backward and mostly in high-risk areas, such as Qinghai, Xinjiang, Gansu, Guizhou and Tibet. A representative from each of the three risky regions, high, medium and low, was selected, with Shanghai representing a good investment environment, Henan representing an average investment environment, and Guizhou representing a relatively backward investment environment. After the selection, the three places are then subdivided to explore what the main factors affecting the investment environment are specifically. The risk characteristic values of Shanghai, Henan and Guizhou were normalized to the data, and then calculated according to the compound correlation coefficient and similarity matrix in the cluster analysis, and the situation of each risk indicator in the region was obtained as shown in Fig. 10.
Influence of risk factors in different provinces and cities.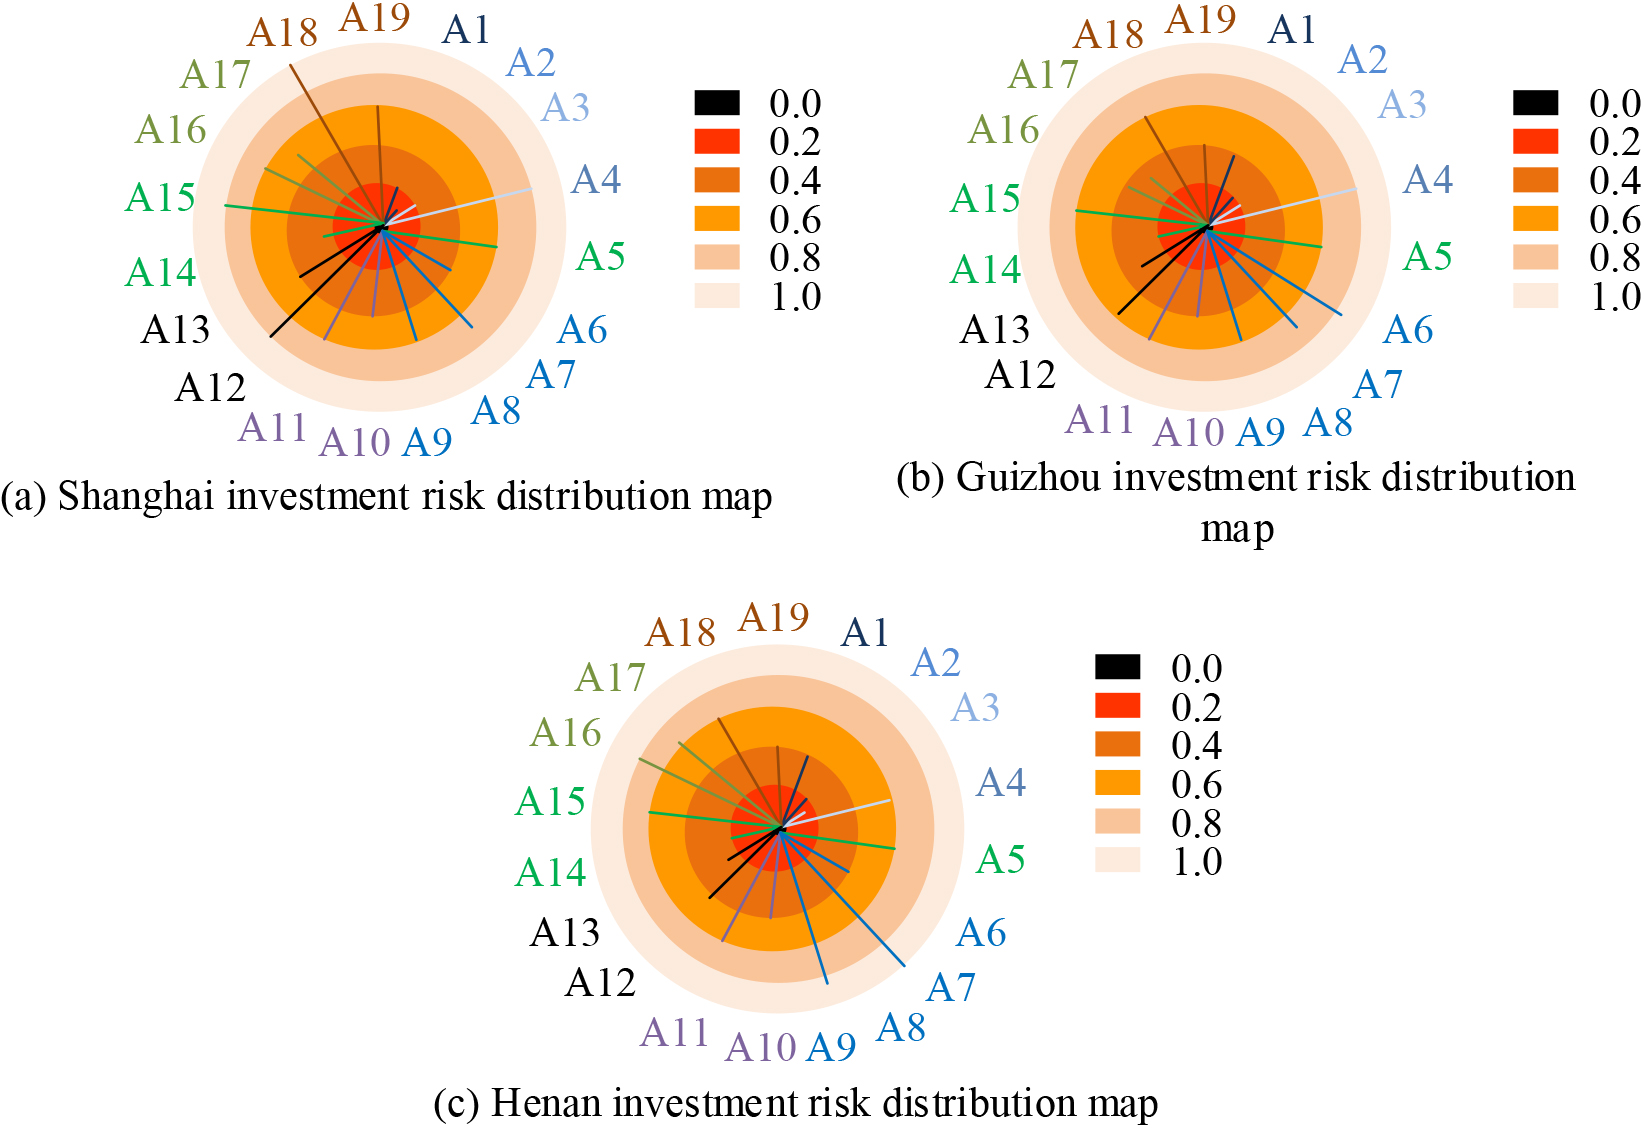
In Fig. 10, A1, A2, …, A19 represent different risk factors, and the specific corresponding values are shown in Table 2. As can be seen from the (a) of Fig. 10, Shanghai has good infrastructure, communication conditions and health care, and the risk of basic resources is low; political stability and perfect legal system, political, religious and operational risks are relatively low. However, the protection of employees’ rights and interests and the environment is relatively strict, and the risk value of labor and environmental protection is relatively high. As can be seen in Figure (b) of Fig. 10, Guizhou’s economic investment has grown rapidly in recent years, but the transportation conditions and infrastructure still need to be improved. As can be seen in Figure (c) of Fig. 10, the resource potential of investment risk in Henan is relatively good, but the economic growth is relatively slow. Overall contrast, Shanghai regional investment risk is the lowest. The randomly selected 50 test samples were tested using different methods, and the results are shown in Fig. 11.
Schematic diagram of contribution degree of risk indicators.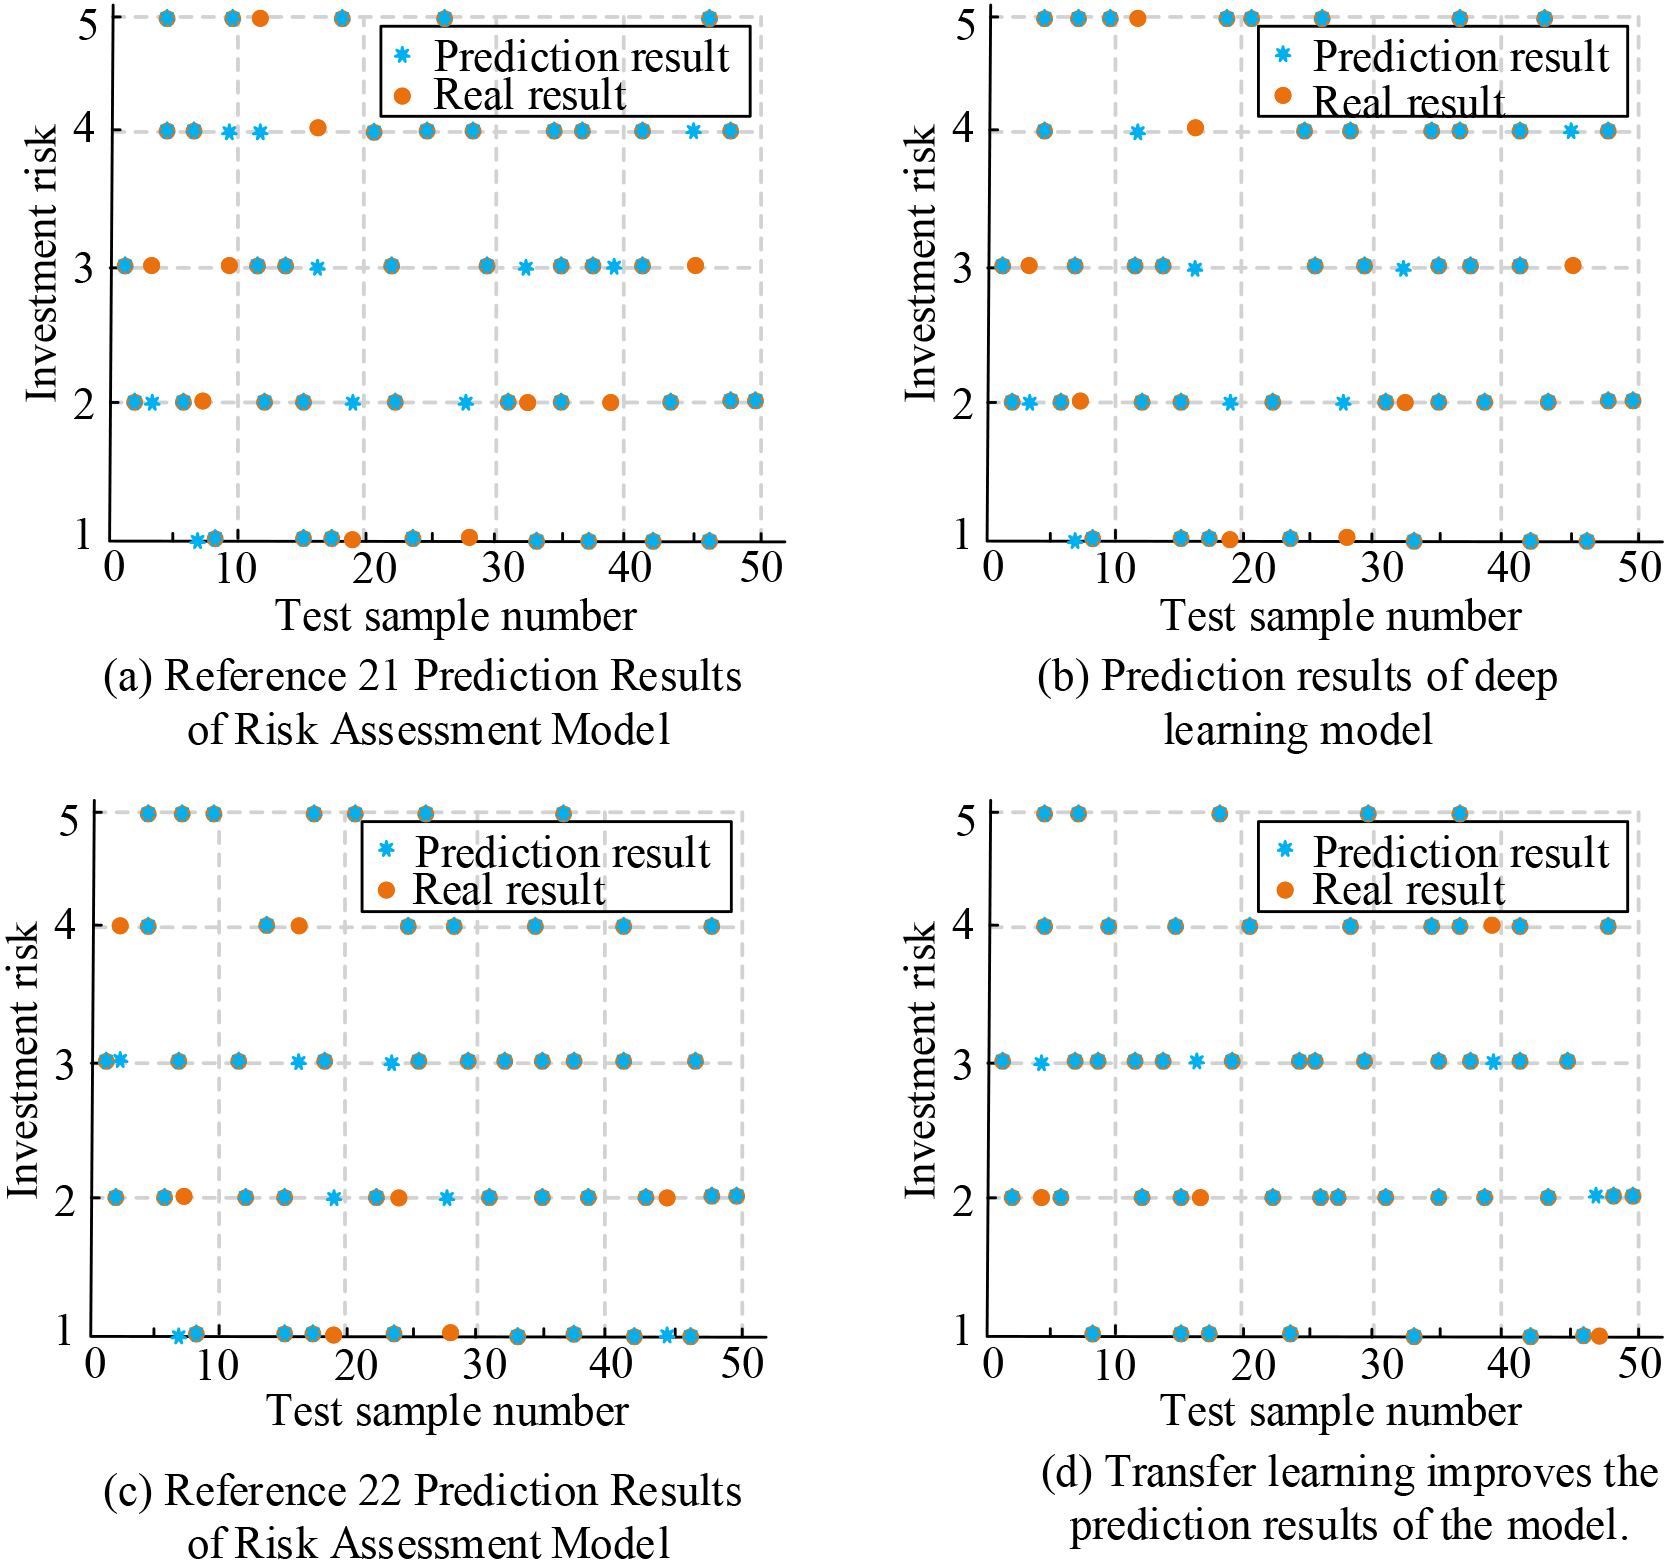
As can be seen in Fig. 11, the investment risk is divided into five levels, with low investment risk set as level 1, general investment risk set as level 2, higher investment risk set as level 3, serious investment risk set as level 4, and risk that cannot be invested set as level 5. The 50 randomly selected test samples were tested using different method comparisons. Test using the risk evaluation model in reference [21] for 40 correct predictions and 10 prediction errors, with a correct rate of 0.80. The test results using the deep learning algorithm predicted 42 correctly and 8 incorrectly, with a correct rate of 0.84. The risk model in reference [22] was tested for 43 correct predictions and 7 prediction errors, with a correct rate of 0.86. The transfer learning improved model was used to test 46 correct predictions and 4 prediction errors, with a correct rate of 0.92.
For the problem of regional investment risk evaluation, this research designs a regional investment risk evaluation model based on deep learning. In order to avoid the influence of insufficient data, the risk evaluation model is improved by combining migration learning. The test results show that there are 9 provinces and cities in low risk areas, 7 provinces and cities are in high risk areas, and most of the remaining provinces and cities are in moderate risk, indicating the unbalanced investment risk environment of 34 provinces and cities in China. From the results of the contribution analysis of the risk index, the contribution of the same index changes with the change of the risk level. The transfer learning improvement model was 0.92, while the other method models were 0.80, 0.84 and 0.86, respectively. The results showed that the model designed based on this study had the highest accuracy in predicting the risk. The designed transfer learning improvement model effectively avoids the impact of data shortage and data inconsistency. This model is beneficial for investors to assess the regional investment risk and take corresponding risk management measures to reduce the investment risk and improve the return on investment. Regional investment includes different fields, such as real estate manufacturing and technology industry. In practice, the specific risks are also different, but the deficiency of this study is that it does not distinguish these risks. With the further development of subsequent research, the risks faced by different industries will be further refined, so as to improve the precise pertinence of venture capital analysis.
Footnotes
Funding
This work was supported by Project source Education Department of Guangdong: Scientific Research Project of Guangdong Education Department: Research on financial Risk early warning mechanism of enterprises in the era of digital intelligence (No.2021WTSCX121); Study on Improvement of Dupont Analysis under Factor Analysis (No.2018WQNCX310); Youth academic research project of Huashang College: Research on early warning mechanism of enterprise financial risk based on neural network model (No.2021HSQX01).