
Abstract
BACKGROUND:
Myrtle berries have had a long history of application in the perfumery, cosmetic, food and pharmaceutical industries as well as being used for the industrial formulation of typical sweet liqueurs. However, no data is currently available on the metabolite composition and distribution in the different parts of the berry.
OBJECTIVE:
In the present study a metabolomics approach followed by multivariate data analysis and phytochemical characterization of (poly) phenolic metabolites, using liquid chromatography coupled with high resolution mass spectrometry, was developed to identify novel markers in different parts of myrtle berries and to understand which part of the fruit has the most influence on the metabolomics classification of berries, based on geographic origin of the plant and the cultivars.
RESULTS:
By using LC-ESI-Orbitrap-MS analysis, 35 compounds were tentatively identified on the base of their retention time, UV/Vis spectra, MS spectra and MS fragmentation patterns. 19 compounds, pertaining mainly to polyphenol compounds like flavonoids and to a new class of hydrolysable tannins, were detected and identified for the first time in these berries (mainly in seeds).
CONCLUSIONS:
By using multivariate statistical analysis, predictive classification models for authenticity and geographical origin, assessment was obtained. With this study, flavonoids and anthocyanins, mainly found in the peel and pulp of the myrtle berry, were recognized as putative marker compounds to assess the geographic origin of these berries.
Introduction
Polyphenols like anthocyanins, ellagitannins, flavonoids conjugates and hydroxycinnamic acid are the most abundant source of health promoting phytochemical compounds in berry fruits [1, 2]. In particular, Ellagitannins, pertain to a group of compounds known as hydrolysable tannins and are polymers and a polyol, which is usually either glucose or quinic acid [3]. They are generally uncommon in fruit and vegetables and are found only in a few berry fruits such as strawberries (Fragaria ananassa D.) raspberries (Rubus idaeus L.) and blackberries (Rubus spp) [4]. For this class of compounds, recent studies have reported several biological properties which make them suitable not only for use in textiles, but also for other applications in cosmetics, medicine, agronomy and phytotherapy [5, 6].
These compounds are not equally distributed in both quality and quantity across the different organs of a plant and are subject to quantitative, seasonal and inter-species variations [7].
Some compounds, pertaining to this class, are mostly reported in the leaves of Myrtus communis [8, 9].
Myrtus communis belongs to the Myrtaceae family. It is a pleasant annual shrub with dark blue ripe berries, which have been used for some time in the perfumery, cosmetic, food and pharmaceutical industries [10]. In Sardinia (Italy), these berries are mostly used for the industrial formulation of sweet liqueurs, typical of the Sardinia region (Italy) [11]. The species Myrtus communis has been the subject of several researches focused on the chemical composition of the essential oil [12, 13] and of the methanol extracts of myrtle berries. The species has been investigated for the presence of flavonoids and anthocyanins [14–17]. Nevertheless, no data are present on the metabolite composition and distribution in the different parts of the berry.
In the present work liquid chromatography, coupled with high resolution mass spectrometry in conjunction with principal components analysis (PCA), was applied to investigate the metabolic composition of different parts of the Myrtus communis purple berry. The aim is to understand which part of the fruit has the most influence on the metabolomics classification of berries, based on the geographic origin of the plant.
Metabolite profiling, using liquid chromatography combined with high resolution mass spectrometry (LC-ESI-Orbitrap-MS) has proved to be a powerful tool for discovering changes in metabolite composition in different fruit parts of Myrtus communis. Through LC-ESI-Orbitrap-MS analysis and MS/MS experiments, 35 compounds were identified or tentatively identified on the bases of their retention time, UV/Vis absorbance, MS spectra and MS fragmentation patterns and a new class of hydrolysable tannins was identified for the first time in these berries.
Materials and methods
Plant materials
Seeds of two cultivars of Myrtus communis, were collected from the geographic area of Sassari and Cagliari (Sardinia, Italia) respectively, and then grown in the same Experimental Station of the University of Sassari located in Oristano (Sardinia, Italy). Three samples of purple berries from plants derived from seeds of the Sassari area (1, 2, 3) and three samples from plants derived from seeds of the Cagliari area (4, 5, 6) were randomly harvested (≈2 kg) during the fruit ripening stage in December 2014. Before analysis, the samples collected were immediately frozen in liquid nitrogen and then freeze dried. The peel and pulp were removed and separated from the seeds. Whole berry, peel, pulp and seeds were used for the analysis.
In total 18 samples were obtained and labeled as follows: 1S, 2S, 3S (seeds from samples developed from original seeds of the Sassari area); 4S, 5S, 6S (seeds from samples developed from original seeds of the Cagliari area); 1P&P, 2P&P, 3P&P (peel and pulp from samples developed from the original seeds of the Sassari area); 4P&P, 5P&P, 6P&P (peel and pulp from samples developed from original seeds of the Cagliari area); 1B, 2B, 3B (whole berries from plants developed by seeds of the Sassari area); 4B, 5B, 6B (whole berries from plants developed by seeds of the Cagliari area). Each sample was analyzed in duplicate (obtaining 36 samples in total).
Different cultivars were not registered (with a specific voucher number), but they were described in several scientific publications where specific names were attributed to them (as required by Italian law), Maria Rita, Barbara, Daniela, Giovanna, Lelia, Tonina [18].
Sample preparation
Seeds, peel and pulp and whole berries were lightly pulverized following the procedure described by De Vos et al. (2007) [19] with slight modifications: 0.5 g was extracted with 10 ml of a solution comprised of 70% aqueous methanol acidified at 0.1% of formic acid followed by sonication for 15 minutes and centrifugation for another 15 minutes at 1750 rpm. The supernatant was collected and filtered through 0.45 μm filters, and then 100 μL of extract was diluted in 900 μL of water (of LC-MS grade), for a final concentration of approximately 1 mg/mL.
For the LC-MS analysis 10 μL were used. Each sample was analysed in technical duplicate.
Reagents and solvents
Formic acid and methanol for extraction were purchased from VWR international PBI S.r.l. (Milano, Italy). Acetonitrile, water and formic acid (all of LC-MS grade) were purchased from Merck (Darmastadt, Germany).
HPLC-UV/VIS analysis
An Agilent (Palo Alto, CA, USA) 1260 Infinity system consisting of a G1312C binary pump, a G-1328A Rheodyne injector (20 μL injection loop) a G-1379A degasser and a G1314B photodiode array detector were employed to develop the chromatographic method. Analyses were performed using a Waters XSelect CSH C18 (2.1 mm×150 mm particle size 3.5 μm) column, eluted with water containing 0.1% formic acid (solvent A) and acetonitrile containing 0.1% formic acid (solvent B). A linear gradient program at a flow rate of 0.200 mL/min was used: 0–15 min, from 10 to 20% (B); 15 to 25 min, from 20 to 40% (B); 25 to 35 min from 40 to 60% (B) then to 100% (B) for 5 min and back to 10% (B) for other 5 min. This gradient was used for LC-ESI-Orbitrap-MS analysis described below. Detection was carried out with two wavelengths, 360 nm specific for flavonoids and 520 nm specific for anthocyanins.
LC-ESI – orbitrap-MS analysis
LC-ESI-Orbitrap-MS analyses were performed essentially as described by D’Urso et al. (2015) [20].
An HPLC method coupled with a hybrid mass spectrometer, combining a linear trap quadruple (LTQ) and an Orbitrap mass analyser, was developed for the study of the main metabolites characteristic to each part of the berry. Experiments were performed working with a Thermo Scientific liquid chromatography system based on a quaternary Accela 600 pump and an Accela auto sampler, hyphenated with a linear orbitrap hybrid mass spectrometer (LTQ-Orbitrap XL, Thermo Fisher Scientific, Bremen Germany) equipped with electrospray ionization (ESI). Separation was performed on a XSelect CSH C18 (Waters, Milford, MA) column (2.1 mm×150 mm particle size 3.5 μm). The mobile phase selected after optimization consisted of solvent A (water acidified with 0.1% formic acid) and solvent B (acetonitrile acidified with 0.1% formic acid). The gradient program used is described above in HPLC-UV/Vis analysis. The mass spectrometer was operated in negative ion mode. ESI source parameters were as follows: capillary voltage –12 V; tube lens voltage –121.47; capillary temperature 280°C; Sheath and Auxiliary Gas flow (N2) 30 and 5, Sweep gas 0 Spray voltage 5. MS spectra were acquired by full range acquisition covering m/z 200–1600. A data dependent scan was performed with the aim of obtaining MS/MS experiments, selecting precursor ions corresponding to most intensive peaks in LC-MS analysis. The experiments were also performed in positive ion mode for a quality screening followed by a fragmentation study. ESI source parameters were as follows: capillary voltage 49 V; tube lens voltage 120; capillary temperature 280°C; sheath and Auxiliary Gas flow (N2) 30 and 5, Sweep gas 0 Spray voltage 5. MS spectra was acquired in the full range acquisition m/z 250–1600.
Spectral characteristics fragmentations allowed for the identification of phenolic compounds in addition to specific retention times, and finally, data were compared with literature. Xcalibur software version 2.1 was used for instrument control, data acquisition and data analysis.
Multivariate data analysis
LC-MS raw data of the 36 samples deriving from LC-ESI-Orbitrap-MS analysis (negative ion mode) were analysed using a platform independent open source software package called MZmine (http://mzmine.sourceforge.net/). Using this toolbox with normalization of total raw signal, we detected 634 peaks. After exporting the processed data in tabular format (.cvs file), further analysis of the data matrix were performed by SIMCA P+ software 12.0 (Umetrix AB, Umea Sweden) by Principal Component Analysis (PCA). PCA was performed by applying the peak area obtained from LC-MS analysis [21, 22]. Pareto scaling was applied before multivariate data analysis.
Results and discussion
A preliminary LC-UV analysis, at 360 nm, was focused on the detection of phenolic compounds, mainly flavonoids; an LC-UV analysis, wavelength at 520 nm, was focused on the detection of anthocyanin. Results (data not showed) indicated that both classes of compounds were present in the different berry parts. Therefore, LC-MS experiments were performed in positive and negative ion mode.
LC-MS metabolomics analysis
Aqueous/methanol extracts of seeds, peel and pulp and whole myrtle berry were analyzed by LC-ESI-Orbitrap-MS.
Base-peak chromatograms in negative ion mode of the different parts of myrtle berries extracts are presented in Fig. 1, while base-peak chromatograms in positive ion mode are presented in Fig. 2. In total 35 compounds were identified or putatively identified based on retention time, accurate mass measurement, fragmentation pattern and comparison with data reported in literature (Table 1). As far as we know 19 of these compounds were identified for the first time in myrtle berries. In the current work, the identified compounds are classified into six groups: hydrolysable tannins; hydroxycinnamic acid; gallomyrtucommulones; flavanols; flavonols; anthocyanins. All of them are present in all parts of the fruit, with variability in intensity.
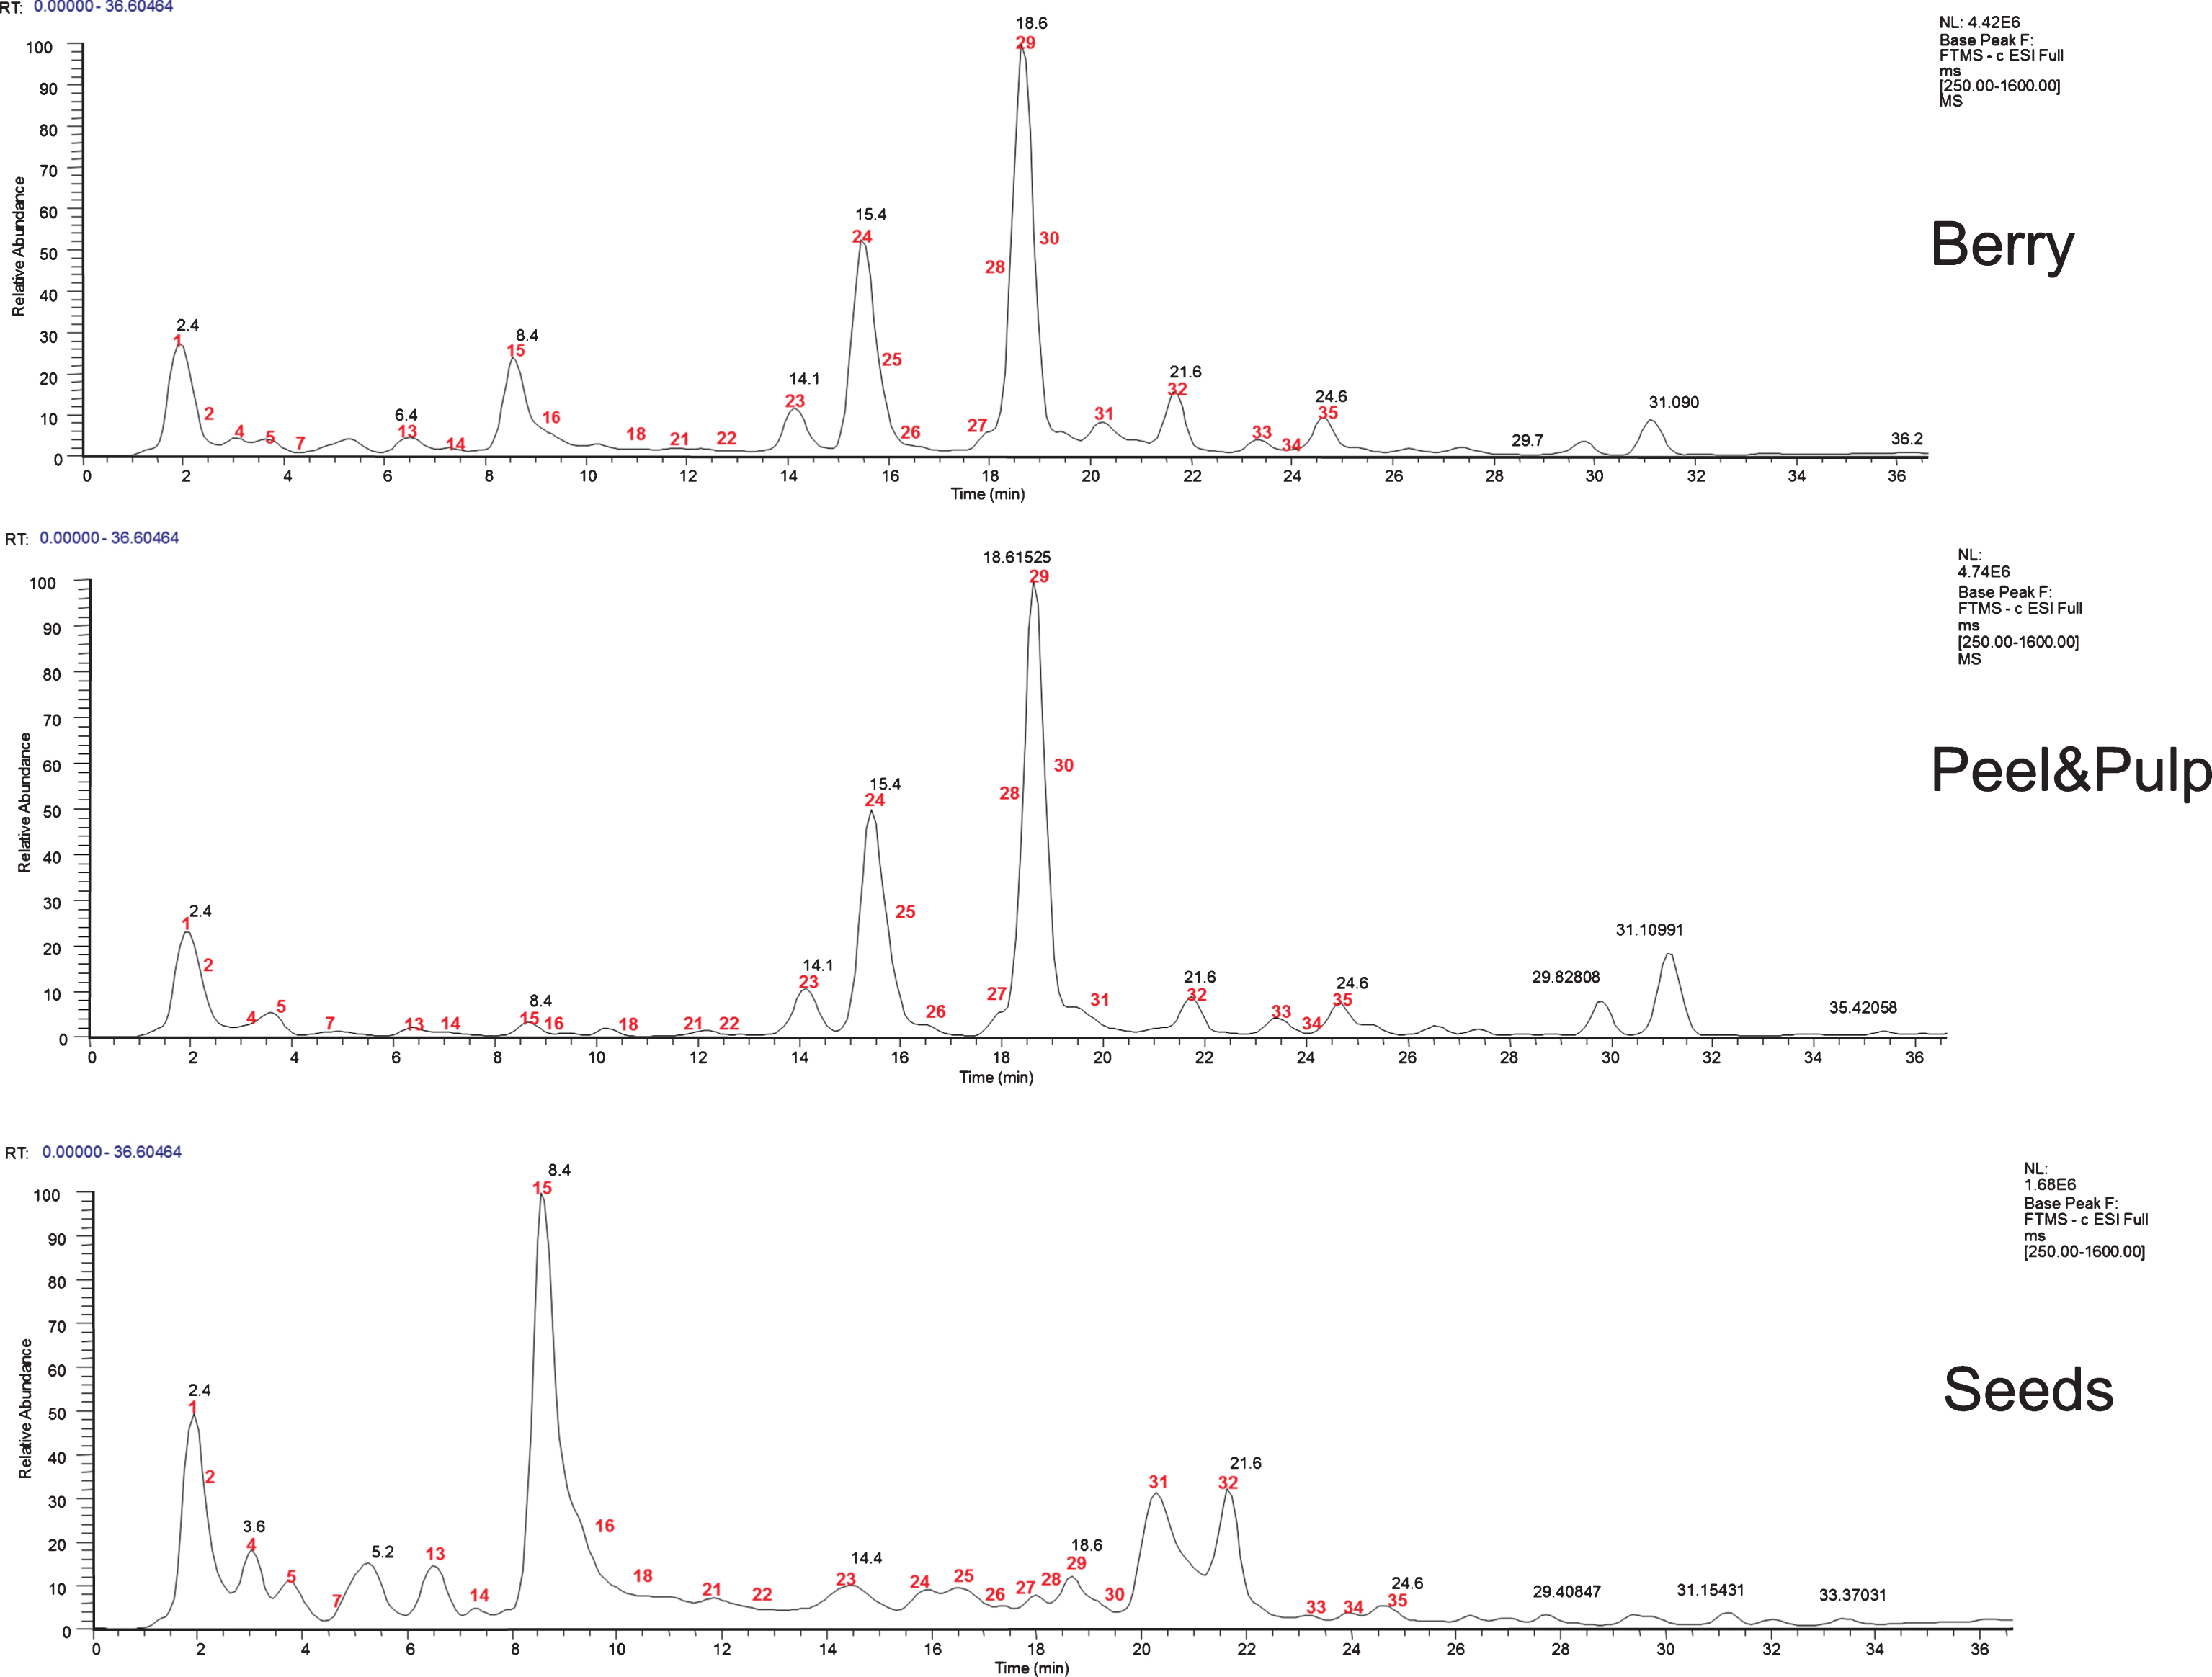
Base peak chromatograms in negative ion mode of whole berry, Peel & pulp and seeds of Myrtus communis methanol extracts.
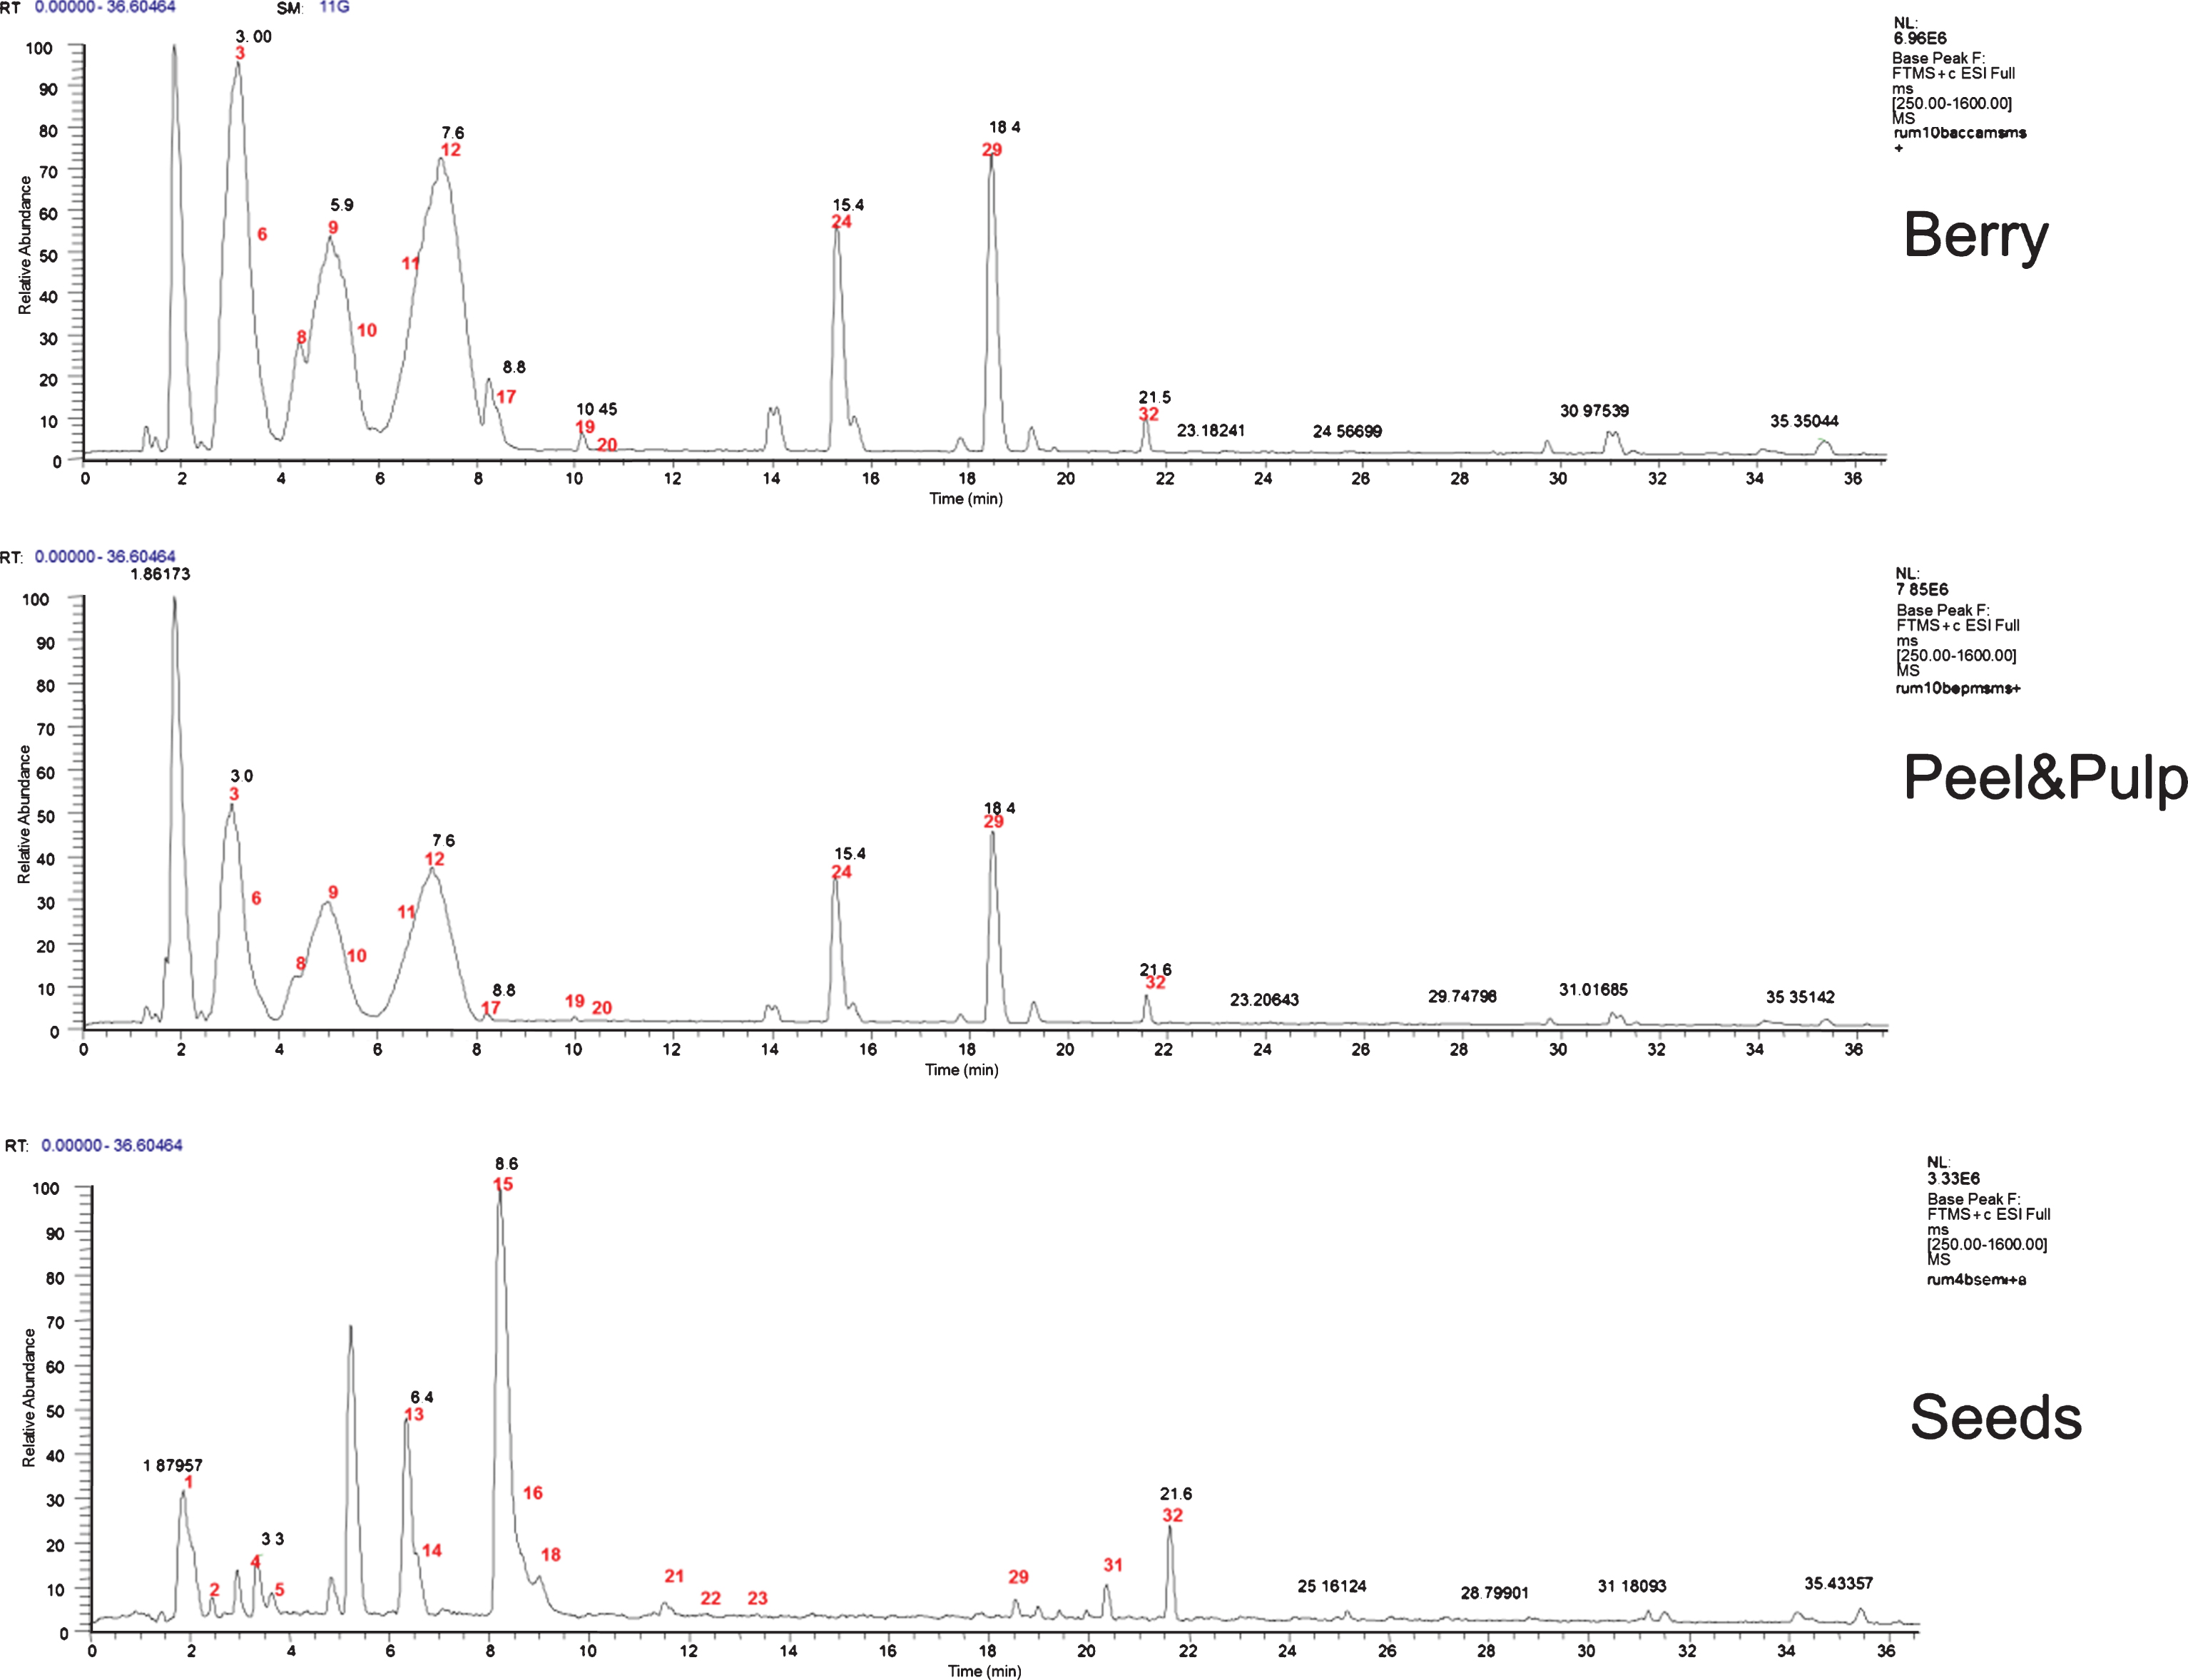
Base peak chromatograms in positive ion mode of whole berry, Peel & pulp and seeds of Myrtus communis methanol extracts.
Identified compounds in the different parts of Myrtus communis berries using HPLC-ESI-Orbitrap-MS/MS analysis in negativeand positive ion mode
*Found in leaves of Myrtus communis. MW: Molecular weight; N.F. Not Fragmented.
This class of compounds was detected at 360 nm and identified through LC-MS and MS/MS experiments by operating in negative ion mode.
Compound
Compounds
Compound
Compound
Compound
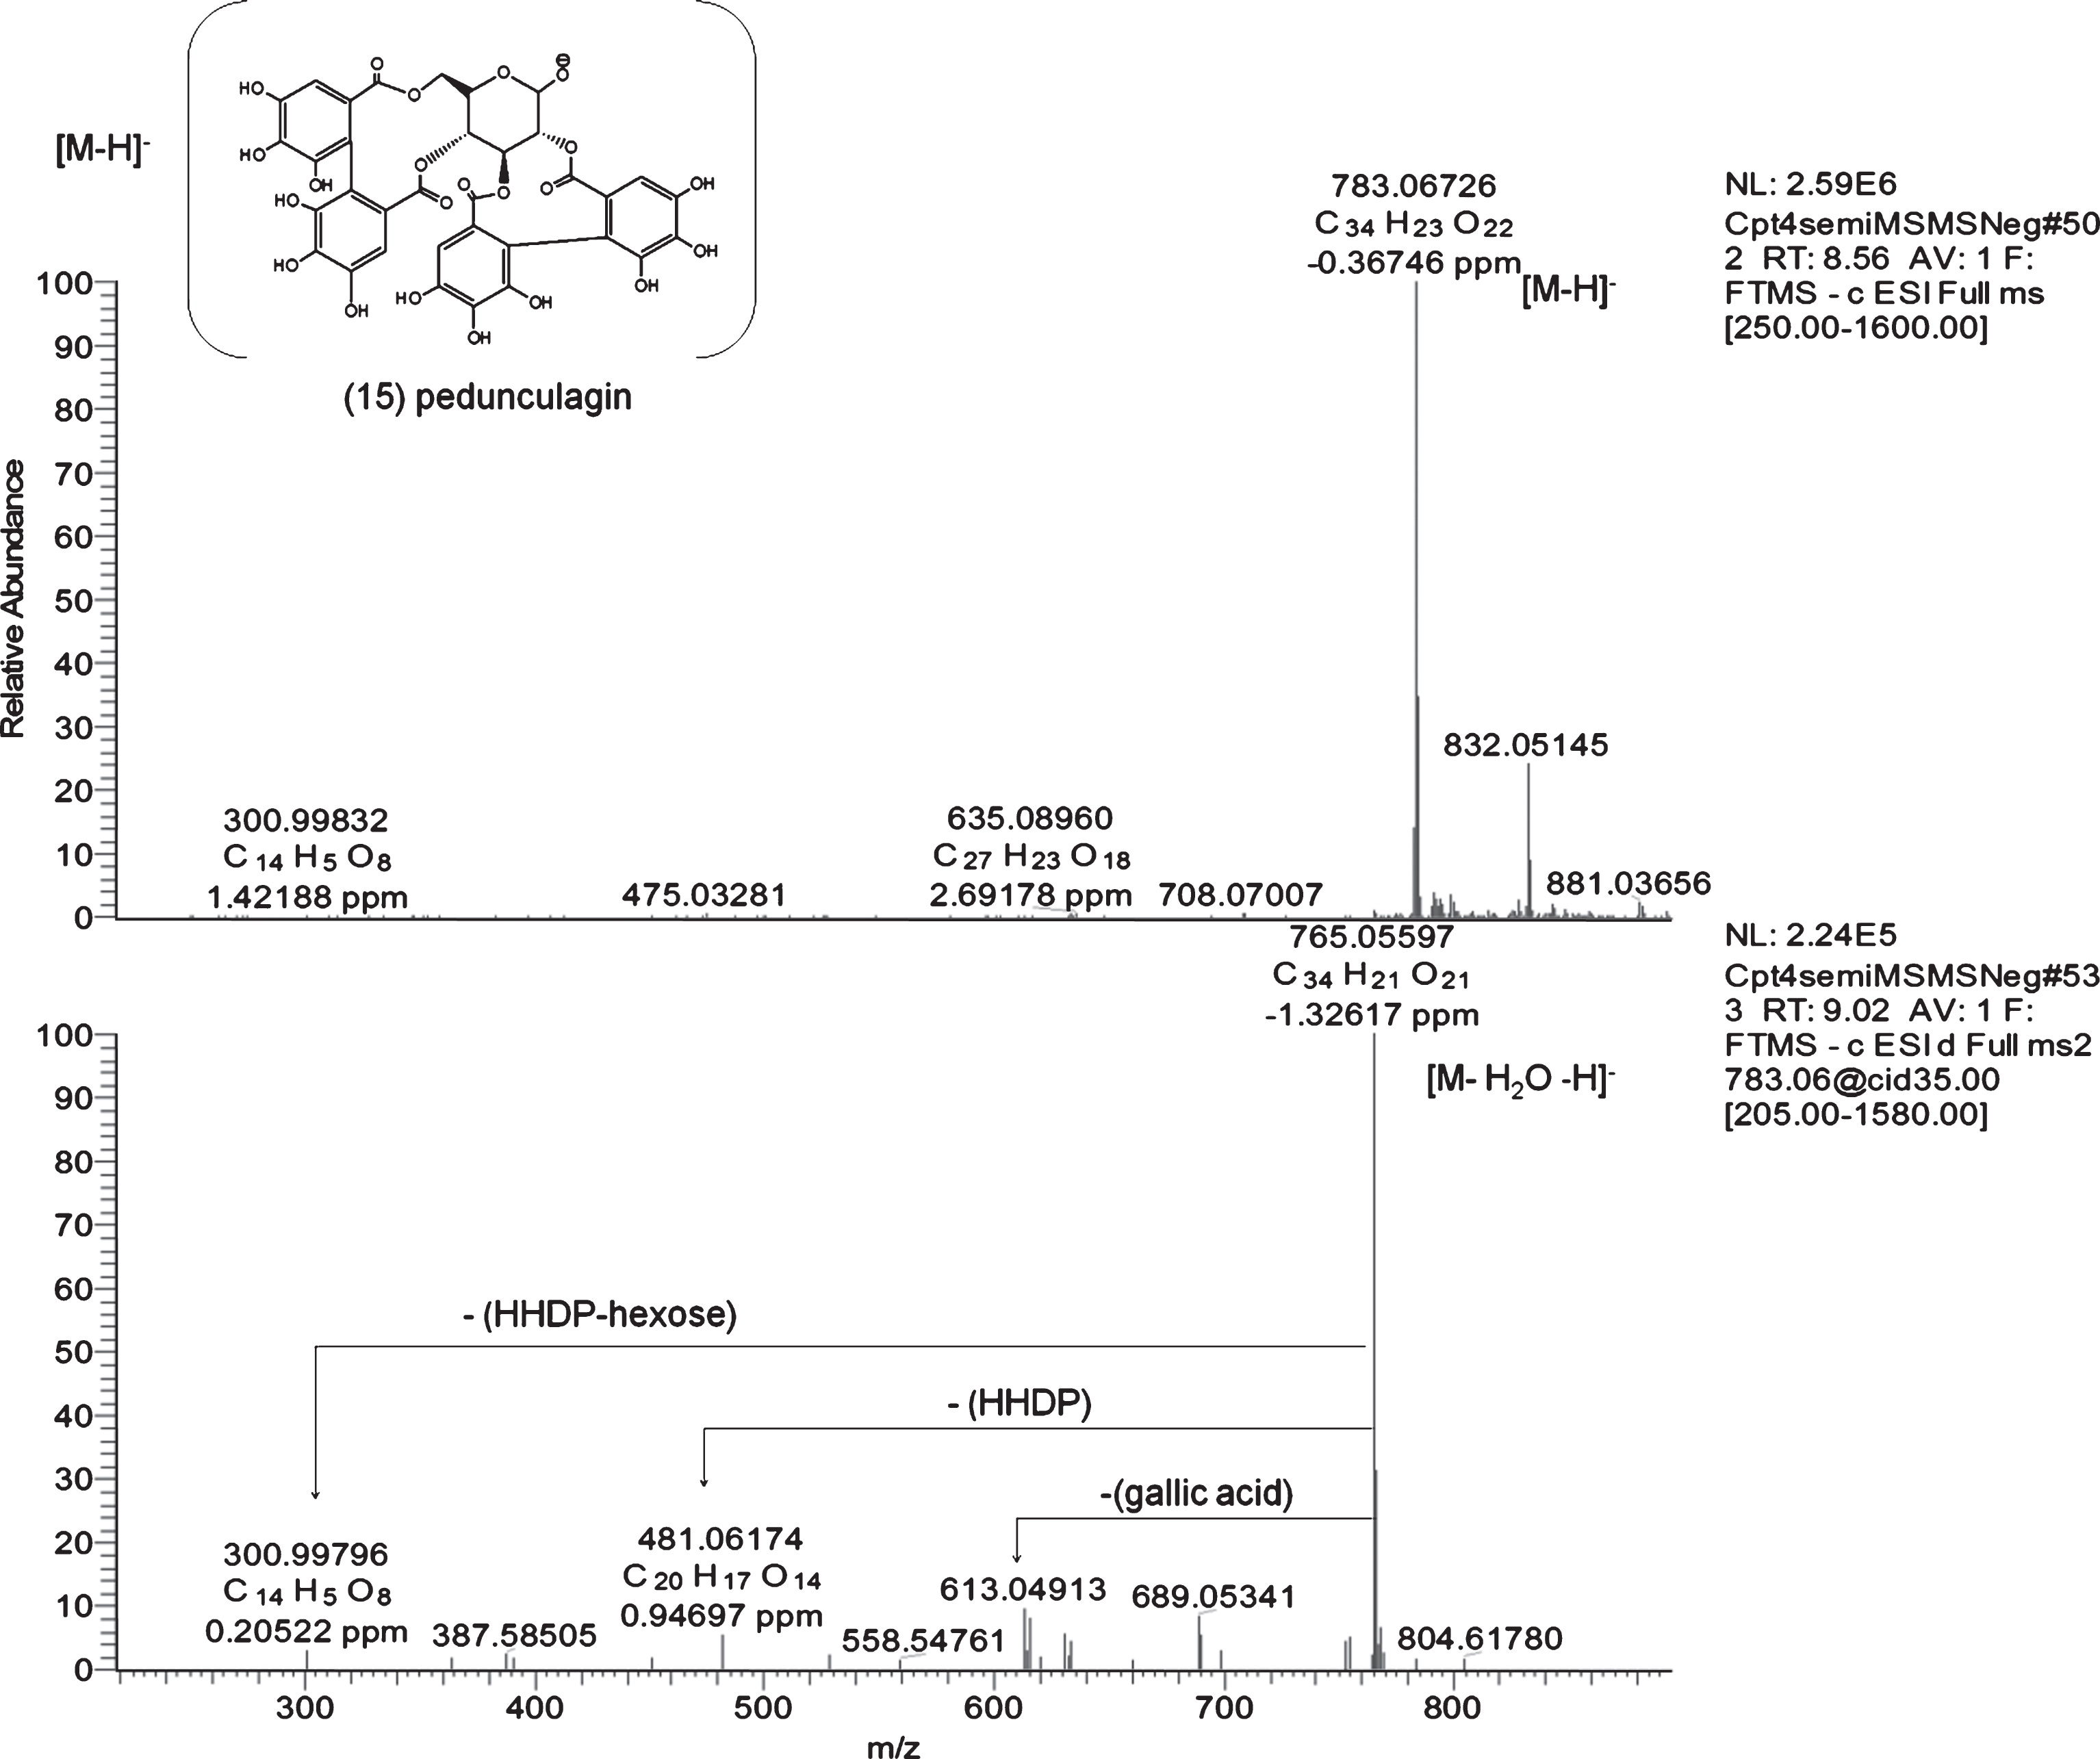
MS/MS spectrum of pedunculagin (compound
Compound
Compound
Compounds identified, pertaining to this class are reported in Fig. 4.
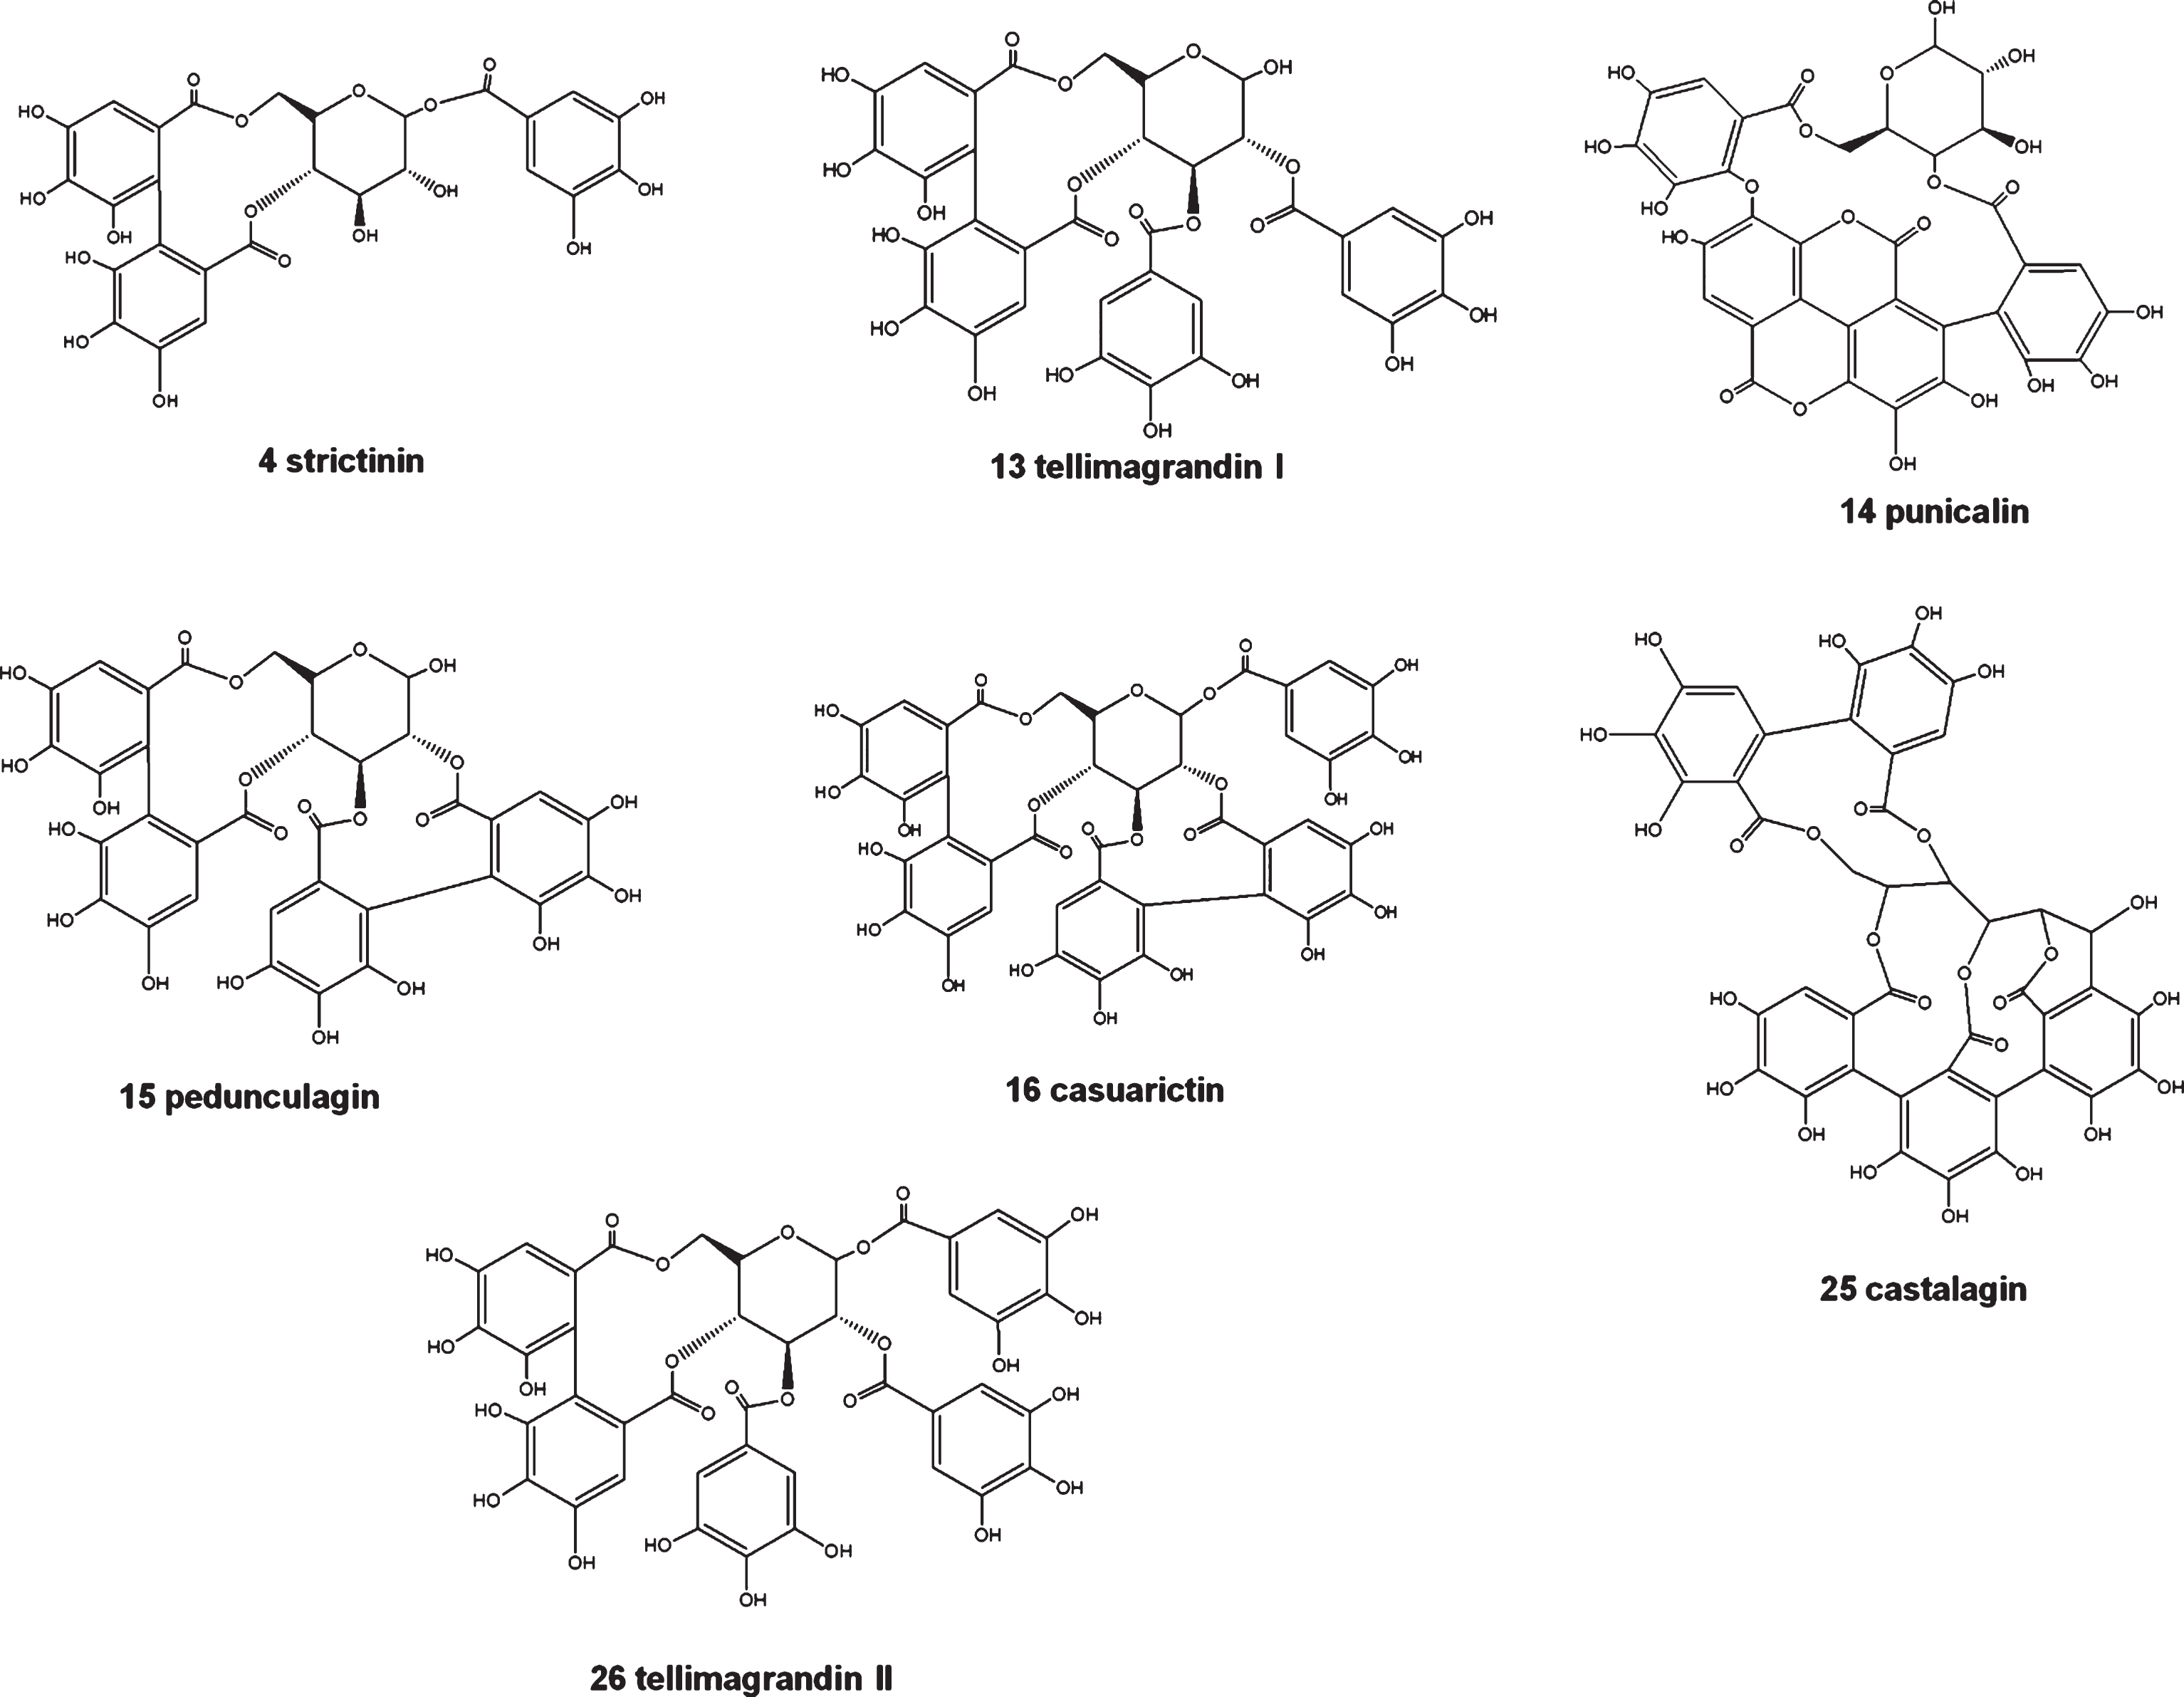
Chemical structures of hydrolysable tannins tentatively identified for the first time in different parts of myrtle berries.
Compound
This class of compounds was detected at 360 nm and identified through LC-MS and MS/MS experiments by operating in negative ion mode.
Compound
Hydroxycinnamic derivatives
Compound
Flavanols
This class of compound was detected at 360 nm and identified through LC-MS and MS/MS experiments by operating in negative ion mode.
Compounds
Flavonols
This class of compound was detected at 360 nm and identified through LC-MS and MS/MS experiments by operating in negative ion mode.
Compounds
Compounds
Compound
Compound
Compound
Anthocyanins
This class of compound was detected at 520 nm and identified through LC-MS and MS/MS experiments by operating in positive ion mode
Compound
Multivariate data analysis
The Multivariate Data Analysis was basically performed following the experimental protocol described by D’Urso et al. (2015). LC-ESI-Orbitrap-MS chromatograms were pre-processed using MZmine (a free software) in a way to compensate for variations in retention time and m/z value between each chromatographic run. A peak list table was obtained from pre-processed chromatograms. In the final table, rows represented the individual samples (36 samples: 18 biological samples in technical duplicates), and columns represented integrated and normalized peak areas. Furthermore, this data was used through an approach of untargeted analysis and treated with an unsupervised Multi Variated Data Analysis method (PCA).
Principal Component Analysis (PCA) was performed by applying the peak areas of each peak observed in the LC-MS dataset (excluding the noisy), and a matrix was constructed by using these areas (variables), with the different analyzed samples as columns of the matrix. The resulted score scatter plot is reported in Fig. 5. The first component describes 70.22% of variance while the second only 7.72%. The choice of principal components was realized on the basis of the fitting (R2X) and predictive (Q2X) values for thePCA model.
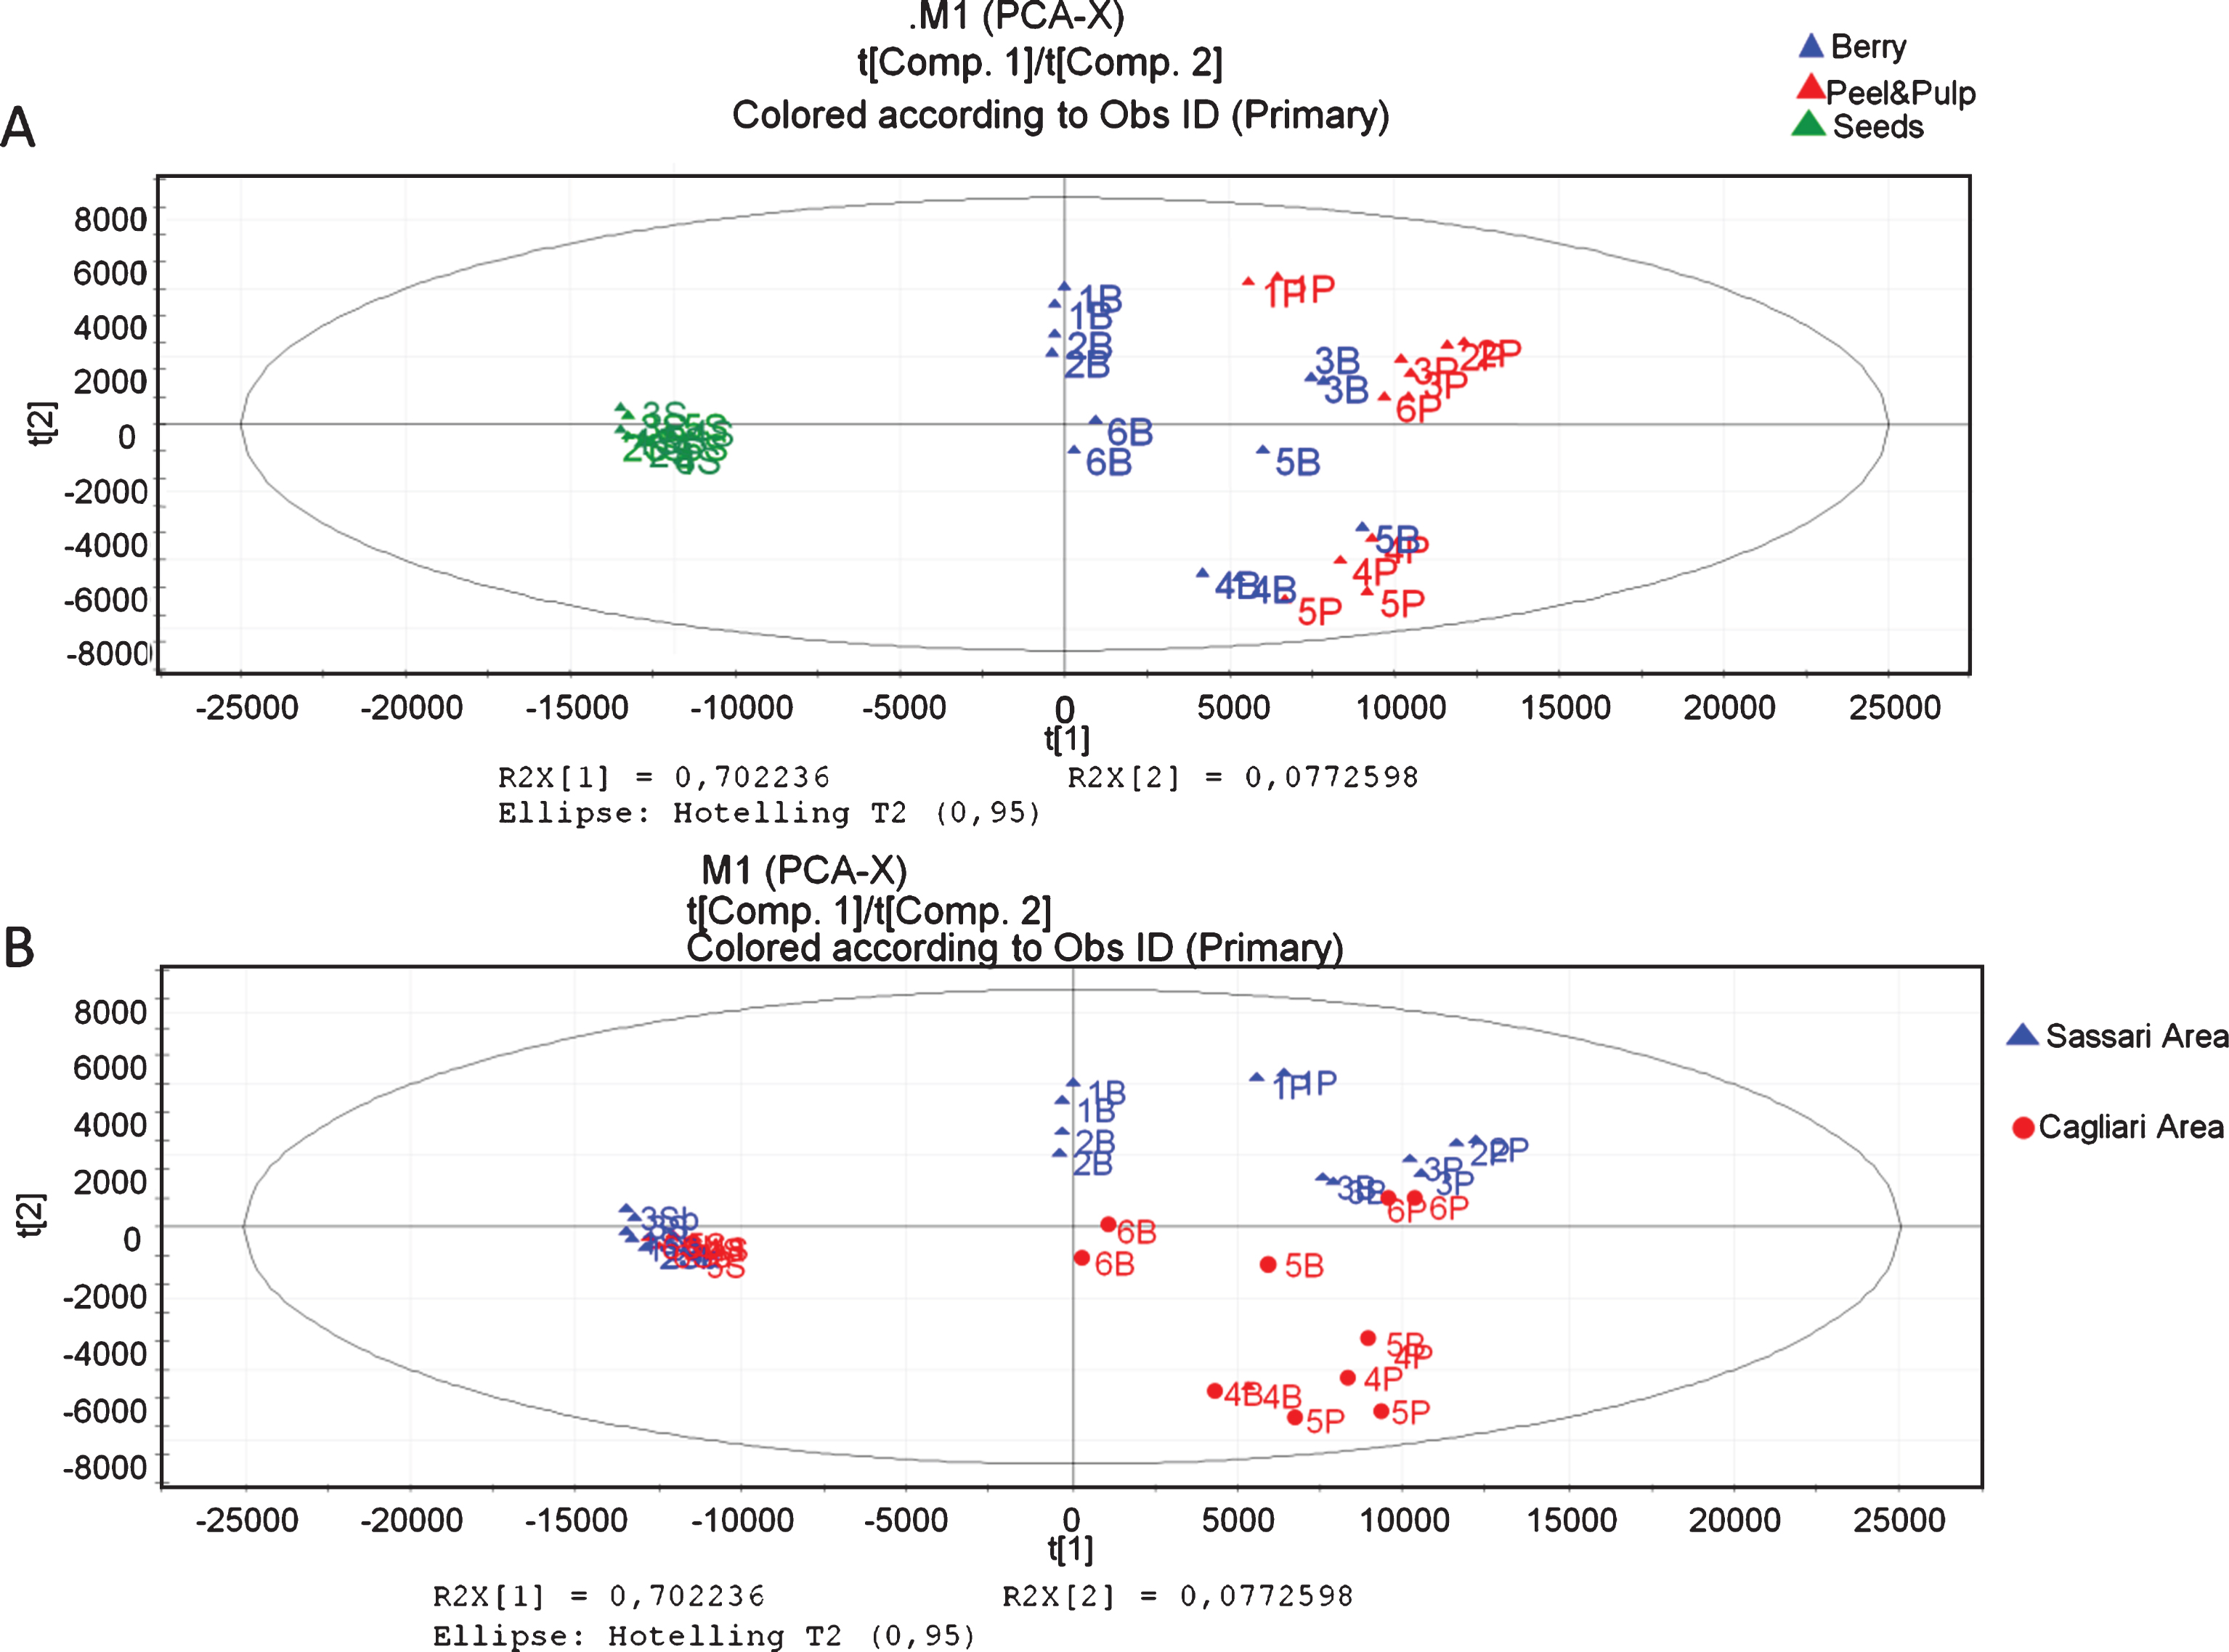
Principal Component Analysis, score scatter plot, LC-ESI-Orbitrap-MS analysis. Panel A: colored according to myrtle berries parts. Panel B: colored according to geographic origin of samples.
The score scatter plot in Fig. 5A is colored according to the parts of fruit under analysis. There is clearly a differentiation of the samples based on this parameter: seeds are all grouped on the left part of the plot, peel & pulp and whole berry are distributed on the right part. In Fig. 5B the same scatter plot is displayed, colored according to the cultivar of samples (different cultivar is related to the different geographical origin of the seeds). By using this visualization mode, the peel and pulp appear as an important discriminator for samples of different cultivar and different geographic origin. Really, samples pertaining to the cultivar from the area of Sassari are on the right upper part of the plot while samples pertaining to the cultivar from the area of Cagliari are on the bottom right. However, this differentiation, mainly showed by peel and pulp samples is not present between the seeds, because all the samples are grouped in the same area. Thus, this is evidence that the metabolites that make the two cultivar different are the phenolic compounds, and principally anthocyanins and flavonoids, present in big amount specially in peel and pulp. In this study, these phenolic compounds appear to be marker compounds for geographic and genetic origin of myrtle berry.
An untargeted metabolomics approach together with the use of chemometric methods was developed for the discrimination of different cultivars of myrtle berry, whose seeds where collected from different geographic area of Sardinia and then grown in the experimental station of the University of Sassari located in Oristano (Sardinia Italy). For the first time methanolic extracts of different parts of myrtle berries were analyzed through liquid chromatography coupled with high resolution mass spectrometry. The study of metabolite profiling using liquid chromatography combined with high resolution mass spectrometry (LC-ESI-Orbitrap-MS) has proved to be a powerful tool for discovering changes of composition in different fruit parts of Myrtus communis. Through LC-ESI-Orbitrap-MS analysis and MS/MS experiments, 35 compounds were tentatively characterized on the basis of their retention time, UV/Vis absorbance, MS spectra and MS fragmentation patterns and a new class of hydrolysable tannins was identified in these berries (mainly in seeds) for the first time.
Moreover, using a large scale metabolomics approach, in this work we confirm that, in the classification based on geographic origin of the Myrtus communis berries, metabolites present in the peel and pulp are represented mainly by polyphenolic compounds like antocyanins and flavonoids and are more influent then metabolites present in the seeds, mainly gallotannins derivatives. Thus, flavonoids and anthocyanins, mainly found in the peel and pulp of the myrtle berry are putative marker compounds related to cultivar developed by seeds from different geographic origin.
Conflict of interest
None to report.
Footnotes
Acknowledgments
This study was supported by a grant from the Autonomous Region of Sardinia; “Myrtle: genomics and metabolomics, an integrated approach to the industrial valorisation” CRP_60361_2012.