
Abstract
BACKGROUND:
Strawberries (Fragaria × ananassa Duch.), the most popular berries grown and consumed all over the world, have a unique composition of bioactive compounds, including polyphenols that determine the quality, nutritional value and sensorial properties of those fruits. The study has provided data suggesting that there are links between the presence of bioactive compounds in strawberry leaves and the presence of those compounds in strawberry fruit.
OBJECTIVE:
Newly released and standard June-bearing strawberry cultivars (Fragaria × ananassa Duch.) were analysed with the aim of evaluating the content of health-related compounds in the fruit and leaves.
RESULTS:
The cultivars ‘Clery’ and the newly released ‘Joly’ are promising due to high levels of bioactive compounds in their fruit. The antioxidant capacity (TEAC) of the leaves was about 15 times higher than the TEAC of the fruit. Total phenolic compounds (TPC) were an important factor influencing the TEAC values of the fruit (r = 0.86). No significant correlation was found between TPC and TEAC in the leaves. The highest levels of bioactive compounds (TPC) were observed in the cultivars ‘Selvik’, ‘Diana’ and ‘Clery’. In all of the analysed cultivars a high content of agrimoniin in the leaves was correlated with low TPC and TEAC values in the fruit. Additionally, the content of free ellagic acid in the leaves showed a good correlation with the cinnamic acid derivative and ferulic acid hexose derivative in the fruit.
CONCLUSIONS:
The measurement of the content of agrimoniin and free ellagic acid in strawberry leaves could help breeders to identify cultivars with a high antioxidant capacity and a high content of TPC, cinnamic acid derivatives and ferulic acid hexose derivatives in the fruit without waiting until fructification. The paper discusses this innovative conceptual approach to increasing breeding efficiency.
Introduction
Strawberries (Fragaria × ananassa Duch.) are among the most popular berries grown and consumed all over the world. The scale of their production reflects their strong economic and commercial role in fruit industry. A strong link has been established between the consumption of strawberries and health, which is attributable to the confirmed anti-cancerogenic, anti-inflammatory and anti-neurodegenerative properties of strawberries [1, 2]. These health-promoting properties are a result of a unique composition of bioactive compounds, including polyphenols, which are characterised by a strong antioxidant and anti-proliferative activity [3, 4]. The presence of these components determines the quality, nutritional value and sensorial properties of strawberries [5]. Their presence and quantity have been used as markers allowing the distinction between cultivars [6] and the description of diverse processing types [7–9]. Strawberry fruit may vary in terms of the composition of polyphenols depending on cultivar, growing conditions, growing methods, and degree of ripeness [10]. The dominant group of polyphenols in strawberry fruit are anthocyanins with pelargonidin-3-glucoside being the major one [11]. Their quantification is important to breeders because it enables them to evaluate the nutritional value of the fruit at maturity [12]. Another important group of compounds present in strawberries are flavonols with quercetin and kaempferol glucosides and glucuronides being the dominant representatives [13]. Additionally, strawberries are an excellent source of ellagic acid [14], and together with raspberries and blackberries they are the main sources of this bioactive compound in human diet [15].
Various parts of the strawberry plant have been studied for the presence of TPC and for antioxidant capacity. They include achenes [13] as well as those parts of the strawberry plant, that are inedible or not used for eating, such as rhizomes and leaves [16]. Wang and Lin [17] found that young leaves of strawberries were richer in polyphenolic compounds than fruit flesh or old leaves, which was also reflected in antioxidant capacity measured by the ORAC method. During an analysis of total ellagic acid in strawberry plants the highest content of this polyphenolic compound was observed in strawberry leaves, followed by achenes and fruit flesh [18]. Nevertheless, there are still very few data showing the link between the content of bioactive compounds in strawberry leaves and the content of bioactive compounds in strawberry fruit. Such information could be valuable for breeders as the level of bioactive compounds in leaves might serve as an indicator helping them, at a very early stage of the selection process, to identify plants that would later yield fruit rich in bioactive compounds.
The aim of this study was to compare some newly released and standard, not yet studied, June-bearing strawberry cultivars in terms of the content of health-related compounds in fruit and leaves. Secondly, the links between the concentration of the bioactive compounds and the antioxidant capacity in fruit and leaves was analysed. Finally, the relationship between the bioactive compounds present in leaves and those present in fruit was evaluated.
Material and methods
Chemicals
All solvents used were of analytical grade. Folin-Ciocalteu’s phenol reagent and 2,2’-azino-bis(3-ethylbenzthiazoline-6-sulphonic acid) (ABTS) were obtained from Sigma-Aldrich (Switzerland). Gallic acid and pelargonidin-3-glucoside were provided by Fluka (Germany). Acetic and hydrochloric acids were purchased from Pancreac (Pancreac Quimica SA, Spain). Trolox was supplied by Acros Organics (Thermo Fisher Scientific, Geel, Belgium). Sodium carbonate was obtained from Carlo Erba Reagents SA (Val de Reuil, France). All other solvents and chemicals were received from Merck (Darmstadt, Germany).
Material
Six strawberry cultivars classified as newly released: ‘Joly’ (CIV, Italy), ‘Lucy’ (East Malling, Great Britain), ‘Selvik’ (Research Institute of Pomology and Floriculture in Skierniewice, Poland) and ‘Diana’ (Darbonne, France) and two standard ones: ‘Clery’ (CIV, Italy) and ‘Darselect’ (Darbonne, France) were analysed. A+ frigo plants from these 6 cultivars were planted on 30 June 2009 in Conthey (480 m.a.s.l.) on soil with medium loam. Plants were planted on raised beds covered with black plastic mulch at a density of 4 plants per m2. The distance between the raised beds was set at 1.25 m and the strawberries were planted in one row at a distance of 0.2 m between plants. For each cultivar four replications of twenty five plants were examined. Water and nutrients were supplied by drip irrigation at a flow of 1 l/h with emitters spaced 0.2 m apart (T Tape, T systems, USA). Nutrients were applied once a week during the growing period based on the recommendations for strawberries with a yield of 2 kg/m2 (total nutrients applied: 100 N, 15 P, 50 K and 20 Mg kg/ha). Vacuum gauge tensiometers (Irrometer Co., Riverside, USA) were used to schedule irrigation at 200 hPa measured at 0.2 m soil depth in the middle of the raised beds below the drip tube. A plastic tunnel was raised up at the beginning of March 2010. Phytosanitary treatment was performed according the Swiss Integrated Production System [19] to control spider mites, powdery mildew and grey mould.
Leaves of the different cultivars were collected at the beginning of May 2010, at full bloom for most of the cultivars. 12 leaves per replication, the latest fully developed leaf per plant, were taken. Strawberry fruits were harvested three times a week. At each harvest the yield of marketable and excluded fruit was recorded for the whole plot and the average fruit weight was measured by weighing 25 marketable strawberries (bigger than 25 mm in diameter and not malformed). Samples for the phytochemical analysis were taken 10 to 14 days after the first harvest when fully red. The samples were prepared for further analysis as described by Tulipani et al. [5]. Subsequently, within three hours following harvesting, the samples (whole fruit) were stored at –20°C for about one month.
Sample preparation
The leaves were dipped in liquid nitrogen and milled (Retsch, SM-100 using a sieve ø 1.0 mm, Haan, Germany). The fruits were smashed and fresh puree was directly transferred into plastic tubes and stored at –18°C until further analysis.
Samples were extracted using an Accelerated Solvent Extraction system (ASE® 350, Dionex Corporation, Sunnyvale, California, USA). The application of this fully automated technique allowed a reduction in the number of extraction stages, which considerably shortened the sample preparation process. The possibility to simultaneously regulate the pressure and temperature during the extraction process ensured the repeatability of the extracts and allowed the exclusion of manual mistakes during the extract preparation. Exactly 1 g of liquid-nitrogen milled leaves or 2 g of strawberry fruit puree were mixed with 2 g of bulk (Isolute HM-N, 9800–1000, Biotage, Uppsala, Sweden). The samples were placed into 11 mL stainless steel extraction cells. Each cell was locked with a screw cap equipped with a circular microfiber filter 19.8 mm in diameter (Dionex). Solvents used for extraction were 80% methanol (1/4, v/v) and 1% formic acid. The following conditions were applied for the extraction: pressure 100 bar; temperature 40°C; preheat 0 min; heat 5 min; static time 9 min; flush volume 100%; purge 60 s; cycles 1; cell volume 11 mL. Freshly prepared extracts after filtration by 0.45 μm filters were subjected to analyses.
Methods
Water content and firmness
Moisture content in strawberry fruit was estimated using a Halogen Moisture analyzer (Mettler, Toledo). The presented data are expressed as % of water.
Fruit firmness was determined with a hand-penetrometer (Durofel 50) on 20 strawberries (2 measurements per each fruit) for each sample.
Total soluble solids (TSS) and titratable acidity (TA)
TSS and TA were measured on the thawed fruit samples after extracting the juice with a commercial Juice Master (Hapag, Switzerland). TSS expressed as % Brix was analysed with a refractometer (Atago, PR-1, Kunzmann, Switzerland) and TA by titration of 10 g of clear fruit juice with NaOH 0.1 mol/L until a pH of 8.2 with an automated titrator (Titrino DMP 785, Metrohm AG, Switzerland). The result was expressed in g of citric acid equivalent per 100 g juice.
Gradient RP-HPLC profile
Polyphenols and anthocyanins were separated on HPLC using an Agilent 1200 series System equipped with a DAD, auto sampler (G1329A) and a pump (Quat G1311A). A RP-C18 Luna 5 μm 100 Å (250×4.6 mm, Phenomenex, Torrance, USA) column was used for the separation of sample components. The injection volume was 50 μL and the flow rate was 0.6 mL/min. The mobile phase consisted of water (A), acetonitrile (B) and 1% formic acid in water (C). The gradient elution was as follows: 10% (B) and 10% (C) at 0–10 min, 18% (B) and 10% (C) at 10–15 min, 18–25% (B) and 10% (C) at 15–30 min, 25–85% (B) and 10% (C) at 30–31 min, 85% (B) and 10% (C) at 31–40 min. Polyphenols were detected at 260 and 360 nm, whereas anthocyaninsat 500 nm.
A HPLC-MS was performed on a mass spectrometer with a LCQ Deca detector (Thermo Scientific Inc., Massachusetts, USA) with electrospray ionization (ESI) in MS mode from m/z 100 to 2000. MS was acquired in both positive and negative modes, the capillary temperature was set at 275°C, the capillary voltage at 8 V (positive) and – 15 V (negative), the sheath gas pressure at 80 units/min, whereas the auxiliary gas flow at 20 units/min. The source voltage was set at 5 kV.
Total phenolic compounds (TPC)
The content of TPC was determined using microplates, following the Folin-Ciocalteu colorimetric method according to Siriwoharn et al. [20] and modified by Horszwald and Andlauer [21]. Aliquots of 15 μL of appropriately diluted samples were placed into microplate wells and 240 μL of Folin-Ciocalteu Phenol reagent (previously diluted with water: 1+14, v/v) was added using an injector. The mixture was incubated in the dark for 10 min at ambient temperature. Next, 15 μL of 20% sodium carbonate was added to each well and the microplate was automatically shaken before readings were taken. The absorbance was measured at λ= 755 nm on an Infinite M200 Pro Multimode Microplate Reader (Tecan GmbH, Austria). Results were expressed as mg of gallic acid equivalent (GAE) per 100 g of fresh matter (FM). Each analysis of phenolic compounds in the extracts was performed in triplicate.
Total monomeric anthocyanins content (TMA)
The content of total monomeric anthocyanins (TMA) in extracts was determined according to Giusti and Wrolstad [22]. Extracts were diluted with two buffer solutions at pH 1 and 4.5. Pelargonidin-3-glucoside was used as a standard with a molar absorptivity coefficient of 17330. The results were expressed as mg of pelargonidin-3-glucoside per 100 g FM. The analyses of TMA in the extracts were performed in triplicate.
TEAC (Trolox Equivalent Antioxidant Capacity) by ABTS
The Trolox Equivalent Antioxidant Capacity (TEAC) assay was performed as described by Re et al. [23] and Silva et al. [24] with some modifications. Aliquots of a 10 μl sample were placed into the microplate wells following the addition of 290 μl of ABTS• + solution using the microplate reader’s injector. The reaction was performed at 30°C in the dark during 6 min. After this time, the values of absorbance were recorded at 734 nm. The results were expressed as μmol Trolox equivalents (TE) per 100 g of FM.
Experimental design and statistical analysis
The experimental design was a randomised complete block design with four field replications. For each variety, fruits and leaves were collected from following fields and were subjected to triplicate extraction considered as repeated measurement. In order to assess the equality of variances in different field replications, the data were submitted to the Levene’s test. In the case when the assumptions for variables had been met, the data were subjected to a parametric analysis of variance (one-way ANOVA) in order to establish if the content of the selected bioactive compounds in the fruit and leaves varied among the analysed fields. All statistical analyses indicated no significant differences between the content of selected bioactive compounds in the fruit and leaf samples gathered from the four different field replications. For the rest of variables, the non-parametric version of the ANOVA test (Kruskal-Wallis’ test) was applied.
All statistical analyses were performed using Statistica (version 8, USA) apart from the Principal Component Analysis, which was carried out using Fizz (version 2.46 B, France).
Results and discussion
Yield and quality parameters of fruits
The yield and taste related quality parameters were significantly affected by the genotype (Table 1). ‘Selvik’ produced the highest fruit yield whereas ‘Diana’ the lowest. A strong influence of the cultivar on fruit yield was described previously [25]. Water content was similar in all the six cultivars. According to the literature, water content is not strongly affected by the strawberry genotype [5]. Taste as a quality feature can be evaluated by measuring TSS and TA [26]. The highest TSS value was noted for Joly. The TSS values identified in the analysed cultivars were comparable to those obtained in other studies [6, 28]. In addition, according to the statistical analysis the highest TA values were recorded for ‘Diana’ followed by ‘Joly’. The statistical analysis of the firmness of the strawberries showed that ‘Joly’, Lucy and Clery have the softest, whereas ‘Darselect’ the firmest fruit. These results were consistent with empirical observations.
Yield and quality parameters of strawberry fruits (mean±SD, 4 field repetitions)
Yield and quality parameters of strawberry fruits (mean±SD, 4 field repetitions)
a,b,c – means in the columns with the same letter are not significantly different (p < 0.05). 1 – expressed as g citric acid/100 g of fresh juice.
The phenolic compounds in the extracts of the fruit and leaves were identified on the basis of UV-Vis and MS records as well as by comparison with the literature data [3, 30]. The representative examples of HPLC profiles are shown in Figs. 1 and 2. In agreement with Aaby et al. [29], most phenolics present in strawberries absorb at 260 nm, providing non-specific chromatograms. In fruit extracts, peaks F1 – F4 were confirmed as ellagic acid equivalent based on a single quadrupole MS analysis due to the characteristic fragmentation [M-H]- at m/z 301. Peak 5 was identified as a cinnamic acid derivative.
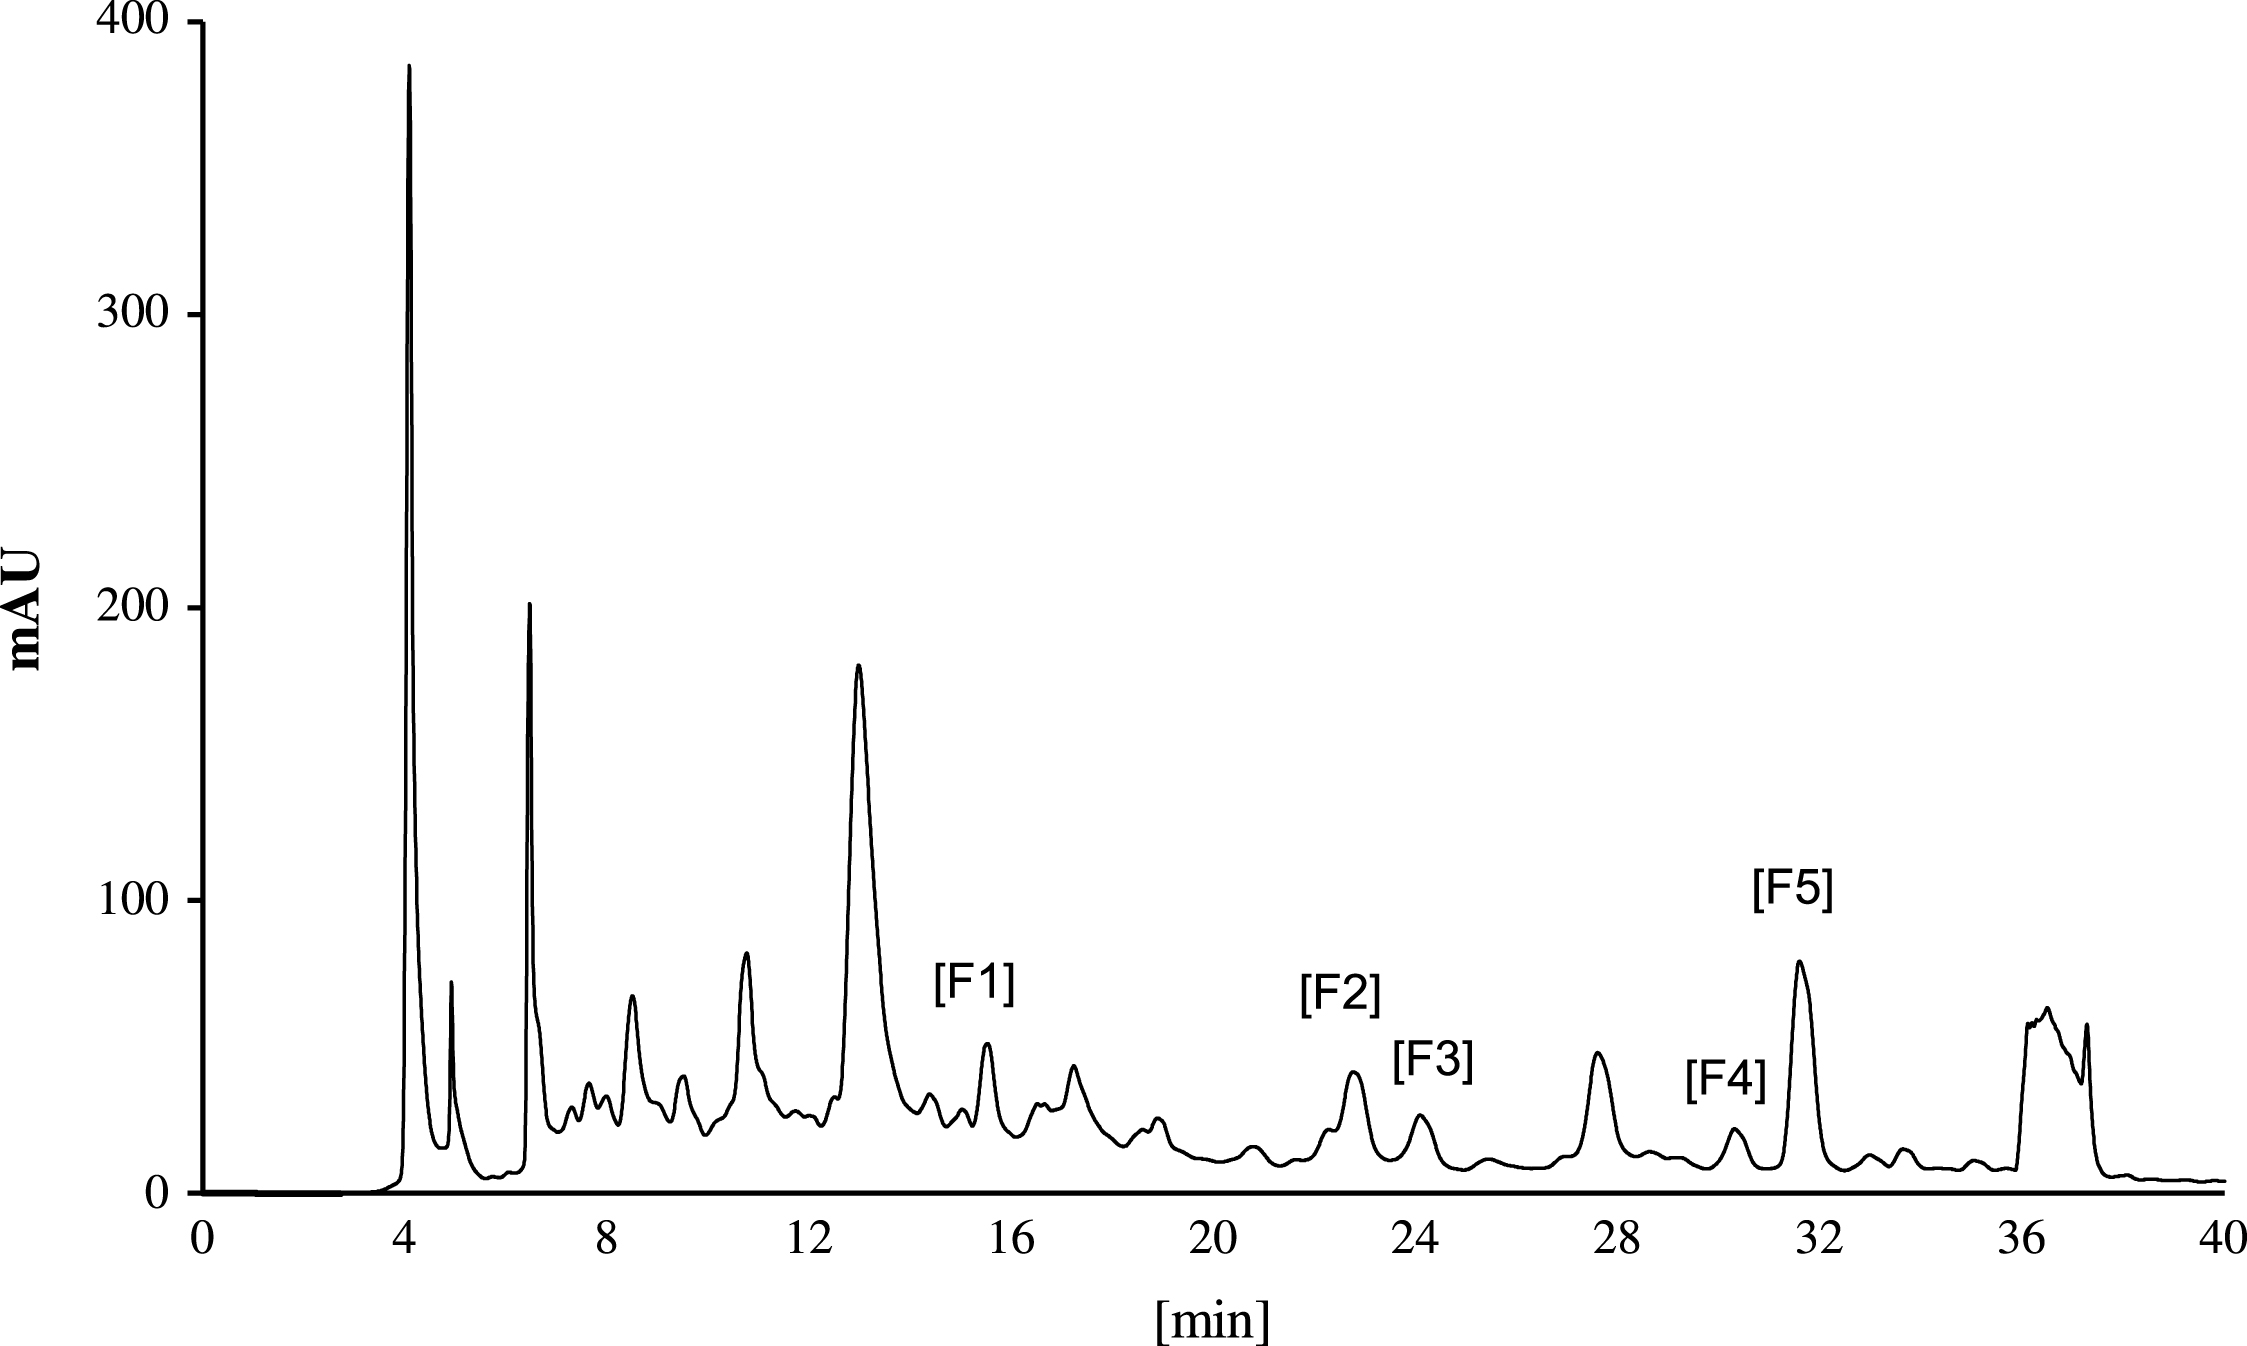
HPLC UV-profile (λ= 260 nm) of polyphenolic compounds from a Joly fruit extract. Ellagic acid derivatives [F1 – F4], cinnamic acid derivative [F5].
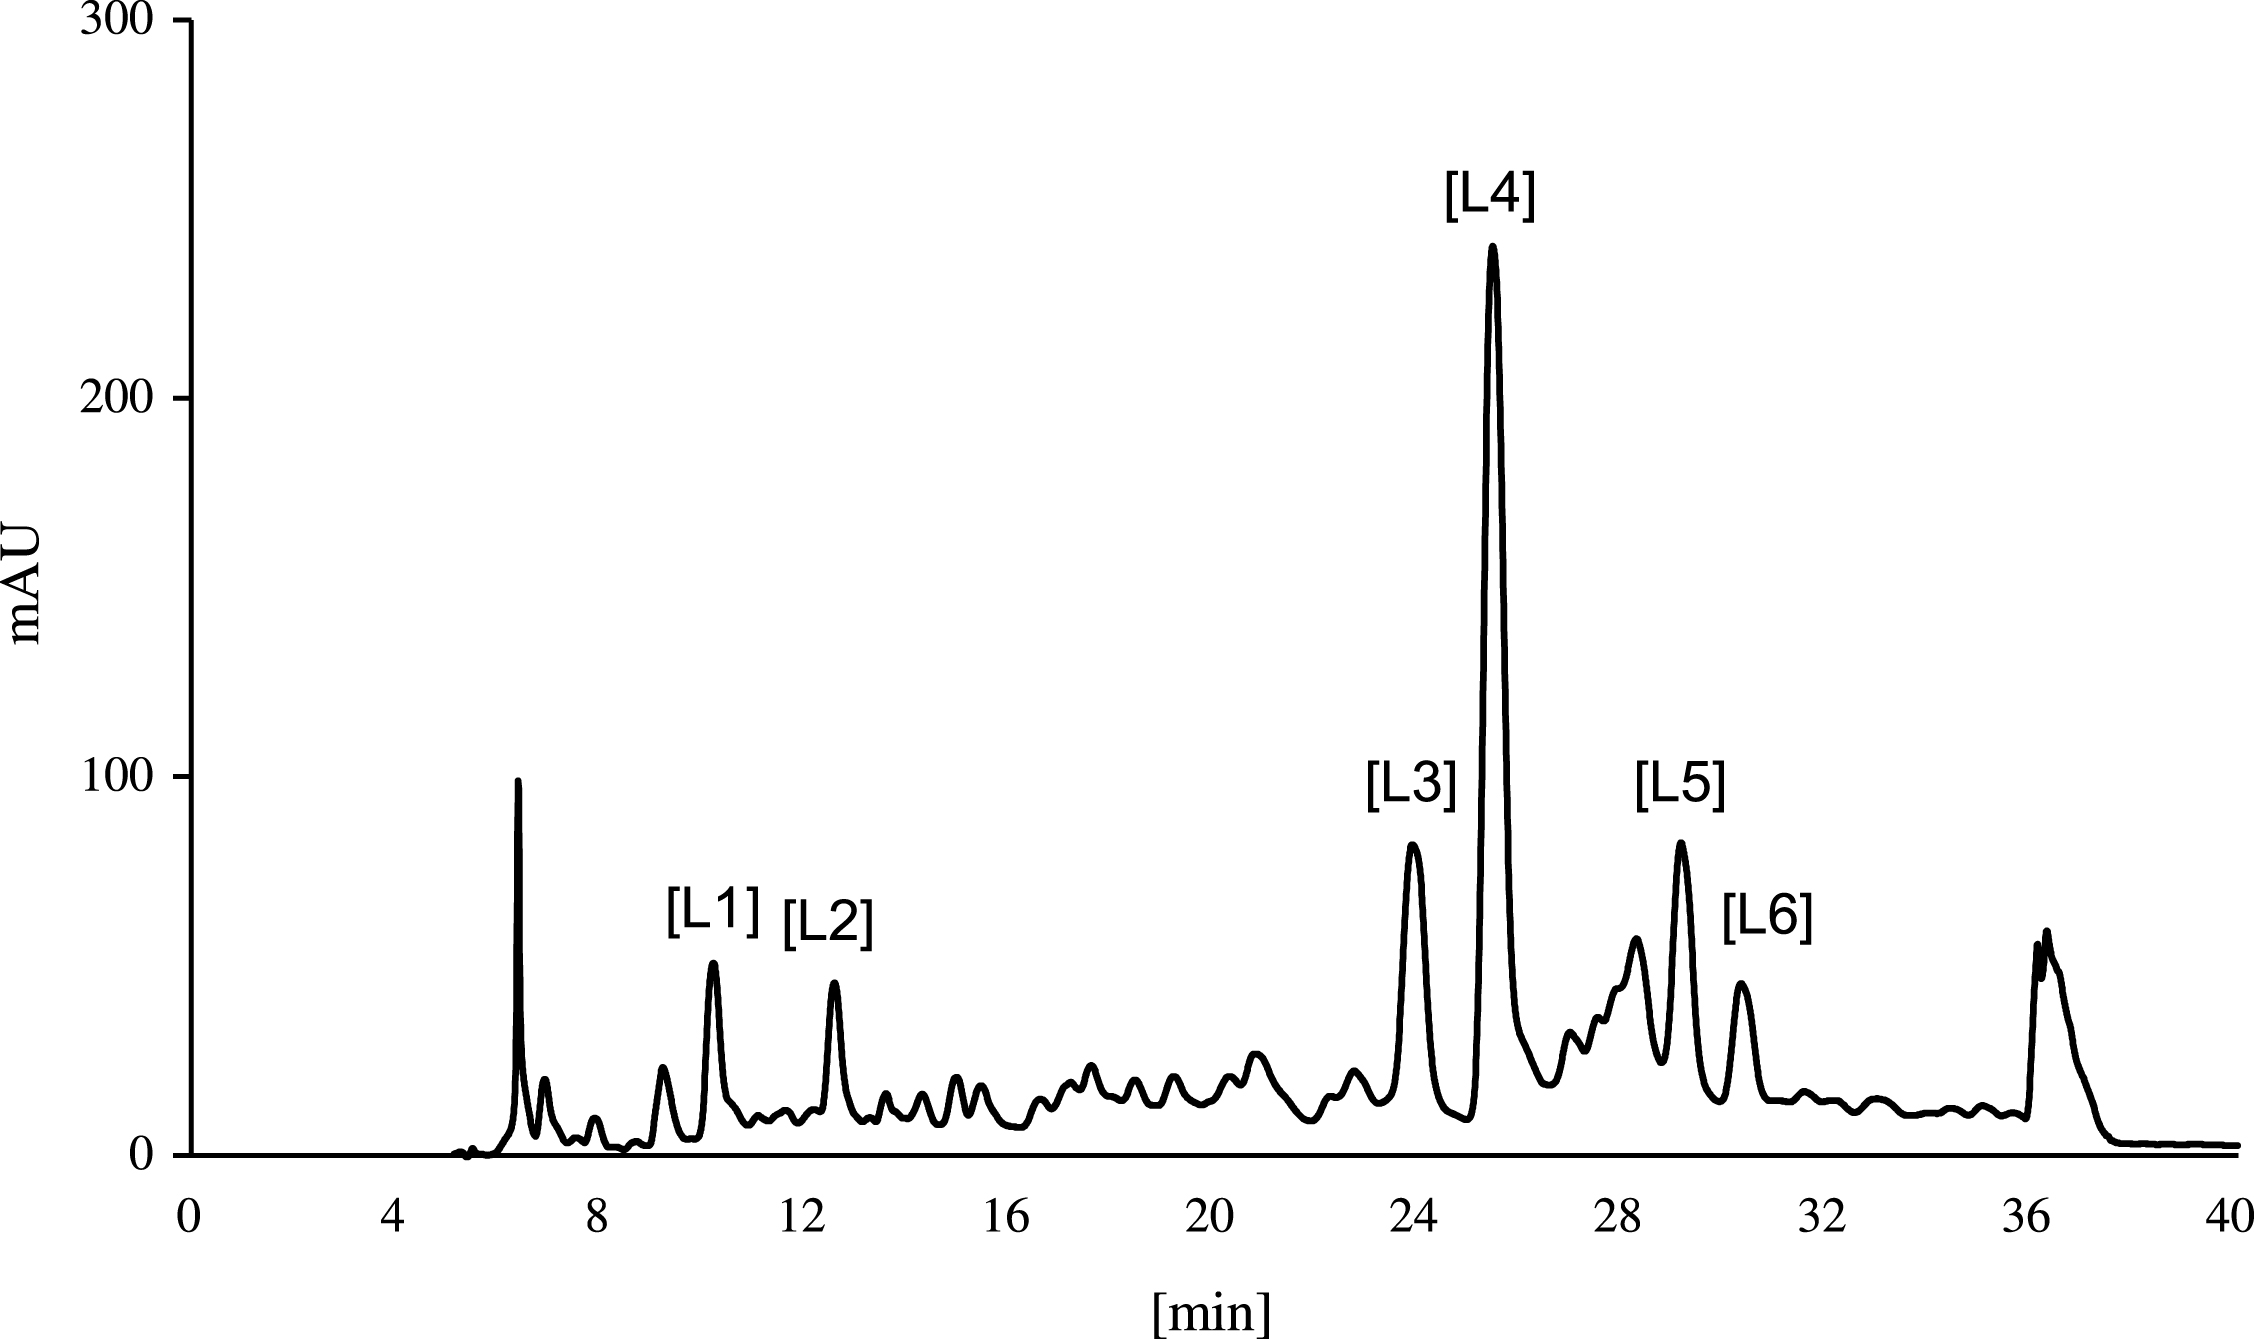
HPLC UV-profile (λ= 260 nm) of polyphenolic compounds from a Joly leaf extract. Bis-HHDP-glucose isomers [L1 – L2], rutin [L3], agrimoniin derivate [L4], kaempferol-coumaroyl [L5], quercetin-3-glucuronide [L6].
Apparently, the chromatograms of fruit and leaf differ strongly. In the leaves peak L1 and L2 were identified as bis-hexahydroxydiphenoyl-glucose (bis-HHDP-glucose), as previously described by Aaby et al. [30]. Rutin (L3) was detected in all the varieties. In agreement with Oertel et al. [31] and Simirgiotis et al. [16], the dominant compound present in strawberry leaf extracts was agrimoniin (isomer of an galloyl-bis-HHDP glucose dimer, peak L4). Furthermore, peak L5 was identified as kaempferol-coumaroyl and was previously reported in strawberries [32]. Additionally, in accordance with the results of Simirgiotis et al. [16], quercetin-3-glucuronide was detected and named as peak L6.
Fruits
The lowest TPC in strawberry fruit was noted for ‘Lucy’ (79.13 mg GAE/100 g FM) whereas the highest TPC was observed for ‘Darselect’ fruit (119.00 mg GAE/100 g FM) (Fig. 3). The levels were in agreement with the results obtained by Tulipani et al. [5] and Pineli et al. [28]. Differences among the analysed cultivars can be explained by those cultivars’ genetic background [33].
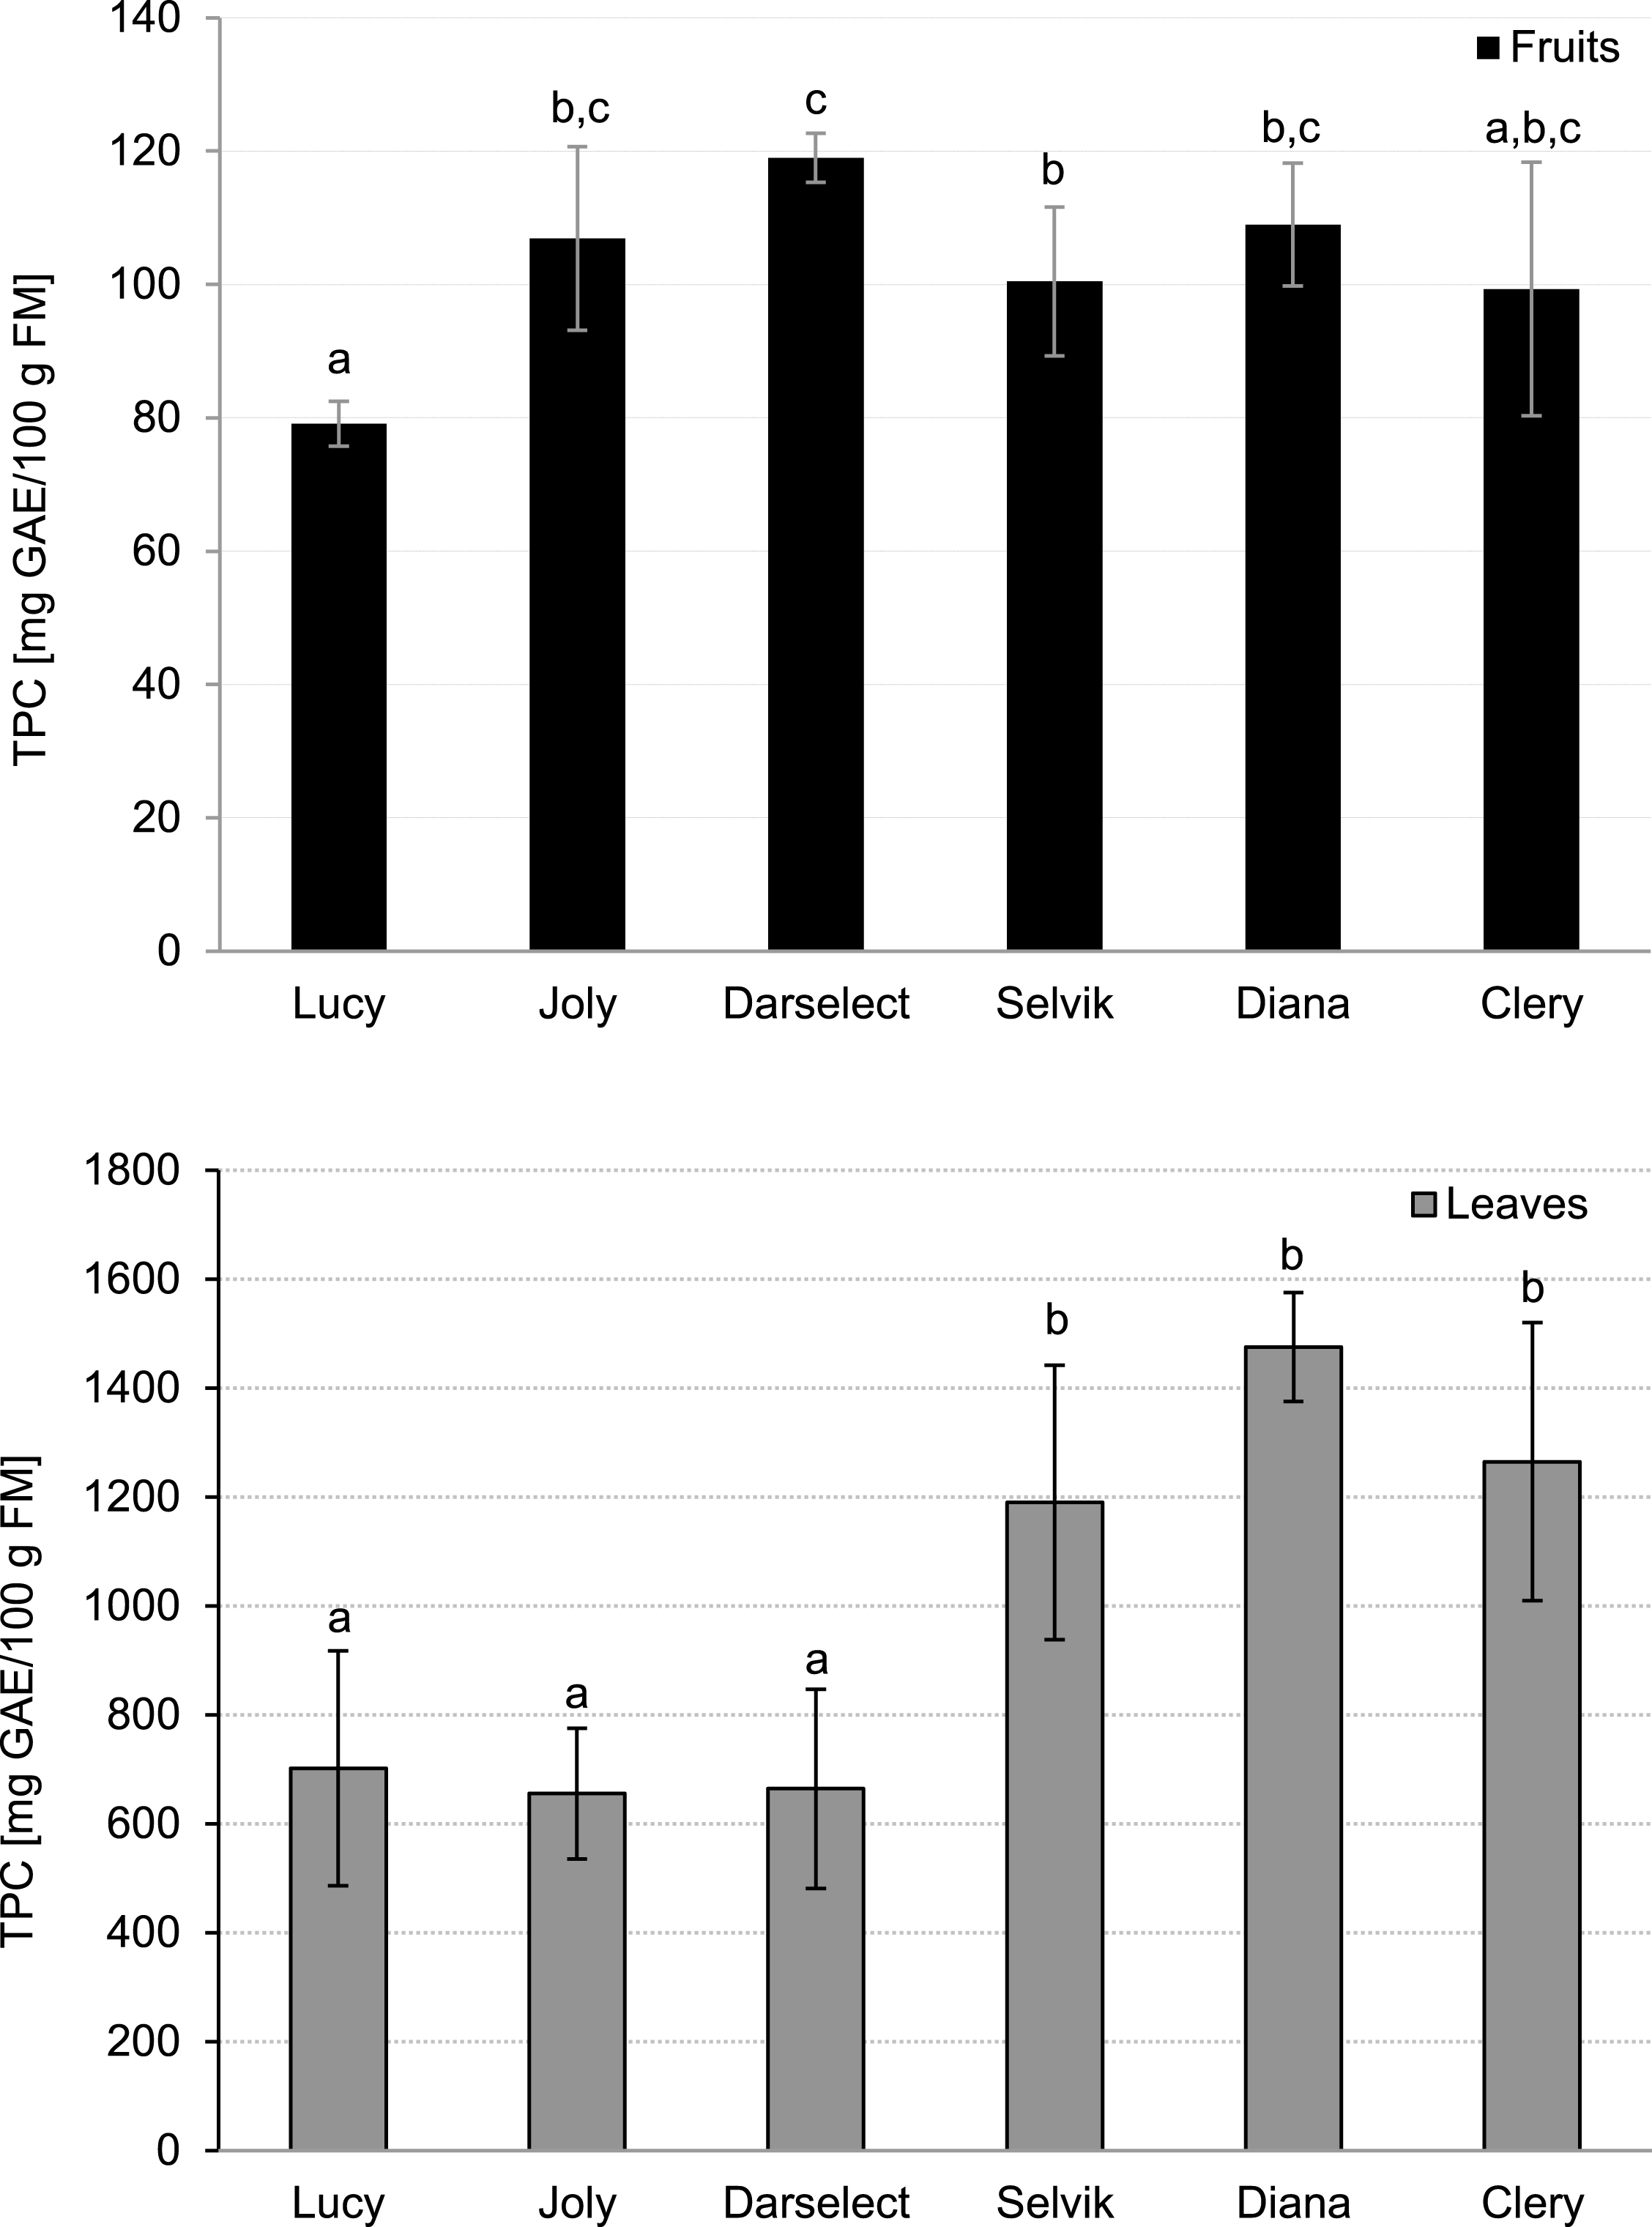
Total phenolic compounds in strawberry fruits and leaves (mean±SD, 4 field repetitions analysed in triplicate).
The TEAC values, which show the ability of the samples to scavenge ABTS+• radical cation (TEAC), are shown in Fig. 4. Similarly to TPC in the fruit, the lowest TEAC value was recorded for ‘Lucy’ (16.3 μmol Trolox/100 g FM) whereas the highest TEAC was noted for ‘Darselect’ (29.1 μmol Trolox/100 g FM).
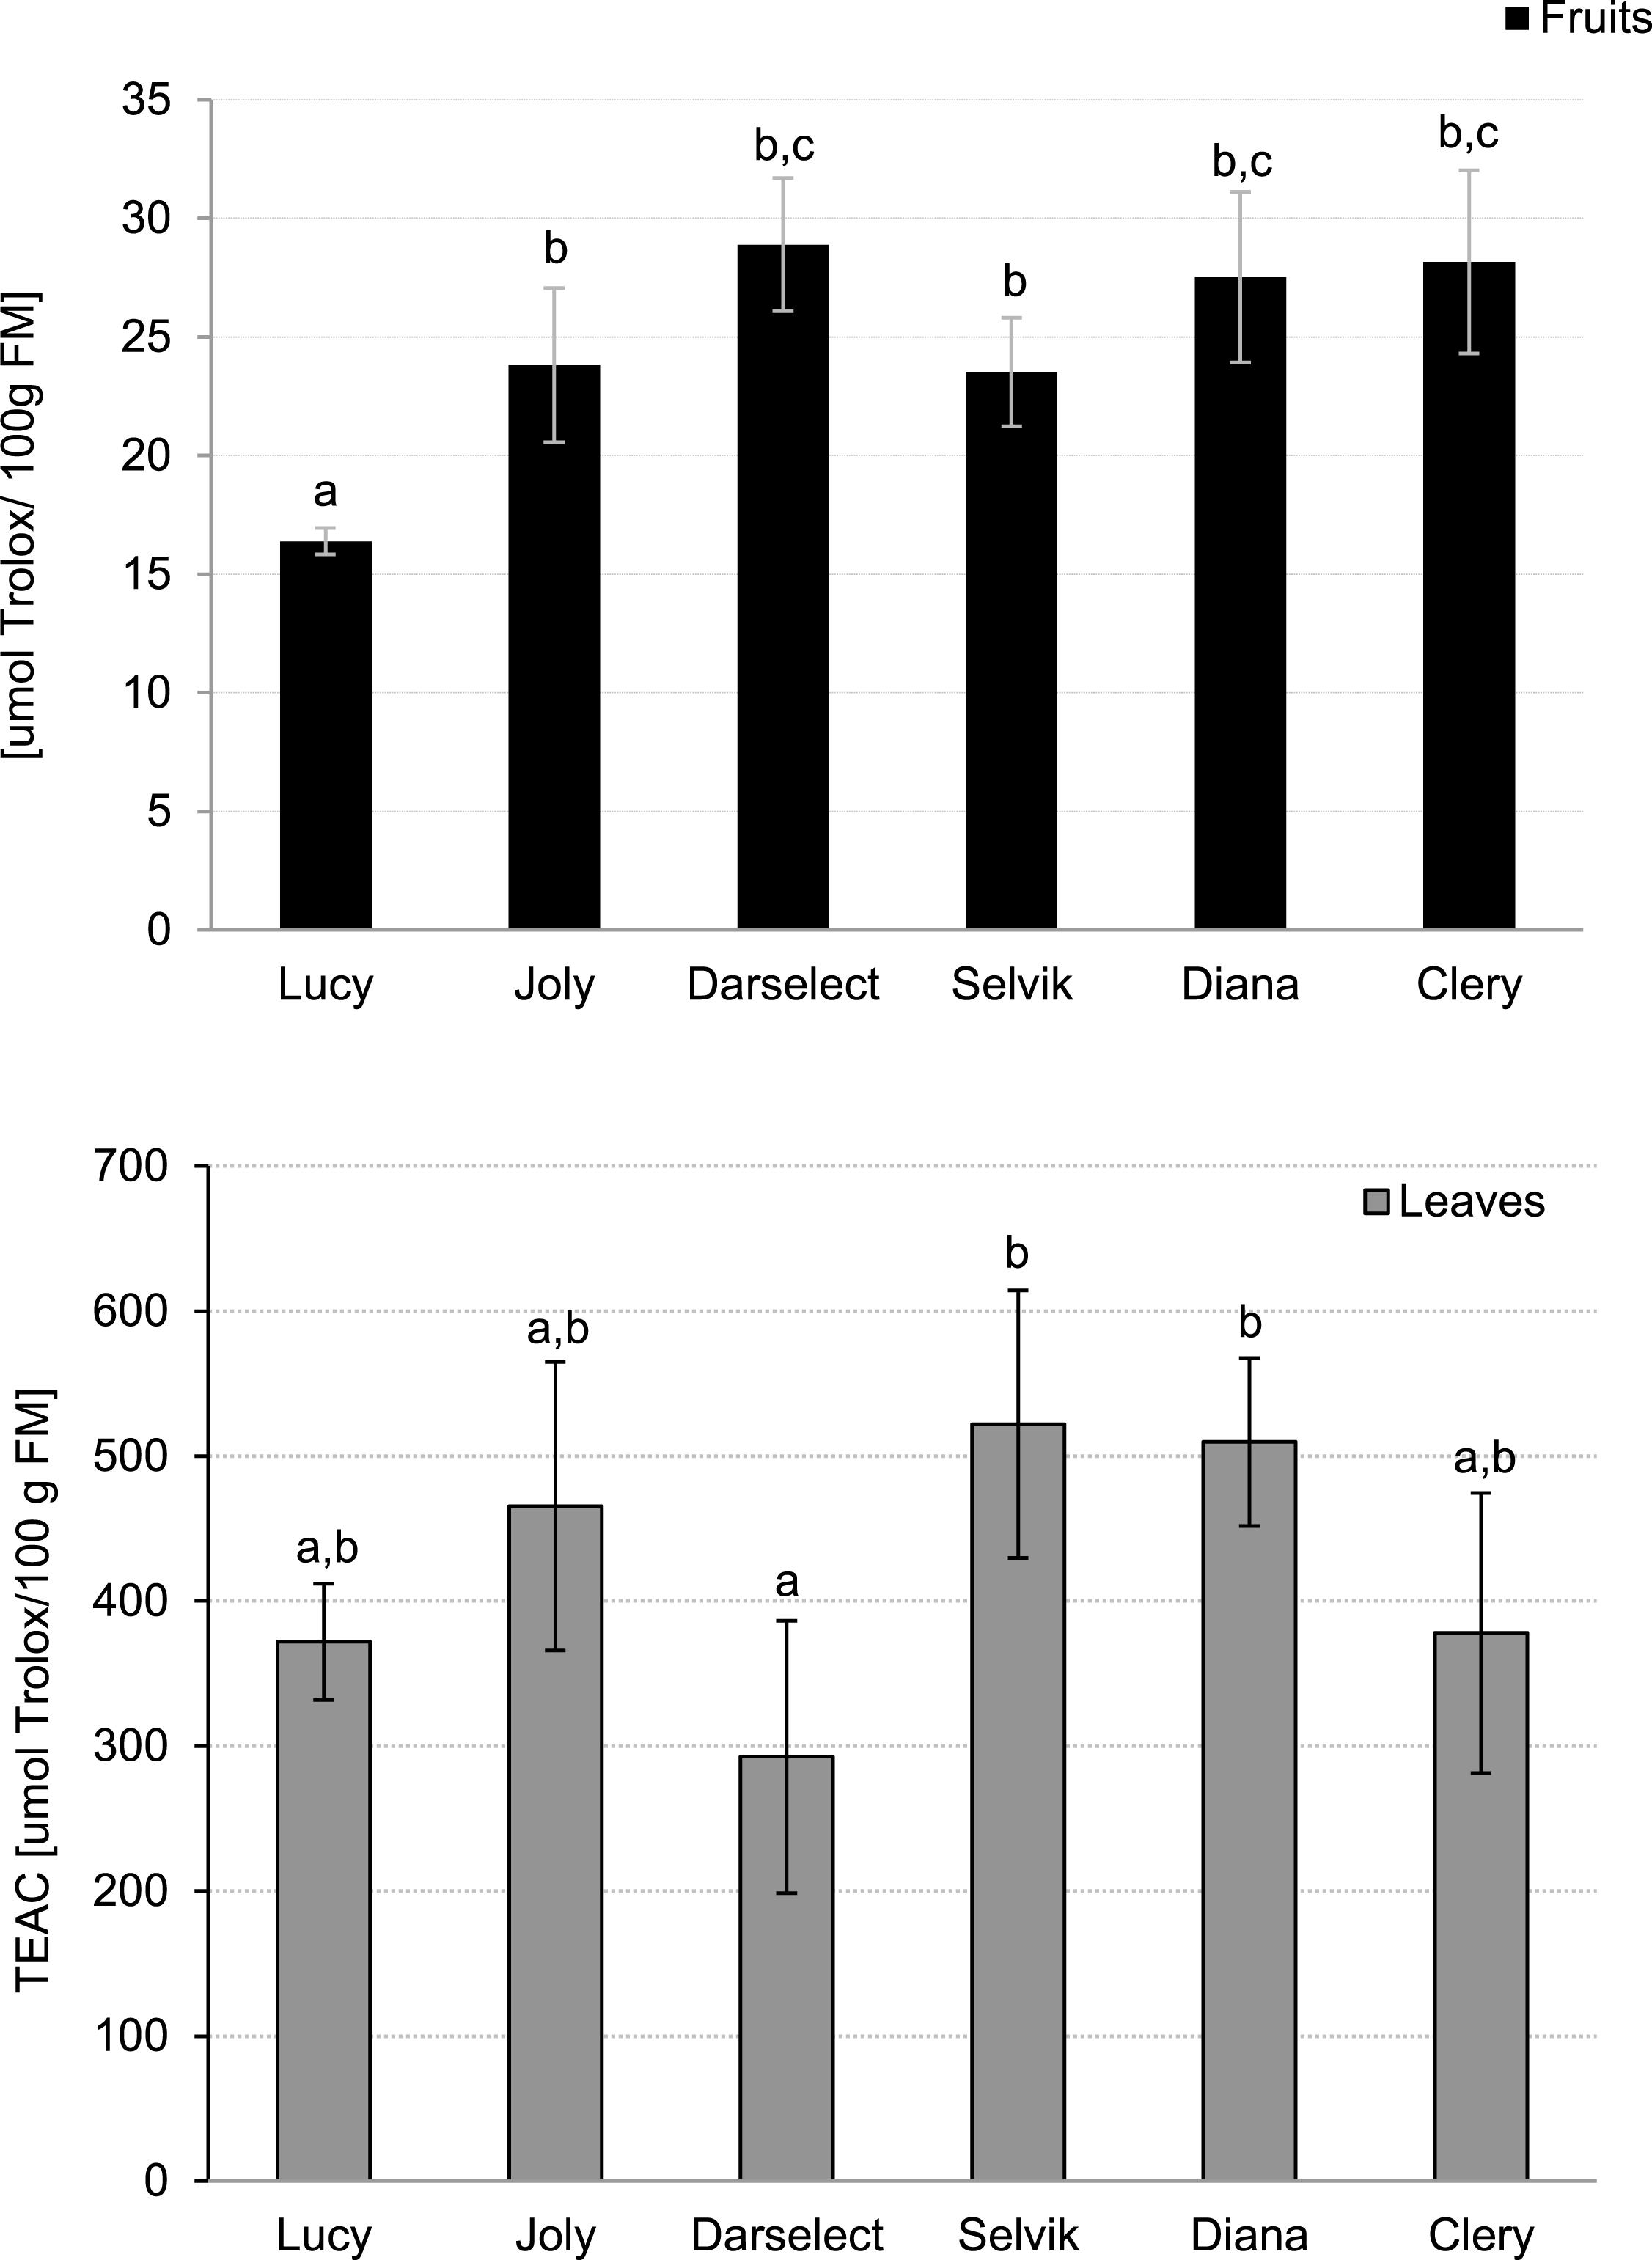
Trolox Equivalent Antioxidant Capacity of strawberry fruits and leaves (mean±SD, 4 field repetitions analysed in triplicate)
The varietal differences in the content of polyphenolic compounds in the fruit are indicated in Table 2. The concentration of total monomeric anthocyanins (7.3 – 12.4 mg pelargonidin-3-glucoside/100 g FM) corresponded to the data described in the literature for other cultivars [6, 28]. The authors quantified them at a level of 1.8–29.3 mg/100 g FM depending on the ripeness stage and from 13 to 55 mg/100 g FM depending on the cultivar. In the current study, the highest TMA concentration was observed for ‘Joly’, which was 1.5 times higher compared to the average TMA value of the other varieties. This observation confirmed the previously reported statement that the TMA content in strawberries strongly depends on the genotype [5]. The pH-differentiation method is based on the reversible structural transformation of anthocyanins, while the change in pH is manifested in different absorbance spectra [22]. The values obtained are influenced not only by the total anthocyanins content but also by the presence of polymerized degraded pigments and other possible interfering compounds. Therefore, an additional quantification of dominant individual compounds like pelargonidin-3-glucoside and pelargonidin-3-malonylglucoside was performed (Table 2). As previously noted, pelargonidin-3-glucoside was the most abundant anthocyanin present in the strawberry fruit followed by pelargonidin-3-malonylglucoside[13, 32]. The obtained data were within the range reported by Crespo et al. [9]. The highest content of pelargonidin-3-glucoside was noted for ‘Clery’ and ‘Selvik’ whereas the content of this compound was approx. 18% lower in ‘Lucy’, ‘Joly’, ‘Darselect’ and ‘Diana’. Similarly, the highest content of pelargonidin-3-malonylglucoside was observed in ‘Clery’, being 1.8 times higher when compared to ‘Lucy’.
Concentration (mg/100 g FM) of polyphenolic compounds present in strawberry fruits
a,b,c,d,e – means in the columns with the same letter are not significantly different (p < 0.05). 1,2 – expressed as pelargonidin-3-glucoside/100 g FM recorded at 500 nm. 3 – expressed as ellagic acid equivalent, recorded at 260 nm. 4,5 – expressed as ellagic acid equivalent, recorded at 360 nm.
Further characterisation of the strawberry fruit also showed varietal differences in the concentration of other phenolic compounds. Due to the lack of standard compounds, the cinnamic acid derivative, ferulic acid hexose derivative and quercetin-3-glucoside were quantified as ellagic acid and indicated as ellagic acid equivalents. In accordance to Aaby et al. [30] the presence of cinnamic acid derivatives was noted for all the analysed fruit. Low varietal differences among berries were noticed with the exception of ‘Selvik’, which contained almost double the concentration. As for the ferulic acid hexose derivative, which was also identified in strawberries by Aaby et al. [30], the highest content was observed for ‘Clery’. Quercetin-3-glucuronide, previously reported in strawberry [3, 29], was detected in all the examined cultivars, and its concentration was comparable across the analysed varieties, with ‘Joly’ having slightly higher content.
The TPC content in the leaves was within the range of 644 up to 1476 mg GAE/100 g FW (Fig. 3). The analysed varieties can be divided into two groups: ‘Selvik’, ‘Diana’ and ‘Clery’ had significantly higher TPC as compared to ‘Darselect’, ‘Joly’ and ‘Lucy’.
The lowest ability to scavenge the ABTS• + radical cation was observed for ‘Darselect’ (292.5 μmol Trolox/100 g FM), which was similar to the value obtained for the fruit. The highest value was recorded for ‘Selvik’ being about 1.8 times higher when compared to ‘Darselect’ (Fig. 4).
No anthocyanins were identified in the leaves of the analysed varieties. A similar observation was made with regard to the leaves of the white strawberry by Simirgiotis et al. [16]. Furthermore, agrimoniin considered as a major compound present in the leaves of the red strawberry [31, 34], was at a similar level in almost all the varieties under study. The exception was ‘Darselect’, which contained approximately 1/3 less agrimoniin than the average content identified in the others (Table 3). Maas et al. [18] highlighted the importance of another phenolic compound, that is, free ellagic acid, present in strawberry leaves. The authors found that its concentration was higher in the leaves than in the fruit and achenes. The results obtained in the above study were within the range reported for selected Polish cultivars [35]. In the present study the highest content of free ellagic acid was found in ‘Selvik’, which was approximately 40% higher when compared to the average value obtained for the rest of the varieties examined. However, the highest concentration of ellagic acid derivatives was determined for ‘Clery’. The content of kaempferol-coumaroyl previously identified in strawberry leaves by Simirgiotis et al. [16] differed among varieties [36]. As with the TPC content, the cultivars analysed in this study can be divided into two groups: the first group containing a high amount of kaempferol-coumaroyl in the leaves includes ‘Darselect’, the richest one, ‘Joly’ and ‘Lucy’. This group’s average values were 4.2–fold higher when compared to the second group (‘Selvik’, ‘Diana’ and ‘Clery’). On the other hand, the cultivars ‘Selvik’, ‘Diana’ and ‘Clery’ had almost a two times higher average concentration of rutin when compared to the rest of the analysed cultivars.
Concentration (mg/100 g FM) of polyphenolic compounds present in strawberry leaves
Concentration (mg/100 g FM) of polyphenolic compounds present in strawberry leaves
a,b,c,d,e – means in the columns with the same letter are not significantly different (p < 0.05). 1 – expressed as ellagic acid equivalent recorded at 260 nm. 2,3,4,5 – expressed as ellagic acid equivalent, recorded at 360 nm.
Principal component analysis
The Principal Component Analysis (PCA) was used to interpret the major patterns of variation between the content of the selected bioactives present in the fruit and leaves. PCA was performed for all 72 samples prepared from the six cultivars with 4 field replications each and fruit and leaves extracts prepared in triplicates. The analysis was performed using a correlation matrix due to a difference in data units (data not shown). The PCA method was used to provide information about a link between the content of the selected phenolic compounds in and the antioxidant capacity of the fruit and the content of those compounds in and the antioxidant capacity of the leaves of the analysed six cultivars. Two main principal components (PCs) were selected giving 63.9% of total data variability. The projection of the data points ascribed to the cultivars, selected polyphenols and antioxidant capacity on the charts reflects similarities and dissimilarities among them (Fig. 5). PC 1 (42.2%) and PC 2 (21.7%) were well represented by the variables: agrimoniin, free ellagic acid, kaempferol-coumaroyl, rutin, TPC and TEAC in the leaves, and cinnamic acid derivative, ferulic acid hexose derivative, TPC and TEAC in the fruit. As indicated on Fig. 5, ‘Diana’ and ‘Clery’ were located close to each other. ‘Selvik’ was located closer to ‘Diana’ and ‘Clery’ compared to the remaining ones, which indicates similarities among these three cultivars in terms of high TPC, free ellagic acid and rutin in the leaves as well as pelargonidin-3-glucoside and ferulic acid hexose derivative in the fruit. ‘Clery’ and ‘Diana’, unlike ‘Lucy’ and ‘Joly’, had the lowest content of TMA and quercetin in the fruit. The rest of the analysed cultivars were situated in different parts of the plot, which reflects differences between their characteristics. ‘Darselect’ was characterised by a high concentration of kaempferol-coumaroyl in the leaves and TPC and TEAC in the fruit and the lowest content of agrimoniin in the leaves. Thus, it can be concluded that the relationship between the compounds present in the fruit and those found in the leaves is cultivar specific.
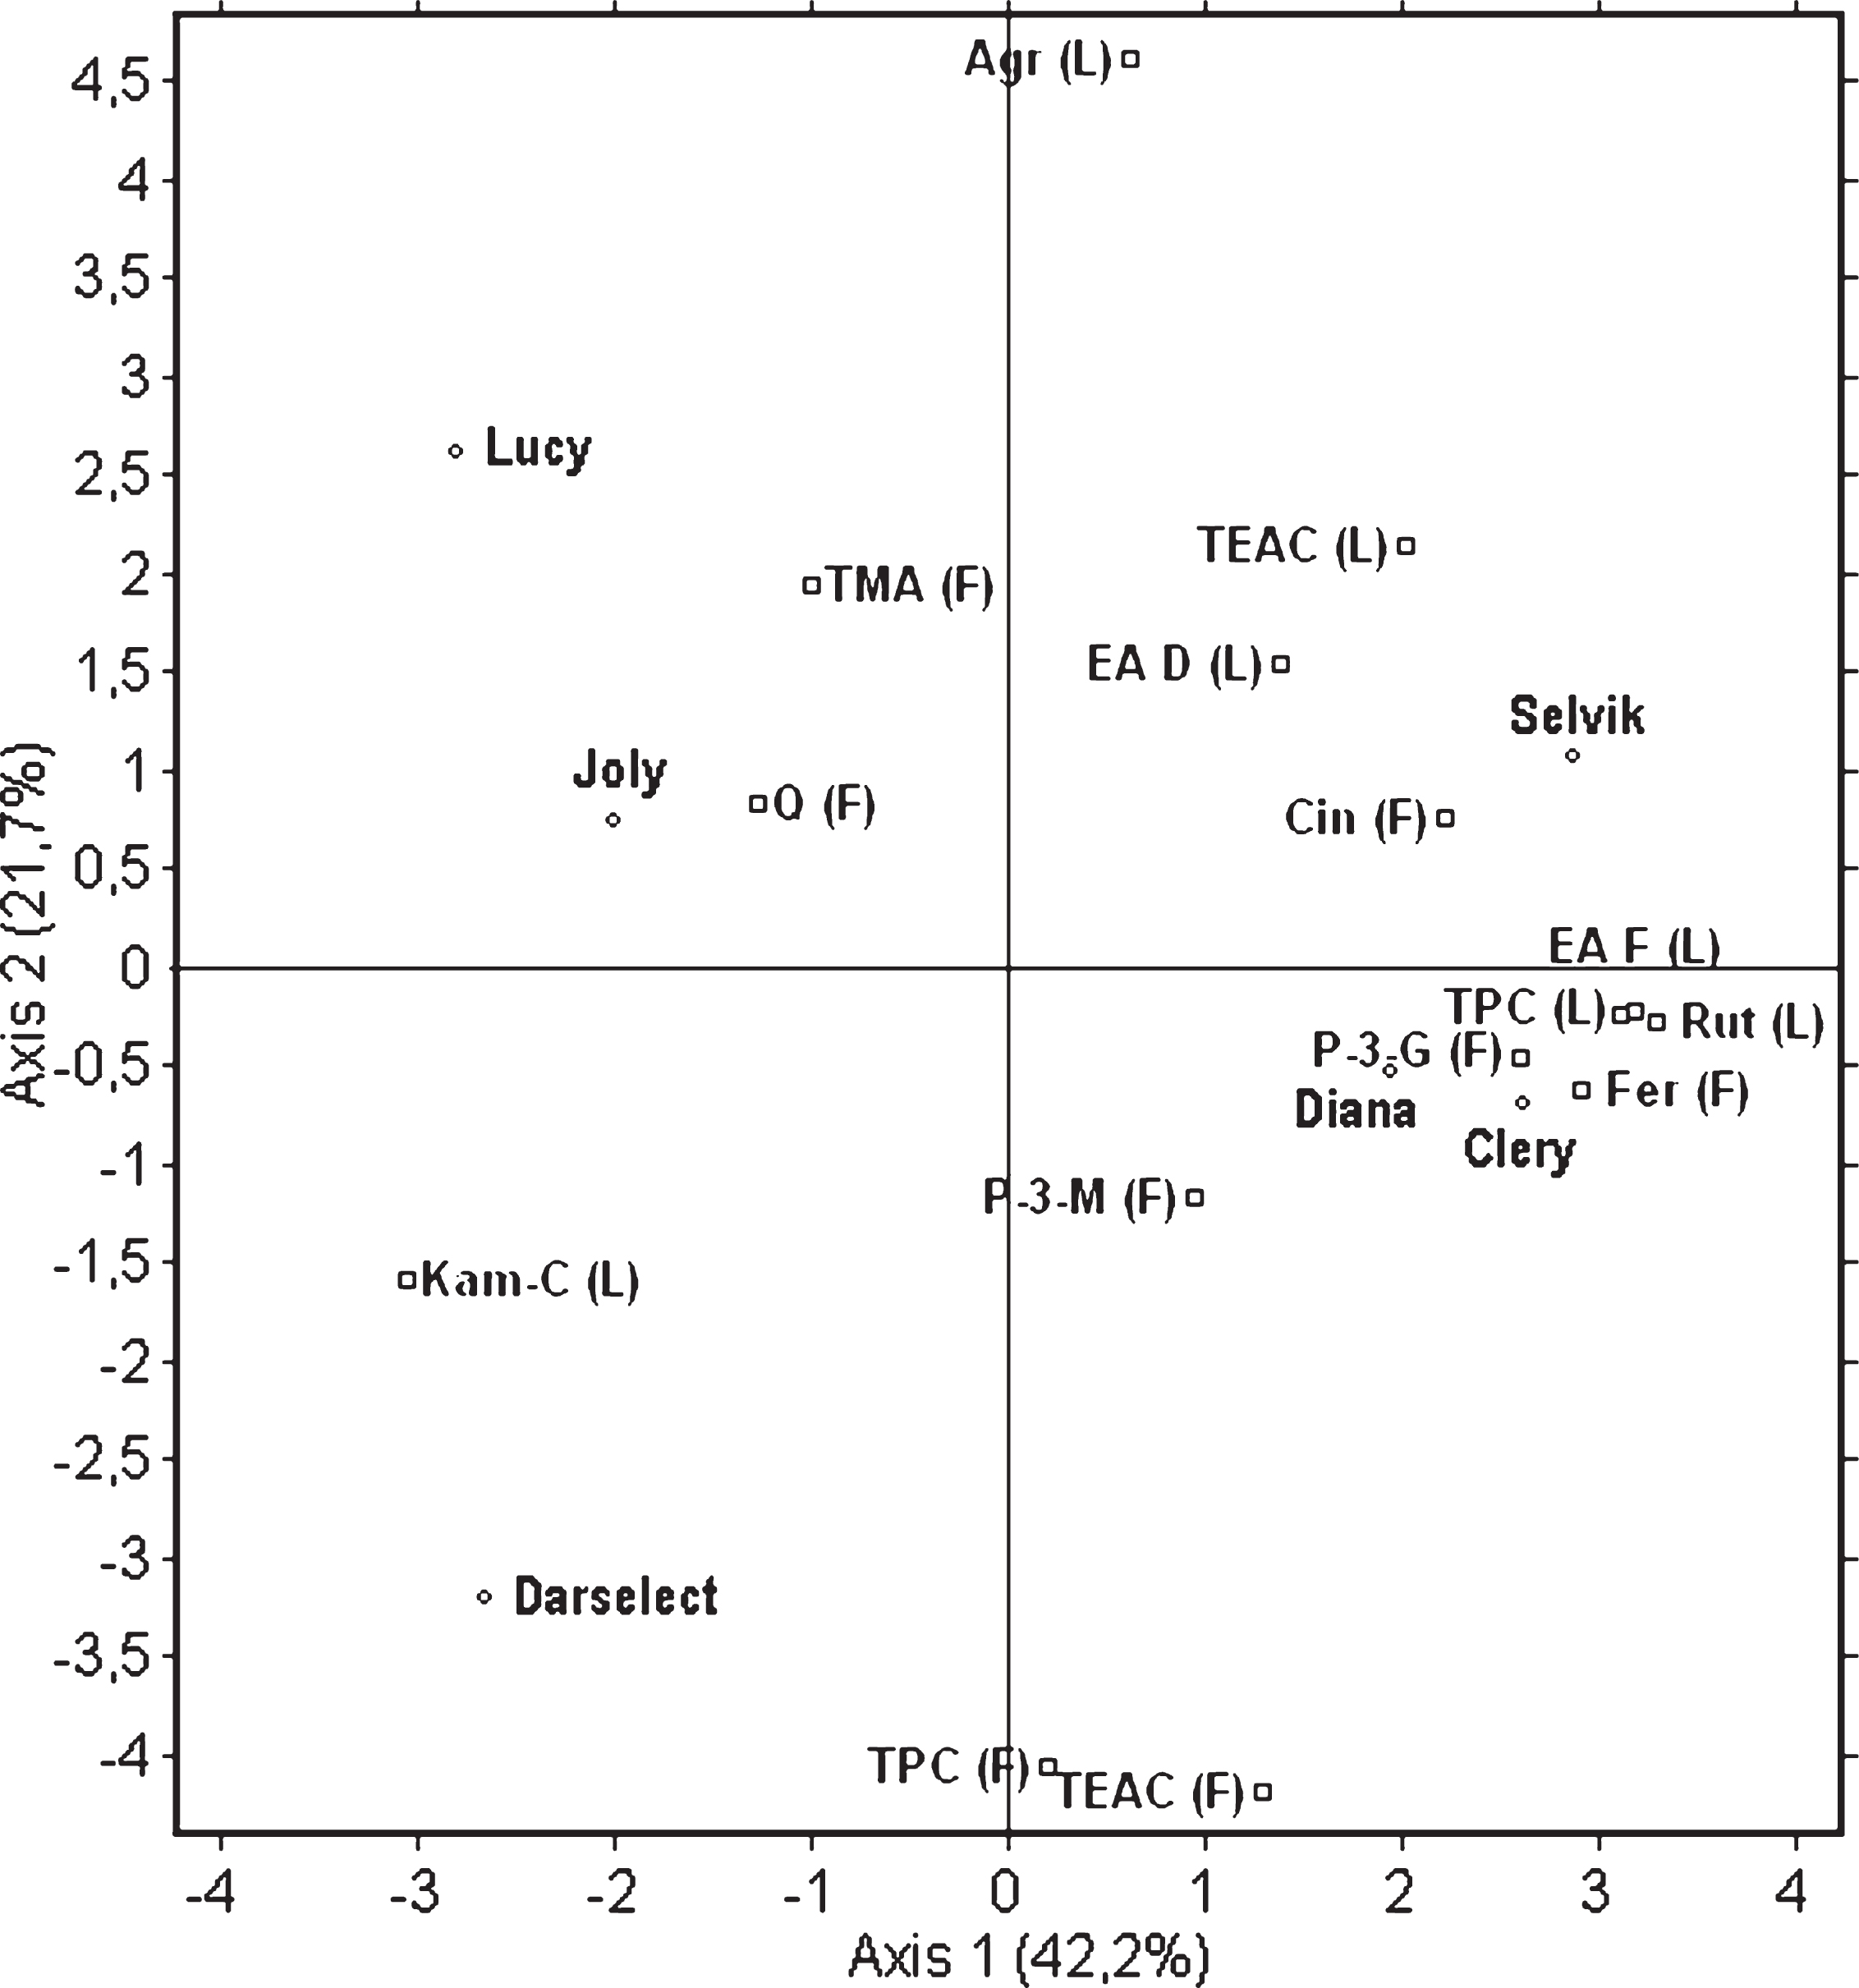
Principal component analysis of selected bioactive compounds present in fruits (F) and leaves (L) of six strawberry cultivars. Parameters are: Trolox Equivalent Antioxidant Capacity (TEAC), total polyphenolic compounds (TPC), total monomeric anthocyanins (TMA), free ellagic acid (EA F), ellagic acid derivatives (EA D), kaempferol-coumaroyl (Kam-C), quercetin-3-glucoside (Q), rutin (Rut), ferulic acid hexose derivative (Fer), cinnamic acid derivative (Cin), pelargonidin-3-glycoside (P-3-G), pelargonidin-3-malonylglucoside (P-3-M).
On the contrary to some previously conducted studies [13, 33], TPC seem to significantly influence the TEAC values of the fruits (r = 0.86) of all the six varieties analysed. This observation was similar to that presented by Santos-Buelga et al. [37], in which the authors highlighted the fact that the composition of polyphenolic compounds, which determines the ability to scavenge free radicals, depends on the strawberrygenotype.
Furthermore, anthocyanins are an important group of polyphenolic compounds in strawberries because their concentration and composition are the main factors responsible for the sensory quality determining consumers’ preferences and products acceptability [30]. In the current study, no correlation was found between total monomeric anthocyanins (TMA) and the content of any single anthocyanins (pelagronidin-3-glucoside and pelagronidin-3-malonylglucoside) or TPC in the six examined cultivars. An effort to find a relationship between the content of anthocyanins and antioxidant capacity in strawberries can be found in the literature [7, 39]. However, similarly to Denev et al. [40], in the current study no correlation was observed between these two parameters.
Relations between phenolic compounds and antioxidant capacity in leaves
Among bioactive compounds present in the leaves, a strong correlation was noticed between TPC and free ellagic acid, rutin and kaempferol-coumaroyl (r = 0.86, r = 0.96, r = –0.88, respectively). On the other hand, a high positive correlation between rutin and free ellagic acid was found (r = 0.96) and a strong negative correlation was noted between rutin and kaempferol-coumaroyl (r = –0.88). Also, the concentration of kaempferol-coumaroyl was strongly negatively correlated with the concentration of free ellagic acid (r = –0.82). No significant correlation was found in the leaves between TPC and TEAC (r = 0.57).
Linkage of phenolic compounds and antioxidant capacity between fruits and leaves
One of the goals of this study was to provide an insight into a link between the concentration of selected compounds in leaves and the concentration of those compounds in fruit. Statistical evaluations were performed in order to outline a putative correlation between these strawberry parts. On the basis of the results, it can be stated that no correlation was found between TPC in the fruit and leaves, regardless of the cultivar (r = 0.07, p > 0.05). Similarly to TPC, there was no significant correlation between TEAC values obtained for the fruit and TEAC values of the leaves of the analysed cultivars (r = –0.11, p > 0.05).
Interestingly, a further analysis and comparison of strawberry parts showed a strong negative correlation between the content of agrimoniin in the leaves and the TPC (r = –0.82) and TEAC values (r = –0.80) obtained for the fruit of all the six cultivars analysed. Furthermore, the content of free ellagic acid in the leaves of all the examined cultivars was positively correlated with the cinnamic acid derivative, ferulic acid hexose derivative and pelargonidin-3-glucoside present in the fruit (r = 0.81, r = 0.73, r = 0.68, respectively). The level of kaempferol-coumaroyl in the leaves was negatively correlated with the ferulic acid hexose derivative in the fruit (r = –0.72). By contrast, the concentration of rutin in the leaves was highly correlated with the ferulic acid hexose derivative in the fruit (r = 0.76).
Conclusions
The present study is focused on the health-related compounds of newly released and conventional strawberry cultivars. Due to the variability in the composition of bioactive compounds in strawberry fruit, strawberry cultivars should be carefully selected. Based on one year data, the results presented in this work suggest that the cultivars ‘Clery’ and the newly released ‘Joly’ are promising due to high levels of bioactive compounds in their fruit. These findings confirmed the previously reported data from Crespo et al. [9] showing that ‘Clery’ may gain in importance, as it is rich in bioactive compounds.
The present study also examined the relationship between bioactive compounds present in leaves and those present in fruit. In all of the analysed cultivars a high content of agrimoniin in the leaves was correlated with low TPC and TEAC values in the fruit. Additionally, the content of free ellagic acid in the leaves showed a good correlation with the cinnamic acid derivative and ferulic acid hexose derivative in the fruit. The analysis of the levels of agrimoniin or free ellagic acid in leaves might help breeders to identify, at a very early selection stage, cultivars with high antioxidant capacity, high TPC, and high levels of the cinnamic acid derivative and ferulic acid hexose derivative in fruit. However, to provide a general recommendation for breeders more detailed studies on the phenolic profiles of other strawberry cultivars should be conducted based on young leaves at the seedling stage.
Footnotes
Acknowledgments
The authors are grateful to CRUS (The Rectors’ Conference of the Swiss Universities) (SCIEX fellowship no.: PL0908002, Scientific Exchange Programme NMS-CH) and the REFRESH project (Unlocking the potential of the Institute of Animal Reproduction and Food Research for strengthening integration with the European Research Area and regional development) for financial support of Anna Michalska.