
Abstract
Background
Blood metabolites have emerged as promising candidates in the search for biomarkers for Alzheimer's disease (AD), as evidence shows that various metabolic derangements contribute to neurodegeneration in AD.
Objective
We aim to identify metabolic biomarkers for AD diagnosis.
Methods
We conducted an in-depth analysis of the serum metabolome of AD patients and age, sex-matched cognitively unimpaired older adults using ultra-high-performance liquid chromatography-high resolution mass spectrometry. The biomarkers associated with AD were identified using machine learning algorithms.
Results
Using the discovery dataset and support vector machine (SVM) algorithm, we identified a panel of 14 metabolites predicting AD with a 1.00 area under the curve (AUC) of receiver operating characteristic (ROC). The SVM model was tested against the verification dataset using an independent cohort and retained high predictive accuracy with a 0.97 AUC. Using the random forest (RF) algorithm, we identified a panel of 13 metabolites that predicted AD with a 0.96 AUC when tested against the verification dataset.
Conclusions
These findings pave the way for an efficient, blood-based diagnostic test for AD, holding promise for clinical screenings and diagnostic procedures.
Introduction
Alzheimer's disease (AD) is a leading cause of dementia, accounting for 60–80% of dementia cases.1,2 By 2050, the global prevalence of all-cause dementia is projected to reach 113 million. 2 AD is neuropathologically characterized by the accumulation of hyperphosphorylated tau and aggregates of amyloid-β (Aβ) peptide in the brain. Clinically, patients with AD experience gradual and progressive cognitive decline and disability. Most treatments available for AD offer only temporary symptomatic relief without modifying the course of the disease. 3 Recently, emerging early-stage anti-amyloid antibody therapies have shown very modest positive effects on disease progression. The consensus opinion in the scientific community emphasizes early detection and intervention. This emphasizes the need to identify reliable biomarkers, preferably blood-based, for AD.
The National Institute on Aging and Alzheimer's Association (NIA-AA) recognizes cerebrospinal fluid (CSF) proteins such as total Tau (T-Tau), phosphorylated Tau (p-Tau), and Aβ42 as key AD biomarkers.4,5 Blood tests, however, offer a more practical alternative to CSF tests, especially for frequent assessments in clinical trials. 6 Yet, establishing consistent blood biomarkers for AD has been challenging. The compromised BBB in aging and AD suggests that blood metabolites might more accurately represent brain biochemical alterations.7–11
Research increasingly associates the potential contribution of metabolic dysregulations to the pathogenesis of AD.12,13 Metabolic abnormalities of glucose metabolism in the brains of MCI patients develop early in the process, predisposing neurons to energy and functional disruptions.12,14,15 Conditions such as diabetes, obesity, and metabolic syndrome, along with lifestyle factors, including diet and sedentary behavior, contribute significantly to AD risk.16–19 The microbiota-gut-brain axis has also gained attention in AD, with certain gut bacterial byproducts potentially being implicated in AD20–23 Some of these factors have been detected using metabolic approaches.20,21,24 Teruya and colleagues identified numerous metabolite panels in plasma associated with dementia, though the specificity of these biomarkers to AD remains unexplored. 25
The prevailing view in AD therapeutics suggests that early interventions may yield the most promising therapeutic outcomes. As such, accurate diagnosis of AD at its earliest stages through biomarkers becomes paramount. In pursuit of this objective, we endeavored to discover a set of metabolite biomarkers linked to AD diagnosis, utilizing serum samples from the Texas Alzheimer's Research and Care Consortium (TARCC) (https://www.txalzresearch.org). 26 To ascertain whether blood-derived metabolites could distinguish AD from cognitively unimpaired controls, we combined the precision of ultra-high-performance liquid chromatography-high resolution mass spectrometry (UPLC-HRMS) with advanced computational modeling techniques.
Methods
Ethical approval
This study was conducted under the approval of the University of Texas Medical Branch (UTMB) Institutional Review Board (IRB) protocol 21-0201 on August 15, 2021. In addition, this study complied with all applicable federal regulations governing the protection of human subjects.
Cohort
Serum samples were requested through the TARCC bio-banking facility. TARCC is a longitudinal collaborative research initiative between ten Texas medical research institutions. 27 TARCC aims to investigate factors involved in the development and progression of AD and improve early diagnosis, treatment, and prevention of AD. The participants of the TARCC study were subjects older than 55 years and recruited at dementia clinics of the TARCC member institutions. All centers followed a harmonized collection protocol. The diagnosis of AD was based on the clinical examination with a neuropsychological battery using NINCDS-ADRDA criteria, 28 while age and sex-matched controls showed no cognitive impairment and achieved a zero on the Clinical Dementia Rating (CDR) scale. 29 The exclusion criteria include any significant neurological disease other than AD, such as Parkinson's disease, vascular dementia, progressive nonfluent aphasia, primary progressive aphasia, or prion disease. Participants with psychiatric disorders were also excluded. Age, sex, medical history, history of cardiovascular disease (i.e., heart disease, hypertension, diabetes mellitus, and hyperlipidemia), and family history of dementia were recorded. The levels of T-Tau, p-Tau, and Aβ42 in patients’ CSF and brain were unknown.
Study design
Serum samples from age and sex-matched AD patients and cognitively unimpaired older adults (Controls) were used. The study was conducted in two phases: the discovery phase and the verification phase. In the discovery phase, 20 serum samples were used (n = 20; controls, 10; AD, 10). In the verification phase, 57 serum samples were used (n = 57, controls, 30, AD, 27). The demographic data of the discovery and verification study are presented in Table 1. The workflow of biomarker discovery is shown in Figure 1. Briefly, the serum metabolome of AD patients and cognitively unimpaired older adults were analyzed with LC-MS to identify AD-associated alternation in the metabolome. The significant metabolite hits were then used to identify a panel of AD biomarker candidates using machine learning technology. Finally, the performance of the biomarker panel was validated in the verification study.
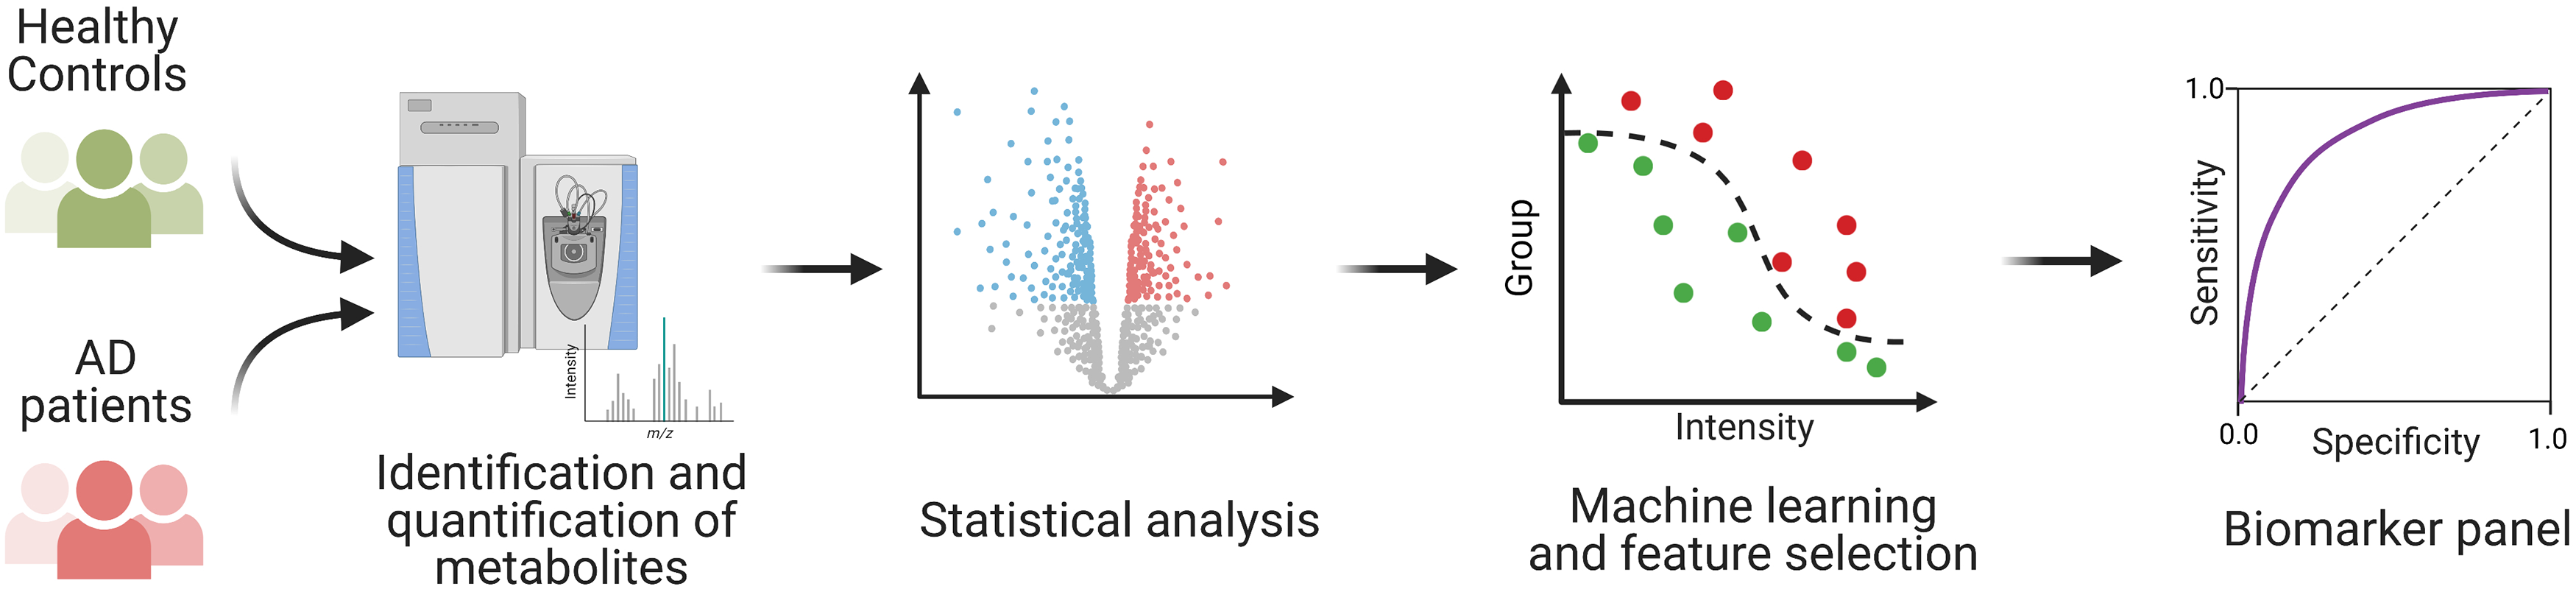
The workflow of identifying metabolic biomarkers for AD diagnosis. The study was conducted in two phases: the discovery phase and the verification phase. In each phase, serum metabolome from AD patients and healthy controls were analyzed with UPLC-HRMS. Then, the biomarker candidates were identified using machine learning and further verified in the verification phase.
Demographic characteristics of the metabolomics studies.
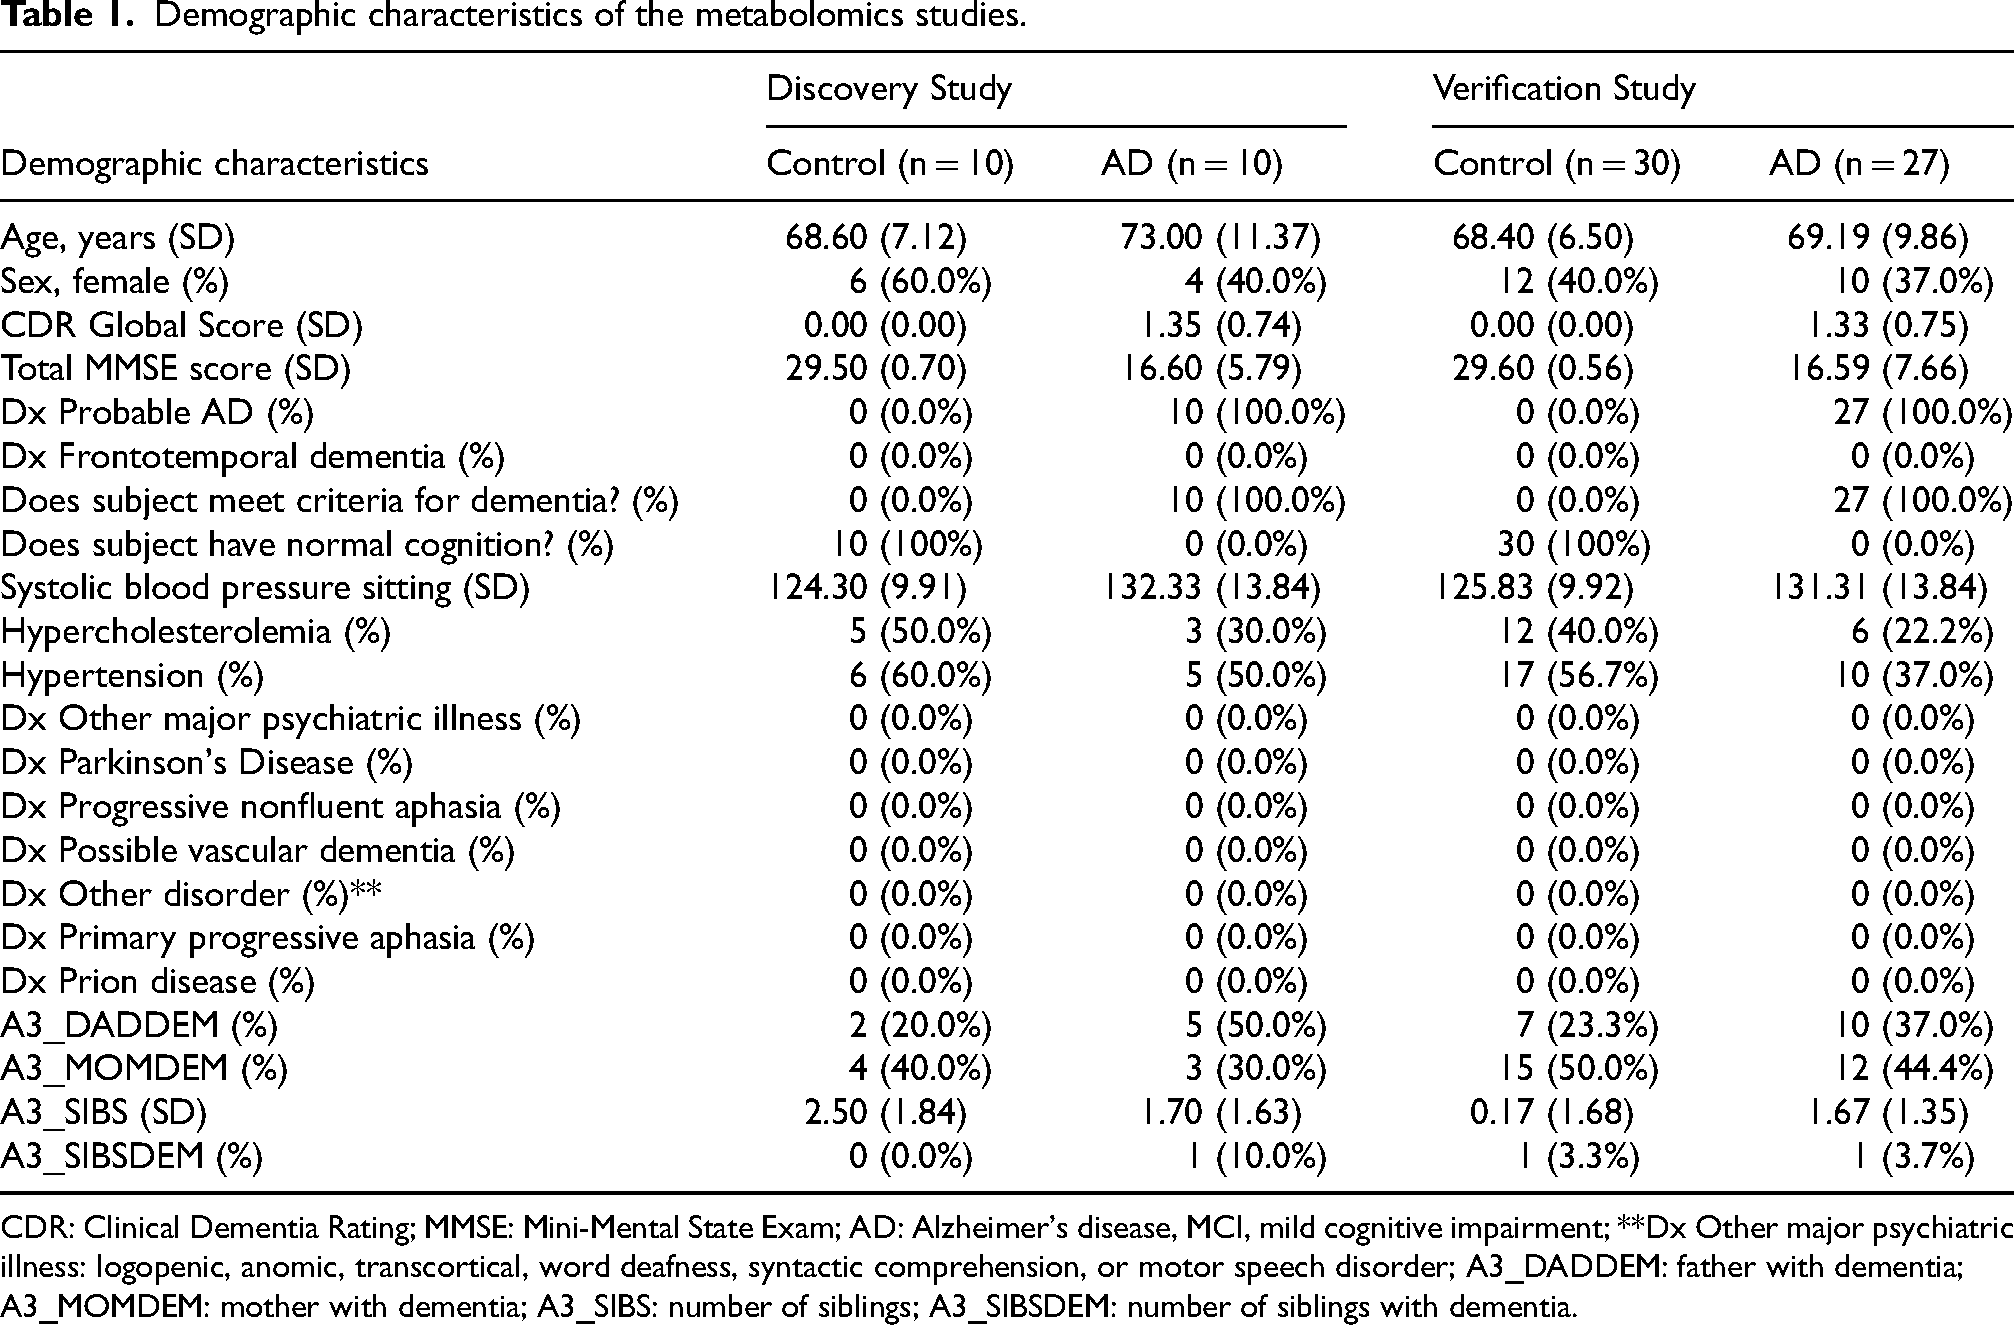
CDR: Clinical Dementia Rating; MMSE: Mini-Mental State Exam; AD: Alzheimer's disease, MCI, mild cognitive impairment; **Dx Other major psychiatric illness: logopenic, anomic, transcortical, word deafness, syntactic comprehension, or motor speech disorder; A3_DADDEM: father with dementia; A3_MOMDEM: mother with dementia; A3_SIBS: number of siblings; A3_SIBSDEM: number of siblings with dementia.
Serum metabolome analysis with ultra-high-performance liquid chromatography-high resolution mass spectrometry (UPLC-HRMS)
An aliquot of 20 µL of serum from each subject was deproteinized by acetonitrile precipitation (1:4 v:v). The deproteinized serum samples were dried using a nitrogen evaporator and resuspended in 0.1% formic acid for LC-MS/MS analysis. Samples were analyzed using an Easy-nLC 1000 UHPLC system coupled with a high-resolution, high-mass accuracy Q Exactive orbitrap mass spectrometer (Thermo Scientific). The metabolites were separated on a reverse-phase nano-HPLC column with a 20-min linear gradient from 2–95% mobile phase B (0.1% formic acid-90% acetonitrile) in mobile phase A (0.1% formic acid), followed by 30-min 90% mobile phase B. The Orbitrap was operated in data-dependent MS/MS mode with 70,000 resolution (FWHM) at the full scan and 17,500 (FWHM) at MS/MS. Each sample was analyzed two or three times.
Metabolomic data analysis
The MS data were analyzed with Compound Discoverer™ 3.3 software (Thermo Scientific) for metabolite identification and quantification. For metabolite identification, elemental compositions were predicted using accurate mass data, with compounds identified using the mzCloud mass spectral library and MS/MS information. mzCloud is a foremost mass spectral database that aids analysts in characterizing compounds even in cases where they may not be found in the library (https://www.mzcloud.org/). 30 Where there was no match from mzCloud, ChemSpider was used. ChemSpider is chemical structure database that is free of cost and allows connection to rapid text and structure probing of more than 100 million structures found in hundreds of sources of data (http://www.chemspider.com). 31 For results with a ChemSpider match, mzLogic was used to rank the identifications by the likelihood of a match. mzLogic is an algorithm for data analytics that merges the fragmentation data found inside the online mzCloud advanced mass spectral library with other data in various structural databases that are online. This permits you to choose thousands of structural possibilities and sort them numerically based on sub-structural data and spectral similarity (https://www.thermofisher.com/us/en/home/industrial/mass-spectrometry/liquid-chromatography-mass-spectrometry-lc-ms/lc-ms-software/mass-spectral-libraries/mzlogic-data-analysis.html). 32 The metabolites identified with less than two structure annotation sources or mass error greater than five ppm were excluded from further analysis. The proposed identification results were then checked manually to eliminate false positives. Finally, the peak areas under the curve were extracted and integrated using the default setting of Compound Discoverer.
Statistical analysis
Statistical analyses were performed using Perseus Software 1.6.15.0.33,34 The discovery and verification datasets were analyzed independently. First, the intensity of each metabolite was log2 transformed. Then the mean of log2 transformed intensities of the technical replicates were calculated, and the group differences in metabolite MS intensity were analyzed using Student's t-test.
Hierarchical clustering and principal component analysis (PCA) were performed using Perseus Software 1.6.15.0.33,34 The unsupervised hierarchical clustering and heat map were based on the log2-transformed MS intensity of metabolites. The rows of the heat map indicate the metabolites and the columns indicate the samples. The log2 intensity of each metabolite was z-score normalized for each row. Hierarchical clustering of the z-normalized log2 intensity was performed using Euclidean distances between means. The number of clusters was set at 300.
Classification analysis and feature selection
Classification analysis and feature selection were performed using the machine learning module of Perseus Software 1.6.15.0.33,34 Support vector machine (SVM) modeling with radial basis function (RBF) kernel was performed by 4-fold cross-validation. Duplicated features were removed based on feature optimization ranking prior to model building. Features that are medications and their metabolites were also excluded from model building. Measurements from the discovery cohort were used as the “training” data set, and those from the verification cohort as the “test” data set. Model performance was evaluated by analysis of the AUC of the ROC curve, where sensitivity (true positive) versus 1-specificity (false positive) was plotted and assessment of classification accuracy was carried out.
In order to validate the analysis, intensities were standardized before the SVM model was run on the training dataset (Discovery cohort) with prefiltered metabolites, and predictions on the model using the test dataset (Verification cohort) were compared. To also look at individual metabolites, logistic regression models were fit for each one of the metabolites. Significant interactions between pairs of metabolites were searched using the rFSA algorithm. 35 Logistic regression analyses and SVM models were run on JMP version 16.1, SAS Institute Inc., Cary, NC. All other analyses were run using Rstudio version 2022.12.0 and R version 4.2.1. The significance for p-value was set at 0.05. Similarly, t-test with Permutation q-value <0.05 was used to control for false positive discovery rate in a multiple comparisons problem.
Results
Study subjects
The discovery cohort participants comprised ten cognitively unimpaired older adults and ten AD patients (Table 1). The cognitively unimpaired older adults had a mean age of 68.60 ± 7.12, a mean CDR global score of 0.00 ± 0.00, and a mean Mini-Mental State Examination (MMSE) score of 29.50 ± 0.70. Six of the cognitively unimpaired older adults were women. The ten AD patients had a mean age of 73.00 ± 11.37, a mean CDR global score of 1.35 ± 0.74, and a mean MMSE score of 16.60 ± 5.79. Four of the AD patients were women. The verification cohort participants comprised 30 cognitively unimpaired older adults and 27 AD patients (Table 1). The cognitively unimpaired older adults had a mean age of 68.40 ± 6.50, a mean CDR global score of 0.00 ± 0.00, and a mean MMSE score of 29.60 ± 0.56. Twelve of the cognitively unimpaired older adults were women. The 27 AD patients had a mean age of 69.19 ± 9.86, a mean CDR global score of 1.33 ± 0.75, and a mean MMSE score of 16.59 ± 7.66. Ten of the AD patients were women. None of the discovery and verification cohort participants had any other types of dementia or other neurological diseases, such as Parkinson's disease.
Identification of blood-based metabolites that differentiate AD and cognitively unimpaired older adults
We analyzed blood samples using UPLC-HRMS to identify metabolites that can distinguish between Alzheimer's patients and cognitively normal older adults. Our results were as follows:
Discovery Phase (20 participants: 10 controls, 10 AD patients): 7075 metabolites were detected. Of these, 1414 showed significant differences between AD patients and controls (p < 0.05) as indicated in Figure 2A and 2B. Some metabolites were detected multiple times in each sample. Using Support Vector algorithms, we ranked them by their distinguishing ability and retained only the highest-ranking instance of each metabolite. This left 750 unique significant metabolites differentiating AD from cognitively unimpaired age matched older adults.
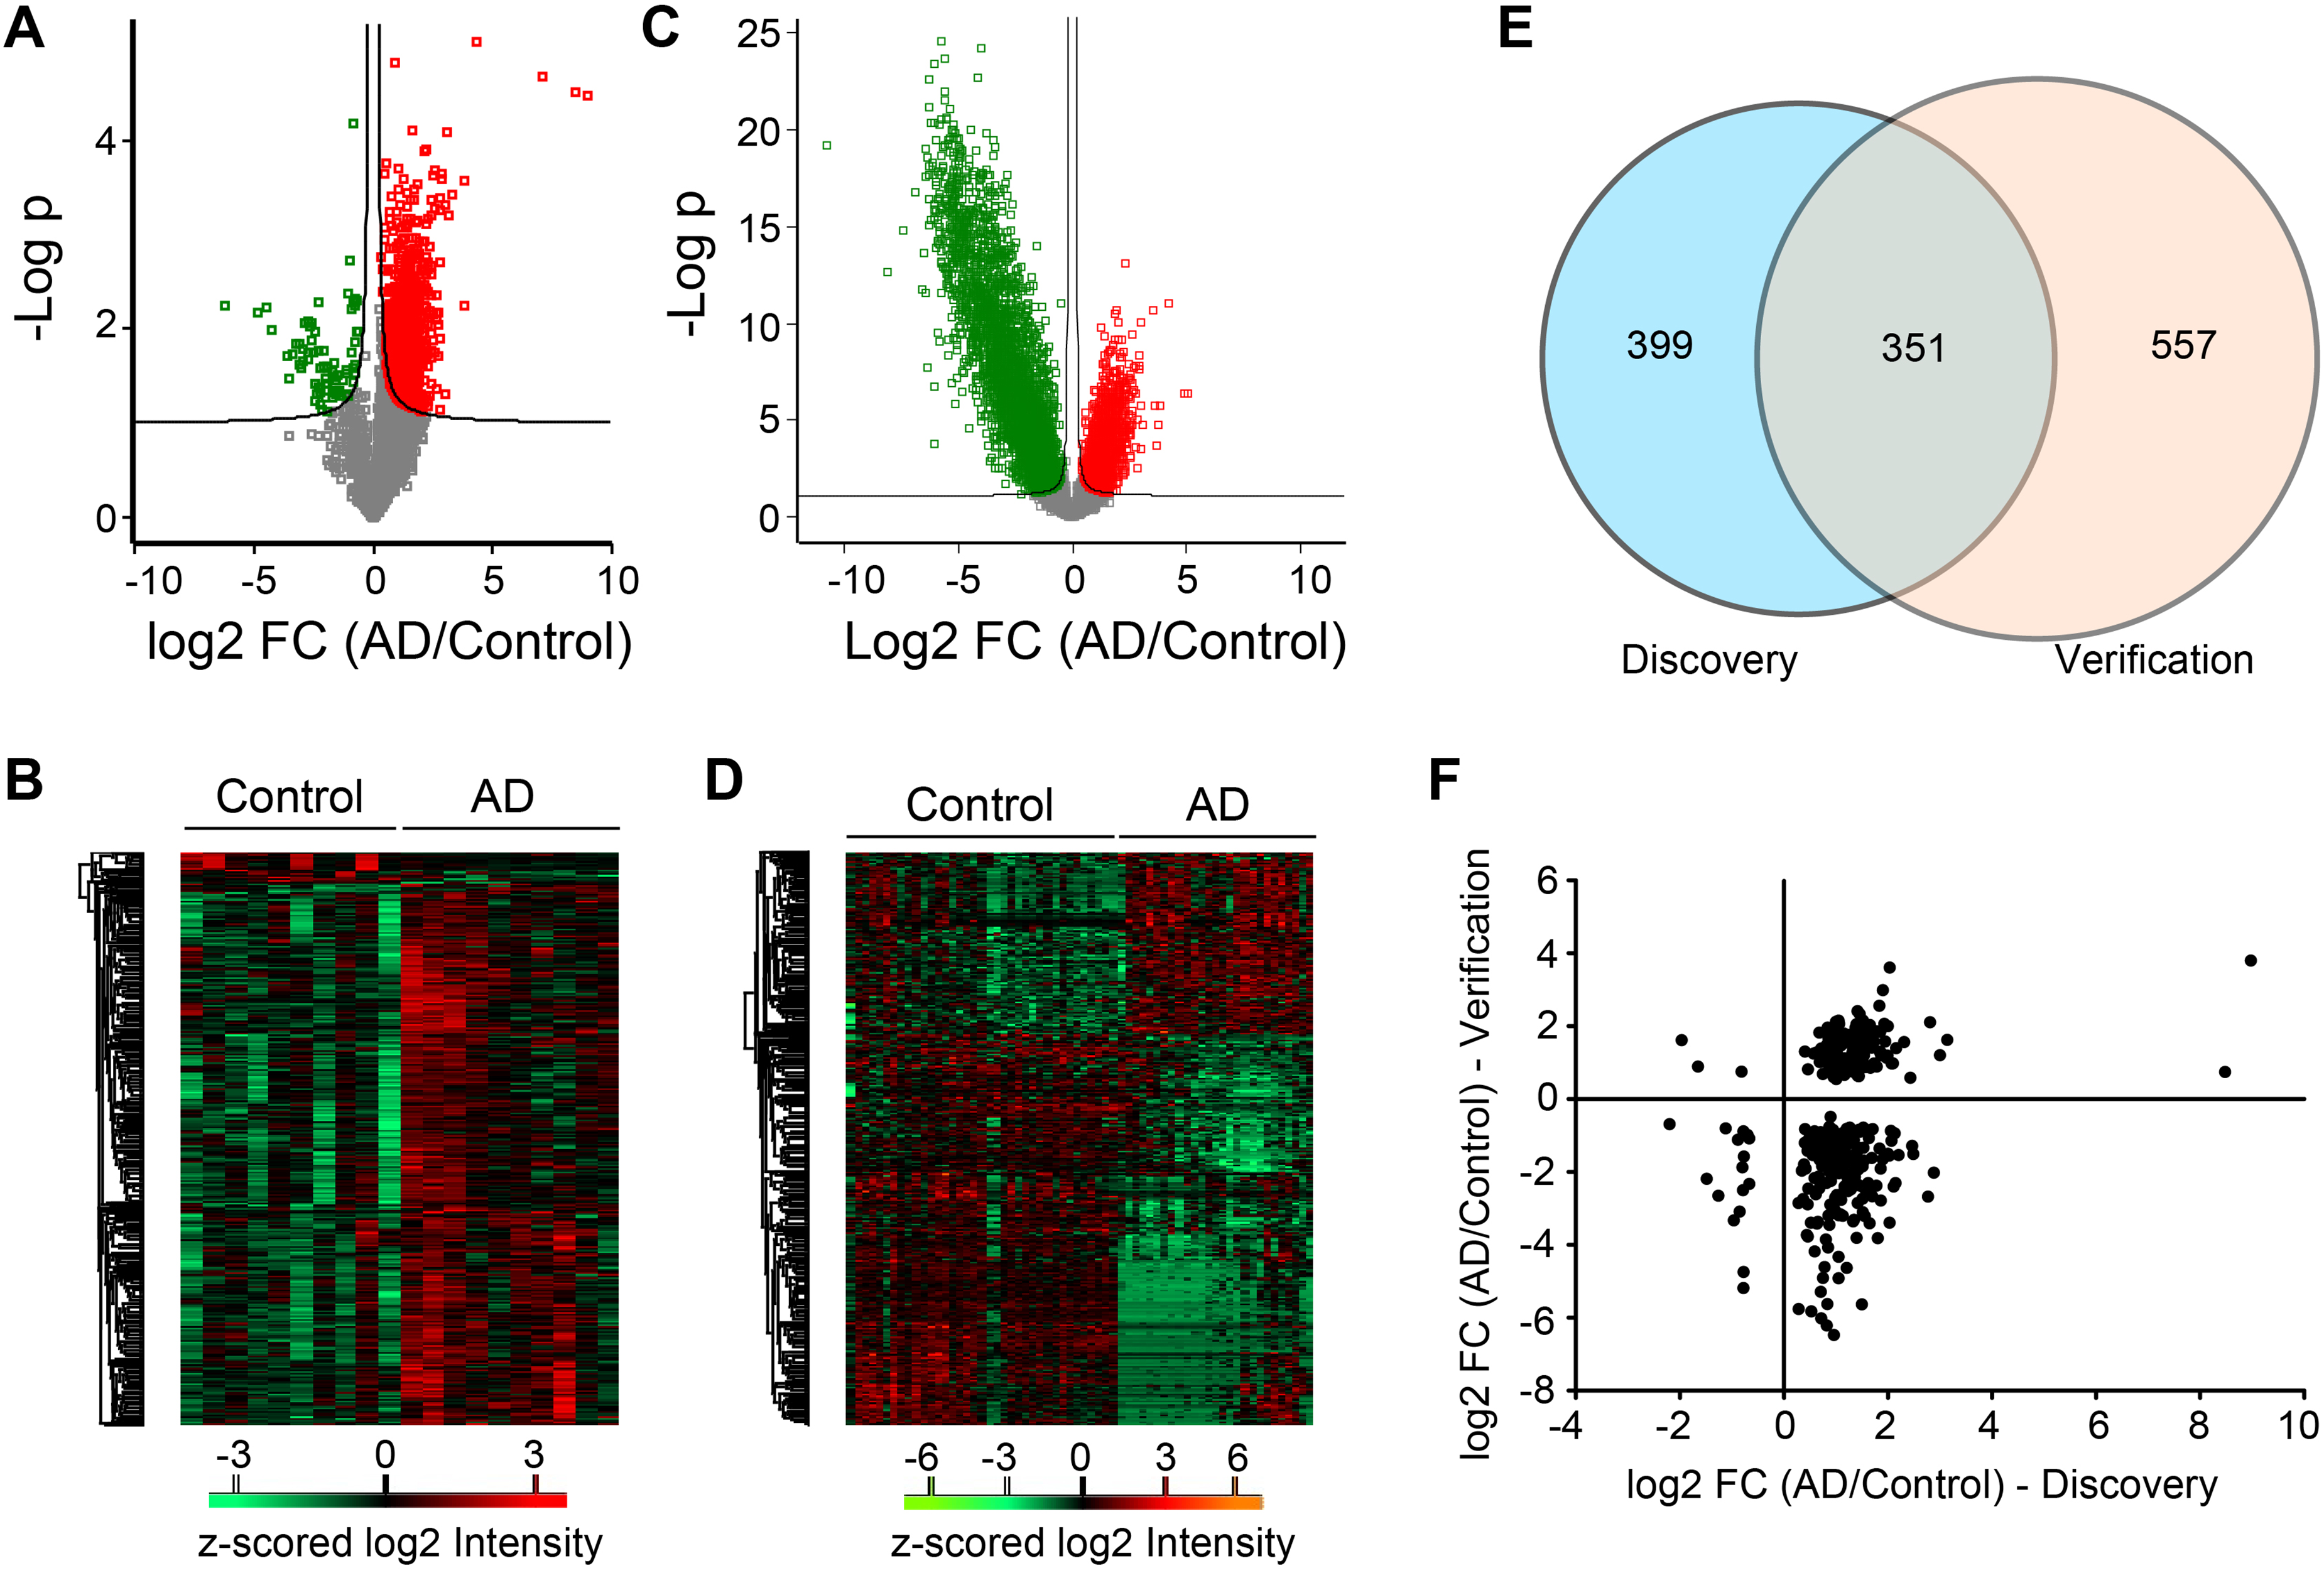
Identification of blood-based metabolites that differentiate AD and cognitively unimpaired older adults. (A) Volcano plot of metabolites quantified in the discovery study. Red, metabolites were significantly elevated in the serum of AD patients; Green, metabolites were significantly depleted in the serum of AD patients; Grey, non-significant metabolites. (B) Heatmap of significant metabolites identified in the discovery study. (C) Volcano plot of metabolites quantified in the discovery study. Red, metabolites were significantly elevated in the serum of AD patients; Green, metabolites were significantly depleted in the serum of AD patients; Grey, non-significant metabolites. (D) Heatmap of significant metabolites identified in the discovery study. (E) Venn diagram of the significant metabolites identified in the discovery and verification studies. (F) Comparison of the profiles of the significant metabolites identified in both discovery and verification studies.
Verification Phase (57 participants: 30 controls, 27 AD patients): We detected 10,595 metabolites. 5563 metabolites showed significant differences (Student's t-test, p < 0.05). This was notably higher than in the discovery phase. To ensure robustness in our findings, we adjusted for multiple comparisons using a Permutation-based method, aiming to maintain a false discovery rate (FDR) under 5%. This resulted in 5136 significant metabolites, as shown in Figure 2C and 2D. After accounting for repeated metabolites, similar to the earlier process, 908 unique significant metabolites remained.
Comparison of discovery and verification phases
Three hundred fifty-one metabolites were found to be significant in both phases (see Figure 2E). Out of these, 162 metabolites (the upper-right and lower-left quarters of Figure 2F) exhibited consistent differences in fold change between the AD and control groups across both studies. As shown in Figure 2F, most of these 162 metabolites had consistent fold changes between the Discovery and Verification phases, but a few showed discrepancies. For instance, in the Discovery study, Hexylbenzene was found to be 504-fold more abundant in AD compared to healthy controls, whereas in the Verification study, it was only 13.86-fold higher. This may be due to the high variability of biomarker levels across the human population and the considerable molecular heterogeneity of individual AD patients.
After excluding five metabolites related to medications, the final list consisted of 157 metabolites. These metabolites were then used to create computational diagnostic models for AD.
Classification feature optimization
Classification with support vector machine algorithm
We employed the SVM algorithm with an RBF kernel, combined with 4-fold cross-validation, to rank the 157 metabolite features initially identified in the discovery study. The prediction error rate corresponding to the number of features utilized for AD prediction is depicted in Figure 3A. Notably, employing the foremost 14 features resulted in the minimal error rate of 5%. Utilizing additional features did not enhance this rate. When we performed principal component analysis (PCA) on the abundances of these top 14 metabolites, the AD cohort was discernibly segregated from the cognitively unimpaired older group, as shown in Figure 3B. Hence, these 14 metabolites were chosen as potential biomarkers for AD diagnosis. Their abundance profiles in the serum of both AD patients and healthy older adults are presented in Figure 3C and Table 2.
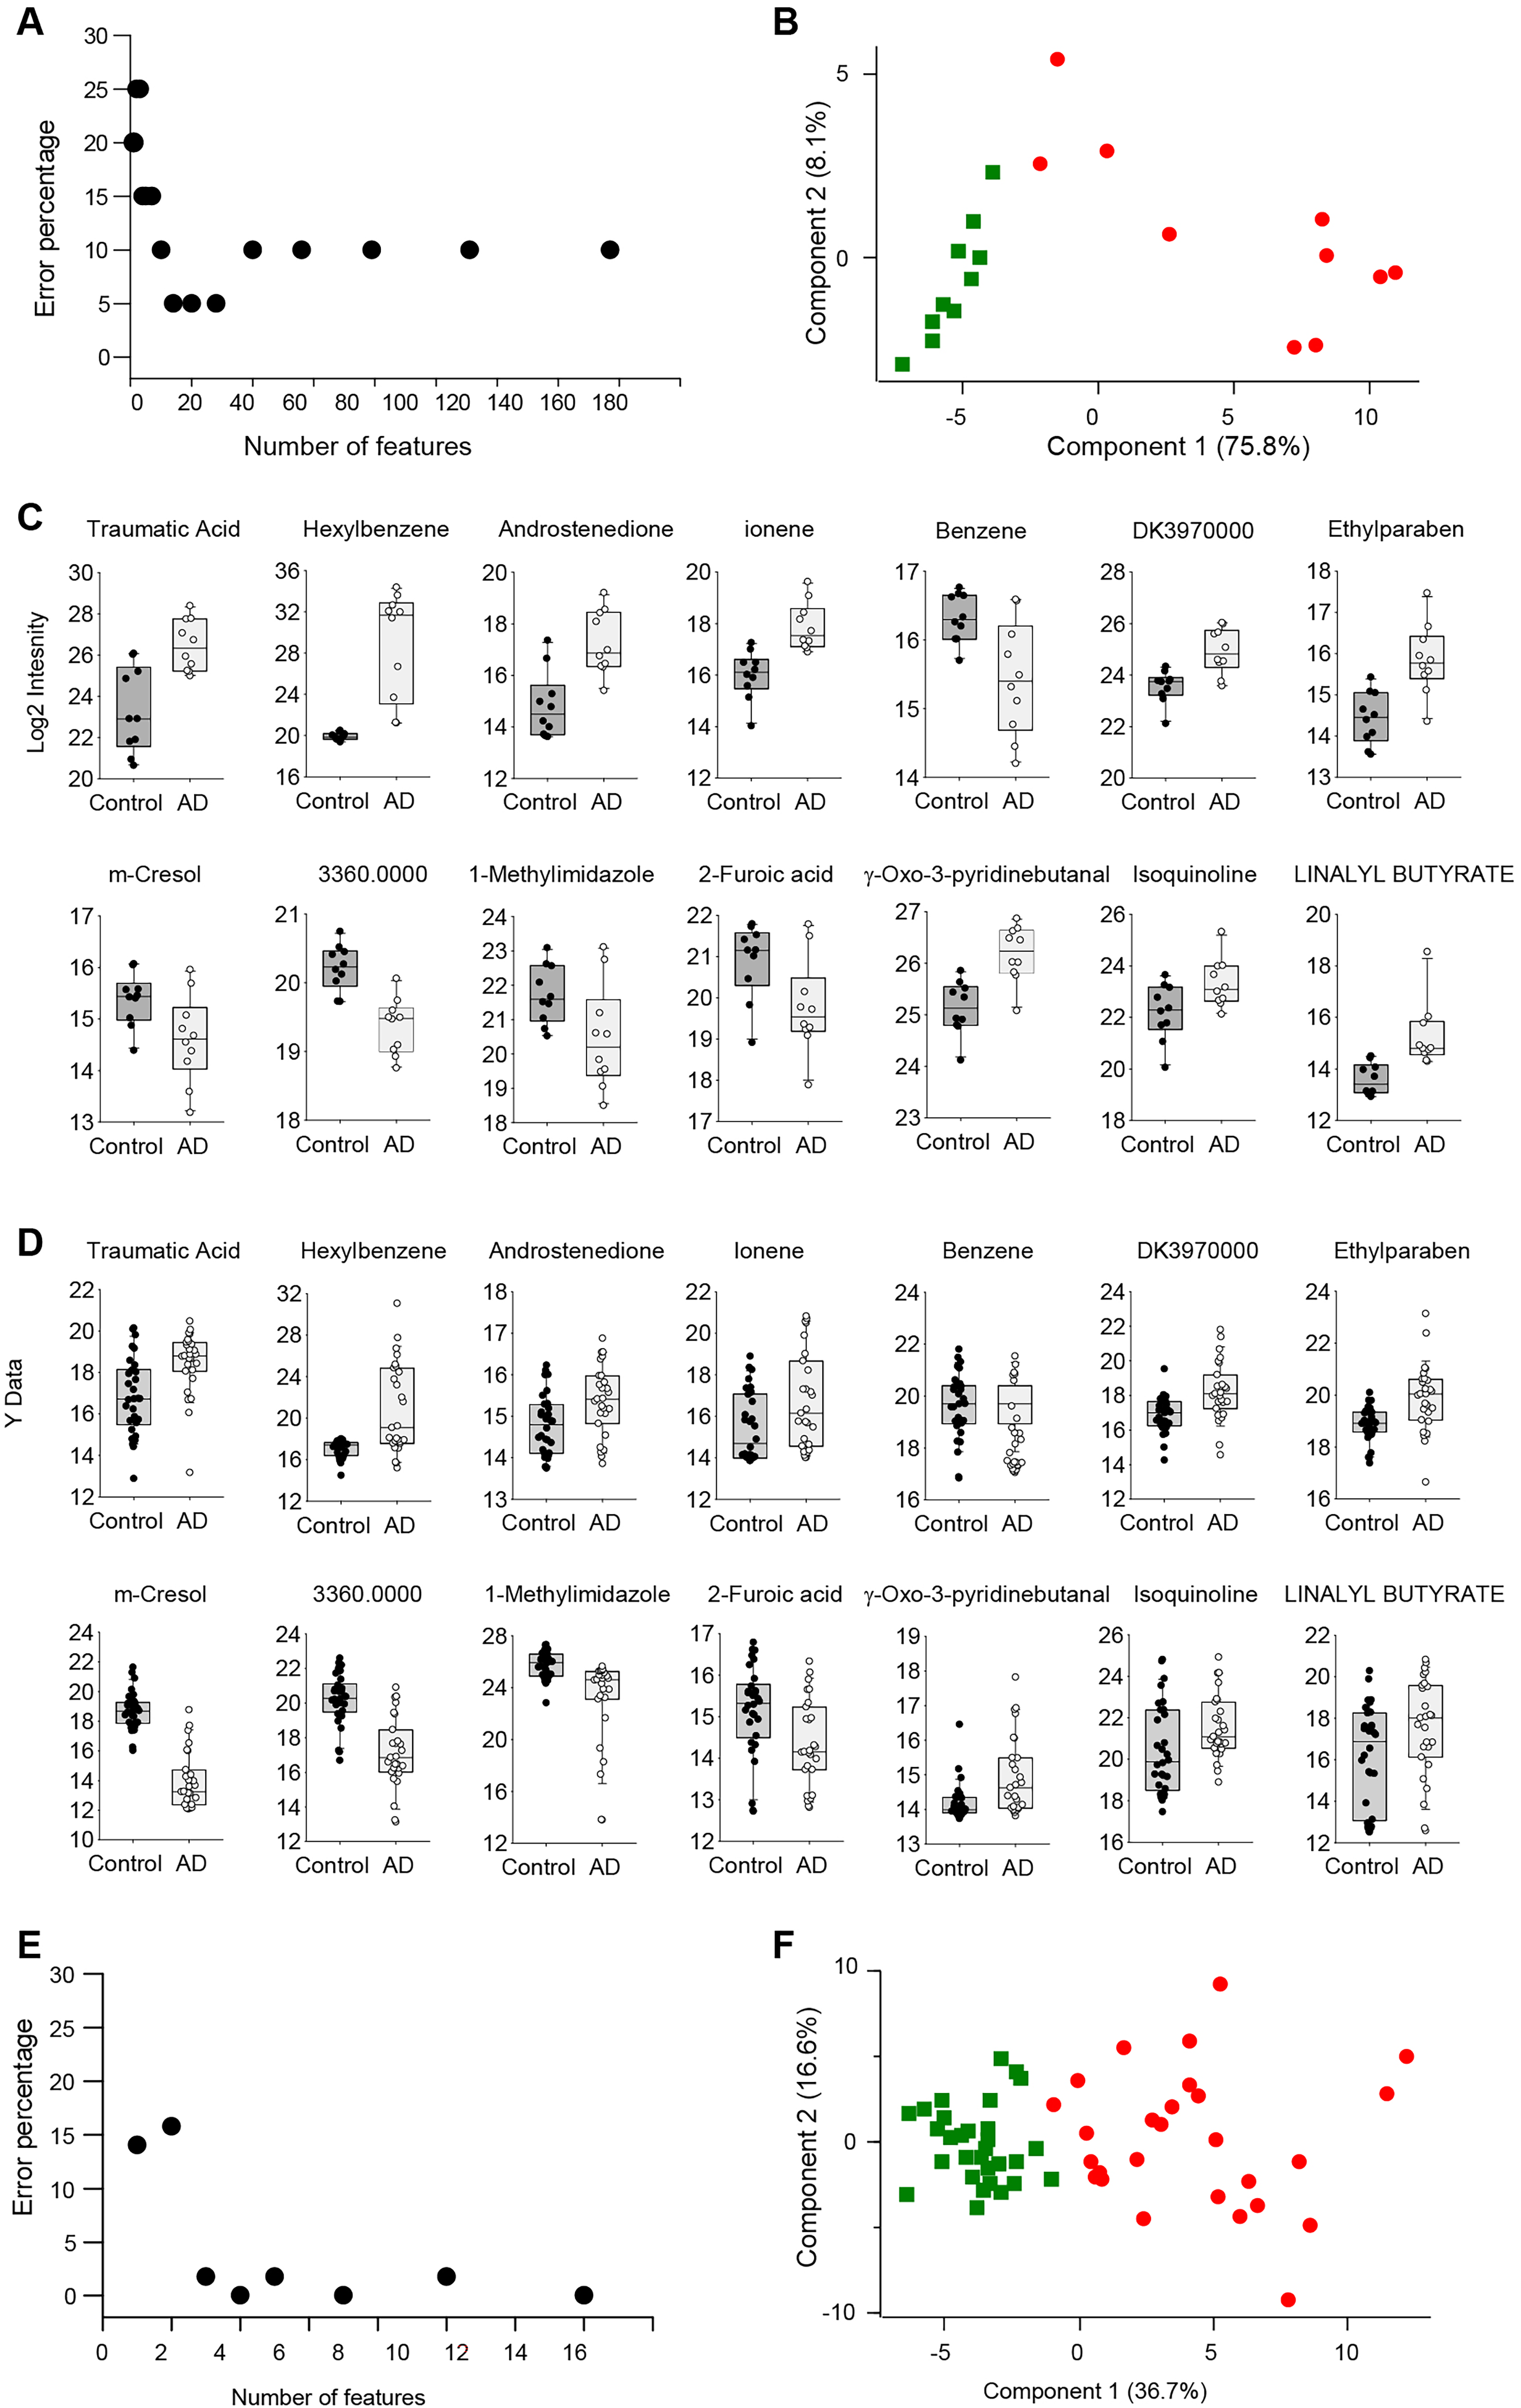
Classification feature optimization. (A) Classification error rate versus the number of features used in the discovery study. (B) PCA analysis of subjects in the discovery studies using the top 14 features identified by the SVM algorithm and 4-fold cross-validation. (C) Profiles of the top 14 metabolite features in the discovery study. (D) Profiles of the top 14 metabolite features in the verification study. (E) Classification error rate versus the number of features used in the verification study. (F) PCA analysis of subjects of the verification studies using the top 14 features identified in the discovery study.
The profiles of biomarker candidates of SVM model in the discovery and verification studies.
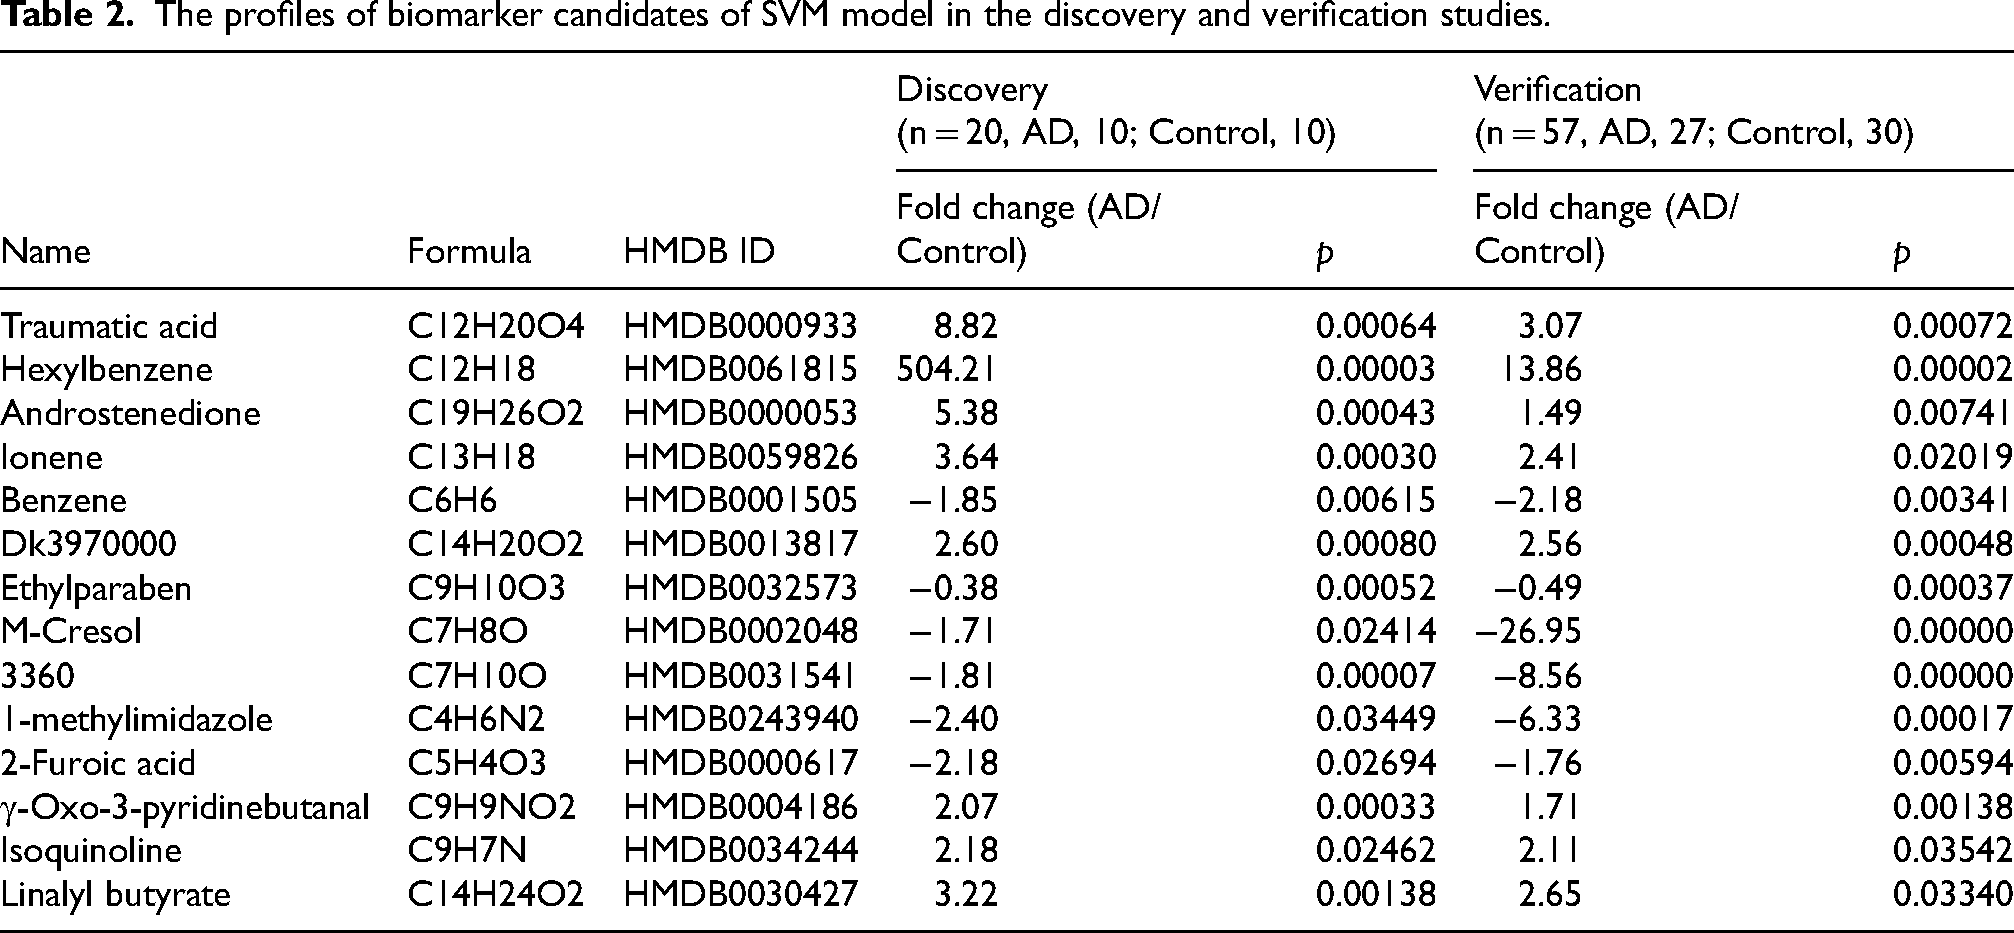
In the verification phase, we assessed if these 14 metabolites could differentiate the AD cohort from the cognitively unimpaired older adults. Their profiles in this phase are illustrated in Figure 3D and Table 2, revealing a congruence with the discovery phase profiles. The prediction error in the verification study, utilizing these 14 metabolite profiles and SVM with an RBF kernel combined with 4-fold cross-validation, was 0.0%, as visualized in Figure 3E. A PCA based on these 14 metabolites’ abundances distinctly segregated the AD cohort from the cognitively healthy older adults, as displayed in Figure 3F.
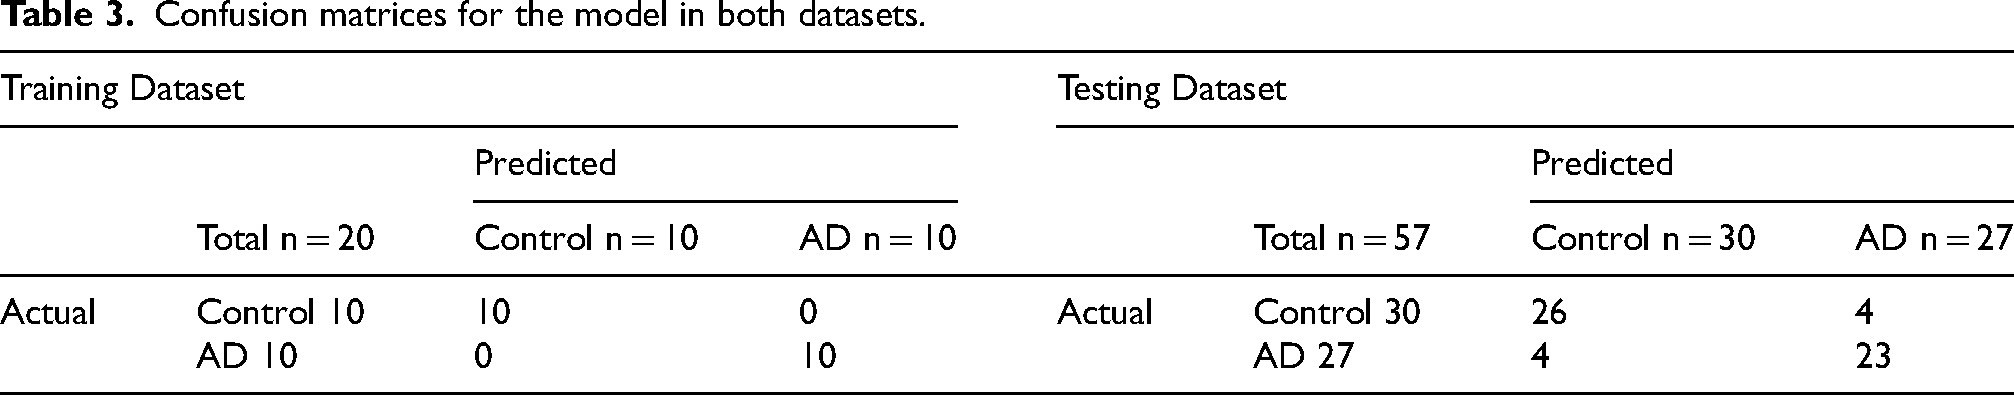
Further, using the discovery dataset, we trained a model and subsequently tested it on the verification dataset. The efficacy of the resulting models in disease differentiation was evaluated using ROC curves, which graphically represent sensitivity against (1-specificity) for variable discrimination thresholds. 36 The AUC signifies a model's discriminative capacity between outcome groups. The ROCs for individual metabolites from both datasets are shown in Figure 4. In the discovery dataset, 10 out of the 14 metabolites attained an AUC exceeding 0.8 for AD prediction, whereas in the verification dataset, only four metabolites achieved this threshold. Incorporating all 14 metabolites considerably augmented model efficacy. The AUC values were 1.00 for the training dataset and 0.97 for the testing dataset, showcasing a robust performance in AD prediction. The confusion matrices for the models across both datasets can be found in Table 3, highlighting an accuracy rate of 100% for the training dataset and 86% for the testing dataset. Additionally, we investigated potential interaction terms for synergistic effects. Significant interactions were discerned between Hexylbenzene and Ethylparaben (p = 0.031), Traumatic Acid and 2,6-Di-tert-butylbenzoquinone (Dk3970000) (p = 0.01), and benzene and 3-Methyl-2-cyclohexen-1-one (3360) (p = 0.026).
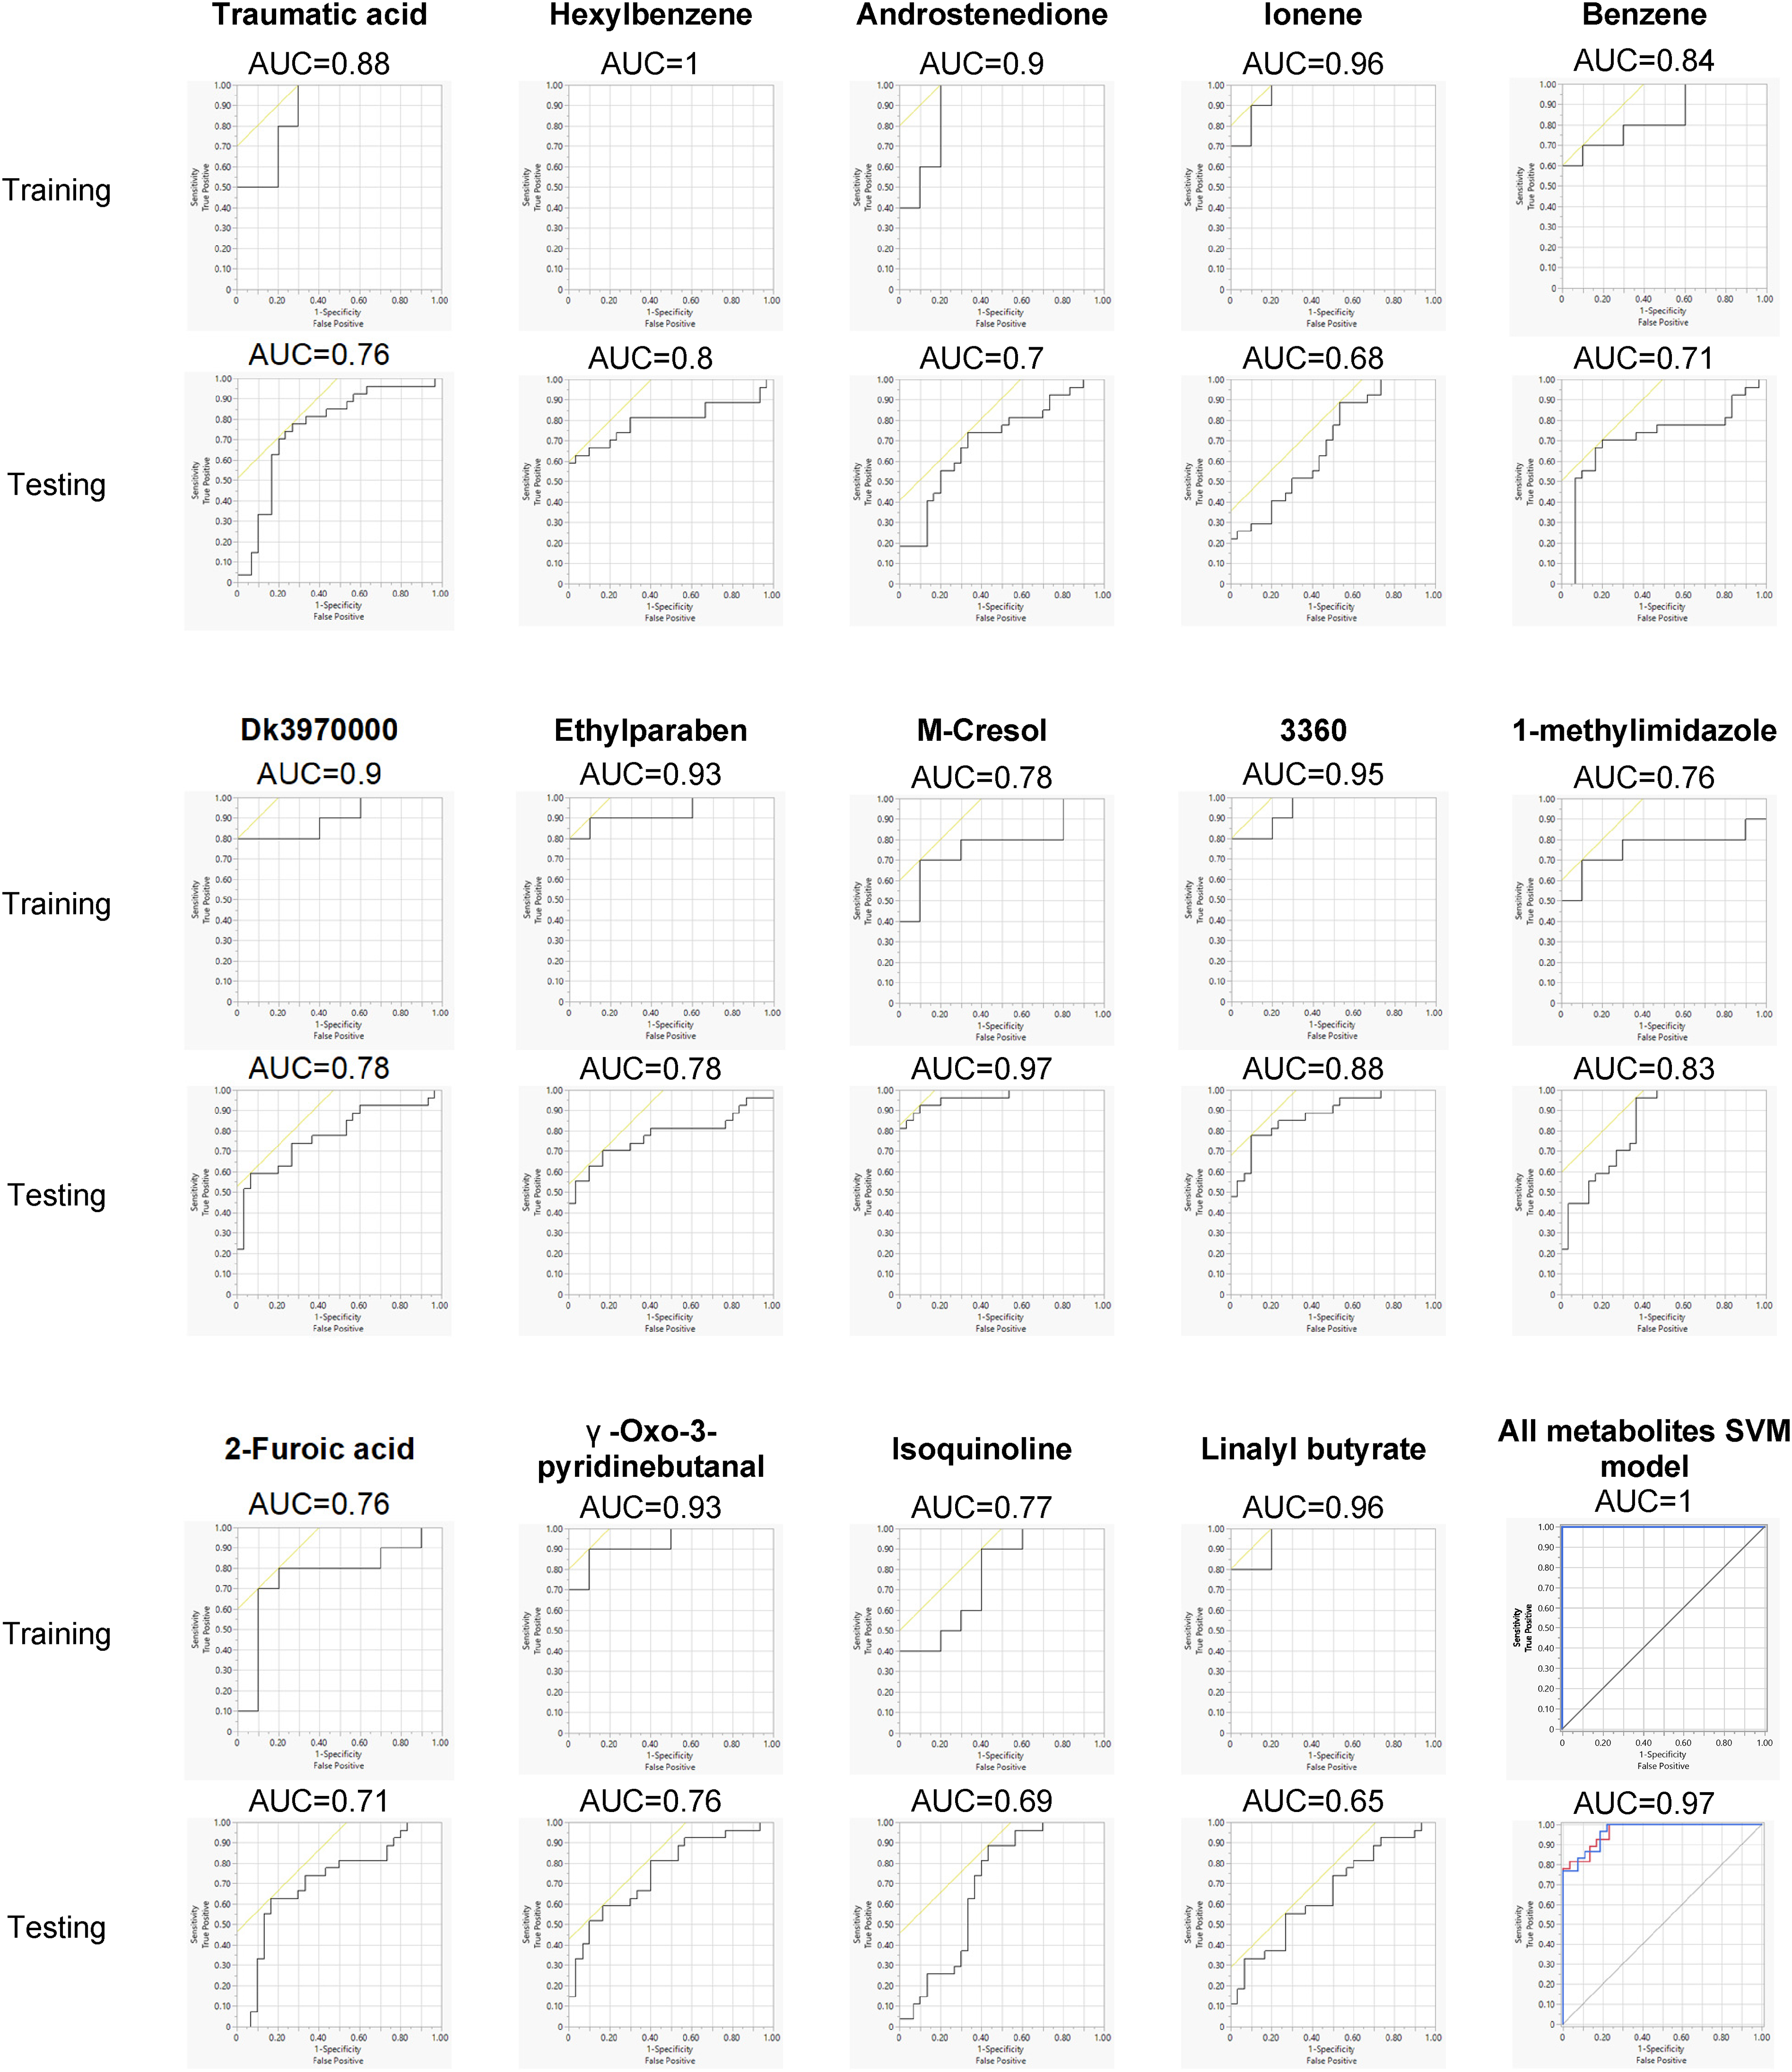
Performance of SVM classification model. Classification model with 14 metabolic features using the discovery dataset and tested with the verification dataset. The ROC and AUC of each individual metabolite and the combination of 14 features were shown.
Confusion matrices for the model in both datasets.
Associations of metabolites with gender
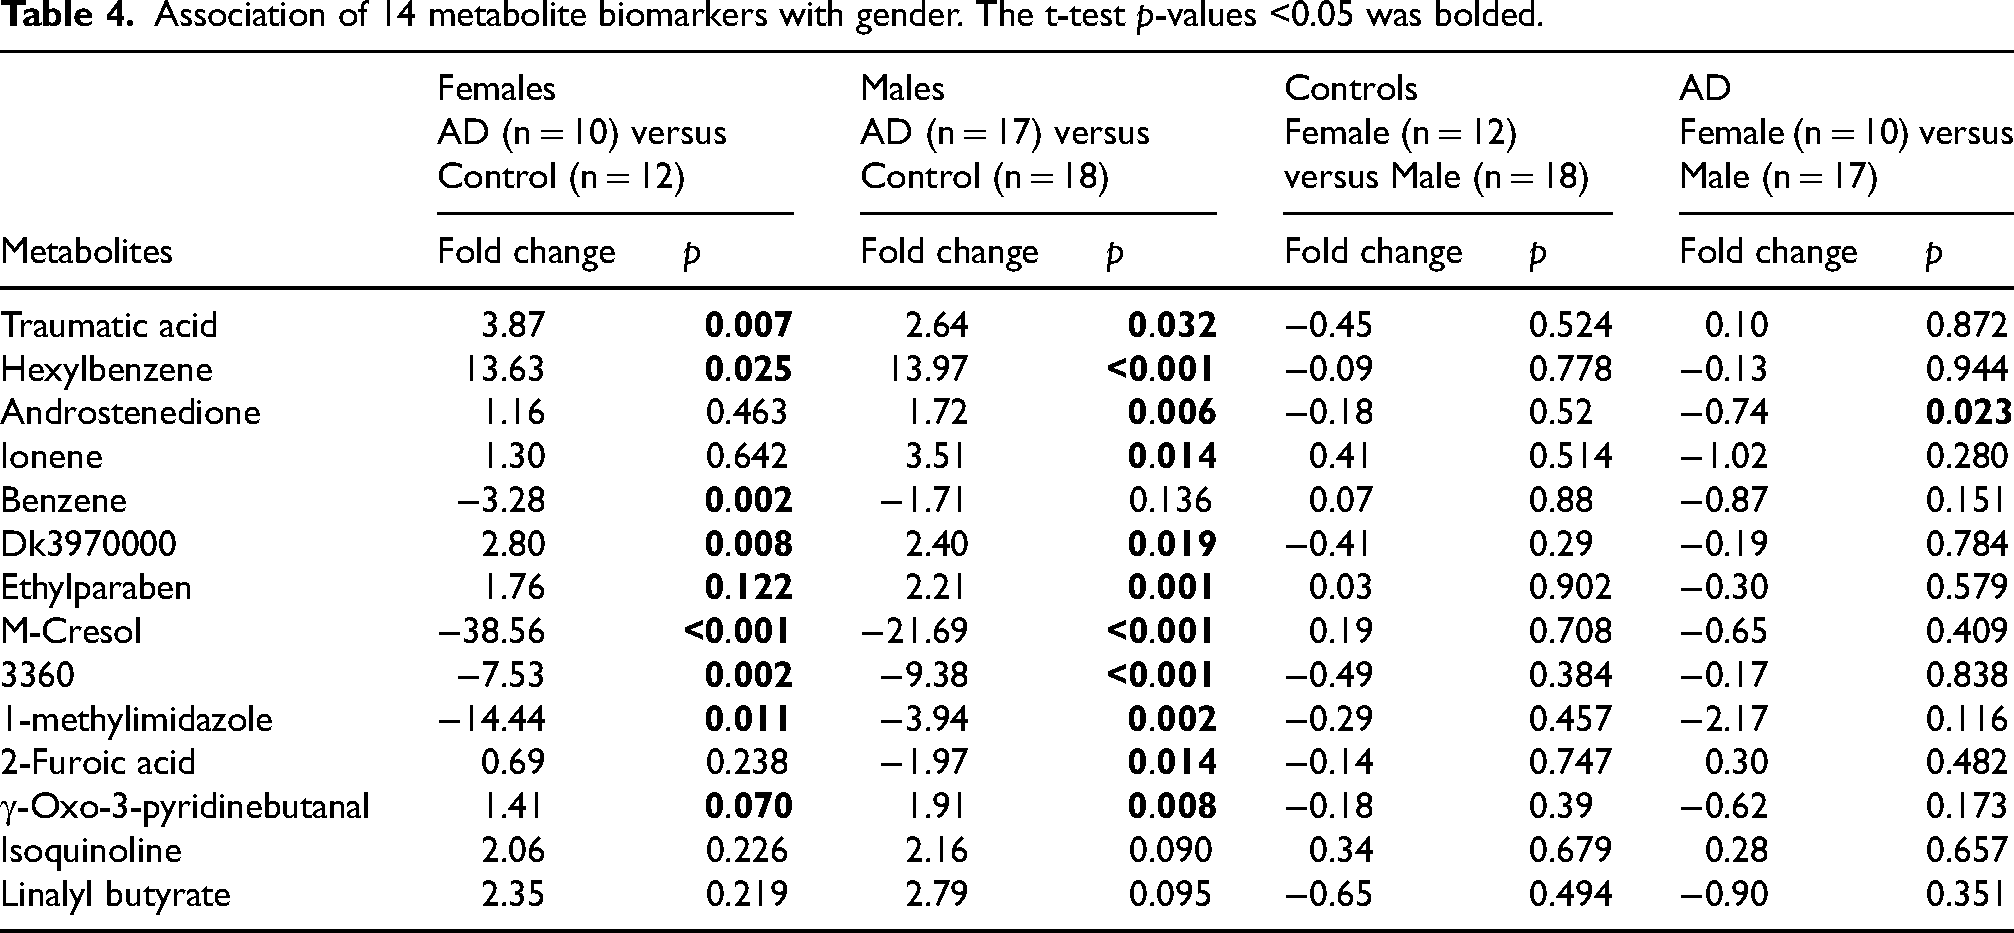
We stratified the AD group and cognitively unimpaired older adult group (control) by sex. As shown in Table 4, in the female group, nine out of the 14 metabolites significantly differed between AD and cognitively unimpaired older adults, and in the male group, 11 out of the 14 metabolites significantly differed between AD and cognitively unimpaired older adults. Some of the metabolite biomarkers were not found to be significant in each gender group, probably due to the reduced sample size. In the group of cognitively unimpaired older adults, the abundance of the 14 metabolites shows no significant difference between females and males. However, in the AD group, the level of androstenedione in male AD patients was significantly higher than in female AD patients. Taken together, androstenedione is the only biomarker within the biomarker panel that correlates with gender. We also noted that this analysis did not take into consideration whether any subjects were taking androstenedione or undergoing hormonal replacement therapy. Androstenedione is more commonly used by young athletes to improve performance, and our age groups would generally not fall into this category. Some women may have received hormonal replacement therapy; however, we do not know whether any of these patients received hormonal therapy, as TARCC did not collect this information. We will investigate this gender effect using a well-controlled cohort in the future.
Association of 14 metabolite biomarkers with gender. The t-test p-values <0.05 was bolded.
Classification with random forest
We used the discovery phase dataset to apply Breiman and Cutler's RF algorithm to analyze 157 metabolite features identified in the discovery and verification studies and identified 20 features based on importance. Table 5 shows the profiles of these 20 metabolites in the serum of AD patients and cognitively unimpaired older adults and their importance in the RF model. We examined the prediction error using the profiles of 20 metabolites. As shown in Figure 5A, in the discovery study, the model yielded 0.0% prediction error rate with top five features, and increasing the number of features did not change the error rate. The prediction error rate for the verification study was higher than the discovery rate. The error rate with the top five features was 17.5% and the lowest error rate was 12.3% with top 16 features. Next, we trained the model using the discovery dataset and tested the trained model with the verification dataset. In this analysis, the performance of the resulting models in disease classification was examined using ROC curves. Figure 5B shows the AUC of ROCs. As the number of features increased, the AUC improved and the model with 13 features yielded the highest AUC of 0.96. Among the 13 features, six are overlapped with the features of SVM model, including Hexylbenzene, 3-Methyl-2-cyclohexen-1-one (3360), γ-Oxo-3-pyridinebutanal, DK3970000, and Androstenedione.
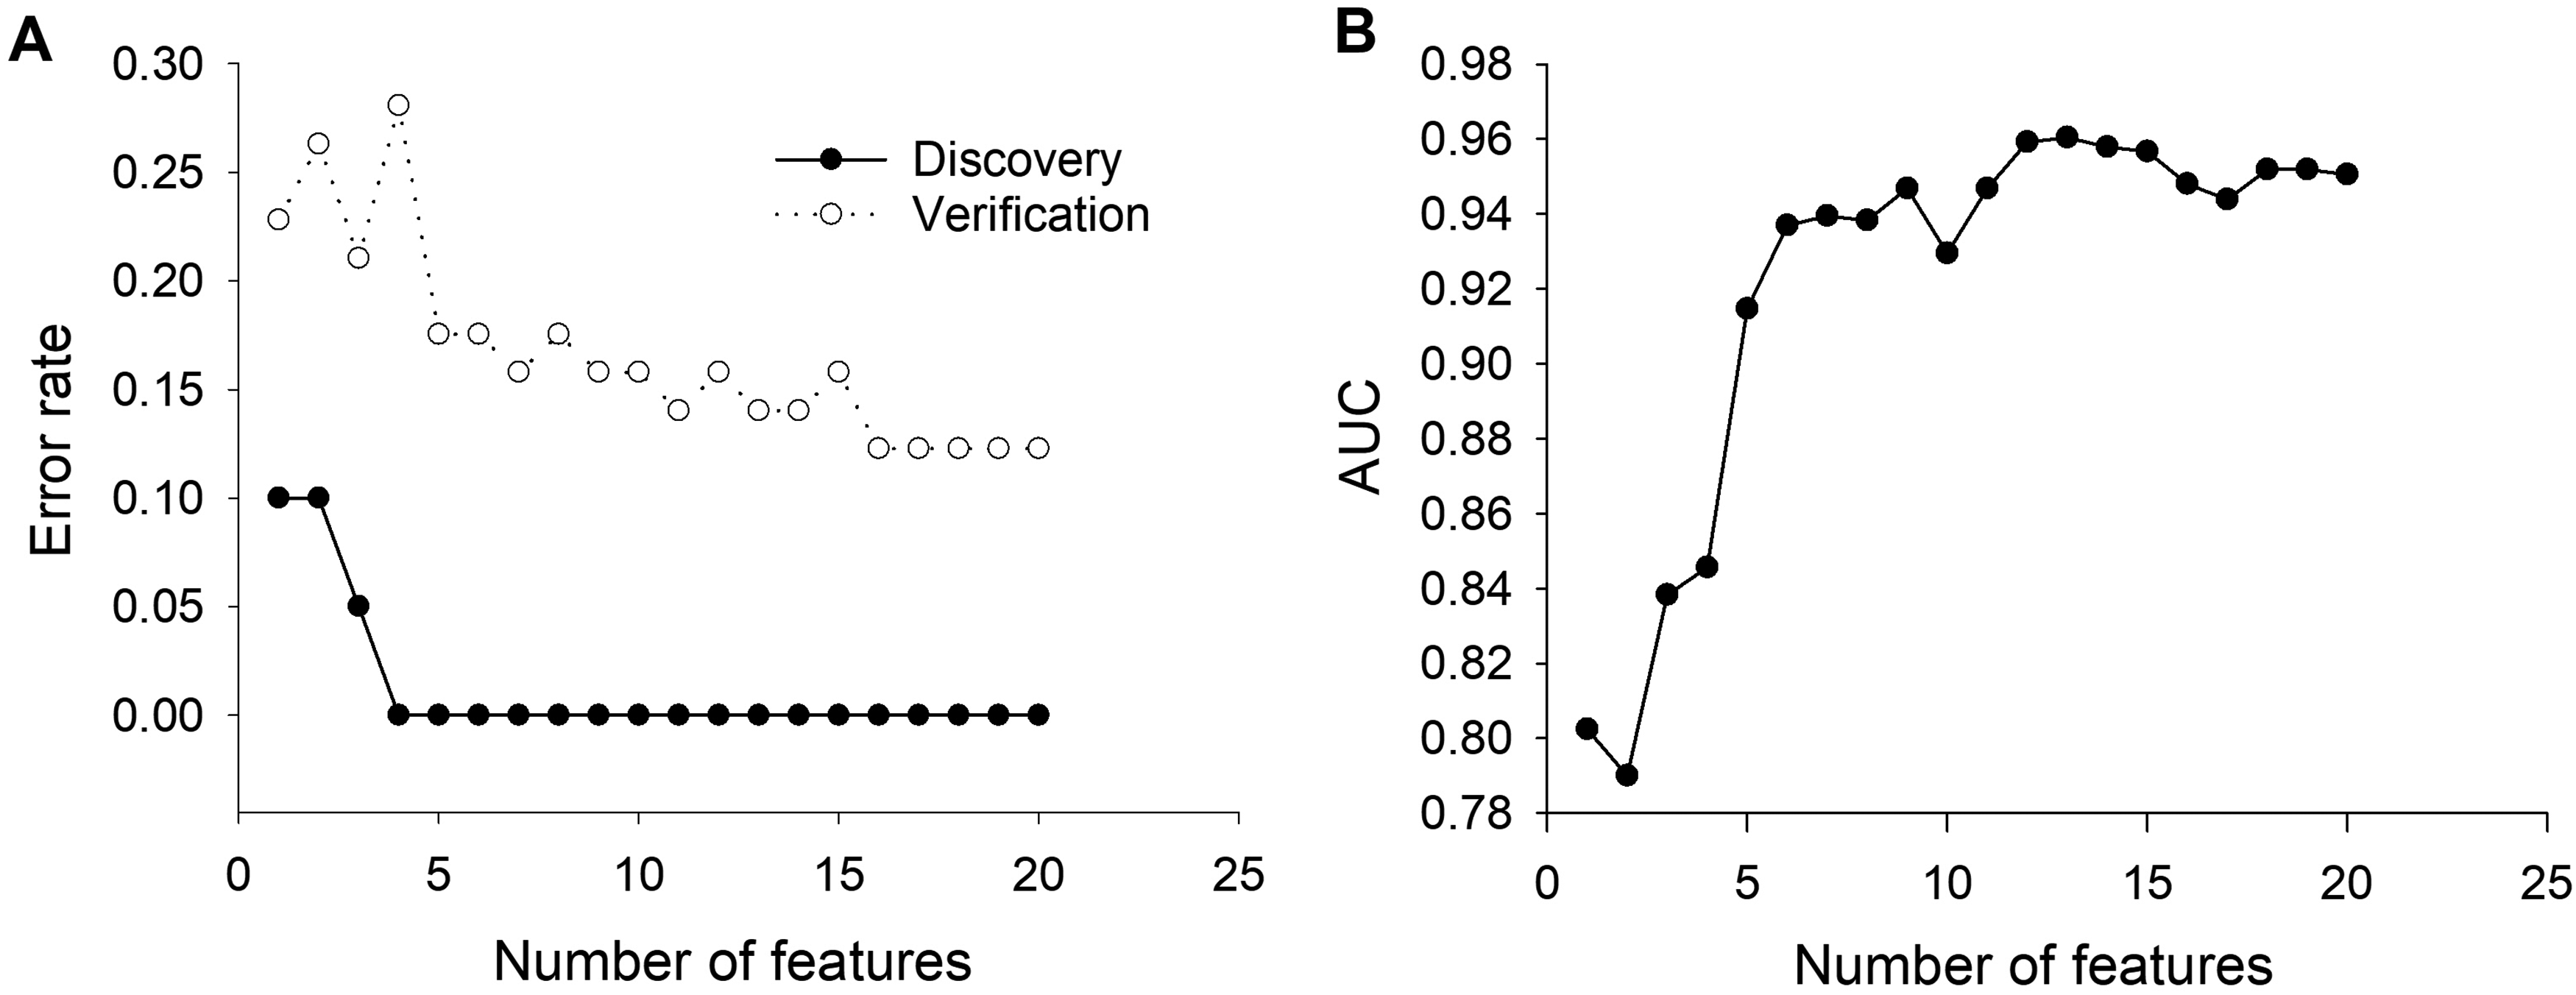
Performance of RF classification model. (A) Prediction error rate of RF model. (B) AUC of ROCs of RF model.
The profiles of biomarker candidates of RF model in the discovery and verification studies.
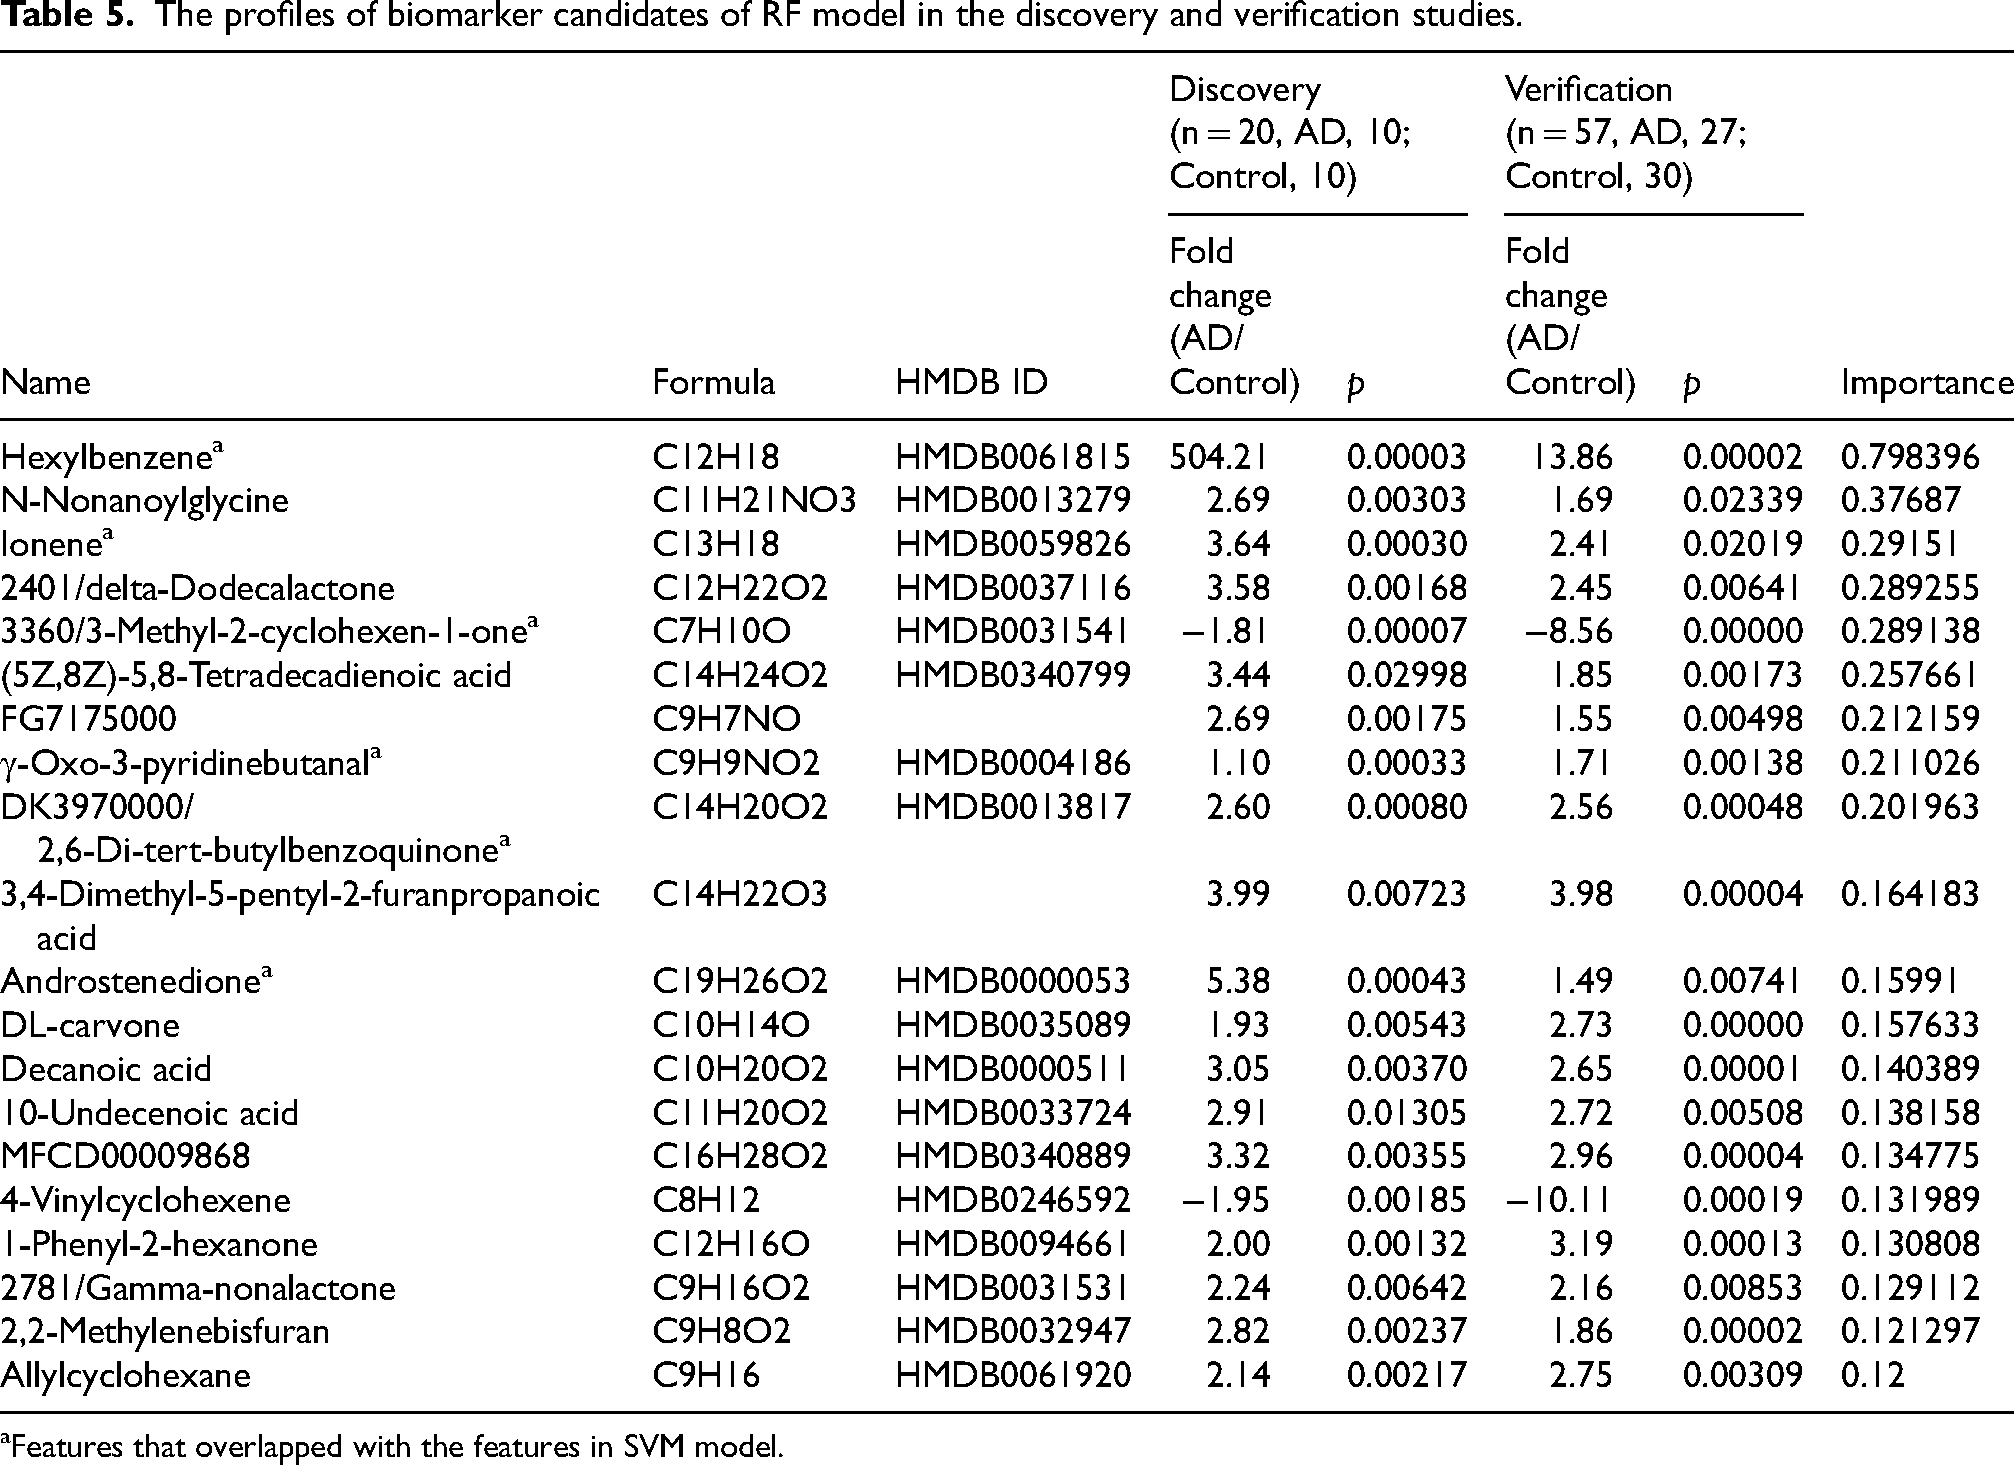
Features that overlapped with the features in SVM model.
Based on the chemical structures, the metabolites features in SVM and RF models can be grouped into benzenoids (benzene; m-cresol; ethylparaben, hexylbenzene, ionene), organoheterocyclic compounds (2-furoic acid; isoquinoline), prenol lipids (2,6-di-tert-butylbenzoquinone, 2,6-Di-tert-butylbenzoquinone; (R)-Carvone), sterol lipids (androstenedione), fatty acyls (traumatic acid, gamma-nonalactone; Decanoic acid; Undecylenic acid), lipids and lipid-like molecules (Linalyl butyrate), cyclohexenones (3-Methyl-2-cyclohexen-1-one), imidazoles (1-methylimidazole), and aryl alkyl ketones (gamma-Oxo-3-pyridinebutanal).
Classification with endogenous metabolites
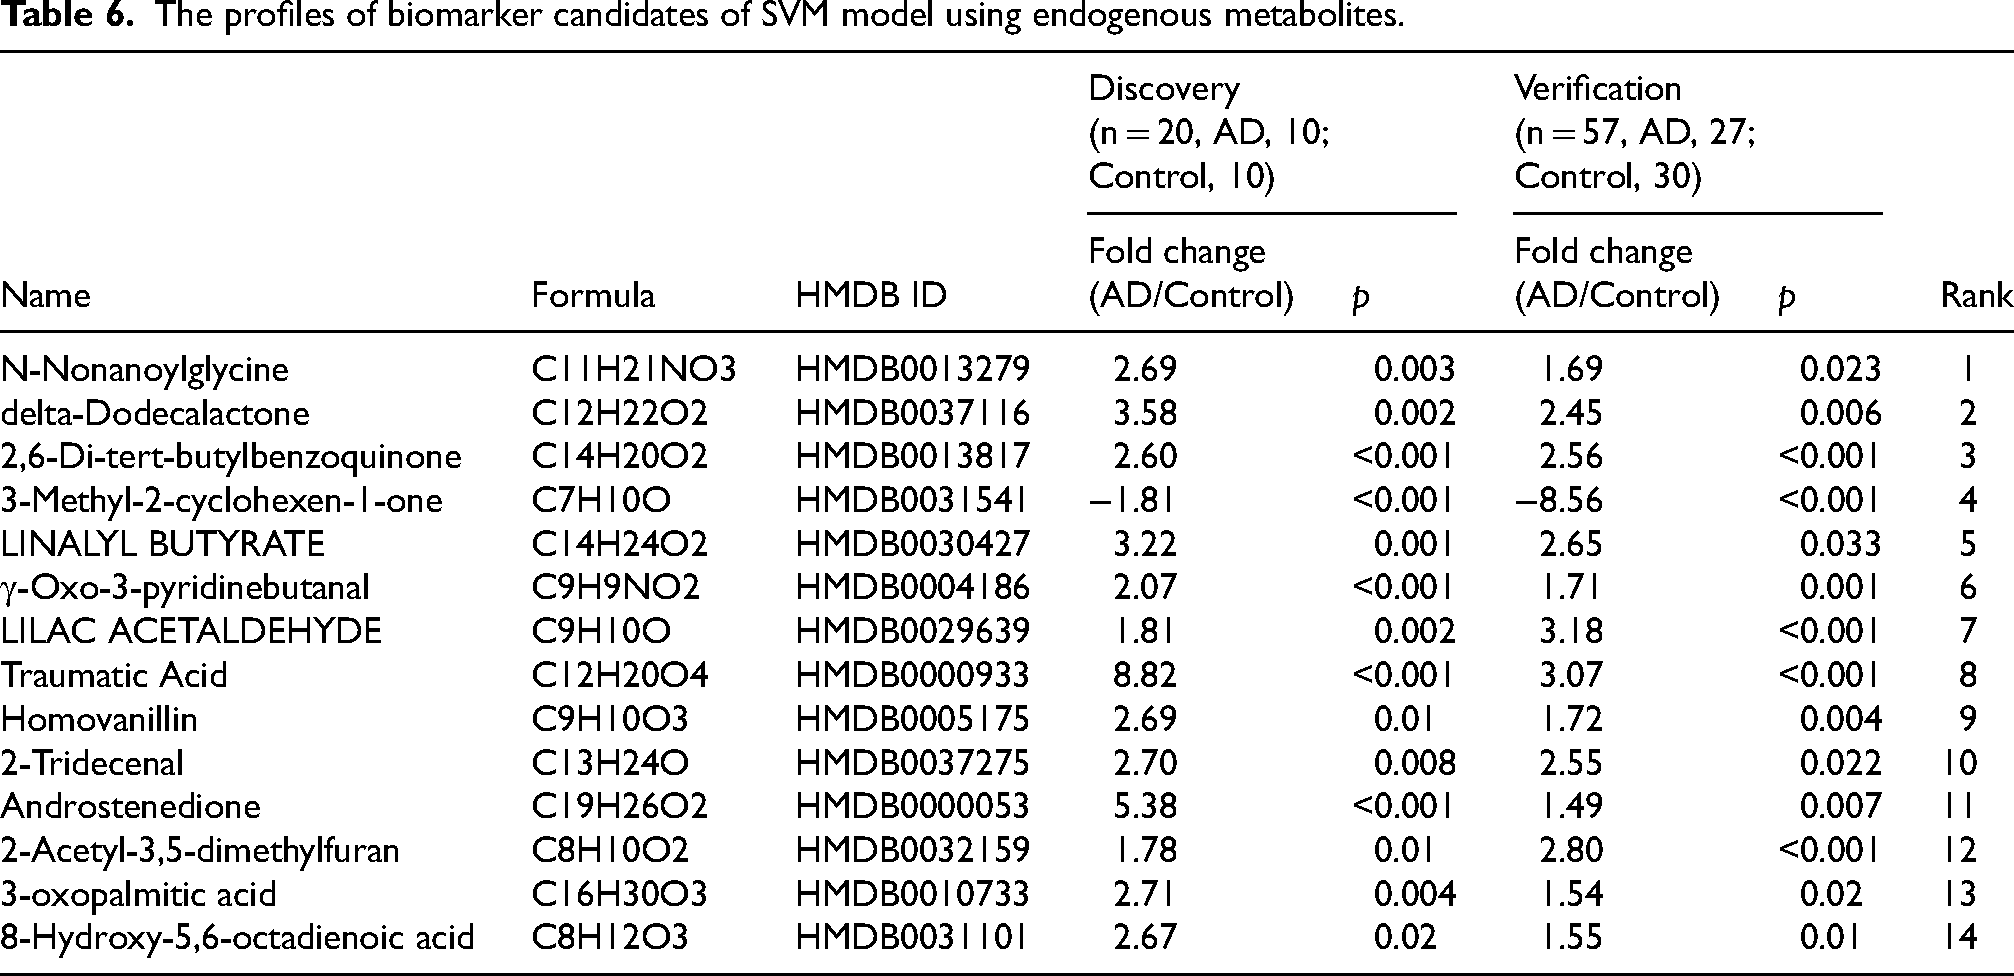
Some of the biomarkers in Tables 2 and 5 are either exclusive to plants or are not naturally occurring (exposome). The presence of these metabolites in human blood is due to diet or environmental exposure. Previous research has demonstrated that exogenous metabolites and environmental exposures play a substantial role in AD.37–42 This underscores the importance of identifying, quantifying, and characterizing the entire spectrum of endogenous and exogenous metabolites in AD biological specimen samples and examining the biochemical processes linked to AD onset and evolution. However, we are interested in exploring the feasibility of creating an effective computational model for diagnosing AD using only endogenous metabolites. We excluded metabolites that are exclusively from plants or are not naturally occurring based on the Human Metabolome Database (HMBD) ontology section (https://hmdb.ca). 43 The remaining 56 endogenous metabolites were utilized for computational modeling, with the discovery dataset serving as the training dataset and the verification dataset as the testing dataset. Initially, we employed the random forest algorithm to assess the importance of each metabolite. Subsequently, the top 14 metabolites (Table 6) were analyzed using the SVM algorithm. As shown in Figure 6, increasing the number of features improves the area under the curve (AUC) of receiver operating characteristics (ROC) and reduces the prediction error rate. The model with four features - N-Nonanoylglycine, delta-Dodecalactone, 2,6-Di-tert-butylbenzoquinone, and 3-Methyl-2-cyclohexen-1-one - exhibits the best AUC. Incorporating more features did not notably enhance the model's performance.
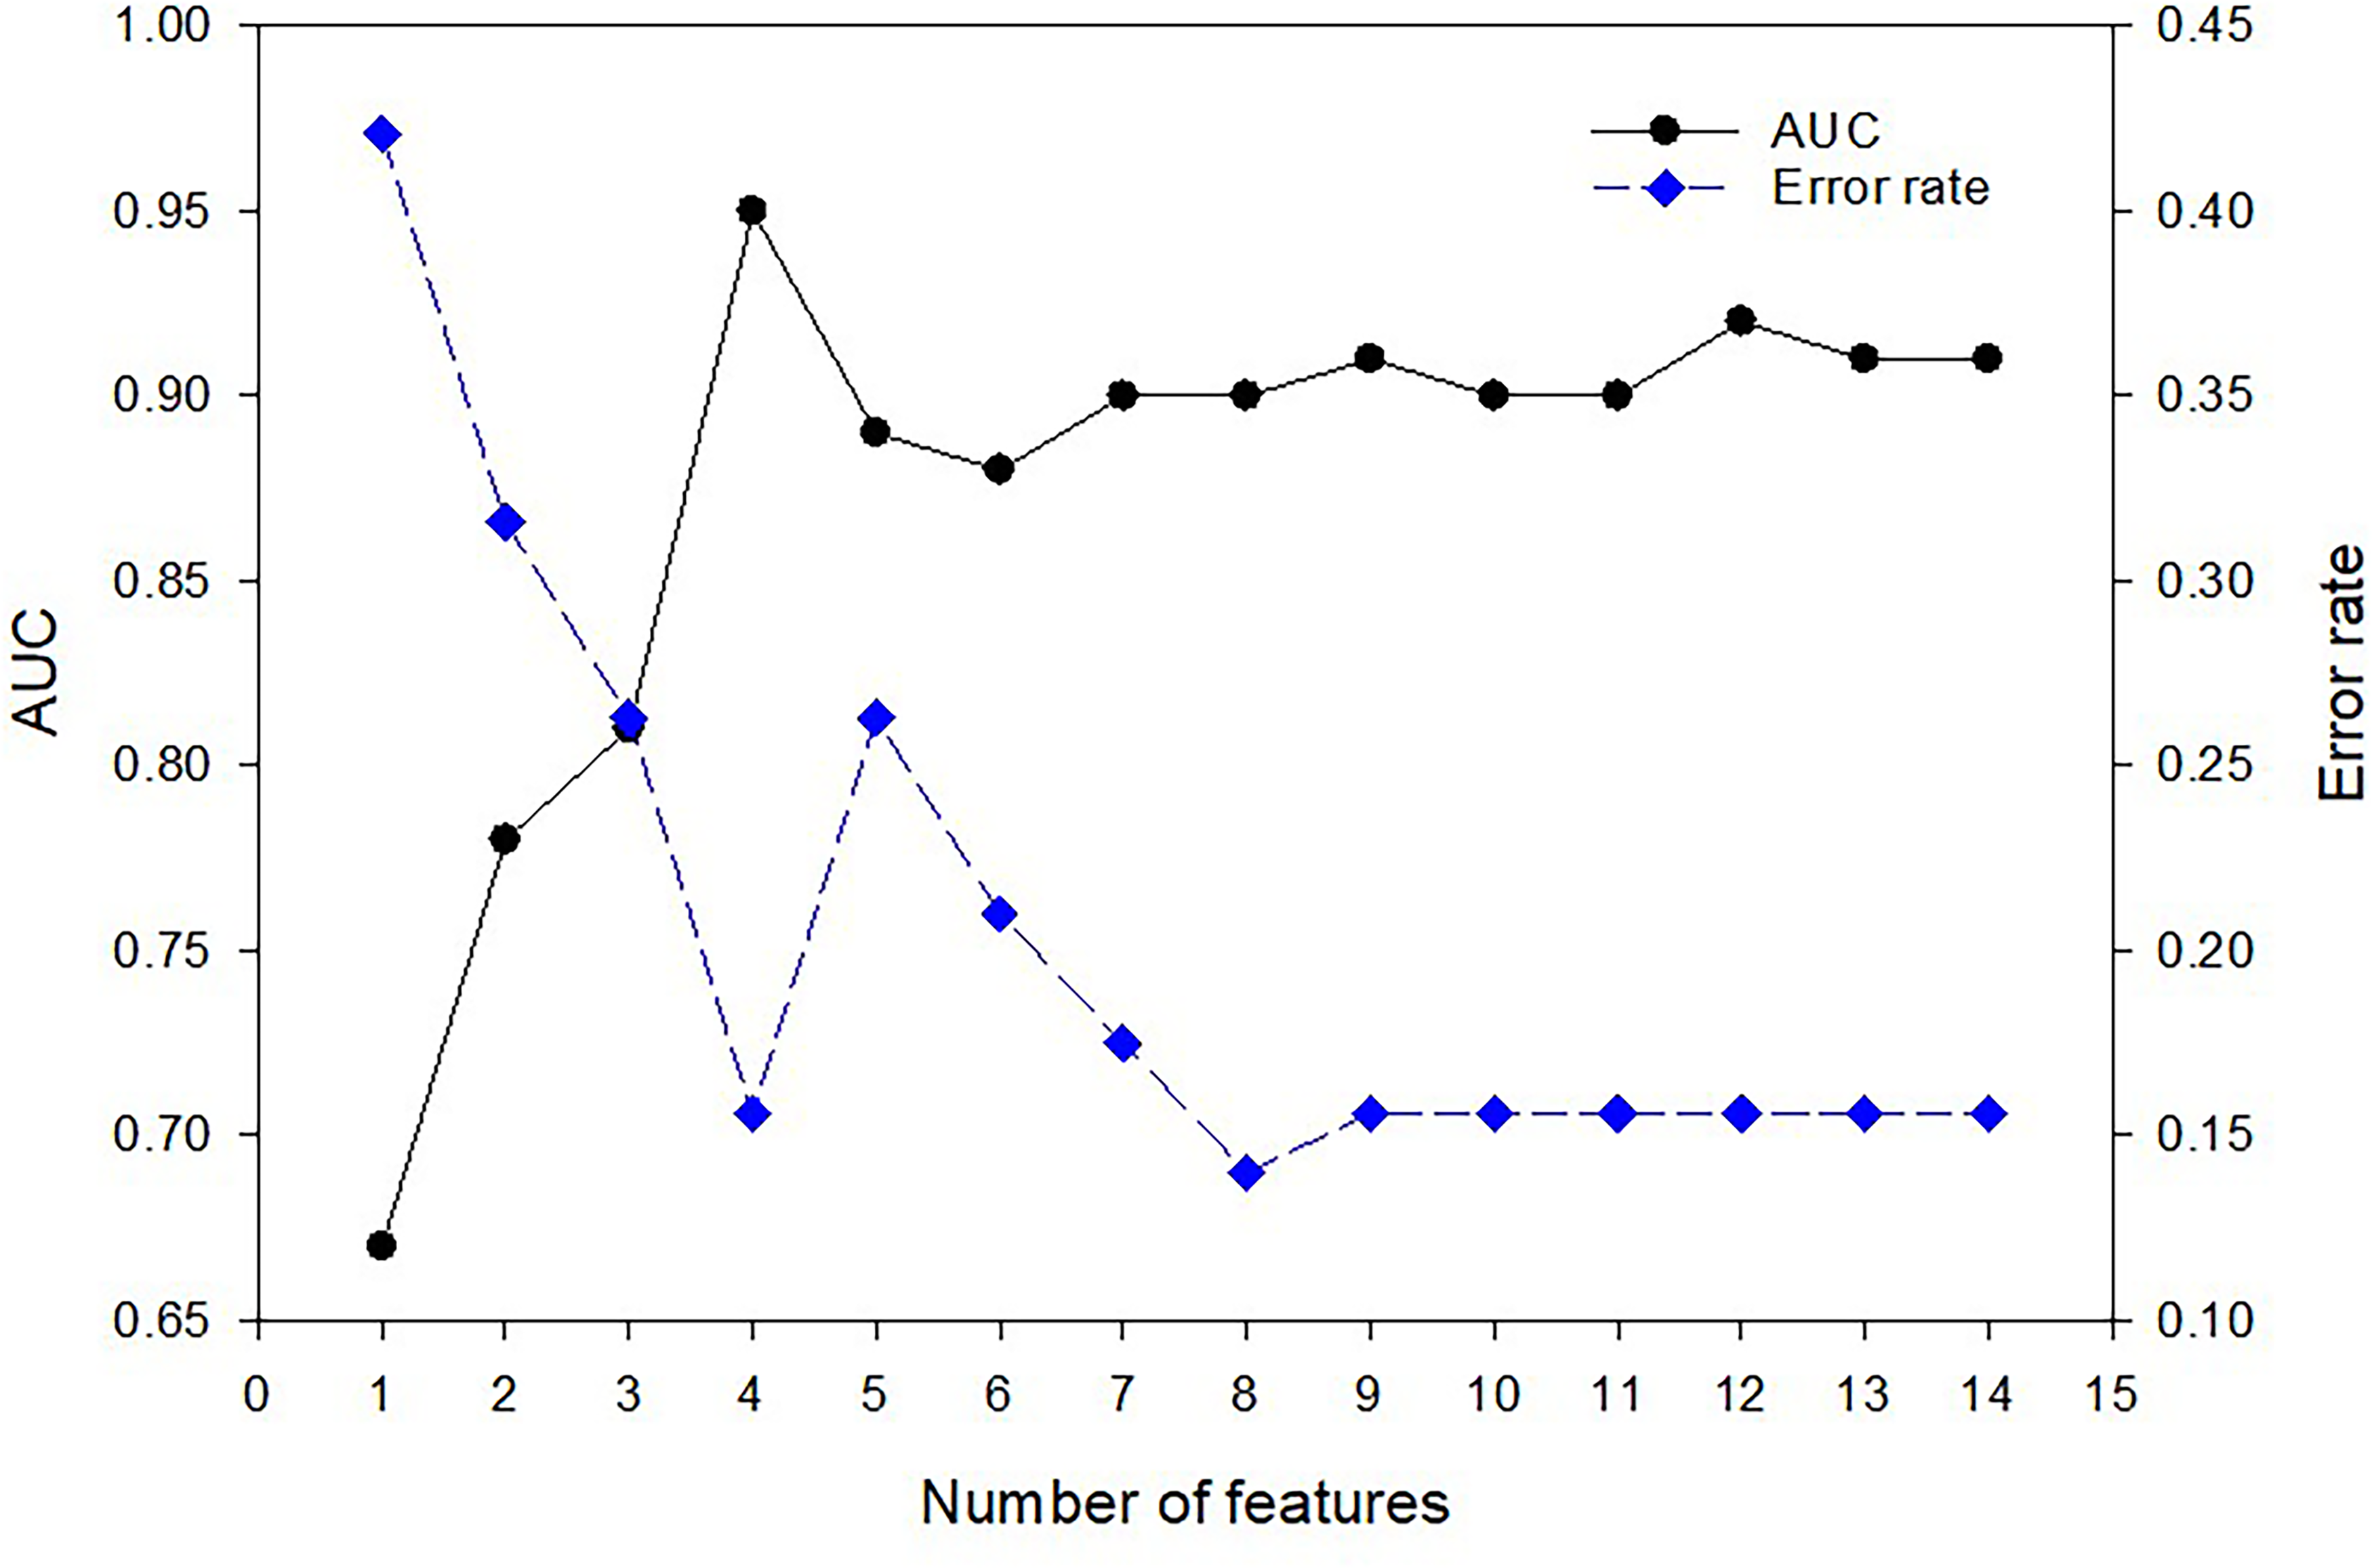
Performance of SVM classification model using endogenous metabolites. The AUC of ROCs and the prediction error rates are shown.
The profiles of biomarker candidates of SVM model using endogenous metabolites.
Discussion
Peripheral blood tests for AD have emerged as a more convenient alternative, especially for repeated sampling in clinical trials. 6 However, current blood-based tests, even those that assess Tau and Aβ levels, are limited by the scope of metabolites they can evaluate. This suggests the need for expanded paradigms of blood diagnostics for AD. The aim of this study is to discover novel blood biomarkers that could differentiate AD from cognitively unimpaired older adults with high specificity and sensitivity, laying the foundation for developing a blood diagnostic for AD. Accordingly, we integrated high-resolution mass spectrometry (HRMS)-based metabolomics technology and machine learning algorithms for developing biomarker identification and classification model. HRMS is one of the most commonly used technologies in metabolomics studies and offers excellent sensitivity and accuracy in metabolite identification.44,45 In recent years, classification with machine learning algorithms has been widely used to achieve diagnostic and prognostic goals.46–48 It is a data-driven approach where the algorithm is trained with labeled samples, each represented by a set of features, and the resulting classification model can predict the label of a sample from its features. In our study, the labels correspond to AD patients and cognitively unimpaired older adults, and the features are the abundance of metabolites in serum. The biomarker candidates that differentiated AD from cognitively unimpaired older adults were first identified using a discovery cohort, then these candidates were verified with a much larger verification cohort. In both discovery and verification studies, the dataset acquired in the discovery study was fed to the supervised machine-learning algorithms, and the resulting classification models were tested with the verification dataset. Because the number of significant metabolite features identified in the discovery and verification studies was larger than that which warrants further investigation, we performed feature reduction as commonly used in classification model development to narrow the list of potential biomarkers down to a more reasonable number by removing noisy data, redundant variables, or low-reproducible data. 49 The resulting 157 significant metabolite features were used for supervised machine learning. Both SVM and RF were performed, and each classifier selected a panel of biomarker candidates that accurately differentiated AD from cognitively unimpaired older adults. In comparison to newly discovered blood biomarkers for AD classification, our 14-metabolite SVM model or 13-metabolites RF model are accurately on par with the plasma p-tau181 (AUC = 0.85–0.98),50,51 plasma p-tau217 (AUC = 0.89–0.96), 52 a 19-protein panel (AUC = 0.96–0.98), 53 and outperformed a 5-metabolite panel (AUC = 0.84) 54 and a 2-metablites + age panel (AUC = 0.72). 55 Importantly, we rigorously validated the biomarker panels identified in this study using an independent set of samples and confirmed their excellent specificity and sensitivity in diagnosing AD.
Some of metabolic features identified by SVM and RF algorithms are overlapped, including Hexylbenzene, 3-Methyl-2-cyclohexen-1-one (3360), γ-Oxo-3-pyridinebutanal, DK3970000, and Androstenedione. Several studies previously identified potential plasma or CSF AD metabolic biomarkers classified as benzene and substituted derivatives.56–58 However, none of this study's five benzenoid biomarkers have been reported previously. Among the five benzenoids, Hexylbenzene has the best predictive power, given that the AUC of ROCs in the Discovery and Verification studies are 1.0 and 0.8, respectively. Hexylbenzene has been identified from healthy human body fluids. 59 Our study shows that hexylbenzene was significantly elevated in the serum of AD patients, and the mechanism linking increased hexylbenzene levels with AD requires further studies.
Androstenedione is a steroidal hormone that is naturally occurring and made in the gonads and adrenal glands of both sexes. It is the common precursor of male and female sex hormones and can be transformed into testosterone and estrogen depending on the tissue type. Our study found that androstenedione was elevated in the serum of AD patients. Interestingly, we found a significant sex- difference in the correlation between androstenedione level with cognitive capacity. In the female group, the abundance of androstenedione shows no significant difference between AD and cognitively unimpaired aged adults. In the male group, androstenedione level was significantly elevated compared to cognitively unimpaired aged adults. In addition, in the AD group, the level of androstenedione in male AD patients was significantly higher than in female AD patients. Vaňková et al. also found that the level of androstenedione in AD patients was elevated compared to healthy controls. 60 However, they found that androstenedione was higher in women with AD than controls but not in men. 60 This inconsistency may be because the level of androstenedione is sex and age-dependent, and there is a significant age difference between AD patients and healthy controls (73.7 versus 66.4) in Vaňková ‘s study. To further validate the sex difference in the correlation of androstenedione level with cognitive capacity, we will need to use a larger cohort with age-, sex-matched participants who are free of concomitant androstenedione disorders, such as hyperplasia, congenital adrenal hyperplasia, and polycystic ovary syndrome. Although the role of androstenedione in AD pathogenesis is not fully understood, an in vivo study shows that elevated serum androstenedione levels correlate with memory impairment. 61 Androstenedione administration altered performance within various domains measuring cognitive function. Specifically, it impaired spatial reference memory and the ability to maintain performance with increasing memory demand. 61
1-Methylimidazole was found to be lower in AD serum and a significant metabolite candidate in the SVM model of the discovery and verification study (Table 2; Table 4, Row 10). Recently, a link between 1-Methylimidazole and AD pathology was proposed. The connection points to how Aβ binds copper (II) with high affinity in its N-terminal region. 62 This is in line with earlier studies that reported the presence of Aβ-Cu interactions in the formation of toxic oligomers.63,64 In accordance with those previous reports, a recent study synthesized and characterized two new 1-methylimidazole-containing N-acylhydrazonic metallophores (X1TMP and X1Benz). X1TMP contained the 34,5-trimethoxybenzoyl moiety present in the structure of mescaline, a natural hallucinogenic protoalkaloid found in various species of cacti. X1TMP and X1Benz are novel 1-methylimidazole-containing N-acylhydrazones that may represent agents of the future in the treatment of AD. 65
We also identified isoquinoline to be higher in AD serum and to be a significant metabolite in the SVM model (Table 2; Table 4, Row 13). Protoberberines are the most studied of eight subgroups of isoquinoline alkaloids (IAs), where cholinesterase activity relevant to AD has been identified. The plant Berberis vulgaris is a known rich source of quaternary protoberberine alkaloids and acetylcholinesterase inhibitors berberine and palmatine. These have been extensively studied with regard to AD in the past decade and may hold novel therapeutic options for the future.66,67 In another study, Dauricine (DAU), a benzyl tetrahydroisoquinoline alkaloid isolated from the root portion of Menispermum dauricum DC was tested in an AD model. The study investigated the effects of DAU on Neuro2a (N2a) cells that were transfected with amyloid precursor protein (Swedish mutant). DAU treatment reduced AD-like pathology by inhibiting AβPP processing, reducing Aβ accumulation, and mitigating the hyperphosphorylation of tau via PP2A, p35/25, and CDK5 pathways. These findings suggest that DAU and other isoquinolines may have therapeutic utility in future AD treatment. 68
5,8 tetradecadienoic acid (Table 5, Row 6), was found to be a biomarker candidate in the RF model. An earlier study identified a panel of five plasma metabolites that allowed to differentiate between amnestic mild cognitive impairment (aMCI) and control subjects. The panel included 5,8 tetradecadienoic acid together with thymine, arachidonic acid, 2-aminoadipic acid, and N,N-dimethylglycine. In order to determine the exact role of 5,8 tetradecadienoic acid in MCI, additional comparative studies between AD, MCI, and healthy controls in serum and plasma will be necessary. 69
It has been demonstrated that the metabolism of medium chain fatty acids (MCFAs) containing 6 to 12 carbon atoms occurs in astrocytes. Octanoic acid (C8) and decanoic acid (capric acid) (C10) are the MCFAs that often play an important role in this. 70 Our study also identified decanoic acid as a biomarker candidate following the RF model analysis (Table 5, Row 13). In addition, it has been found that the supplementation of the same MCFAs C8 and C10 has shown a positive effect on cognition in human MCI and AD studies.71–73 Furthermore, a recent report showed an improvement in antioxidative status as well as a reduction in ROS levels in human (SH-SY5Y) and murine Neuro2a cells supplemented with phosphatidylcholine (PC) plus the addition of decanoic acid. 74 It has been proposed that decanoic acid, as well as other MCFAs may affect cell energetics by improving mitochondrial function. Also, the activation of peroxisome proliferator-activated receptor gamma (PPARγ) by decanoic acid has been shown to generate mitochondrial biogenesis and prevent neuronal death induced by glucose deprivation. 75 This evidence suggests that decanoic acid and other MCFAs may be effective in reducing oxidative stress, promoting neuronal health and improving cognition levels. Accordingly, we also found decanoic acid to be an associated biomarker candidate in our RF model for the discovery and verification studies. Overall, the significant associations with decanoic acid suggest that further studies should be performed in both models and in humans.
Our RF model also found 10-Undecenoic acid (undecylenic acid), a naturally occurring unsaturated fatty acid, to be a candidate biomarker (Table 5, Row 14). Recently, 10-Undecenoic acid was discovered to inhibit μ-calpain, a factor that bridges Aβ- and hyperphosphorylated tau-mediated pathways. It showed neuroprotective effects by inhibiting Aβ oligomerization and Aβ fibrillation. 10-Undecenoic acid reversed neuronal cell death induced by Aβ. Therefore, future studies that consider the mechanism of μ-calpain inhibition by 10-Undecenoic acid would be beneficial in order to determine if it is a feasible treatment option for the future. 76
4-Vinylcyclohexene (VCH) was another significant candidate biomarker found in the RF model (Table 5, Row 16). Studies have often used VCH and the 4-4-Vinylcyclohexene diepoxide metabolite (VCD) for induction of ovarian failure in mice. Importantly, both occupational chemicals have been identified as having carcinogenic potential based on studies conducted in mice and rats. Consequently, it was found that VCH and VCD caused ovarian follicle and uterine atrophy in mice exposed for 13 weeks. 77 Recently, VCD was utilized in a study that measured cognitive and neurological deficits in female APOE-TR mice who received a high-fat diet and had ovarian failure induced through VCD injections. They found that VCD-induced ovarian failure in conjunction with APOE4 homozygosity led to an increase in both cognitive and neurological deficits. 78 Another study conducted in APOE4 VCD-treated mice found improved recognition memory (NOR) (p < 0.05), but no change in spatial working memory (Y-maze) in mice that received DHA-enriched fish oil. 79 VCD (and VCH) application in AD menopause model studies in mice will require further and innovative designs in conjunction with APOE phenotype status. This will help to determine if genetic and occupational risk mechanisms are gender related in AD.
Traumatic acid, a fatty acid derivative, was first isolated and synthesized by English, Bonner, and Haagen-Smit in 1939. 80 It is a known wound hormone which causes parenchymatous tissues in plants (bean pods and potato tubers) to proliferate. 81 Recently, Traumatic acid was tested in cytotoxicity assessments in which it was found that it may act as a compound that delays the stimulatory effect of pesticides on breast cancer cells.81,82 In our study, the biological significance of Traumatic acid could be diet related. However, more specifically designed studies will be required in order to determine if our finding is associated with the consumption of Traumatic acid found in food sources.
This study lays the foundations for future multi-site analytical and clinical validation of these biomarkers and classification models. Once validated with larger sample sets covering a broad patient population, this panel and classification model will enable timely diagnosis of AD objectively and quantitatively so that clinicians can start therapeutic intervention early and monitor the efficacy of treatment. One limitation of this study is that we did not examine whether this biomarker panel can differentiate AD from other types of dementia, such as behavioral variant frontotemporal dementia or vascular dementia, or whether there are phenotypes- and genotype-difference in the performance of this classification model. We will study this topic in future studies. Another limitation is the slight gender difference between the groups (60% women in the control group versus 40% women in the AD group). It is hoped that future studies conducted in a larger and more carefully selected “n” could help to address this discrepancy given that these valuable samples were generously provided to us by a collaborative bio-banking facility.
Footnotes
Acknowledgments
We would like to thank the Texas Alzheimer's Research and Care Consortium (TARCC) for providing the serum samples.
Author contributions
Yingxin Zhao (Conceptualization; Data curation; Methodology; Software; Validation; Writing – original draft; Writing – review & editing); Alejandro Villasante-Tezanos (Data curation; Methodology; Software; Writing – original draft; Writing – review & editing); Ernesto G Miranda-Morales (Investigation; Methodology; Writing – original draft; Writing – review & editing); Miguel Pappolla (Conceptualization; Funding acquisition; Validation; Writing – original draft; Writing – review & editing); Xiang Fang (Conceptualization; Funding acquisition; Validation; Writing – original draft; Writing – review & editing).
Funding
This work was supported by National Institutes of Health Grants NIA (1R01AG077253) (to YZ), NIA (1R21AG066060) (to XF and MAP), NIA R61AG075725 (to XF), Texas Alzheimer's Research and Care Consortium (TARCC) research grant (to XF), and John Sealy Distinguished Chair in Alzheimer's diseases (XF).
Declaration of conflicting interests
The authors declared no potential conflicts of interest with respect to the research, authorship, and/or publication of this article.
Data availability
The data supporting the findings of this study are available within the article.