
Abstract
Background:
Histopathologic studies of Alzheimer’s disease (AD) suggest that extracellular amyloid-β (Aβ) plaques promote the spread of neurofibrillary tau tangles. However, these two proteinopathies initiate in spatially distinct brain regions, so how they interact during AD progression is unclear.
Objective:
In this study, we utilized Aβ and tau positron emission tomography (PET) scans from 572 older subjects (476 healthy controls (HC), 14 with mild cognitive impairment (MCI), 82 with mild AD), at varying stages of the disease, to investigate to what degree tau is associated with cortical Aβ deposition.
Methods:
Using multiple linear regression models and a pseudo-longitudinal ordering technique, we investigated remote tau-Aβ associations in four pathologic phases of AD progression based on tau spread: 1) no-tau, 2) pre-acceleration, 3) acceleration, and 4) post-acceleration.
Results:
No significant tau-Aβ association was detected in the no-tau phase. In the pre-acceleration phase, the earliest stage of tau deposition, associations emerged between regional tau in medial temporal lobe (MTL) (i.e., entorhinal cortex, parahippocampal gyrus) and cortical Aβ in lateral temporal lobe regions. The strongest tau-Aβ associations were found in the acceleration phase, in which tau in MTL regions was strongly associated with cortical Aβ (i.e., temporal and frontal lobes regions). Strikingly, in the post-acceleration phase, including 96% of symptomatic subjects, tau-Aβ associations were no longer significant.
Conclusions:
The results indicate that associations between tau and Aβ are stage-dependent, which could have important implications for understanding the interplay between these two proteinopathies during the progressive stages of AD.
INTRODUCTION
Alzheimer’s disease (AD) is currently characterized by two key proteinopathies: intracellular neurofibrillary tau tangles and extracellular amyloid-β (Aβ) plaques [1, 2]. Under the new National Institute on Aging-Alzheimer’s Association (NIA-AA) guidelines [3], the presence of both neuropathological hallmarks of AD is necessary for the diagnosis of the disease, and unimpaired individuals with aberrant Aβ and tau pathologies should be characterized as preclinical AD. The traditional view of the AT(N) biomarker framework [4] is often interpreted as Aβ being the initiator of the disease, followed by tau accumulation and, subsequently, neurodegeneration. The new guidelines specifically emphasize that “The AT(N) biomarker system does not imply a specific order of events nor does it imply causality” [3, 5]. This is because recent postmortem and imaging studies show that both early Aβ-only and tau-only individuals are prevalent in the asymptomatic population [6], and both proteinopathies can be found in up to 30% of the asymptomatic but older population [7–9]. Furthermore, the early stages of tau deposition in the transentorhinal cortex are commonly observed in older healthy subjects (aged > 60), while the spread of tau to neocortical areas is usually complemented by the presence of Aβ plaques [10]. Previous studies also propose two stages of tau deposition: the age-related stage and the pathological stage. The accumulation of tau pathology as a result of aging is limited to the medial temporal lobe (MTL) and does not spread to the isocortical Braak stages [11]. On the other hand, the pathological stage of tau is not restricted to the MTL region and is accompanied by the presence of Aβ plaques [11]. Altogether, this evidence suggests that perhaps there is an early-stage association between these two pathologies. However, the main challenge of assessing this association between Aβ and tau pathologies lies in their spatially distinct initiation and to some extent progression [12, 13]. Tau accumulation initiates in the locus coeruleus and entorhinal/perirhinal cortex, where negligible Aβ pathology is found [14], whereas Aβ accumulates throughout the cingulate, medial parietal, and prefrontal cortices, where negligible tau pathology is located in the early stages of tau deposition [15, 16]. Our aim is to understand the associations between these two AD proteinopathies in remote (spatially distinct) brain regions at different stages of the disease, especially in the early stages when no spatial overlap occurs.
We have previously shown that co-localized AD pathologies in default mode network regions are more reliable predictors of the conversion of healthy control (HC) or mild cognitive impairment (MCI) subject to MCI and AD patients, respectively [17]. However, overlapping Aβ and tau pathologies do not occur during the early stage and cannot explain the initial interaction between the two pathologies. In a separate study, we showed that sub-threshold accumulation of Aβ was associated with the increased cortical thickness in many regions, including MTL, where the initial accumulation of tau occurs [18]. The increase in cortical thickness was associated with early Aβ deposition and up to some level with early tau accumulation. So, our novel hypothesis is that the mechanisms underpinning the Aβ-tau association are stage-dependent and might be different in the early stage of the disease versus the later stage where the decrease in cortical thickness has been reported [19–21]. To our knowledge, investigating the remote association between two pathologies during the early stage of the disease and, in comparison, to the later stage of the disease has not been done at the region-specific level by statistical model-based analysis. In addition, early accumulation of Aβ and tau in the brain is also considered a normal aging biomarker, which makes their disentanglement from preclinical AD a real challenge in the field. The differential degree of association between Aβ and tau in preclinical AD versus normal aging population may also help discriminate the two pathologies.
In this study, we use tau and Aβ positron emission tomography (PET) to accurately quantify the regional tau and Aβ uptakes and consequently can assess their inter-regional and remote association, particularly between tau in MTL and cortical Aβ. We use multiple linear regression to model a region’s tau uptake in terms of remote regions Aβ when age, gender, intracranial volume (ICV), and co-localized (local) Aβ are controlled. Using 144 young, healthy samples (aged 20–39), we expanded the frequency-based method developed by Lee et al. [22] to sort our large cohort of old participants (572 subjects aged 67.11±6.08 years, including 476 HC, 14 with MCI, and 82 with mild AD) from early to later stages of the disease. Our large sample size made it possible for us to investigate the tau-Aβ associations in four different phases of the tau progression. Our findings will help to provide a comprehensive understanding of the remote associations between Aβ and tau pathologies from the early to later stages of the disease.
METHODS
Participants
Five hundred and seventy-two older (age 67.11±6.08 years, 342 females) from Weill Cornell Medicine and Columbia University’s Irving Medical Center. This older cohort included 476 HC, 14 MCI, and 82 mild AD participants who underwent 3T T1-weighted structural MRI, Aβ-PET (18F-Florbetaben for HC and 18F-Florbetapir for MCI or mild AD), and harmonized 18F-MK6240 tau-PET scans within 12 months (Table 1). All participants gave informed consent to participate in their respective studies, and the local institutional review boards approved all recruitment/enrollment procedures and imaging protocols. The subjects underwent medical and neuropsychological evaluations to confirm they had no neurological or psychiatric conditions, cognitive impairments, major medical illnesses, or any contraindications based on structural images. The patients with MCI or mild AD had Mini-Mental State Examination scores ranging between 18 and 28, a Clinical Dementia Rating of 0.5 (MCI) or 1.0 (mild AD), and the presence of a biomarker associated with AD (either a positive Aβ-PET scan or cerebrospinal fluid analysis showing positivity for Aβ42, tau, and phospho-tau protein181).
Subject demographics in this study
HC, healthy control; MCI, mild cognitive impairment; M, male, F, female; PET, positron emission tomography; Aβ, amyloid-beta; Aβ+, amyloid-beta positive; Aβ–, amyloid-beta negative.
To define cut-points most accurately, which region would be considered Aβ–or tau-positive, in this study, we included data from a separate cohort of 144 younger HC subjects. As shown in Table 1, younger subjects had either 18F-MK6240 tau-PET (47 subjects with age 29.36±4.73, 27 females) or 18F-Florbetaben Aβ-PET (97 subjects with age 27.64±3.23, 55 females) scan and a 3T T1-weighted structural MRI scan. These young healthy subjects were a normative reference group to generate the region-specific cut-points.
Image acquisition protocols
For tau-PET, all subjects were injected with 185 MBq (5 mCi)±20% (maximum volume 10 mL) of 18F-MK6240 before imaging that was administered as a slow single IV bolus at 60 s or less (6 s/mL max. Imaging was performed as six 5-min frames for a 30-min PET acquisition, 90–120 min post-injection).
For Aβ-PET, subjects underwent 18F-Florbetaben or 18F-Florbetapir PET scans. This scan consisted of four 5-min frames over 20 min of acquisition, starting 50 min for the 18F-Florbetapir and 90 min for 18F-Florbetaben tracers after injection of 8.1 mCi±20% (300 MBq), which was administered as a slow single IV bolus at 60 s or less (6 s/mL max).
MRI scans at 3T with a 3D volumetric T1 magnetization-prepared rapid gradient-echo sequence were performed. Each subject first underwent a scout localizer to determine the position and set the field of view and orientation, followed by a high-resolution T1 image with TR/TE = 2300–3000/2.96–6.5 ms, flip angle = 8–9°; field of view = 25.4–26 cm, and 165–208 slices with 1 mm thickness.
Neuroimaging preprocessing
All MRI scans were processed with FreeSurfer 7.1.0 (http://surfer.nmr.mgh.harvard.edu) for automated segmentation and cortical parcellation (e.g., including segmentation and creation of an average gray matter mask) [23, 24] to derive regions of interest (ROIs) in each subject’s native space using the Desikan–Killiany atlas [25]. These ROIs were utilized for calculating Aβ- and tau-PET regional measures. The Aβ and tau regional standardized uptake value ratio (SUVR) were calculated by normalization to cerebellum grey matter. ROIs of this study are based on 68 cortical regions of the Desikan-Killiany atlas.
As previously published, the fully automated in-house pipelines were utilized to process the Aβ and tau PET images [26–30]. Both Aβ- and tau-PET dynamic frames (six frames in tau-PET and four in Aβ-PET) were aligned to the first frame using rigid-body registration and averaged to generate a static PET image. Next, the structural T1 image in FreeSurfer space was registered to the same subject’s PET composite image using normalized mutual information and six degrees of freedom to obtain a rigid-body transformation matrix. Finally, the SUVR value for Aβ was converted to centiloid standard values due to different tracers in Aβ-PET data [31].
To detect the Aβ+ subjects, we generated the global cortical Aβ (based on centiloid), including frontal, parietal, temporal, anterior cingulate, posterior cingulate, and precuneus ROIs [32–34]. Using our previous study method [18], we calculated the normal distribution of global Aβ values in the young comparison cohort. We chose to define cut-points using a young cohort rather than an older cohort, as our research question focused on determining whether individuals exhibited abnormalities irrespective of their preclinical or clinical stages [35]. Finally, using the 95th percentile of the fitted normal distribution, we calculated the cut-point for defining abnormal global Aβ. We defined the cut-point of centiloid equal to 28 for global abnormality to separate the subjects into positive and negative groups. By generating the same regions of interest for older subjects and utilizing the cut-point, we identified the Aβ+ subjects in the older population.
Regional cut-points for tau progression
Off-target binding of 18F-MK6240 tau tracer in meningeal has a significant impact on the cortical uptake of tau-PET imaging [36]. In this study, we extended our previous study [18] and developed a technique to calculate regional cut-points for each cortical region of tau deposition relative to deposition in the normative young reference group. We used this regional cut-point to define the different stages of tau accumulation and categorize the subjects by considering the regional positivity and spatial distribution of tau protein. To determine the regional cut-points using the selected atlas (Desikan Killiany) with 68 cortical regions, we calculated the normal distributions of the normative reference group regional tau. Then for each region, we determined the 95th percentile of the fitted normal distribution as regional cut-points. The regional cut-points for tau based on the Desikan Killiany atlas and normative reference group vary between about 0.9 to 1.3. Thus, the regions closer to the meningeal off-target binding have higher cut-point values, and the regions far from the meningeal of target binding will have lower cut-point values (Supplementary Figure 1). Notably, we implement the same method to define the regional cut-point for Aβ uptake and use these cut-points only to visualize Aβ spatial distribution in different groups of subjects.
Pseudo-longitudinal categorization of the elderly subjects
We expanded upon the frequency-based method introduced by Lee et al. [22] to define four phases of tau progression (no-tau, pre-acceleration, acceleration, and post-acceleration) by utilizing regional cut-points derived from a normative young cohort. We used the regional cut-point to define the different stages of tau progression and categorize the subjects by considering the regional positivity and spatial distribution of tau deposition. We first determined the number of regions in each subject that exceeded the regional cut-point, which was defined compared to the normative young cohort. Then, we ordered the subjects based on the regions that exceeded the regional cut-points from 0 to 68 (x-axis in Fig. 1). Regions were also sorted by the frequency at which the regional cut-point was reached across all subjects to define a regional tau spreading order (y-axis in Fig. 1). In this way, we constructed a pseudo-longitudinal order for tau progression in AD. For example, regions in which many subjects were tau positive in the cohort (including normal subjects), such as the entorhinal cortex, were considered early in the disease; on the other hand, regions in which only a few subjects had tau positivity were considered late in the disease (i.e., frontal lobe).
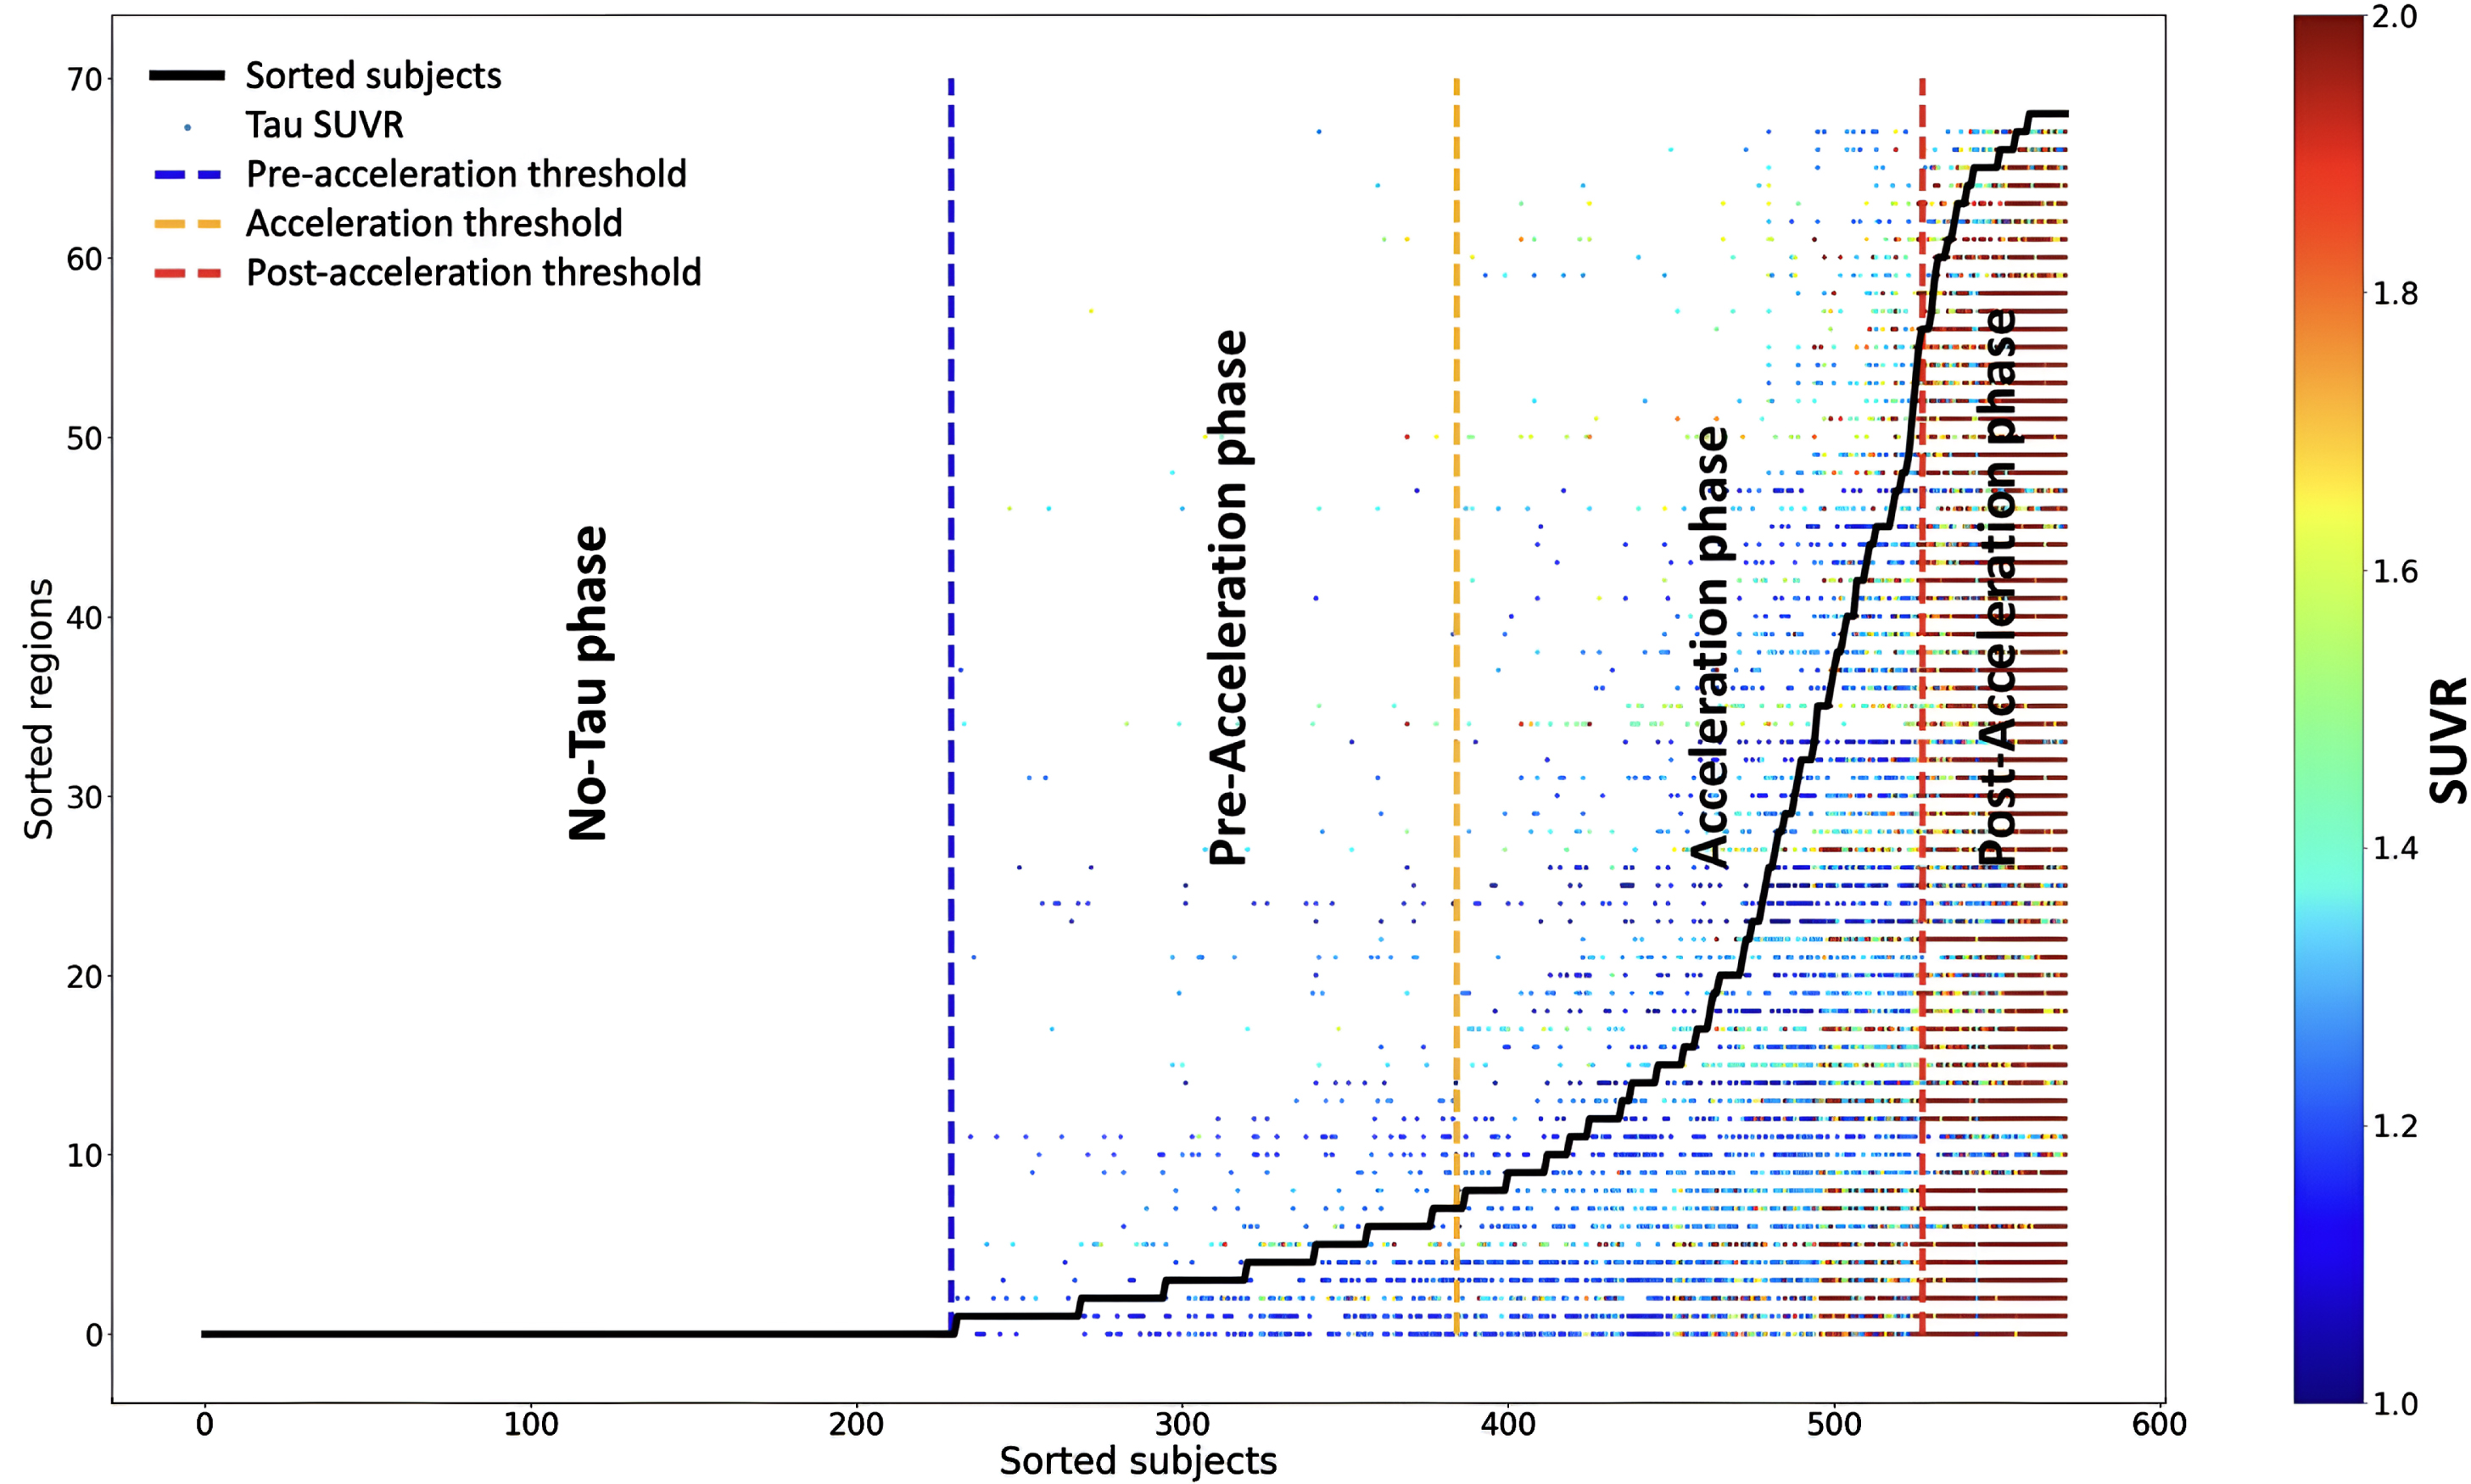
The sequence of tau deposition in 572 elderly subjects based on young subjects’ regional cut-points. Subjects were sorted based on the number of tau-PET regions that exceeded the regional cut-points in the x-axis. Regions were also sorted by frequencies exceeding the regional cut-point across all subjects in the y-axis. The tau SUVR for the regions that exceed the regional cut-point is color-coded with a heat map; the blue color indicates the tau SUVR value equals 1, and the red color indicates the tau SUVR value higher than 2. Three thresholds were defined to separate the subjects into regions into four phases: no-tau, pre-acceleration, acceleration, and post-acceleration.
The “no-tau” phase included subjects with no regions that exceeded the regional cut-points. The subject was considered in the “pre-acceleration” phase if a single region was considered tau-positive based on the regional cut-points. We utilized the elbow method to define the start of the “acceleration” phase, at which the smoothed graph showed the highest change. Finally, the “post-acceleration” phase was defined, where the second derivative graph became zero (see Fig. 1) [22].
Statistical analyses
Pathologically, there is evidence that Aβ facilitates the spread of tau outside of MTL [13]. Using multivariate regressions, we investigated associations between tau burden by region and Aβ in brain cortical regions. We tested these associations in the four defined phases of tau progression, using the tau regions in each phase as the “target” region.
After categorizing the older subjects, a probabilistic atlas was obtained to visualize each category’s Aβ and tau deposition pattern. For visualization, we applied the regional cut-points of Aβ and tau and binarized each region as Aβ positive/negative and tau positive/negative. Lastly, we calculated the probability of observing abnormal Aβ/tau levels (as determined by regional cut-points) among individuals in each category.
Remote tau-Aβ associations were assessed in all 68 segmented regions. Notably, this association independently assesses each target region tau and remote region Aβ. We applied a multiple regression model for each target region of tau (i) to assess the association with Aβ deposition in all other brain regions (j) (67 separate multiple regression analyses, i ≠ j), while age, gender, ICV, and target region Aβ were controlled as covariates:
Finally, statistical maps (t-value) were generated for each group and target region based on 67 independent regression analyses to visualize regions with significant remote associations between tau uptake in the target region and the other regions’ Aβ depositions.
This study used Python for all statistical analyses and visualizations. The main numeric modules and visualization were utilized: NumPy and Matplotlib [37, 38]. Statistical tests, such as analysis of variance (ANOVA) and chi-square tests, were performed using the SciPy statistical package (v6.1.1) [39]. The potential ceiling effects have been addressed by checking the normality of distribution using the Shapiro-Wilk test [40]. A permutation test performed family-wise error correction of regional associations. A null distribution was determined by randomly shuffling the independent variable 10,000 times. Based on the 95th percentiles of the fitted normal distribution for positive t-values, we calculated the family-wise error rate-corrected t-value.
RESULTS
Characteristics of categorized subjects
The regional distributions of tau and Aβ in old subjects categorized by the four phases of tau progression (no-tau, pre-acceleration, acceleration, and post-acceleration) are depicted in Supplementary Figure 2. Furthermore, Supplementary Figures 3 and 4 illustrate the ranges of alterations in tau and Aβ uptakes, respectively, within each categorized group and region separately. In both figures, the numbers on the y-axis, ranging from 1 to 68, correspond to the sorted regions in the brain as depicted in Fig. 1. Table 2 depicts the number of subjects and their demographic characteristics by phase. As shown in Supplementary Figure 2 and Table 2, the no-tau phase comprised 220 HC (18% of these were Aβ+) and 10 MCI or mild AD subjects (25% of these MCI or mild AD subjects were Aβ+). In the pre-acceleration phase, 143 were HC (18% were Aβ+) and 11 MCI or mild AD subjects (27% were Aβ+). Subjects showed tau deposition from one to eight brain regions (Supplementary Figure 3), largely restricted to MTL sub-regions (e.g., entorhinal cortex, parahippocampal gyrus). In the acceleration phase, 111 were HC (33% were Aβ+), and 32 had MCI or mild AD (84% were Aβ+). Subjects showed tau deposition from 9 to 58 brain regions across the cortex. In the post-acceleration phase, 43 of the subjects had MCI or mild AD (98% were Aβ+), and only 2 subjects were HC (50% were Aβ+). In this phase, tau was observed in almost the entire cortex (in at least 75% of subjects), while Aβ in MTL and occipital lobe regions showed presence in only 25% of subjects (Fig. 1).
Demographic characteristics of categorized participants
HC, healthy control; MCI, mild cognitive impairment; M, male, F, female; PET, positron emission tomography; Aβ, amyloid-beta; Aβ+, amyloid-beta positive; Aβ–, amyloid-beta negative. *Chi-square tests compare the number of Aβ+subjects with Aβ–subjects.
In summary, across different phases of tau deposition, the number of Aβ+ subjects (p < 0.0001, χ2 = 128.50) and the number of participants with MCI or mild AD (p < 0.0001 and χ2 = 238.84), increased significantly and monotonically from no-tau phase to post-acceleration phase.
Remote associations from early to late stages of tau progression
To investigate the potential association between tau deposition from early (MTL region) to late stages of disease and cortical areas of Aβ deposition, we examined all associations between tau in a target region and remote Aβ deposition, controlling for age, gender, ICV, and local Aβ deposition within the target region (see Equation 1); these associations were investigated separately for each tau target region at each phase of tau progression. Controlling for the Aβ within the target region was done to focus the investigation on tau-Aβ remote associations. As expected, no statistically significant association was identified between regional Aβ and tau deposition in the no-tau phase. This is not surprising due to the absence of detectable regional tau deposition on PET in this phase.
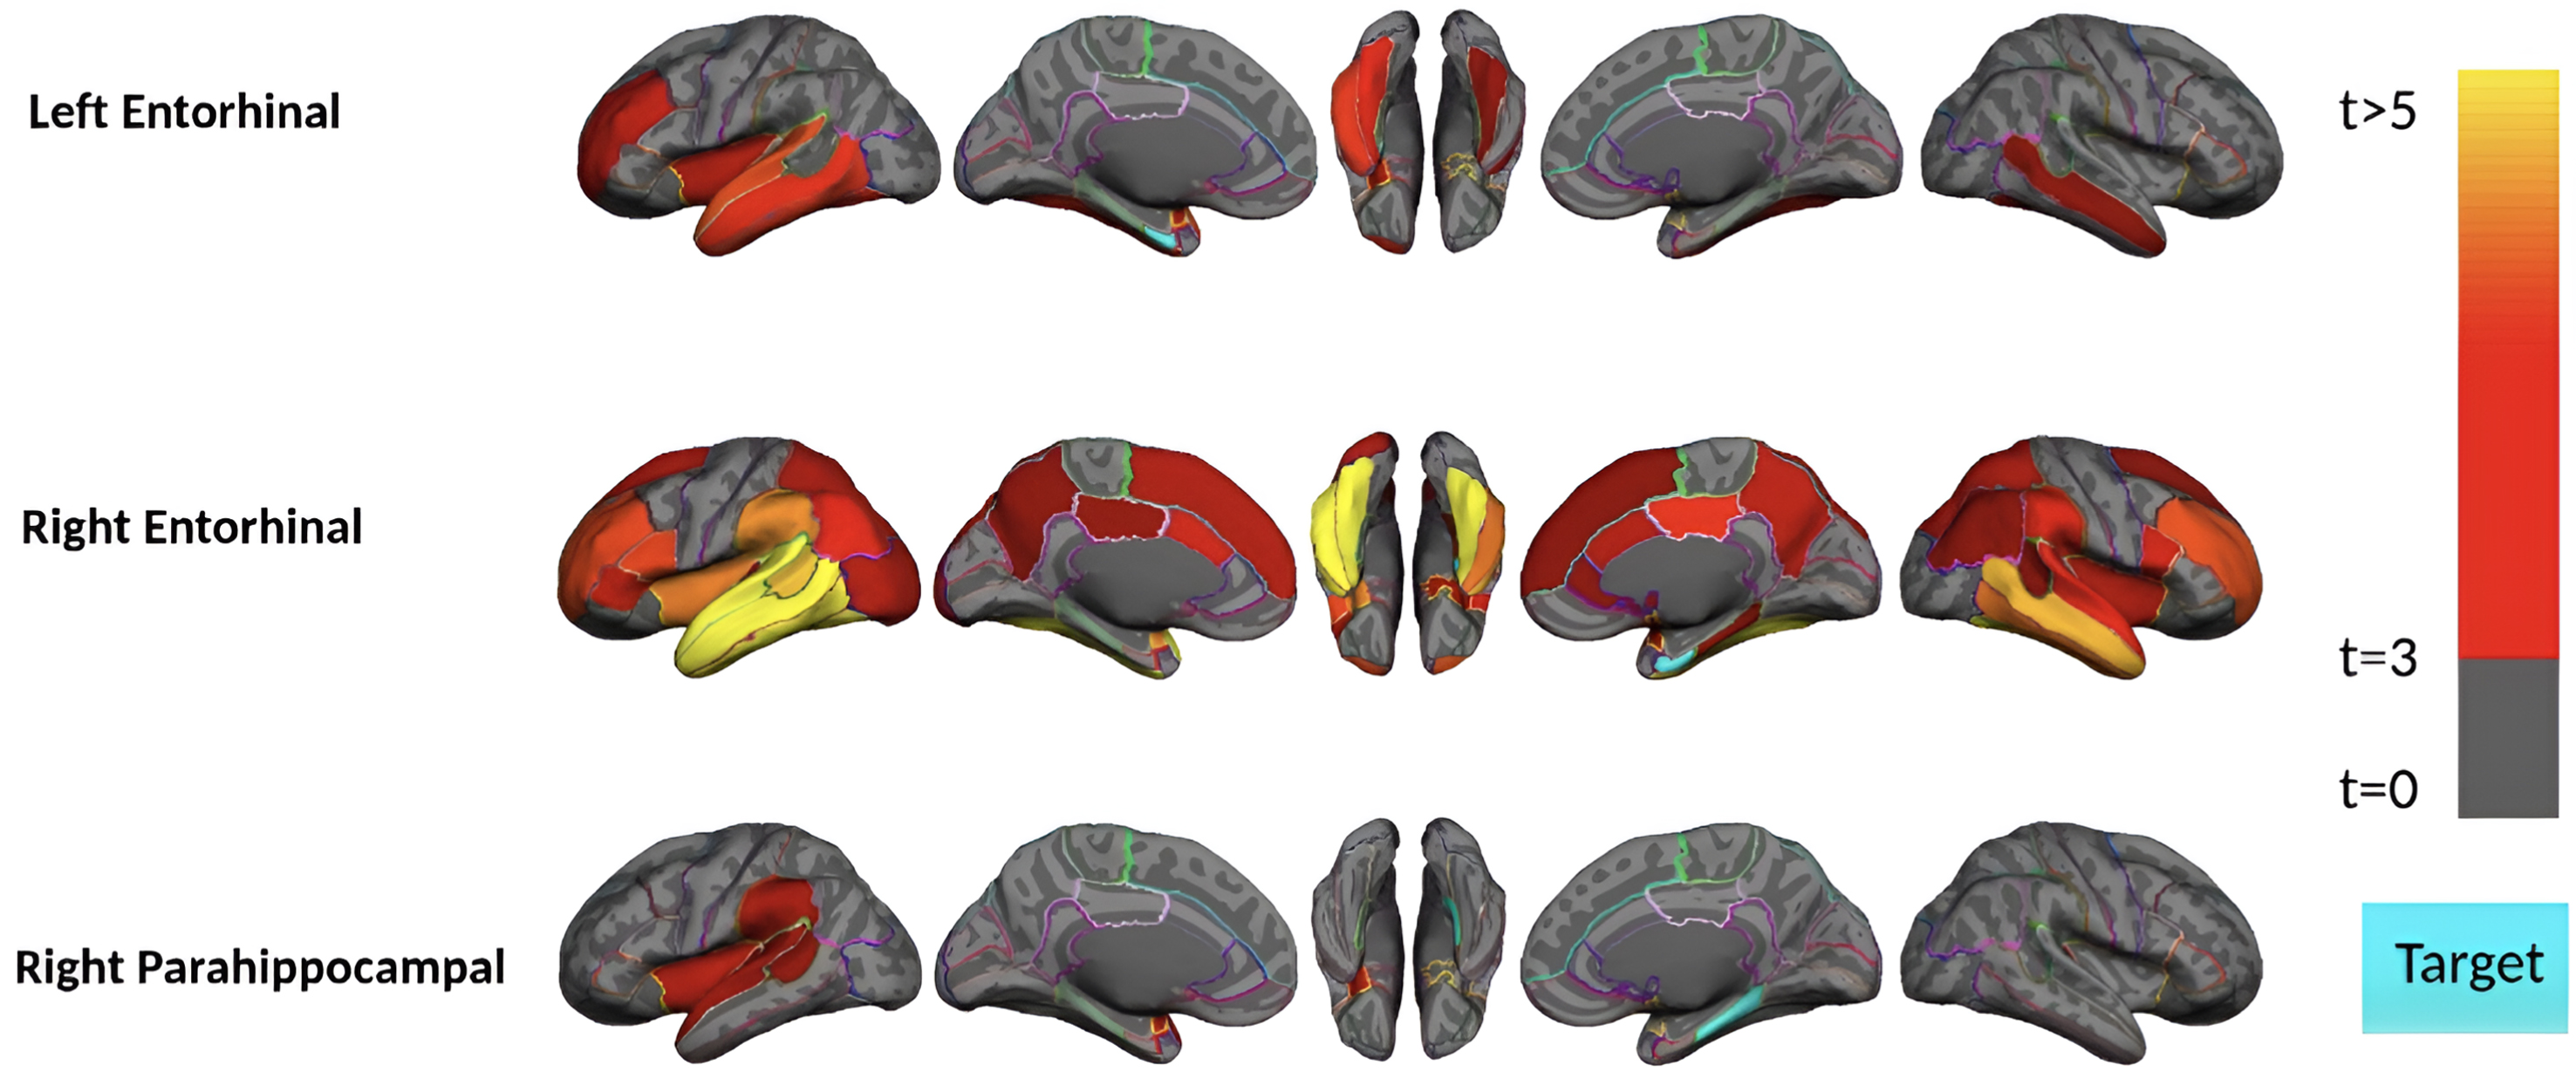
Region-wise statistical map (t-value) of remote association between tau deposition in three target regions and regional Aβ depositions in 67 cortical regions obtained in the pre-acceleration phase of tau deposition. The family-wise corrected t-value at each region is color-coded with red or yellow colors representing increasing positive t-values and overlaid on the semi-inflated cortical surface of the MNI152 template. The red color indicates the t-value is equal to 3, and the yellow color indicates the t-value is higher than 5. The target region is indicated as light blue.
Subjects in the pre-acceleration phase showed significant tau deposition in one to eight brain regions, largely restricted to MTL sub-regions. As seen in Fig. 2, in this phase, remote association analysis identified three regions (left and right of the entorhinal cortex and right parahippocampal gyrus) that showed a significant association with Aβ in several cortical regions. The right entorhinal cortex, for instance, is strongly associated (p-value<0.0001 and t-value>4) with several Aβ regions, including the bilateral middle temporal gyrus, inferior temporal gyrus, and fusiform gyrus. This result suggests a pathologic connection between tau in the entorhinal cortex and Aβ in these temporal lobe cortical regions since higher levels of Aβ in the temporal lobe cortex are associated with higher levels of tau in the entorhinal cortex.
Aβ and tau deposition and spatial distribution increased in the acceleration phase. Subjects in this phase have 9 to 58 (out of 68) brain regions showing a significant amount of tau in this phase (Supplementary Figure 2). Importantly, subjects in the acceleration phase displayed the strongest remote associations between regional tau and Aβ depositions (Fig. 3). Our analysis identified 28 regions (14 bilateral brain regions) where their tau uptakes were significantly associated (p-value<0.0015 and t-value>3) with at least one region’s Aβ uptake. However, MTL sub-regions (i.e., bilateral entorhinal cortex and parahippocampal gyrus) appear to have the strongest remote associations in the acceleration phase. Tau uptakes in these two bilateral regions illustrate the significant associations with more than 55 regions’ Aβ deposition, particularly frontal and temporal lobe regions, including the bilateral middle temporal gyrus, inferior temporal gyrus, and rostral middle frontal Aβ deposition, frequently showed the strong association with tau.
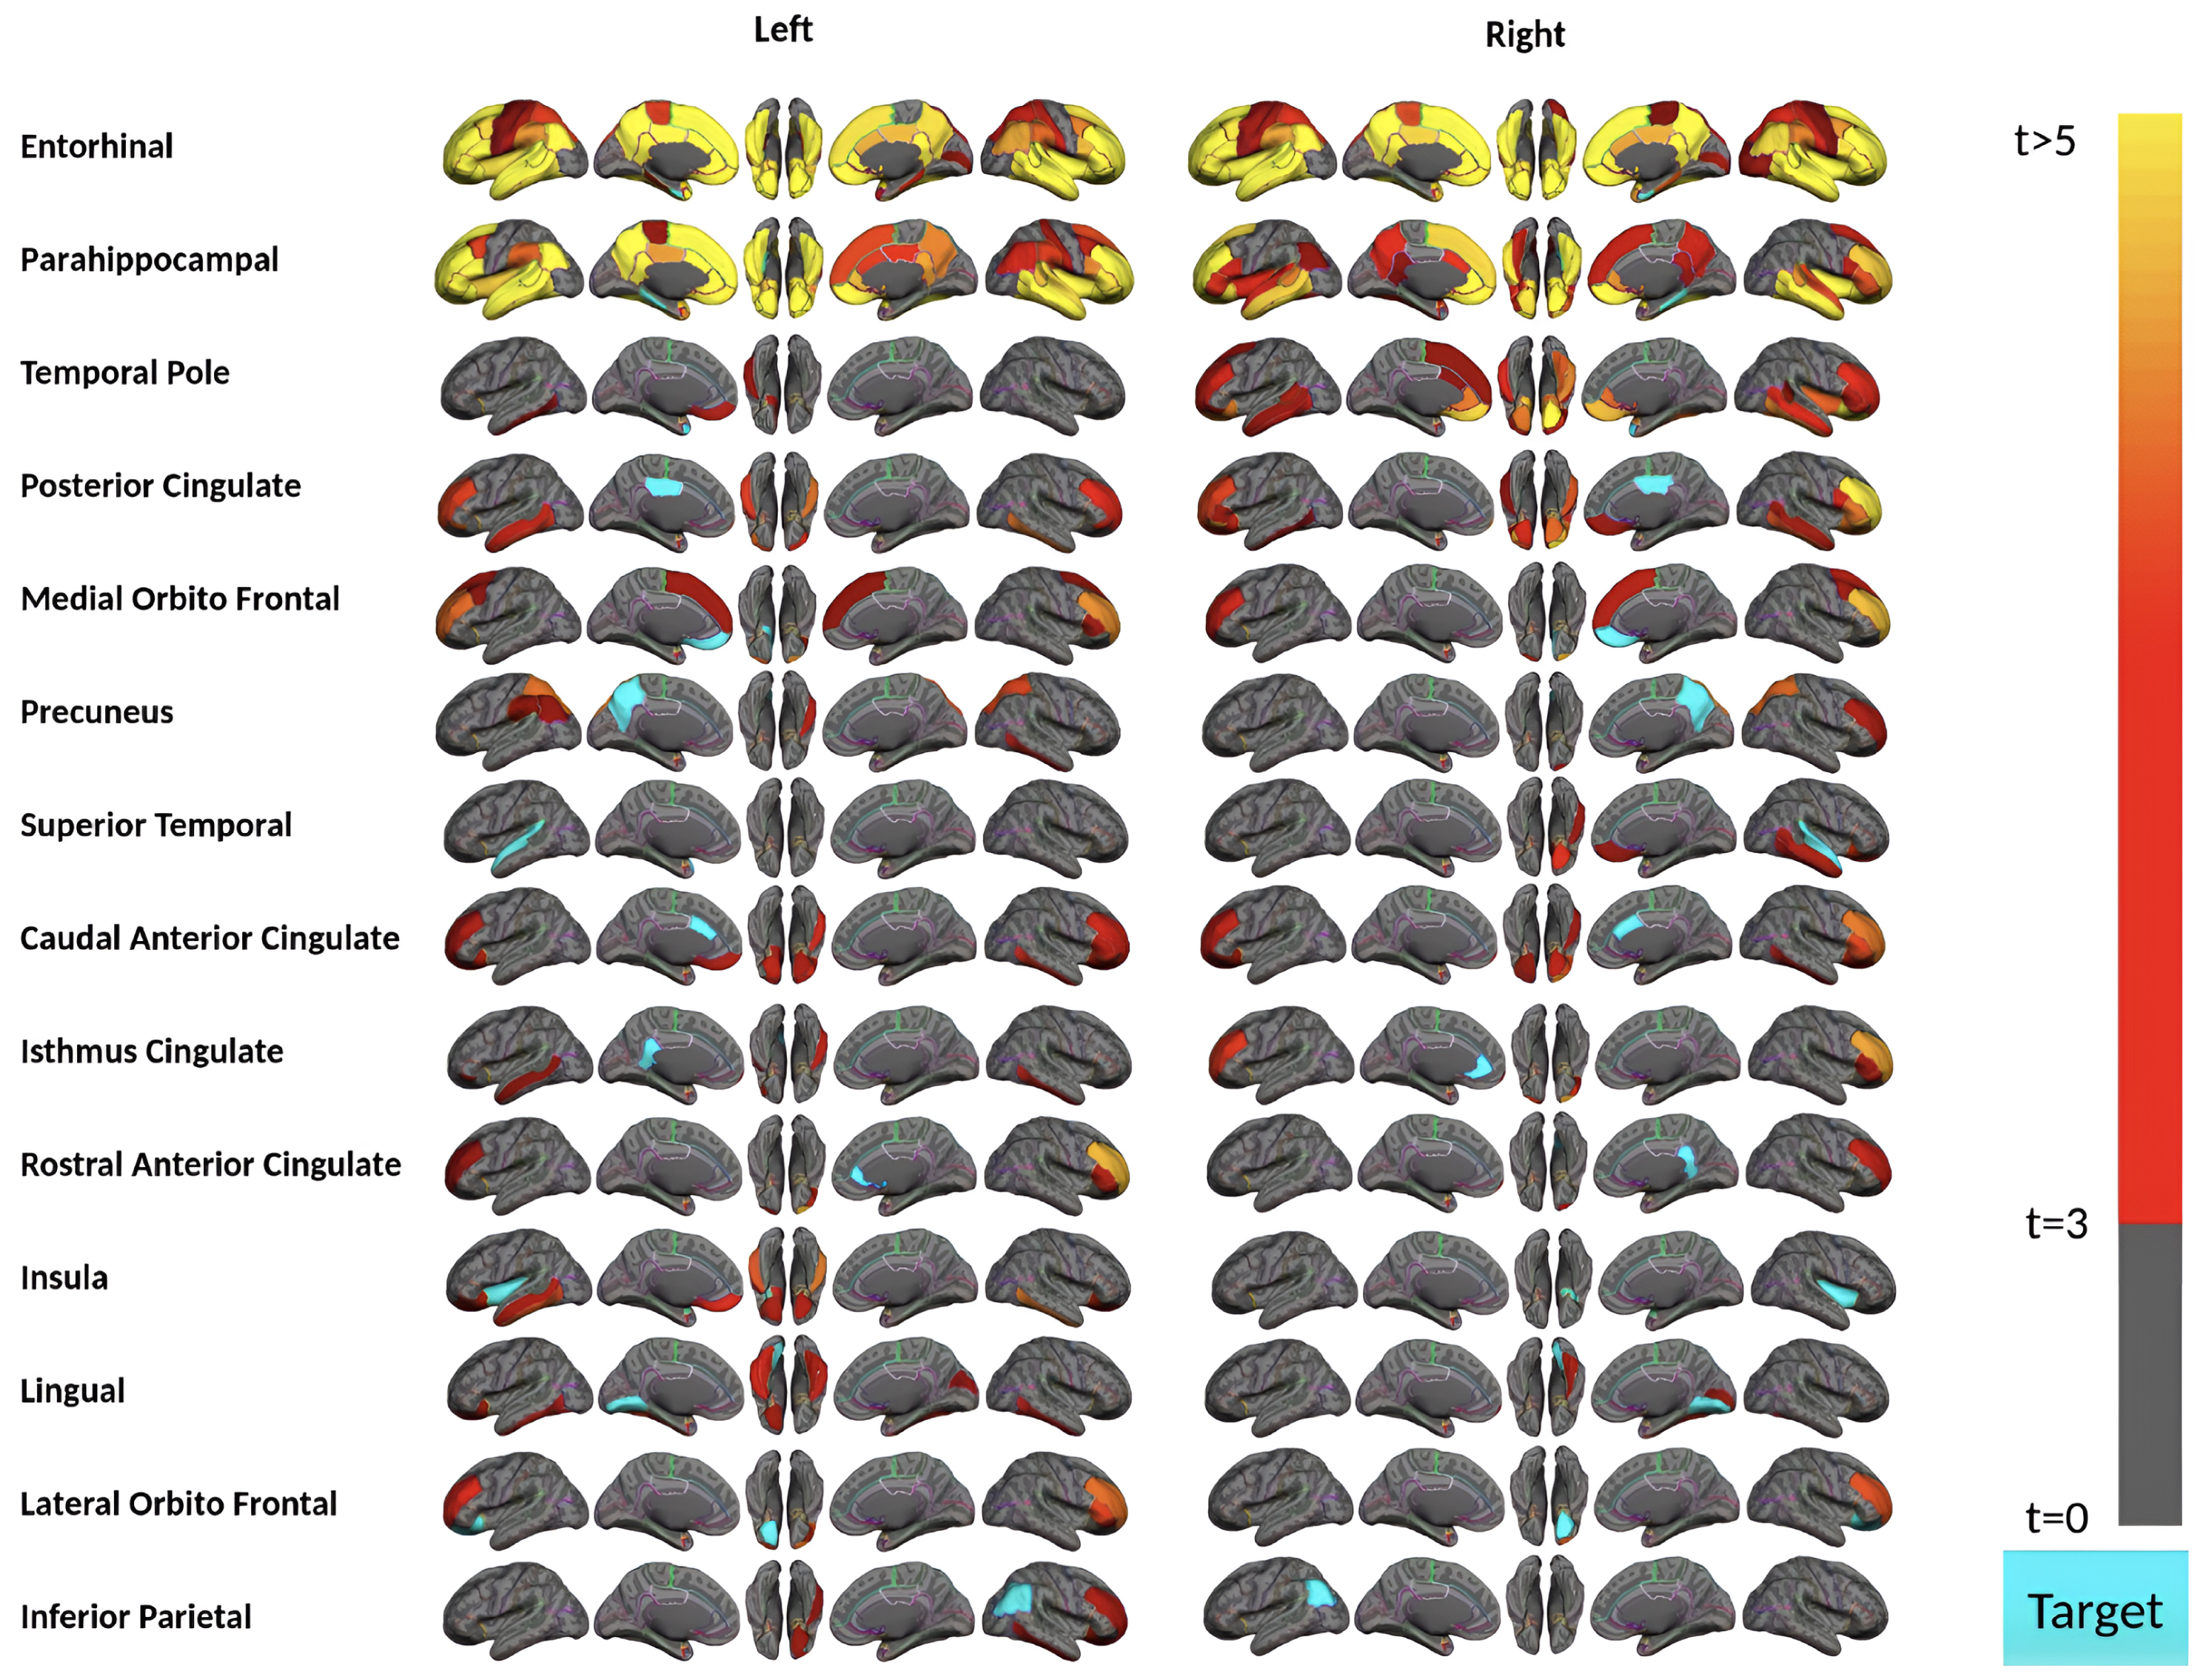
Region-wise statistical map (t-value) of remote association between tau deposition in fourteen target regions and regional Aβ depositions in 67 cortical regions obtained in the acceleration phase of tau deposition. The family-wise corrected t-value at each region is color-coded with red or yellow colors representing increasing positive t-values and overlaid on the semi-inflated cortical surface of the MNI152 template. The red color indicates the t-value is equal to 3, and the yellow color indicates the t-value is higher than 5. The target region is indicated as light blue.
Finally, in the post-acceleration phase, tau was present in nearly the whole cortex in at least 75% of subjects, and Aβ was present in nearly the whole cortex (with at least 80% of subjects) except the MTL and occipital lobe (with limited 25% of subjects). Surprisingly, no significant remote association survived multiple comparisons in the post-acceleration phase, where the tau pathology was elevated (SUVR higher than two shown with red color in Fig. 1) and distributed through the whole brain (Supplementary Figure 2). This result suggests that the observed associations between regional tau and Aβ are strongest during earlier stages of the disease and vanish as the disease progresses and the participant becomes symptomatic since this phase included predominantly subjects with MCI/mild AD.
The lack of any significant finding in the post-acceleration phase might be potentially due to the ceiling effects in these samples or the lower number of samples in this phase (45 participants compared to 111 participants in the acceleration phase). The potential ceiling effects have been effectively addressed through an examination of the normality of distribution in tau uptakes using the Shapiro-Wilk test. The results of the Shapiro-Wilk test of subjects in the post-acceleration phase indicated that the tau regional uptakes were normally distributed, with a p-value greater than 0.05 in 20 out of the 28 regions (i.e., bilateral entorhinal cortex and parahippocampal) where significant remote associations between Aβ and tau uptakes were observed during the acceleration phase (Fig. 3). This indicated that, while in the post-acceleration phase, abnormal tau distributed across almost the entire context (Supplementary Figure 2), the regional uptakes exhibited a symmetric distribution and were not skewed. This ensures the reliability of the results for regression analyses by confirming that the observed uptakes were not biased toward extreme values. To address the potential sample size issue in the next section, we performed two more analyses to show that the tau and Aβ association in the acceleration phase can be found even with the same or a smaller number of participants as we have in the post-acceleration phase.
Aβ+ HC subjects show the highest remote association
We conducted two analyses to investigate whether our method can identify the remote association in a subset of subjects in the acceleration phase with a sample size comparable to the post-acceleration group. Additionally, these two analyses were conducted to evaluate the remote tau-Aβ association in symptomatic versus asymptomatic states and Aβ+versus Aβ–conditions in the acceleration phase. We first reanalyzed the acceleration phase subjects with only MCI or mild AD (32 subjects, including 27 Aβ+ patients). Figure 4 shows the result where tau in five regions illustrated weak but significant associations with a few remote Aβ brain regions. Notably, due to the sample size issue, we could not compare the remote associations in Aβ+ versus Aβ–groups in MCI or mild AD patients. In summary, the results illustrate that the remote tau-Aβ association is weak but detectable (after multiple comparison corrections) in symptomatic subjects in the acceleration phase.
Region-wise statistical map (t-value) of remote association between tau deposition in five target regions and regional Aβ depositions in 67 cortical regions obtained the MCI and mild AD subject in the acceleration phase of tau deposition. The family-wise corrected t-value at each region is color-coded with red or yellow colors representing increasing positive t-values and overlaid on the semi-inflated cortical surface of the MNI152 template. The red color indicates the t-value is equal to 3, and the yellow color indicates the t-value is higher than 5. The target region is indicated as light blue.
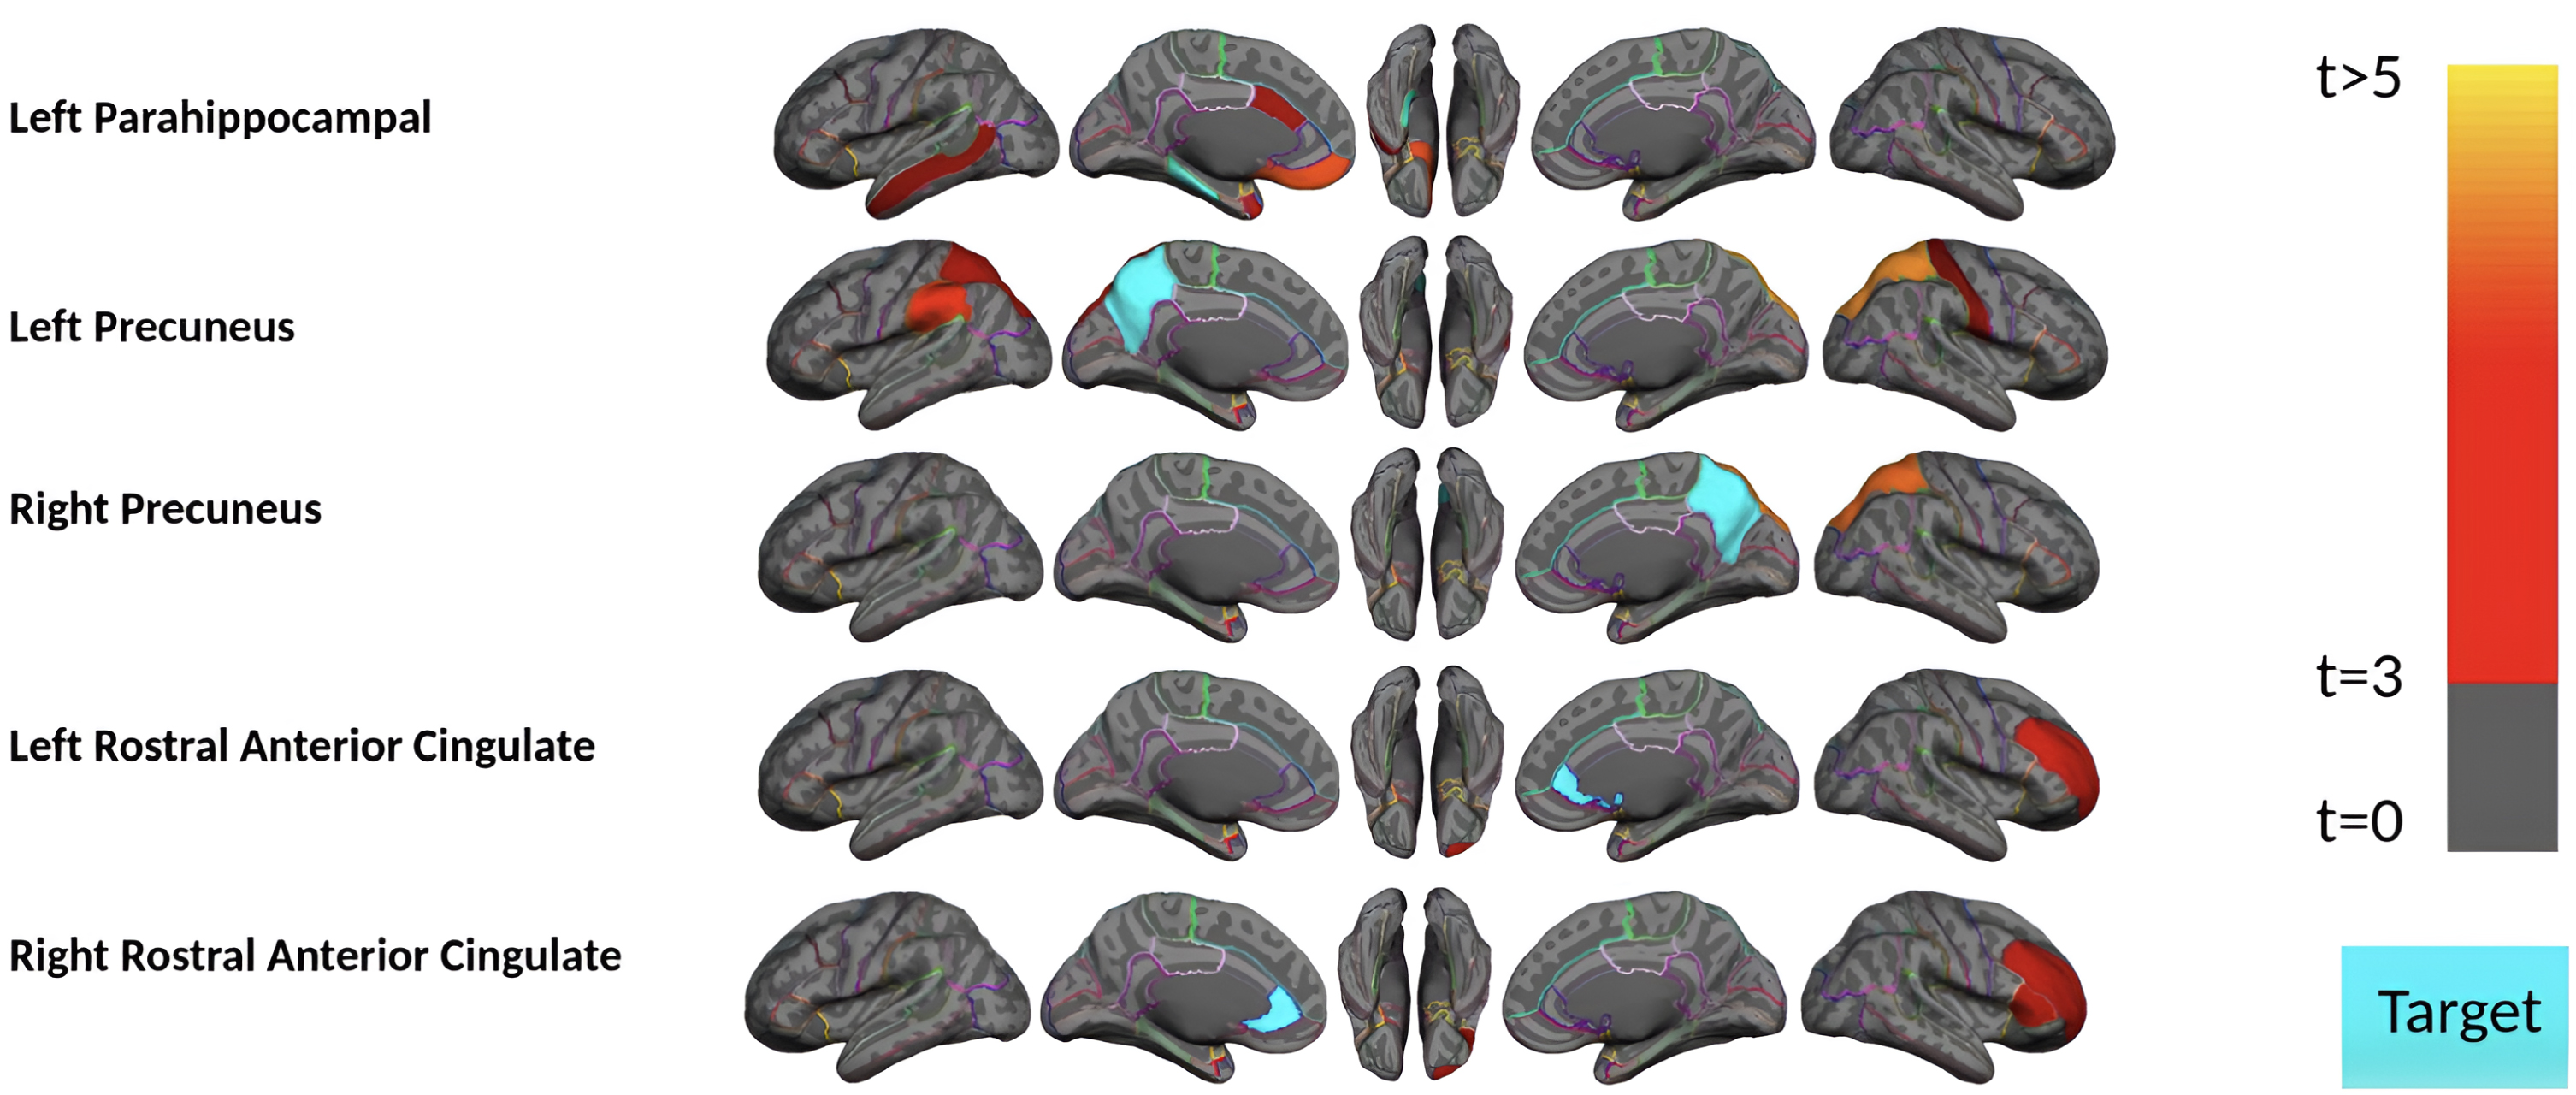
Next, we divided the 111 HC acceleration subjects into 37 Aβ+ and 74 Aβ–groups and investigated the remote associations separately. In HC Aβ–subjects, despite the larger sample size, only two regions’ tau uptake (left lingual and right entorhinal cortex) showed marginal associations with other regions Aβ (Fig. 5). Note that Aβ–subjects can have elevated levels of Aβ in some regions but, on average, fall below the threshold of global Aβ abnormality. On the other hand, tau in six regions showed a significant association with Aβ in several brain regions in HC Aβ+ subjects. Interestingly, the right entorhinal cortex showed strong associations with remote Aβ in several regions. In Fig. 6, we illustrated the multiple regression analysis results between the right entorhinal cortex tau and three top-ranked associated remote regions Aβ: left inferior temporal, right fusiform, and right inferior temporal. As it is evident from this figure, even in 37 HC Aβ+ subjects, the regional tau elevation in the right entorhinal cortex is significantly associated with all three remote regions Aβ (p-value < 0.0001, t-value > 4.81, and r > 0.51). These results confirmed a significant remote tau-Aβ association can be detected using our statistical methods even with fewer subjects than we have in the post-acceleration phase. Altogether, our results suggest that the tau-Aβ association becomes considerably attenuated after the disease onset (impaired patients), whereas, at the preclinical stage, the existing abnormal Aβ demonstrates a strong remote association with tau.
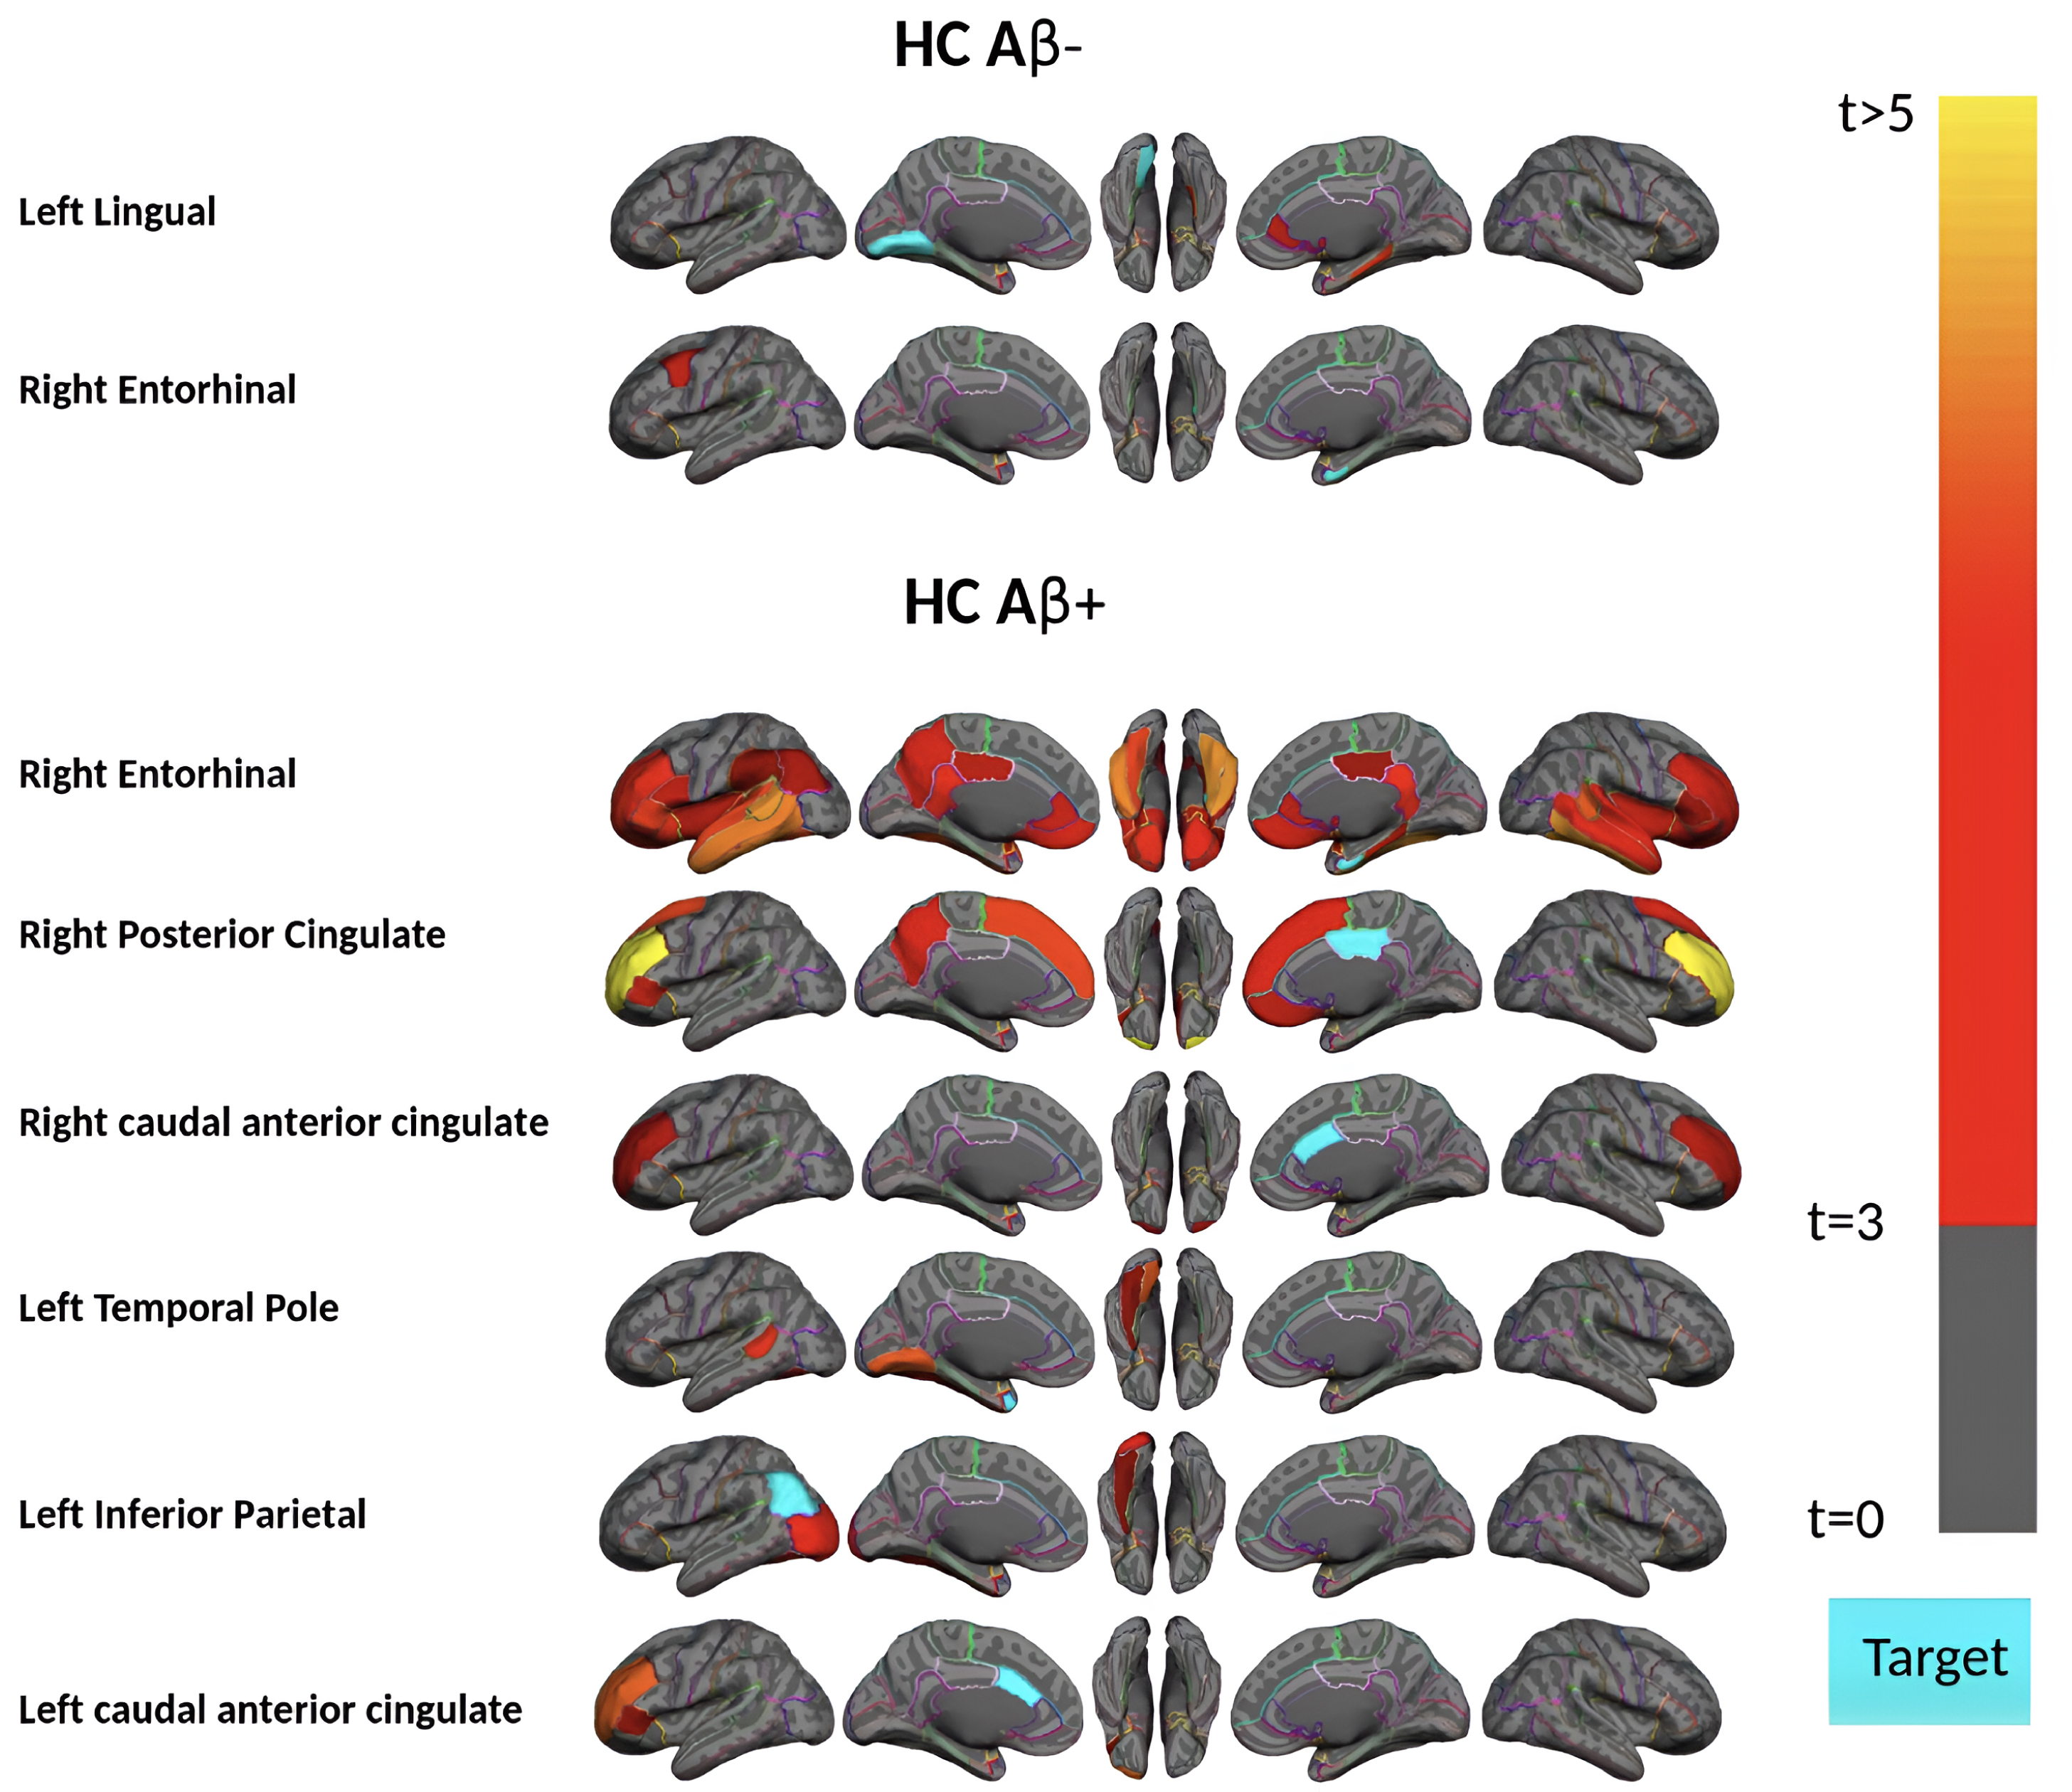
Region-wise statistical map (t-value) of remote association between tau deposition in six target regions and regional Aβ depositions in 67 cortical regions obtained in the HC Aβ–and Aβ+ subjects in the acceleration phase of tau deposition. The family-wise corrected t-value at each region is color-coded with red or yellow colors representing increasing positive t-values and overlaid on the semi-inflated cortical surface of the MNI152 template. The red color indicates the t-value is equal to 3, and the yellow color indicates the t-value is higher than 5. The target region is indicated as light blue.
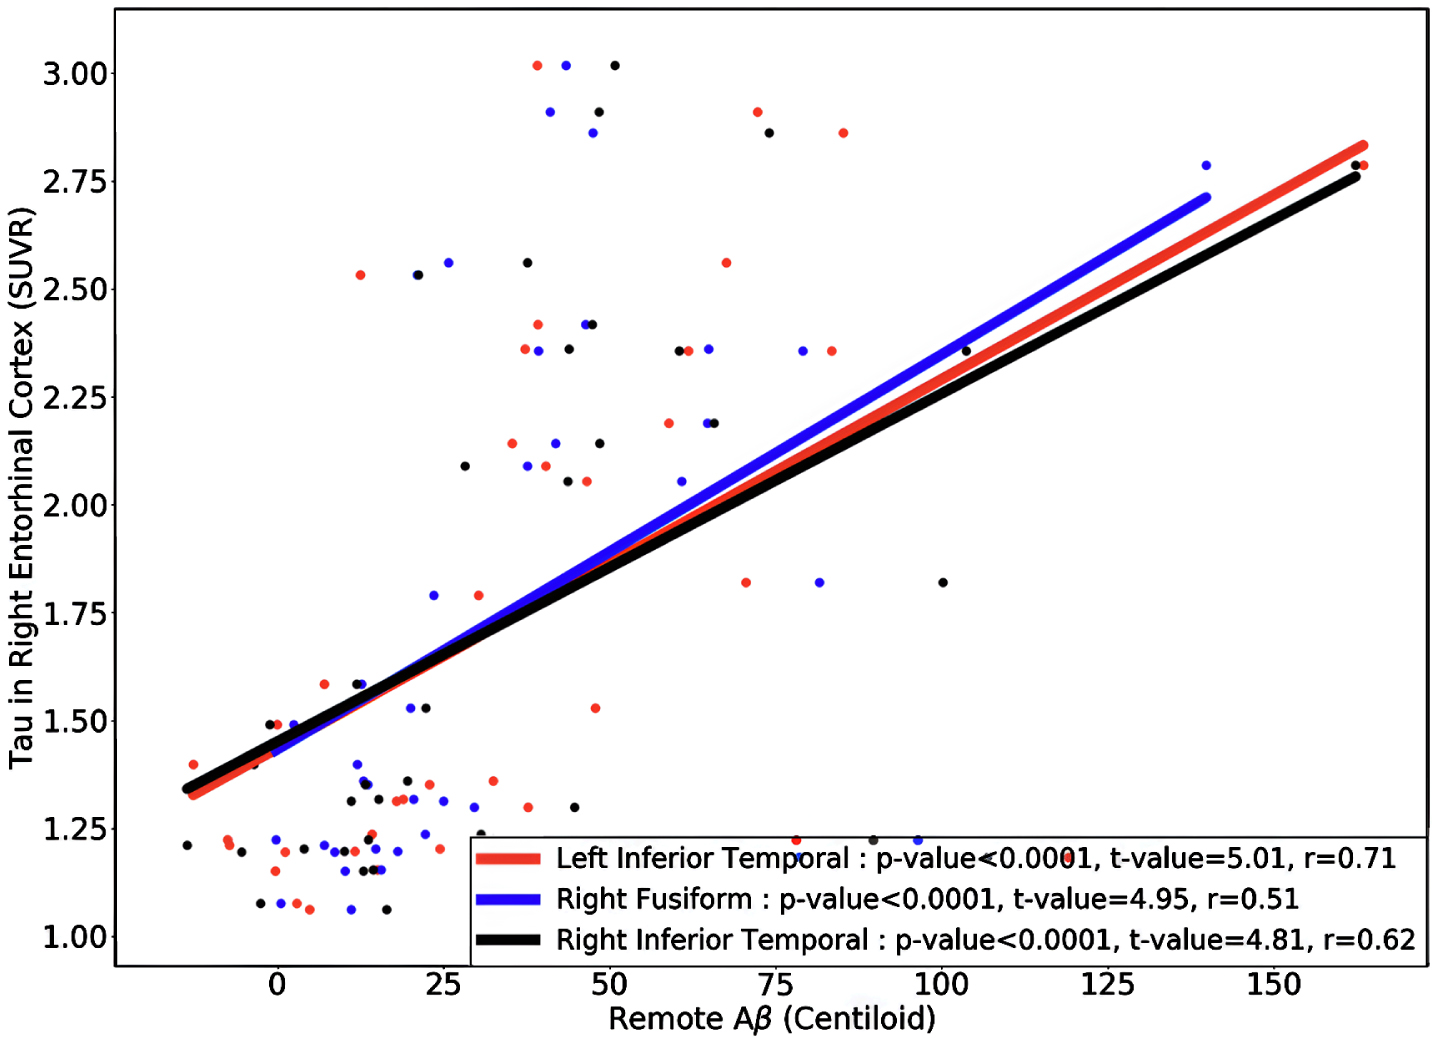
The regional multiple regression analysis results of right entorhinal cortex tau and three top-ranked associated remote regions Aβ: left inferior temporal, right fusiform, and right inferior temporal in 37 HC Aβ+ subjects in the acceleration phase. All these analyses survived family-wise error correction.
DISCUSSION
Since the accumulation of AD pathologies is gradual and often starts decades before the onset of the disease, it is crucial to understand the progression of neuropathology during aging to prevent the development of AD and its clinical implications. In this study, we applied the pseudo-longitudinal technique, utilizing regional cut-points driven by the young normative cohort, to evaluate the remote tau-Aβ association within 68 cortical brain regions. The association was assessed throughout four phases of tau progression from early to late stages of disease using model-based statistical analysis: no-tau phase, pre-acceleration phase, acceleration phase, and post-acceleration phase. The main findings in this study were: First, the tau-Aβ association strongly depends on the stage of the disease. Second, the remote tau-Aβ association started in the early stages of tau deposition in the MTL sub-regions. Also, MTL sub-regions tau have the strongest remote association with cortical Aβ. The third finding was that this association continued and accelerated in the next accumulation stage (acceleration phase) but then attenuated significantly in the symptomatic stage of the disease. Finally, the strongest remote associations happen in the HC subjects with abnormal levels of Aβ deposition in the acceleration phase of tau progression.
Previous studies indicated that tau pathology can be found within MTL during normal aging without significant neocortical Aβ, and Aβ pathology acts as a gatekeeper for tau pathology to spread out of the MTL to the neocortex [41]. Our results in the pre-acceleration phase suggest that the entorhinal cortex and parahippocampal gyrus tau have significantly strong remote associations even at the early deposition stage when tau is limited to MTL. This association would suggest that the interaction between these two pathologies happens earlier than the literature reported. The difference is that the tau association inside the MTL happens remotely with cortical Aβ [22], and Aβ may enhance the tau accumulation even inside the MTL via remote association. The remote association of the entorhinal cortex tau with other cortical regions Aβ has been supported by previous studies, particularly in later stages of accumulation through the neural connection of the brain [22, 42–46]. Considering the pivotal role of functional connectivity in the observed patterns of tau spread [42–44], we speculate that the neural connection might be a facilitator of remote tau-Aβ association. This is particularly relevant given the observed relationship between the accumulation of Aβ in the neocortex among cognitively normal older individuals and functional alterations in the MTL [47]. Moreover, there is evidence that limbic structures (including the entorhinal cortex) as a superficial layer are significantly vulnerable to Aβ [48]. Therefore, given that the superficial layers are more involved in corticocortical connections [49], it is valid to suggest that during the initial phases of tau pathologies, variations in susceptibility to Aβ may arise from neural pathways, particularly brain functional connections.
Consistent with the pre-acceleration phase findings, strong remote associations appeared in several tau target regions in the acceleration phase. More importantly, we observed the strongest associations across the HC Aβ+ subjects in the acceleration phase. Previous reports also observed that tau increased faster with higher Aβ deposition than with lower Aβ deposition in clinically normal adults [50], which might be related to this high level of remote association in Aβ+ subjects. Another longitudinal study also found that changes in tau were strongly linked to the rate of change in Aβ deposition levels [51]. They also noted that tau changes occurred soon after Aβ positivity was detected. Additionally, earlier findings indicating that abnormal Aβ deposition in the neocortex is linked to alterations in task-evoke activity and resting state functional connectivity [47] provide support for the hypothesis that the remote connection between Aβ deposition in the neocortex and tau in the MTL could be facilitated by neural connection pathways.
Most surprisingly, we found no significant remote association between tau and Aβ for participants in the post-acceleration phase, which included more than 96% MCI or mild AD and Aβ+ subjects. While the spatial distribution of tau and Aβ increased in this phase compared with the acceleration phase, no remote association survived after multiple comparison corrections. The MCI/mild AD subjects’ tau in the acceleration phase also shows a weak remote association with Aβ, supported by previous reports [52]. Earlier studies have reported that the rate of Aβ deposition seems to decelerate as it reaches higher levels [53, 54]. Additionally, neuropathological studies also demonstrated that deposition of tau and Aβ rate decrease with aging in AD patients [55] and there is a significant negative age association with tau deposition at the disease stage [56]. This negative association in patients with early dementia would explain the results of MCI or mild AD subjects in the acceleration and post-acceleration phases. The hypothesis we want to highlight is again based on the neural connection between different regions in the brain, especially in remote association. Tau in target regions, such as the entorhinal cortex, demonstrating remote associations with Aβ in other cortical regions (i.e., in temporal and frontal lobes) during the pre-acceleration and acceleration phases, are mostly functionally interconnected with one another [57]. On the other hand, late-stage tau and Aβ affect functional connectivity [58, 59], and these two pathologies might induce a disruption in the functional connectivity in the symptomatic stages of deposition and finally lead to an uncoupling with one another.
The results of this study emphasize the strong remote association between the two key proteinopathies of AD. While the cellular mechanism of this association is still elusive, several in vitro and in vivo studies have demonstrated that Aβ triggers tau deposition [13, 61]. Therefore, the mechanism for explaining the remote tau-Aβ association is a compensation mechanism facilitated by neural connections. Recent research has provided growing evidence that early Aβ deposition is linked to increased brain activity in individuals without cognitive impairment but with Aβ burden [62–65]. Our recent study [18] also reported compelling insights for this compensatory mechanism where the early Aβ deposition was associated with increased cortical thickness, particularly in the MTL region. On the other hand, more recent studies indicated that tau accumulation in hub regions, regions with maximum level of functional connection to the rest of the brain, tends to spread more than tau accumulated in non-hub regions [42–44, 46]. This evidence suggests that the observed stage-dependent trajectories in remote association likely result from the combined influences of Aβ and tau on functional connectivity and how the brain compensates for the disruption effects of these two pathologies. Specifically, the initial Aβ deposition induces hyperactivity/hyperconnectivity, which may lead to elevated tau levels, triggering a synergic tau and Aβ accumulation cycle. However, the high levels of tau and Aβ accumulation (disease stage) eventually break down the network organization of functional connections, which results in the hypoactivity/hypoconnectivity observed in symptomatic individuals [66, 67]. This attenuation in brain connectivity may finally lead to a weak remote association between these two pathologies. We speculate that the mechanisms underpinning the Aβ-tau association may differ in the early stage of the disease compared to the later stage. The Aβ-tau association in the later stages most likely occurs locally rather than remotely. Since the utility of anti-amyloid drugs in the later stages of AD remains unclear, understanding the early associations of Aβ on tau pathology in the brain is crucial.
The present study has limitations, which will serve as areas for further investigation. The first limitation of this study is that a different Aβ-PET tracer was used for healthy controls (18F-Florbetaben) and individuals with MCI/mild AD (18F-Florbetapir). To address this issue, all analyses in the study were done using centiloid standard values instead of SUVR [31]. Furthermore, we also implemented interclass statistical analysis to compare the centiloid and SUVR regional values. The strong average correlation of 0.98 and the standard deviation of 0.01 was calculated across 68 regions, and SUVR values changed none of the reported results. The next limitation that needs further investigation is the heterogeneity of Aβ or tau patterns in AD, which were not directly considered in our analyses due to the sample size limitation in each phase. Moreover, the relationship between AD pathologies is challenging to analyze cross-sectionally and group-wise. Thus, considering the pathological changes individually in a longitudinal dataset is necessary. Finally, while 572 older and 144 younger samples were used in this study—greater than typically reported in human studies in the field, especially with the second generation of tau PET tracer—despite our effort to address the sample size issue, it is possible that our sample size was not large enough to provide sufficient statistical power to detect associations, especially in symptomatic stages (post-acceleration phase) of the pathologies.
Conclusion
The results of the current study illustrate the robust remote tau-Aβ association, not only in the acceleration phase but also strongly in the pre-acceleration phase (early stages of tau deposition), particularly in the entorhinal cortex and parahippocampal gyrus regions. Our study shows that the remote association begins with MTL tau during the early stage and is evident in the later stages of tau deposition in asymptomatic subjects. It is interesting to note that remote association was attenuated in symptomatic subjects with cognitive decline (MCI and mild AD subjects), whereas this association is strongly enhanced in Aβ+ asymptomatic subjects (HC). These results contribute valuable insights for researchers seeking to understand the remote tau-Aβ associations through disease progression.
AUTHOR CONTRIBUTIONS
Seyed Hani Hojjati (Conceptualization; Data curation; Formal analysis; Investigation; Methodology; Validation; Visualization; Writing –original draft; Writing – review & editing); Gloria C. Chiang (Conceptualization; Resources; Supervision; Writing – original draft; Writing – review & editing); Tracy A. Butler (Conceptualization; Resources; Writing – original draft; Writing – review & editing); Mony de Leon (Conceptualization; Resources; Writing – review & editing); Ajay Gupta (Resources; Writing – review & editing); Yi Li (Resources; Writing – review & editing); Mert R. Sabuncu (Methodology; Validation); Farnia Feiz (Data curation; Formal analysis); Siddharth Nayak (Data curation; Formal analysis; Writing – original draft); Jacob Shteingart (Data curation; Writing – original draft; Writing – review & editing); Sindy Ozoria (Data curation; Writing – original draft; Writing – review & editing); Saman Gholipour Picha (Data curation; Writing – original draft); Yaakov Stern (Conceptualization; Project administration; Resources; Writing – original draft; Writing – review & editing); José A Luchsinger (Conceptualization; Project administration; Resources; Writing – original draft; Writing – review & editing); Davangere P. Devanand (Conceptualization; Data curation; Project administration; Resources; Writing – original draft; Writing – review & editing); Qolamreza R. Razlighi (Conceptualization; Data curation; Investigation; Methodology; Project administration; Resources; Supervision; Validation; Writing – original draft; Writing – review & editing).
Footnotes
ACKNOWLEDGMENTS
Our sincere appreciation goes out to all those who played a part in enabling this neuroimaging study to take place. We would first like to express our gratitude to the participants who voluntarily underwent the scanning process, without whom this study would not have been possible. We are grateful for their cooperation, patience, and time invested in the scanning procedures.
Additionally, we would like to extend our gratitude to Cynthia Fox, the scientific editor, for her valuable insights and suggestions, which significantly enhanced the quality of this research.
Finally, we would like to acknowledge all the staffs who provided support during the neuroimaging scans, as well as Xiuyuan Hugh Wang, whose contributions during the data processing stage were greatly appreciated. Their professionalism and expertise were invaluable in ensuring the accuracy and reliability of the data.
FUNDING
The authors have no funding to report.
CONFLICT OF INTEREST
The authors have no conflict of interest to report.
DATA AVAILABILITY
The data for this project are confidential but may be obtained with Data Use Agreements with the Weill Cornell Medicine and Columbia University Irving Medical Center. Researchers interested in access to the data may contact Dr. Razlighi at E-mail: