
Abstract
The accumulation of amyloid-β (Aβ) plaques in the brain is considered a hallmark of Alzheimer’s disease (AD). Mathematical modeling, capable of predicting the motion and accumulation of Aβ, has obtained increasing interest as a potential alternative to aid the diagnosis of AD and predict disease prognosis. These mathematical models have provided insights into the pathogenesis and progression of AD that are difficult to obtain through experimental studies alone. Mathematical modeling can also simulate the effects of therapeutics on brain Aβ levels, thereby holding potential for drug efficacy simulation and the optimization of personalized treatment approaches. In this review, we provide an overview of the mathematical models that have been used to simulate brain levels of Aβ (oligomers, protofibrils, and/or plaques). We classify the models into five categories: the general ordinary differential equation models, the general partial differential equation models, the network models, the linear optimal ordinary differential equation models, and the modified partial differential equation models (i.e., Smoluchowski equation models). The assumptions, advantages and limitations of these models are discussed. Given the popularity of using the Smoluchowski equation models to simulate brain levels of Aβ, our review summarizes the history and major advancements in these models (e.g., their application to predict the onset of AD and their combined use with network models). This review is intended to bring mathematical modeling to the attention of more scientists and clinical researchers working on AD to promote cross-disciplinary research.
INTRODUCTION
Alzheimer’s disease (AD) is a growing public health concern, and the prevalence of AD is expected to rise as the population ages. It is estimated that the cost associated with the care of AD in the United States is predicted to increase from 6.2 million to 13.8 million by 2060 without effective treatments [1]. It not only impacts the patients and their carers, but also places a significant economic burden on the healthcare system [2]. In the early stage of AD, the accumulation of extracellular amyloid-β (Aβ) plaques is typically detected in the frontal and temporal lobes of the brain [3]. As the disease progresses, Aβ pathology can spread to other areas of the neocortex. The accumulation of extracellular Aβ plaques and hyperphosphorylation of tau impairs the normal function of neurons and lead to neuronal death [4], altogether the rate of AD progression varies between individuals [5, 6].
Mathematical modeling is a broad term that covers both descriptive and predictive models in regards to the intended use [7]. It can also be categorized as per the mathematical characteristics, such as statistical model, differential equation model, and discrete model. In recent years, the development of computational simulations and numerical solution methods for differential equation models have made mathematical modeling a powerful tool for the study and understanding of pathological processes of many diseases [8–10], including AD [11–15]. Mathematical models are different to statistical models. For example, differential equation models (one type of mathematical model) use equations to simulate the quantity of the target factors involved in the disease and their interactive relationships, while statistical models are often used to examine the connection between distinct factors (e.g., gender, APOE genotype) and AD, aiming to identify highly associated factors. Therefore, the mathematical modeling approach provides an insightful understanding of the underlying disease processes.
This review begins with an overview of the mathematical models based on differential equations that are used to simulate brain Aβ levels (oligomers, protofibrils, and/or plaques), which is a hallmark of AD. The major mathematical models are compared, and their advantages and limitations are assessed. Mathematical formulas are not discussed in detail as this is beyond the scope of the current review. We specifically highlight the mathematical models based on the Smoluchowski equation and network modeling, which simulate the brain levels and/or the dynamic behavior (diffusion and aggregation) of Aβ, therefore simulating a closer reflection of physiological condition. We also propose how mathematical modeling can be incorporated into future cross-disciplinary medical research.
MATHEMATICAL MODELS PREDICTING THE BRAIN LEVELS OF Aβ
Mathematical modeling is a powerful tool for studying and understanding complex systems in various fields, such as physics [16], engineering [17], and biology [18]. To simulate brain levels of Aβ, mathematical models based on differential equations are typically used. These models are constructed to predict Aβ levels at later time points based on Aβ levels measured at earlier time points [19]. Some studies have used PET imaging data (especially for simple models) [20, 21], while others have used plasma/cerebrospinal fluid (CSF) biomarkers data (usually for complex ordinary differential equation (ODE) and partial differential equation (PDE) models) [22]. In these studies, some models focus on the levels of Aβ oligomers [23] or plaques [24], while others concentrate on the total amyloid burden [25]. Additionally, one study proposes strategies to construct the model using virtual data generated by some mathematical tools (e.g., MATLAB) [26]. Pallitto and Murphy were the first that attempted to describe the kinetics of Aβ aggregation using mathematical modeling [27]. Since then, researchers have continued to develop and refine the models to mimic biological processes for better prediction of Aβ levels in the brain. The advancement and refinement of mathematical models, along with the availability of powerful computational software, have been pivotal in redefining the challenge of replicating biological processes to enhance the prediction of brain Aβ levels. Previously, the construction and numerical solution of nonlinear ODE and PDE models posed a significant computational challenge [28], this was mitigated by the development of advanced computational software such as MATLAB and MATHEMATICA [29]. The combination of powerful computational software and improved mathematical models has enabled the successful implementation of these numerical solution methods. As a result, researchers have made substantial strides in accurately predicting Aβ levels in the brain, thereby facilitating a more precise emulation of biological processes and potential application in clinical contexts.
To date, numerous mathematical models have been developed with the goal of simulating the brain levels of Aβ. Although the first mathematical model can be traced back to 2001 [27], the first breakthrough application of PDE model to predict brain levels of Aβ oligomers was reported in 2013 [30]. Therefore, we have summarized existing mathematical models used to predict Aβ levels from 2013 to 2023 in Table 1. The studies are categorized into five major models, namely the general ODE model, the general PDE model, the network model, linear optimal ODE model, and the Smoluchowski equation model (SEM). The relationship between these different types of models is shown in Fig. 1.
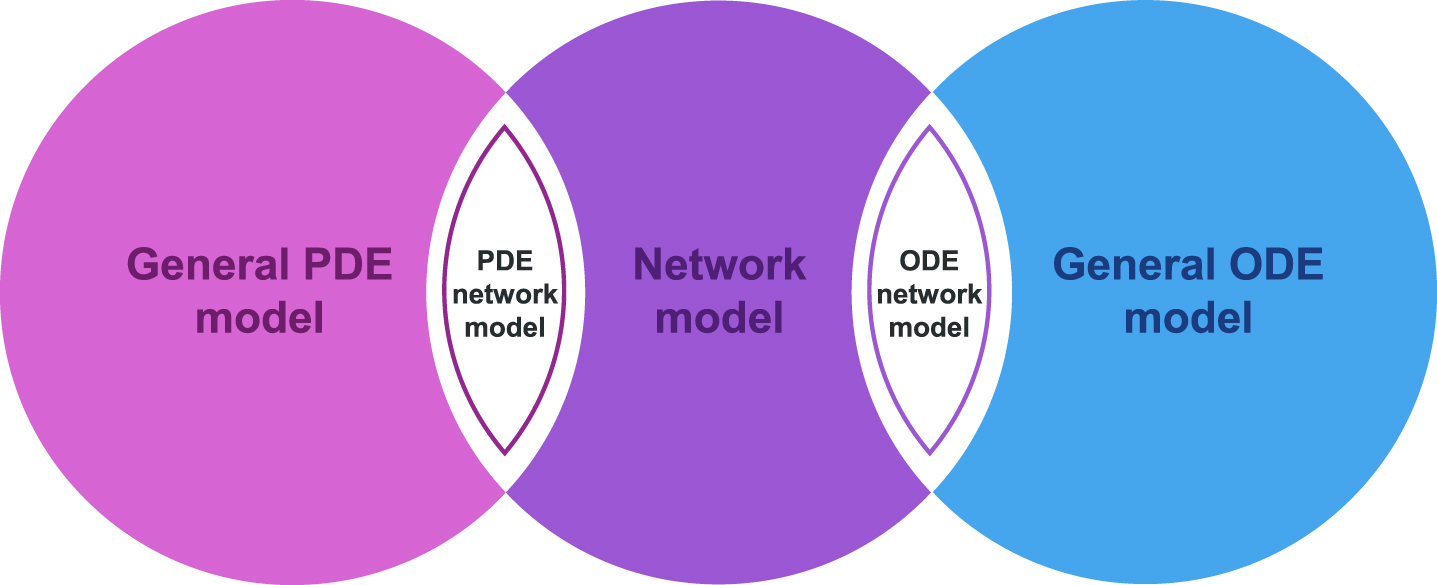
The relationship between the mathematical models. SEM and the linear optimal ODE model are two special cases of the general PDE and ODE, respectively. The combination of PDE and network modeling is known as the PDE network, while the combination of ODE and network modeling is known as the ODE network.
Mathematical models for Aβ accumulation from 2013 to 2023
GENERAL ODE MODELS
The general ODE models are used to illustrate the changes over time for a single or multiple components within a system. In the context of AD, ODE models describe the change of Aβ levels over time [31], considering multiple factors such as Aβ production, diffusion, and clearance. This can provide insights into the Aβ-mediated pathogenesis in AD and help identify potential therapeutic targets [32, 33]. In addition, when considering the system of ODE models, some other factors that play an important role in the production of Aβ (e.g., tau, neurofibrillary tangles) can be incorporated in the description of brain geometry [31]. In the application, these ODE models can also be used to predict how different therapeutic interventions, such as drugs or lifestyle modifications, affect Aβ levels over time [34]. These models can be applied to predict the Aβ-lowering effect of new drugs, and therefore inform the design of clinical trials, including dosing regimen. ODE models assume that Aβ levels increase continuously over time, as they can only be applied to continuous processes [31]. The major drawback of ODE models is that the pathogenesis of AD is still not clearly understood (i.e., Aβ pathology may not be the single underlying mechanism of the disease), making it impossible to find all the components related to AD for modeling [31].
GENERAL PDE MODELS
General PDE models are equations that involve multiple independent variables and their partial derivatives. These equations describe how variables in a system change with respect to both space and time. In the context of AD, PDE models describe how the levels of Aβ vary at a given point in space and time. Unlike the ODE models, PDE models encapsulate the spatial distribution of Aβ within the brain tissue, which is important for understanding how the disease progresses in different brain regions [35]. This helps to identify specific brain regions that are particularly vulnerable to Aβ accumulation and guide the design of interventions that target specific brain regions. The PDE models assume continuous changes in the system for both space and time. Similar to the general ODE models, the interaction between all components in the PDE model system must be known [36]. The major pitfall of these models is their complexity and the difficulty in finding exact solutions, especially when dealing with complicated relationships within the model. In many cases, only numerical solutions can be found, which can lead to mathematical limitations and inaccuracies [37].
NETWORK MODEL
Network models are built upon graph theory, where the graph consists of vertices and edges. Each vertex on the graph can be associated with a PDE or ODE, and a vertex can sometimes interact with another vertex, which is therefore connected by an edge. Network models describe the behavior of a system (i.e., ODE, PDE system) in terms of interacting components, where the behavior of each component is influenced by its neighborhood [38].
The components represent different particular chemical species, such as proteins affected by AD, while the interaction between the components reflect distinct biological processes, including neuroinflammation and neuronal death or neurodegeneration [39]. One advantage of the network models is their ability to capture the complex and dynamic nature of biological interactions, allowing the prediction of how changes in one component of the system will affect behavior of the others [40]. Network models assume that the brain network is static, meaning that the connections between each functional component in the brain are fixed and time-invariant [41]. This assumption contributes to a major limitation of this model, as in real-brain networks, the connections between functional components in the brain changes with the progression of AD [42]. For example, in Haass and Selkoe’s study, large aggregates of a disease causing protein can actually be inert to neurons, although these protein aggregates are toxic to the neurons at the early stage of AD [43].
LINEAR OPTIMAL ODE MODEL
Unlike the general ODE models that aim to construct a general model for typical use, the linear optimal ODE model focuses on simulating the personalized brain levels of Aβ [11]. It employs a linear optimal method to construct a personalized model for each patient to establish the most appropriate ODE model. This approach improves the accuracy in the prediction of Aβ levels compared with the general ODE models. However, although this personalized approach can be effective, it may not be practical for implementation in a large population, which is likely to be cost prohibitive.
SEM MODEL
The SEM as a particular PDE model in statistical physics aims to describe the dynamics of aggregation of particles in fluids. It is a natural candidate for modeling the behavior of Aβ monomers [27] and suitable for simulating large numbers of Aβ monomers in a complex environment such as the brain [44]. The SEM has the potential to provide a more comprehensive understanding of the aggregation process of Aβ in AD when integrated with other models such as nucleation and growth models [45]. This may aid in the identification of critical factors that drive Aβ aggregation in AD and to guide the development of new treatments. As a specifically highlighted mathematical model, we will give more general details about SEM in the following sections.
General information about the Smoluchowski equation
Smoluchowski equation is suitable to describe aggregation phenomena [46, 47], which is similar to the aggregation of Aβ during the progression of AD. The Smoluchowski equation incorporated with the diffusion term is described in Equation 1. Further mathematical details of this equation can be found in a note written by Herrero et al. [48].
In Equation 1, u
i
(x, t) denotes the concentration of aggregates containing i monomers at the position x in the domain of interest
Assumptions and limitations of the SEM
Although the SEM is a useful tool for understanding the physical processes involved in protein aggregation and diffusion, it does not incorporate the complex biology of AD. In particular, the Smoluchowski equation does not consider the various biological factors that influence Aβ aggregation, such as the presence of other proteins or cellular structures, enzyme activity, or the immune response to Aβ [49]. In addition, Aβ aggregation does not occur in a single step, but indeed takes a series of steps starting with initial seeds, soluble small oligomers, protofibrils, and insoluble polymers, which eventually form amyloid fibrils with Aβ sheet conformation [50]. In the studies of the SEM application in informing Aβ aggregation, Aβ aggregation is simplified from monomers to soluble oligomers and then to long fibrils [30, 52]. The primary reason for this simplification is to reduce the computational challenges. Moreover, parameter estimation in SEM requires data specifying levels of Aβ from multiple time points. As a result, in SEM, the levels of Aβ is typically measured through blood or CSF biomarkers, rather than using imaging data. Despite these limitations, the capacity of SEM to simulate the accumulation and diffusion behavior gives a more detailed depiction of the dynamic mechanisms of Aβ, which helps researchers have deeper insights into comprehending the progression of AD. Furthermore, the advancements in computer science have facilitated the accessibility of substantial computing resources, this will overcome the computational challenge and make the application of SEM in simulating the several steps of accumulation of Aβ become possible.
Advantages of SEM compared with other models
Although there are many mathematical models available, the SEM offers several advantages over the other models when simulating brain levels of Aβ. Unlike general ODE models, the SEMs also provide spatial information. For example, Bertsch et al. have applied the SEM to conduct a qualitative analysis of the levels of Aβ42 oligomers in the brain [51]. This model can be used to predict the levels of Aβ42 oligomers in any brain region at any future time point, which has the potential to facilitate early diagnosis of AD and predict the progression of amyloid pathology. In addition, the Smoluchowski equation is a PDE model that incorporates the diffusion and aggregation terms. Both terms are essential to describe the dynamic behavior of Aβ monomers at the microscopic level. The diffusion term describes the movement of Aβ monomers in the brain, while the aggregation term expresses the formation of Aβ plaques from monomers (as illustrated in Fig. 2). The dynamic behavior of Aβ is often neglected by other PDE models that focus on AD progression at the macroscopic level (e.g., cognitive function) [12, 53].
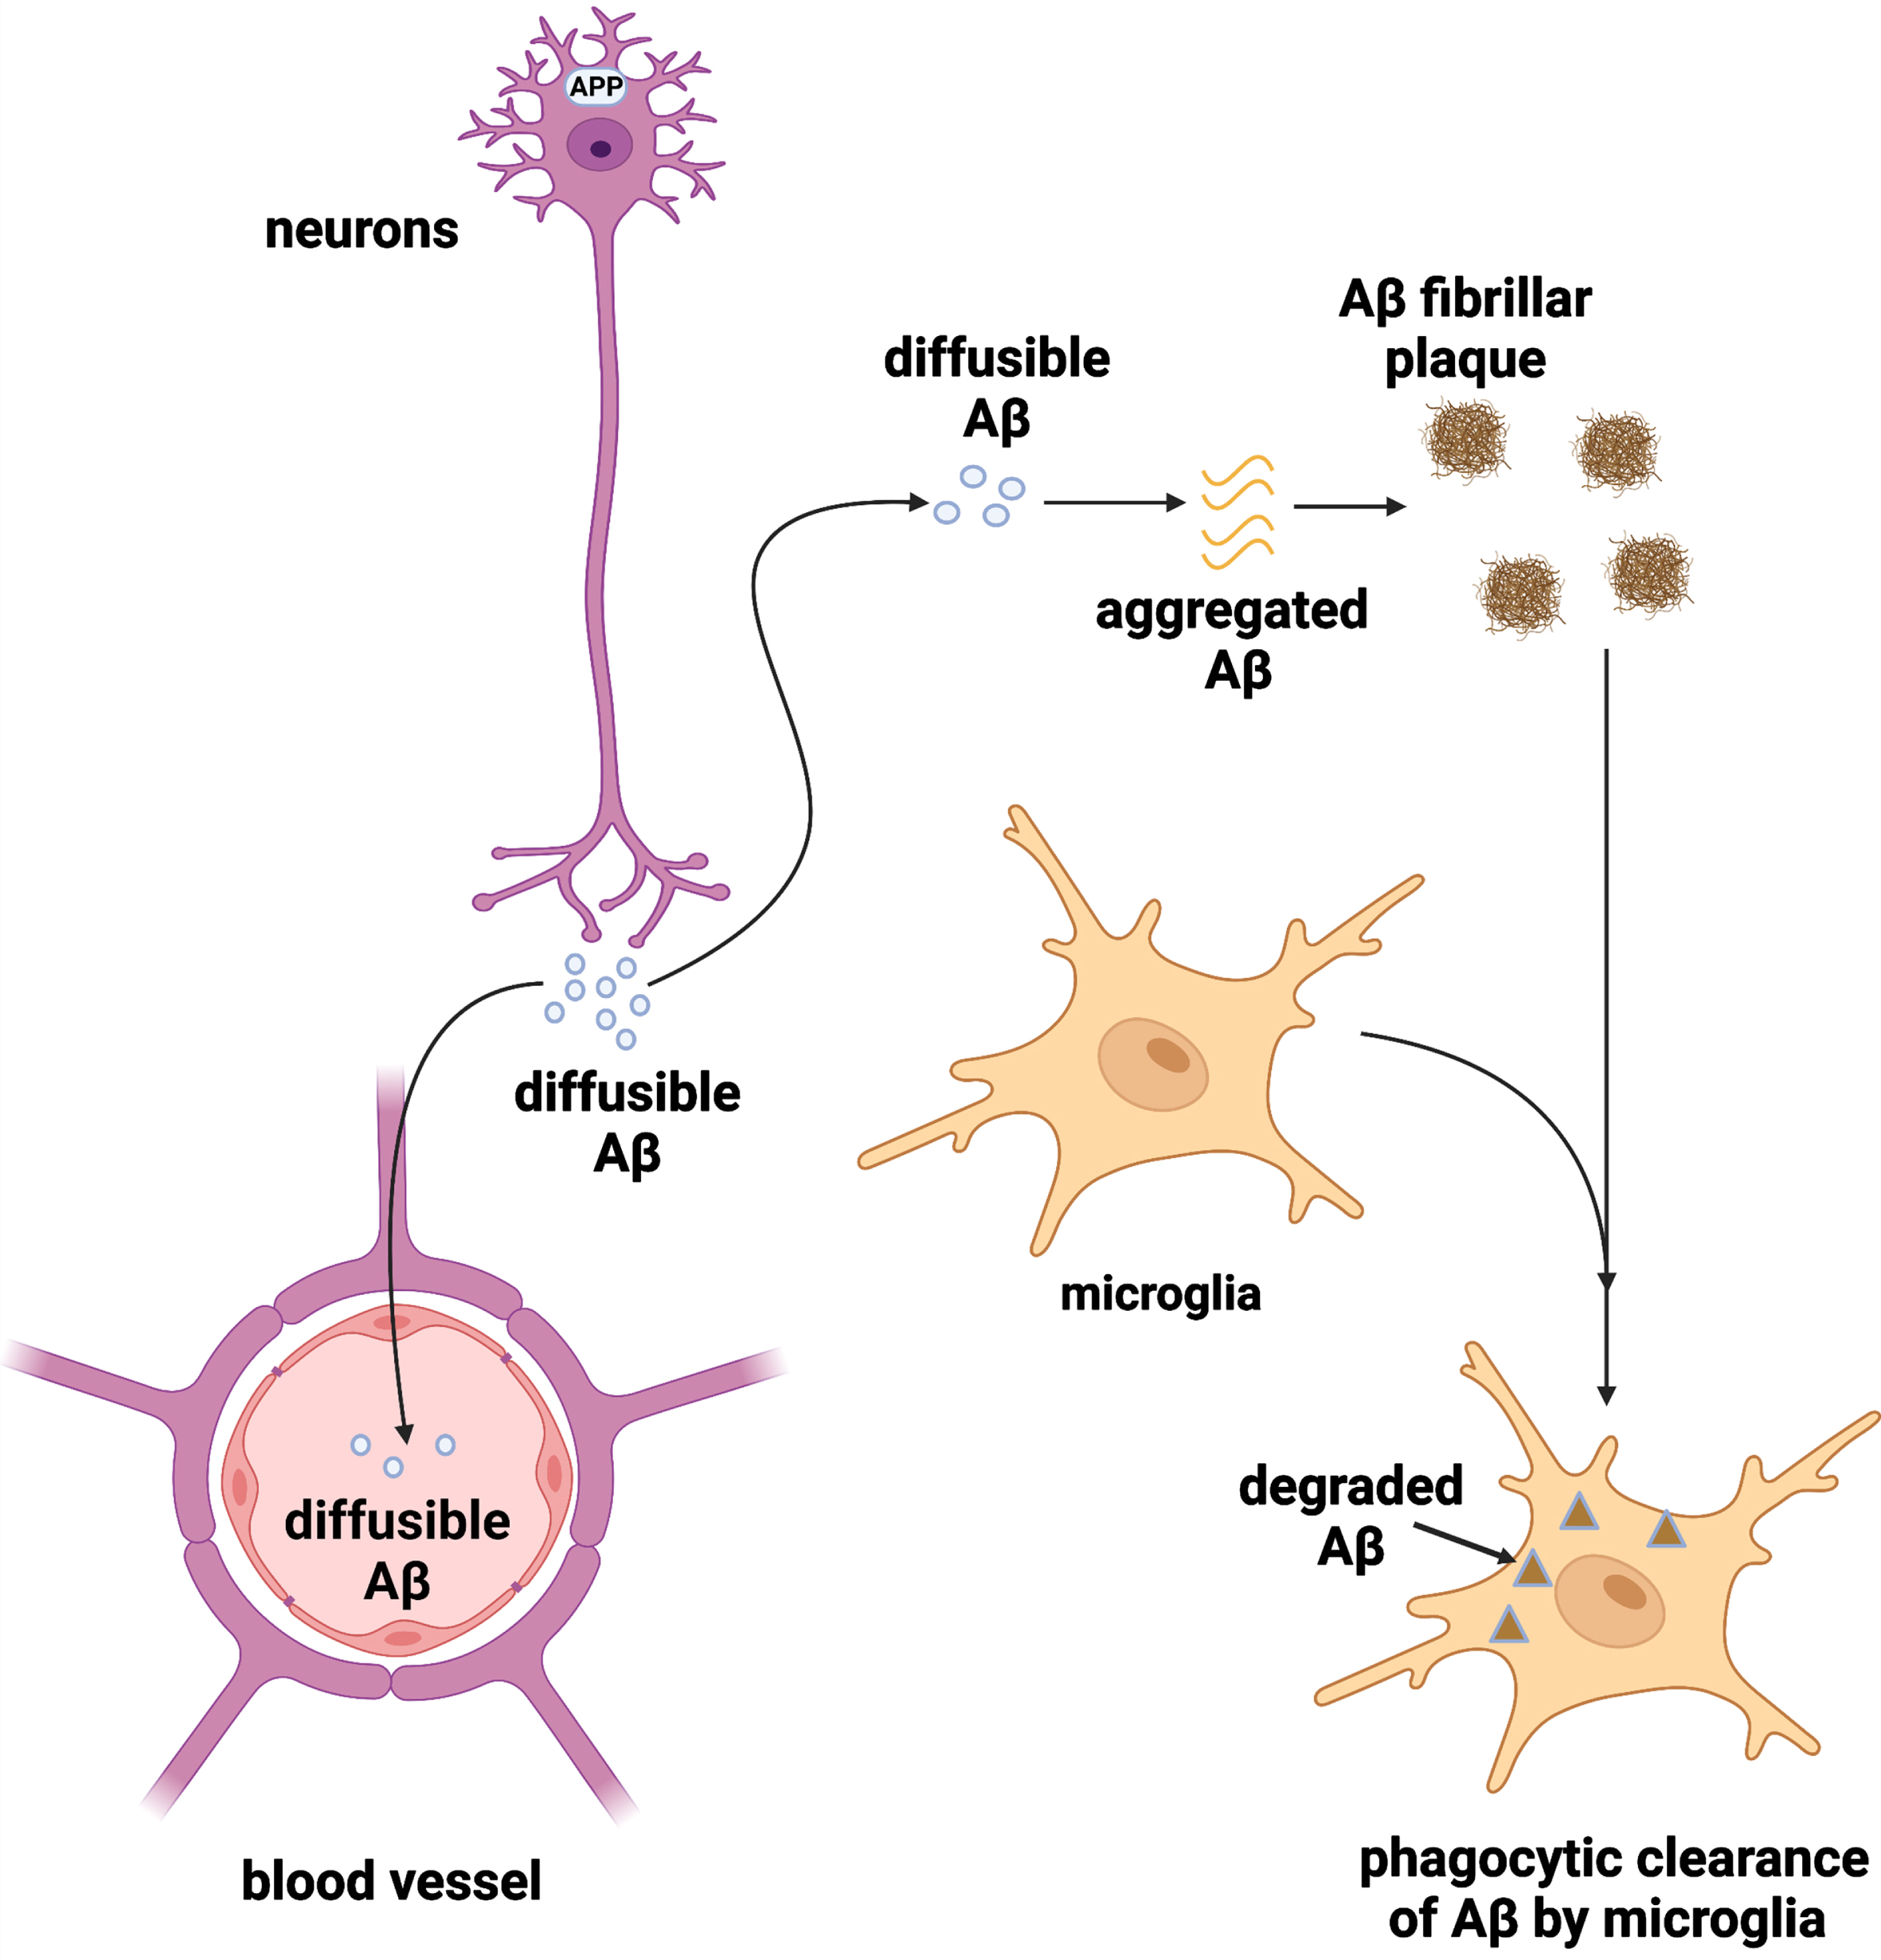
Diffusion, aggregation, and clearance of Aβ. Aβ monomers are produced by neurons by cleavage of the amyloid precursor protein, which diffuse within the brain. The soluble Aβ monomers aggregate to form Aβ fibrillar plaques. The Aβ monomers and Aβ fibrillar plaques are cleared from the brain via the blood-brain barrier and the phagocytic activity of microglia, respectively. The figure was created in BioRender.
Modifications of SEM for modeling Aβ
Over the last decades, several research groups have modified the Smoluchowski equation to incorporate biological concepts and develop modified SEMs (summarized in Table 2). The history and development of SEM is shown in Fig. 3. The Smoluchowski equation was introduced by Smoluchowski in 1918 to describe the aggregation of particles [46], which has been applied in physics and chemistry. A few decades later, Achdou et al. and Bertch et al. pioneered the application of the Smoluchowski equation to construct an Aβ40 and Aβ42 aggregation and diffusion model which aimed to predict the levels of Aβ oligomers for the early diagnosis of AD [30, 51]. The brain region of interest in this model is the hippocampus and cerebral cortex, as they are the primary areas affected by AD [54]. To construct Achdou’s model, a definite spatial scale must be fixed [30]. This scale is much larger than the neurons, but it is still microscopic (e.g., a portion of the hippocampus). That is, Achdou’s model does not consider the interaction between the selected brain portion and the rest of the brain, nor the clinical manifestations of AD (i.e., macroscopic levels). Achdou’s model assumes that the Aβ monomers follow a linear diffusion. Therefore, considering the macroscopic levels and the interaction of Aβ monomers with other molecules will invalidate this model [55].
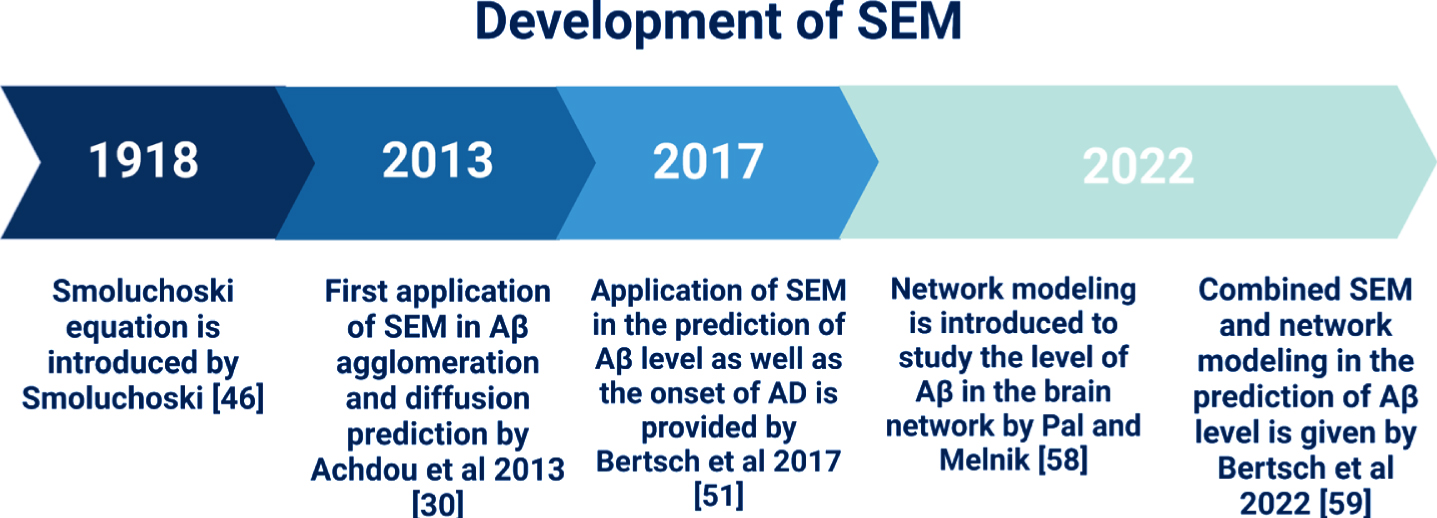
Timeline of the development of SEM. The Smoluchowski equation was first introduced in 1918 and its application to Aβ aggregation and diffusion was first documented in 2013. In 2017, Betsch et al. used the SEM to predict both the Aβ brain levels and the onset of AD and validated it using magnetic resonance imaging. In 2022, Pal and Melnik employed network modeling to predict brain levels of Aβ, which was later incorporated into SEM by Bertsch et al. in 2022.
Mathematical models for the prediction of Aβ levels in AD using the Smoluchowski equation
Achdou’s model only considered the accumulation and diffusion of Aβ without the onset of AD. In order to predict the onset of AD, in 2017, Bertsch et al. incorporated a method of treating multiple time scale into the Smoluchowski equation and constructed a SEM that concerned Aβ42 deposition and predicted AD onset [51]. Bertsch’s model was developed to account for the progression of AD, that occurs over years, whereas the diffusion and aggregation of Aβ occurs in a relatively short time [51]. Two temporal scales were introduced in Bertsch’s model, i.e., a short, rapid scale (t) for the diffusion and aggregation of Aβ, and a longer, larger scale (T) for the progression of the disease. For computational efficiency, only one variable (time) is considered in a PDE system, a small constant 0 < ɛ < <1 was introduced to consider the relationship between the different time scales. Considering that neuronal damage reflects the progression of AD [56], Bertsch et al. incorporated neuronal damage (parameter α) into the Smoluchowski equation, where a value of α close to 0 indicates a healthy neuron, while a value close to 1 represents neuronal death [51]. Bertsch’s model therefore allows simulation of Aβ plaques levels in the brain and prediction of the onset of AD (i.e., brain Aβ plaques levels exceed a threshold). Additionally, the model also accounted for the clearance of Aβ plaques via the blood-brain barrier and microglia phagocytosis [57], which is a development of the diffusion-aggregation model introduced by Achdou et al. in 2013. Bertsch’s model assumed that malfunctioning neurons are detrimental to their healthy neighboring neurons, while healthy neurons do not affect the malfunctioning neurons, and that only Aβ oligomers are toxic, while monomers and plaques are not. In addition, this model assumed that the damaged neurons produce more Aβ than healthy neurons, and that Aβ is not produced by dead neurons [51]. However, whether these assumptions made for Bertsch’s model are (patho)physiologically true should be carefully evaluated. On the other hand, although the Bertsch’s model [51] addressed the significant difference between the time scale of Aβ diffusion/aggregation and the onset of AD, it neglected the effects of other factors (e.g., hyperphosphorylated tau, neurofibrillary tangles) on the production of Aβ in AD.
To overcome the limitations of Bertsch’s model, a network modeling method was developed. Pal and Melnik employed network models to simulate the Aβ oligomers levels in the brain [58]. This model considered how the pathological changes in AD affect the production of Aβ. However, Pal and Melnik’s model neglected the aggregation behavior of Aβ oligomers. Later in 2022, Bertsch et al. constructed a SEM-network model, which utilized SEM to describe the aggregation and diffusion of Aβ and employed the network model to simulate the brain network [59]. This improvement overcame the limitation of traditional SEMs that solely focus on Aβ. The aggregation-network-diffusion SEM introduced by Bertsch et al. gives a more comprehensive and detailed depiction of Aβ plaque levels within the brain network.
POTENTIAL CLINICAL APPLICATION OF THE MATHEMATICAL MODELS IN AD
The mathematical models have real potential to be used in the clinic for the prediction of brain levels of Aβ and the onset of AD (i.e., brain Aβ levels reach a predetermined threshold assessed by PET). This approach is supported by the prognostic utility of patient-specific mathematical models in cancer research, such as the prediction of patient survival through the modeling of the c-Jun N-terminal kinase pathway network dynamics in neuroblastoma [60]. Additionally, the potential prognostic and clinical utility of mathematical modeling has been demonstrated in glioblastoma research through the modeling of tumor invasiveness [61], discrimination of patient survival outcomes [62], and the optimization of radiotherapy [63]. The proposed pipeline for the implementation of mathematical modeling in AD risk prediction is shown in Fig. 4.

The proposed clinical application of mathematical models.
Using mathematical models, clinicians can identify who is at risk of AD and estimate the age at which a population or an individual may develop AD. Appropriate interventions can therefore be initiated for timely treatment to improve the quality of life for those who are at risk of AD. Moreover, mathematical models are likely to be more cost-efficient. However, for most mathematical models discussed in this review, their application to PET imaging data may be limited, as data from different time points are required. The use of multiple PET scans may result in high costs [64]. Simple mathematical models, e.g., linear statistical model, can be applied to PET imaging data, where only a small number of data points are required. For instance, Villemagne et al. employed a curve fitting method to construct linear, quadratic, and cubic mathematical models for predicting the rates of Aβ decomposition [20]. Similarly, Schindler et al. [21] successfully utilized the fitting curve method to construct the model that describes brain Aβ levels over time. In their model, only a few PET scans are needed as initial measurement data for predicting the onset of AD by identifying the critical time point of the curve that reflects the rapid change in Aβ levels [21]. For complex models such as SEM, numerous parameters and longitudinal data are required for them to provide detailed information on the levels of Aβ in the brain network. In various studies, CSF or blood biomarkers data rather than PET imaging data has been used [15, 66]. By using data collected from longitudinal dementia cohorts, scientists can develop an Aβ aggregation model from CSF or blood biomarkers. For example, in [51] the levels of Aβ42 and the global brain atrophy are evaluated by numerical simulation, which demonstrates the potential practical application of SEM. Moreover, in [59], using MRI data, the total burden of Aβ and tau in the whole brain and local burden of Aβ and tau in different regions are simulated by SEM, where synergetic action of these two proteins was confirmed by the numerical simulation. Future research is required to construct a global model that can explain the interaction and behavior of various biomarkers including Aβ, phosphorylated tau and others.
In addition, mathematical models can be developed to evaluate the effectiveness and safety of potential treatments for AD before they are evaluated in clinical trials. This could help streamline the drug development process and identify the most promising treatments to be assessed in clinical trials. There have already been some advancements in this research field; for example, a mathematical model has been used to simulate the effects of aducanumab on Aβ clearance [11]. By adjusting the parameters of the model to reflect the pharmacokinetics and biology, researchers can predict how a drug would affect Aβ levels in the brain and how this would slow down cognitive decline. Using a quantitative amyloid/tau/neurodegeneration mathematical model (i.e., modified type of ODE model) with Alzheimer’s Disease Neuroimaging Initiative dataset, Roche has performed a clinical trial simulation on gantenerumab (an anti-amyloid antibody drug), which shows that amyloid PET levels decrease markedly with continued anti-amyloid treatment over 5 years [22]. Furthermore, mathematical modeling also makes it possible to evaluate the potential benefits of combined therapies. For example, combined therapy with etanercept (a tumor necrosis factor alpha inhibitor) and aducanumab (an anti-amyloid drug) could yield a significant efficacy in slowing the progression of AD [67]. By simulating the effects of different drug combinations, researchers can identify the most promising treatment strategies and prioritize them for clinical trials, which is illustrated in Fig. 5.

The clinical application of mathematical models in treatments for AD.
CONCLUSIONS
This review provides an overview of the main mathematical models that have been employed to predict the brain levels of Aβ and their application in tracking the levels of Aβ during the progression of AD. It is evident that SEM has received a multitude of attention for its use in AD research and potential clinical use. Existing work has demonstrated the possibility of combining the Smoluchowski equation and network modeling to investigate the levels of Aβ in AD patients but has not yet been applied to predict the onset of AD at critical time points, which can be explored in future studies. Additionally, deriving an efficient and low error numerical method would contribute to the practical application of SEM and improve the accuracy in the prediction of Aβ levels. Moreover, constructing complex mathematical models like SEMs demands a substantial dataset. Due to the numerous parameters involved in the model, many longitudinal data points are required to accurately determine these parameters. Using blood biomarkers could be a suitable option to construct such models and evaluate their performance in future studies since longitudinal blood samples are relatively easier to be obtained than imaging data (PET).
On the other hand, close collaboration between mathematicians, biomedical scientists and clinical researchers should be encouraged to ensure that the models better reflect the known physiological and pathophysiological processes, which can help identify new targets for treatment and improve our understanding of the disease. Personalized medicine approaches could also be developed by using mathematical models to predict response to treatment and identify patients who are most likely to benefit from a particular therapy. This could help improve treatment outcomes and reduce the risk of adverse effects.
Overall, mathematical modeling has the potential to impact our understanding and treatment of AD. Given the magnitude of the global AD burden, collaboration across disciplines, including neuroscience, molecular biology, computational modeling, is critical to improving our understanding of AD and developing effective prevention, diagnosis, and treatment strategies.
Footnotes
ACKNOWLEDGMENTS
The authors have no acknowledgments to report.
FUNDING
The salary of Y.P. and APC were funded by National Health and Medical Research Council (grant number GNT2007912) and Alzheimer’s Association USA (grant number 23AARF-1020292).
CONFLICT OF INTEREST
Colin Masters is an Editorial Board Member of this journal but was not involved in the peer-review process nor had access to any information regarding its peer-review.
All other authors have no conflict of interest to report.