
Abstract
Background:
Alzheimer’s disease (AD) involves brain neuropathologies such as amyloid plaque and hyperphosphorylated tau tangles and is accompanied by cognitive decline. Identifying the biological mechanisms underlying disease onset and progression based on quantifiable phenotypes will help understand disease etiology and devise therapies.
Objective:
Our objective was to identify molecular pathways associated with hallmark AD biomarkers and cognitive status, accounting for variables such as age, sex, education, and APOE genotype.
Methods:
We introduce a pathway-based statistical approach, extending the gene set likelihood ratio test to continuous phenotypes. We first analyzed independently each of the three phenotypes (amyloid-β, tau, cognition) using continuous gene set likelihood ratio tests to account for covariates, including age, sex, education, and APOE genotype. The analysis involved 634 subjects with data available for all three phenotypes, allowing for the identification of common pathways.
Results:
We identified 14 pathways significantly associated with amyloid-β; 5 associated with tau; and 174 associated with cognition, which showed a larger number of pathways compared to biomarkers. A single pathway, vascular endothelial growth factor receptor binding (VEGF-RB), exhibited associations with all three phenotypes. Mediation analysis showed that among the VEGF-RB family genes, ITGA5 mediates the relationship between cognitive scores and pathological biomarkers.
Conclusions:
We presented a new statistical approach linking continuous phenotypes, gene expression across pathways, and covariates like sex, age, and education. Our results reinforced VEGF RB2’s role in AD cognition and demonstrated ITGA5’s significant role in mediating the AD pathology-cognition connection.
INTRODUCTION
Alzheimer’s disease (AD) has a deleterious impact on American lives, as over 6 million individuals are currently afflicted with AD, with a projected twofold increase by 2050. The disease’s high mortality rate claims 1 in 3 seniors while imposing significant economic burdens, costing the nation billions [1]. However, the biological background conducive to developing AD remains unknown. The aim of this study was to address the existing knowledge gap by pinpointing molecular pathways that play a crucial role in modulating levels of hallmark AD pathologies, as well as memory function.
One strategy to better understand and accurately model multi factorial conditions such as late-onset AD, is to incorporate various genetic, clinical, and environmental factors into a cohesive model. This model should establish connections between measurable biomarkers and risk factors. Several known factors play a significant role in shaping the risk of AD. These factors encompass both genetic influences, such as APOE genotype and sex, as well as environmental elements, including education level, diet, and age. In recent years, the identification and characterization of AD have been facilitated by the use of biomarkers like amyloid-β (Aβ), phosphorylated tau (tau), in conjunction with measures of neurodegeneration. Furthermore, AD is distinguished by memory impairment, often evaluated using the Mini-Mental State Evaluation (MMSE).
Still, the molecular mechanisms involved in the etiology and progression of AD are not fully understood. Recent publications have revealed a role for multiple pathways in AD, based on brain proteomics and transcriptomic analyses [2, 3]. These pathways are relevant not only to neurons but also to cells regulating response to inflammation [4], such as microglia [5]. Interestingly endothelial cells, astrocytes and neurons that control neurovascular functions have been shown to play an important role in AD [6]. Other cell types and subcellular components such as mitochondria may be involved [7]. Liu et al. [8] identified a novel brain-enriched RING finger E3 ligase, RNF182, which shows elevated expression in AD brains and may play a role in controlling neurotransmitter release. Pathways involved with filament-based processes, cellular detoxification, and wound healing have also been involved [2, 3]. A decline in sensory function, including taste has also been reported with aging and AD [9]. Importantly, the vascular endothelial growth factor (VEGF) has been associated with AD [10, 11], and while its role in neurodegeneration is not fully understood, it presents a druggable target for therapies. However, most studies focused on comparisons of two or three groups of subjects using discrete classification variables, such as case/control, without accounting for the relationships between multiple hallmark biomarkers. Here we propose an approach to detect common gene pathways based on RNA-Seq changes associated with continuous-scale changes in multiple biomarkers and clinical phenotypes.
Our study aims to develop a statistical approach centered around identifying gene pathways involved in one or more quantitative biomarker changes in AD. This method incorporates continuous estimates of Aβ and tau tangle brain levels, along with memory scores from the MMSE, and integrates them into a comprehensive statistical model. Additionally, we include disease-relevant traits such as age, sex, education, and APOE genotype in this model. We note that some of these traits are continuous, and some are categorical. Our primary goal is to rank the pathways that undergo alterations in AD, considering the influence of each of the biomarkers. By doing so, we can effectively identify shared pathways across the three domains: amyloid, tau, and cognition, through MMSE scores.
Our approach factors in the unique characteristics of human subjects, including age, sex, education, and APOE genotype-specific differences. It also evaluates the significance of the relationship between pathway-level interactions and the presence of AD in relation to each of these factors. We conduct analyses using human transcriptomic data on AD progression and explore interactions between individual gene expression in each gene pathway with the APOE genotype.
To identify relevant gene sets, Subramanian and colleagues [12] introduced Gene Set Enrichment Analysis (GSEA), a robust analytical method for interpreting gene expression data from genome-wide RNA analysis. GSEA focuses on gene sets—groups of genes with shared biological function, chromosomal location, or regulation—and demonstrates effectiveness in identifying common biological pathways, e.g., for cancer-related data sets, such as leukemia and lung cancer, where single-gene analysis falls short. This method using the Kolmogorov-Smirnov statistics which has a limitation in that it does not account for gene-gene interactions. Still, this landmark paper has spurred the development of many other methods [13]. Other statistics have been proposed as well, e.g., the gene set likelihood ratio test (gsLRT), which uses a logistic regression model [14]. However, this particular model has its limitations as it is only applicable to binary outcome variables. In contrast, our study proposes a method to deal with continuous-scale variables, specifically Aβ, tau, and MMSE scores. Additionally, we incorporated transcriptomic data, encompassing more than 20,000 genes, as opposed to the mere 542 genes used in the referenced gsLRT study involving proteomics.
This work extends the model originally proposed for the gsLRT from Logit to continuous phenotypes or outcome measures, and while this extension may seem straightforward, implementing such a model has not been previously undertaken in the context of gene pathways, and offers the benefit of being able to examine continuous outcomes. In our case we were able to identify that VEGFB plays a role in AD, affecting both Aβ and tau hallmark neuropathologies and cognition, and that the relationships between neuropathology and cognition are putatively found to be causally mediated by ITGA5.
METHODS
In this study, we introduce a new approach utilizing three biomarkers customarily assessed in LOAD: i.e., Aβ, tau tangles, and MMSE scores to identify common pathways significantly associated with the underlying changes in these biomarkers. Our methodology for identifying pathways uses transcriptomic data from the dorsolateral prefrontal cortex. By integrating transcriptomic data with biomarkers, we generate significance scores at the biological pathway level. We then extract the gene expression from the common significant pathway(s) and test if these genes causally mediate the relation between AD pathology (Aβ, tau) and cognition (MMSE). This step identifies important genes of the common significant pathway(s) selected by the statistical models.
Data and preprocessing
The data sample was taken from a subset of the Religious Orders Study and Rush Memory and Aging Project (ROSMAP) dataset [15–17] that had RNA-Seq data available from the dorsolateral pre-frontal cortex. ROS has enlisted nuns and brothers since 1994. MAP recruited individuals from the NORTHERN ILLINOIS region since 1997. Both studies were run by the same investigators using similar data collection techniques. Thus, the results from both are comparable. For the analyses reported in this paper, the clinical consensus diagnoses of AD or mild cognitive impairment were used to define a case, while the diagnosis of no cognitive impairment/no impaired domains defined controls. Additional covariates for the statistical models were age, sex, education, and APOE genotype. The total sample with both gene expression and clinical data contained 634 subjects, with 433 cases and 201 controls. Demographic information for the sample is summarized in Table 1.
Demographic information of participants by gender
Demographic information of participants by gender
This table presents the demographic information for a sample of 634 participants, categorized by gender. It includes the mean age and standard deviation (SD) for each group.
Following the context of [18], the amyloid and tangles metrics are computed as follows.
The overall amyloid level was determined as the mean percentage of cortex occupied by Aβ protein in multiple brain regions. This measurement was obtained through molecular-specific immunohistochemistry, where the Aβ protein is targeted and quantified using image analysis techniques. The Aβ score was calculated in eight brain regions, namely the hippocampus, entorhinal cortex, midfrontal cortex, inferior temporal cortex, angular gyrus, calcarine cortex, anterior cingulate cortex, and superior frontal cortex. At least four of these regions are required to calculate the mean Aβ score.
Tau tangles density was determined as the mean density of neuronal neurofibrillary tangles in eight specific brain regions. These tangles are identified using molecular-specific immunohistochemistry, employing antibodies specific to abnormally phosphorylated tau protein, known as AT8. The cortical density of tangles was measured per square millimeter using systematic sampling. The tangle score was calculated as the mean density in the same eight brain regions as above, for Aβ, and a minimum of four regions were required to compute the mean tangle density.
Clinical phenotypic information for the sample is summarized in Table 2.
Clinical phenotypic data for different cognitive states
MCI1 represents mild cognitive impairment (one impaired domain) and no other cause of Cognitive Impairment (CI). MCI2 represents mild cognitive impairment (one impaired domain) and another cause of CI. AD1 represents Alzheimer’s disease and no other cause of CI (NINCDS PROB AD). AD2 is for Alzheimer’s disease and another cause of CI (NINCDS POSS AD), and other dementia is other primary cause of dementia. This table presents key clinical phenotypic data for different cognitive states in a diverse sample population. The study includes individuals with no cognitive impairment, mild cognitive impairment (MCI), Alzheimer’s disease (AD), and other primary causes of dementia. The table provides mean scores and standard deviations for Mini-Mental State Examination (MMSE), Aβ levels, and log(tangles) for each cognitive state/phenotype. The findings highlight distinct cognitive profiles and potential biomarkers associated with various cognitive conditions, contributing to better understanding and targeted interventions for cognitive disorders.
The RNA-Seq data was obtained from the Accelerating Medicines Partnership Program for Alzheimer’s Disease Data Knowledge Portal (https://adknowledgeportal.synapse.org/), specifically, the RNA-Seq Harmonization study (https://www.synapse.org/#!Synapse:syn9702085). The ROSMAP data from this study was used to create a combined dataset of RNA-Seq data in combination with the three clinical phenotypes of amyloid burden, tangles, and MMSE [19]. The RNA-Seq Harmonization study has the goal of creating an RNA-Seq database based on a consensus set of analytical tools. The methodological details of the RNA-Seq processing are given in Wan et al. [20], and at the RNA-Seq reprocessing study website for the ROSMAP project (https://www.synapse.org/#!Synapse:syn8456629). In brief, RNA was extracted from samples consisting of approximately 100 mg of gray matter tissue from the dorsolateral prefrontal cortex. The RNA samples were prepared and sequenced as described in [19]. The reprocessing of the RNA-Seq data was done using a consensus set of tools with only library type-specific parameters varying between pipelines. Picard (https://broadinstitute.github.io/picard/) was used to generate FASTQ files from source BAM files. Generated FASTQ reads were aligned to the GENCODE24 (GRCh38) reference genome using STAR [21] and gene counts were computed for each sample. To evaluate the quality of individual samples, and to identify potentially important covariates for expression modeling, two sets of metrics were computed using the CollectAlignmentSummaryMetrics and CollectRnaSeqMetrics functions in Picard. To account for differences between samples, studies, experimental batch effects, and unwanted RNA-Seq specific technical variations library normalization and covariate adjustments for each study separately using fixed/mixed effects modeling. The workflow consists of the following steps: 1) gene filtering: Genes that are expressed more than 1 CPM (read Counts Per Million total reads) in at least 50% of samples in each tissue and diagnosis category were used for further analysis, 2) conditional quantile normalization was applied to account for variations in gene length and GC content, 3) sample outlier detection using principal component analysis and clustering, 4) Covariates identification and adjustment, where confidence of sampling abundance were estimated using a weighted linear model using the voom-limma package in Bioconductor [22]. For the differential expression analysis, fixed/mixed effect linear regression was used with the following models: gene expression ∼Diagnosis + Sex + covariates + (1| Donor) or gene expression ∼Diagnosis×Sex + covariates + (1|Donor), where each gene is linearly regressed independently with Diagnosis, a variable explaining the AD status of an individual, identified covariates, and donor information as a random effect. Observation weights (if any) were calculated using the voom-limma [22] pipeline such that observations with higher presumed precision are up-weighted in the linear model fitting process.
The data used for the gsLRT analysis included the phenotypes MMSE, amyloid burden and log(tangles). For gene expression, normalized and filtered counts were used as per the description on the RNA-Seq reprocessing study website (https://www.synapse.org/#!Synapse:syn8456629). The specific datasets used for this study are: RNA-Seq data is obtained from (https://www.synapse.org/#!Synapse:syn8456638), covariates are recorded in (https://www.synapse.org/#!Synapse:syn11024258), differential expression results are from (https://www.synapse.org/#!Synapse:syn8456721) and clinical phenotypic data was obtained from the ROSMAP data sharing resource (https://www.radc.rush.edu/). These datasets were organized into the specific matrices for gene expression results, covariates, and phenotypes required by the gsLRT program.
For the pathway/signature analysis, well-established databases including Gene Ontology Molecular Function (GOMF) were used to enable replication studies, support development of mechanistic hypotheses based on the findings and provide a framework for future work [23, 24].
To derive the pathways associated with each of the AD related phenotypes (Aβ, tau, or MMSE scores), we define the following hypothesis tests. In our models, we utilize a matrix
To assess the enhanced explanatory capacity of the interaction term between the gene measurement profile (g
j
) and genotype (APOE ɛ2, ɛ3, ɛ4), in contrast to the simpler model that merely includes the covariate matrix X and (g
j
), we introduce statistical measures that evaluate the disparity in the models via log-likelihoods at the gene level. These statistics act as our metric for quantifying the supplementary explanatory power.
We calculate p-value for each enrichment score through nperm = 10,000 permutation sampling by computing the proportion of
This empirical p-value computation provides more conservative estimates but is computationally intensive. Since gene set tests share overlapping membership and exhibit interdependence, the presented p-values in this context and subsequent tables have not been adjusted for multiple testing. Consequently, they do not possess theoretical guarantees for controlling the False Discovery Rate (FDR). Once the pathways are sorted by their significance or ES, identifying the shared pathways among the three model runs becomes possible.
The model utilized in this study closely resembles that developed by Bryan et al. [14], based on a logistic model, however our model accommodates a continuous outcome variable.
Mediation analysis
After identifying common significant pathways for Aβ, tau, and MMSE scores, we extracted gene expression g j for each significant pathway j ∈ G k and assessed if it causally mediates the relation between AD pathology (Aβ, tau) and cognition (MMSE), as shown in Fig. 1.
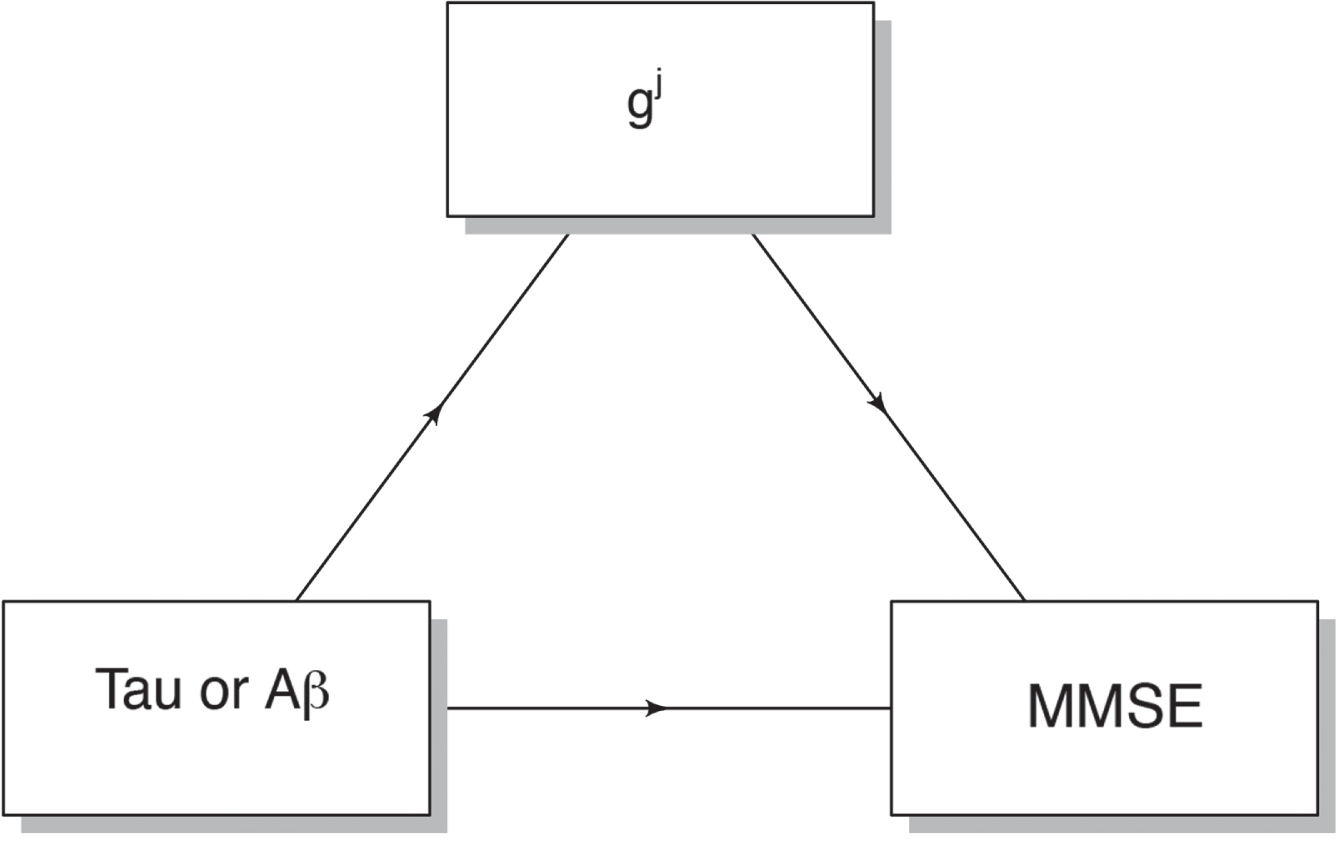
Mediation analysis. To assess the causal mediation effect of gene expression in predicting cognition (MMSE) based on AD pathology (Aβ or tau scores), our approach involves several steps. First, we treat MMSE scores as the dependent variable to be predicted, using Aβ or tau scores as separate independent variables in two distinct models. Within each of these models, we predicted the mediator variable, denoted as gj, using the respective independent variable. We performed this analysis using the “mediation” package in R, conducting 1000 permutations to compute p-values for the average causal mediation effects associated with each j ∈ G k in both models. Subsequently, we applied the False Discovery Rate (FDR) correction method at a 5% level to adjust the p-values, considering multiple comparisons within each model.
RESULTS
Using public resources from RNA-Seq analyses of prefrontal cortex in ROSMAP participants, we have identified pathways associated for Aβ, tau tangles, and MMSE, accounting for covariates, i.e., sex, genotype, education, age, and the interactions between RNA expression levels and APOE genotype.
We have identified significant pathways when examining the outcome of Aβ. We have chosen a p-value threshold of 0.1 instead of the conventional 0.05 for hypothesis decision-making to capture a broader range of potentially significant pathways. This slightly relaxed threshold allowed for a more inclusive analysis, potentially uncovering additional pathways that may contribute to our understanding of the relationship between Aβ and the identified pathways. Table 3 and Fig. 2 present the 14 significant pathways associated with Aβ, such as Translocase Activity, C3HC4 Type Ring Finger Domain Binding, and Vascular Endothelial Growth Factor Receptor 2 Binding.
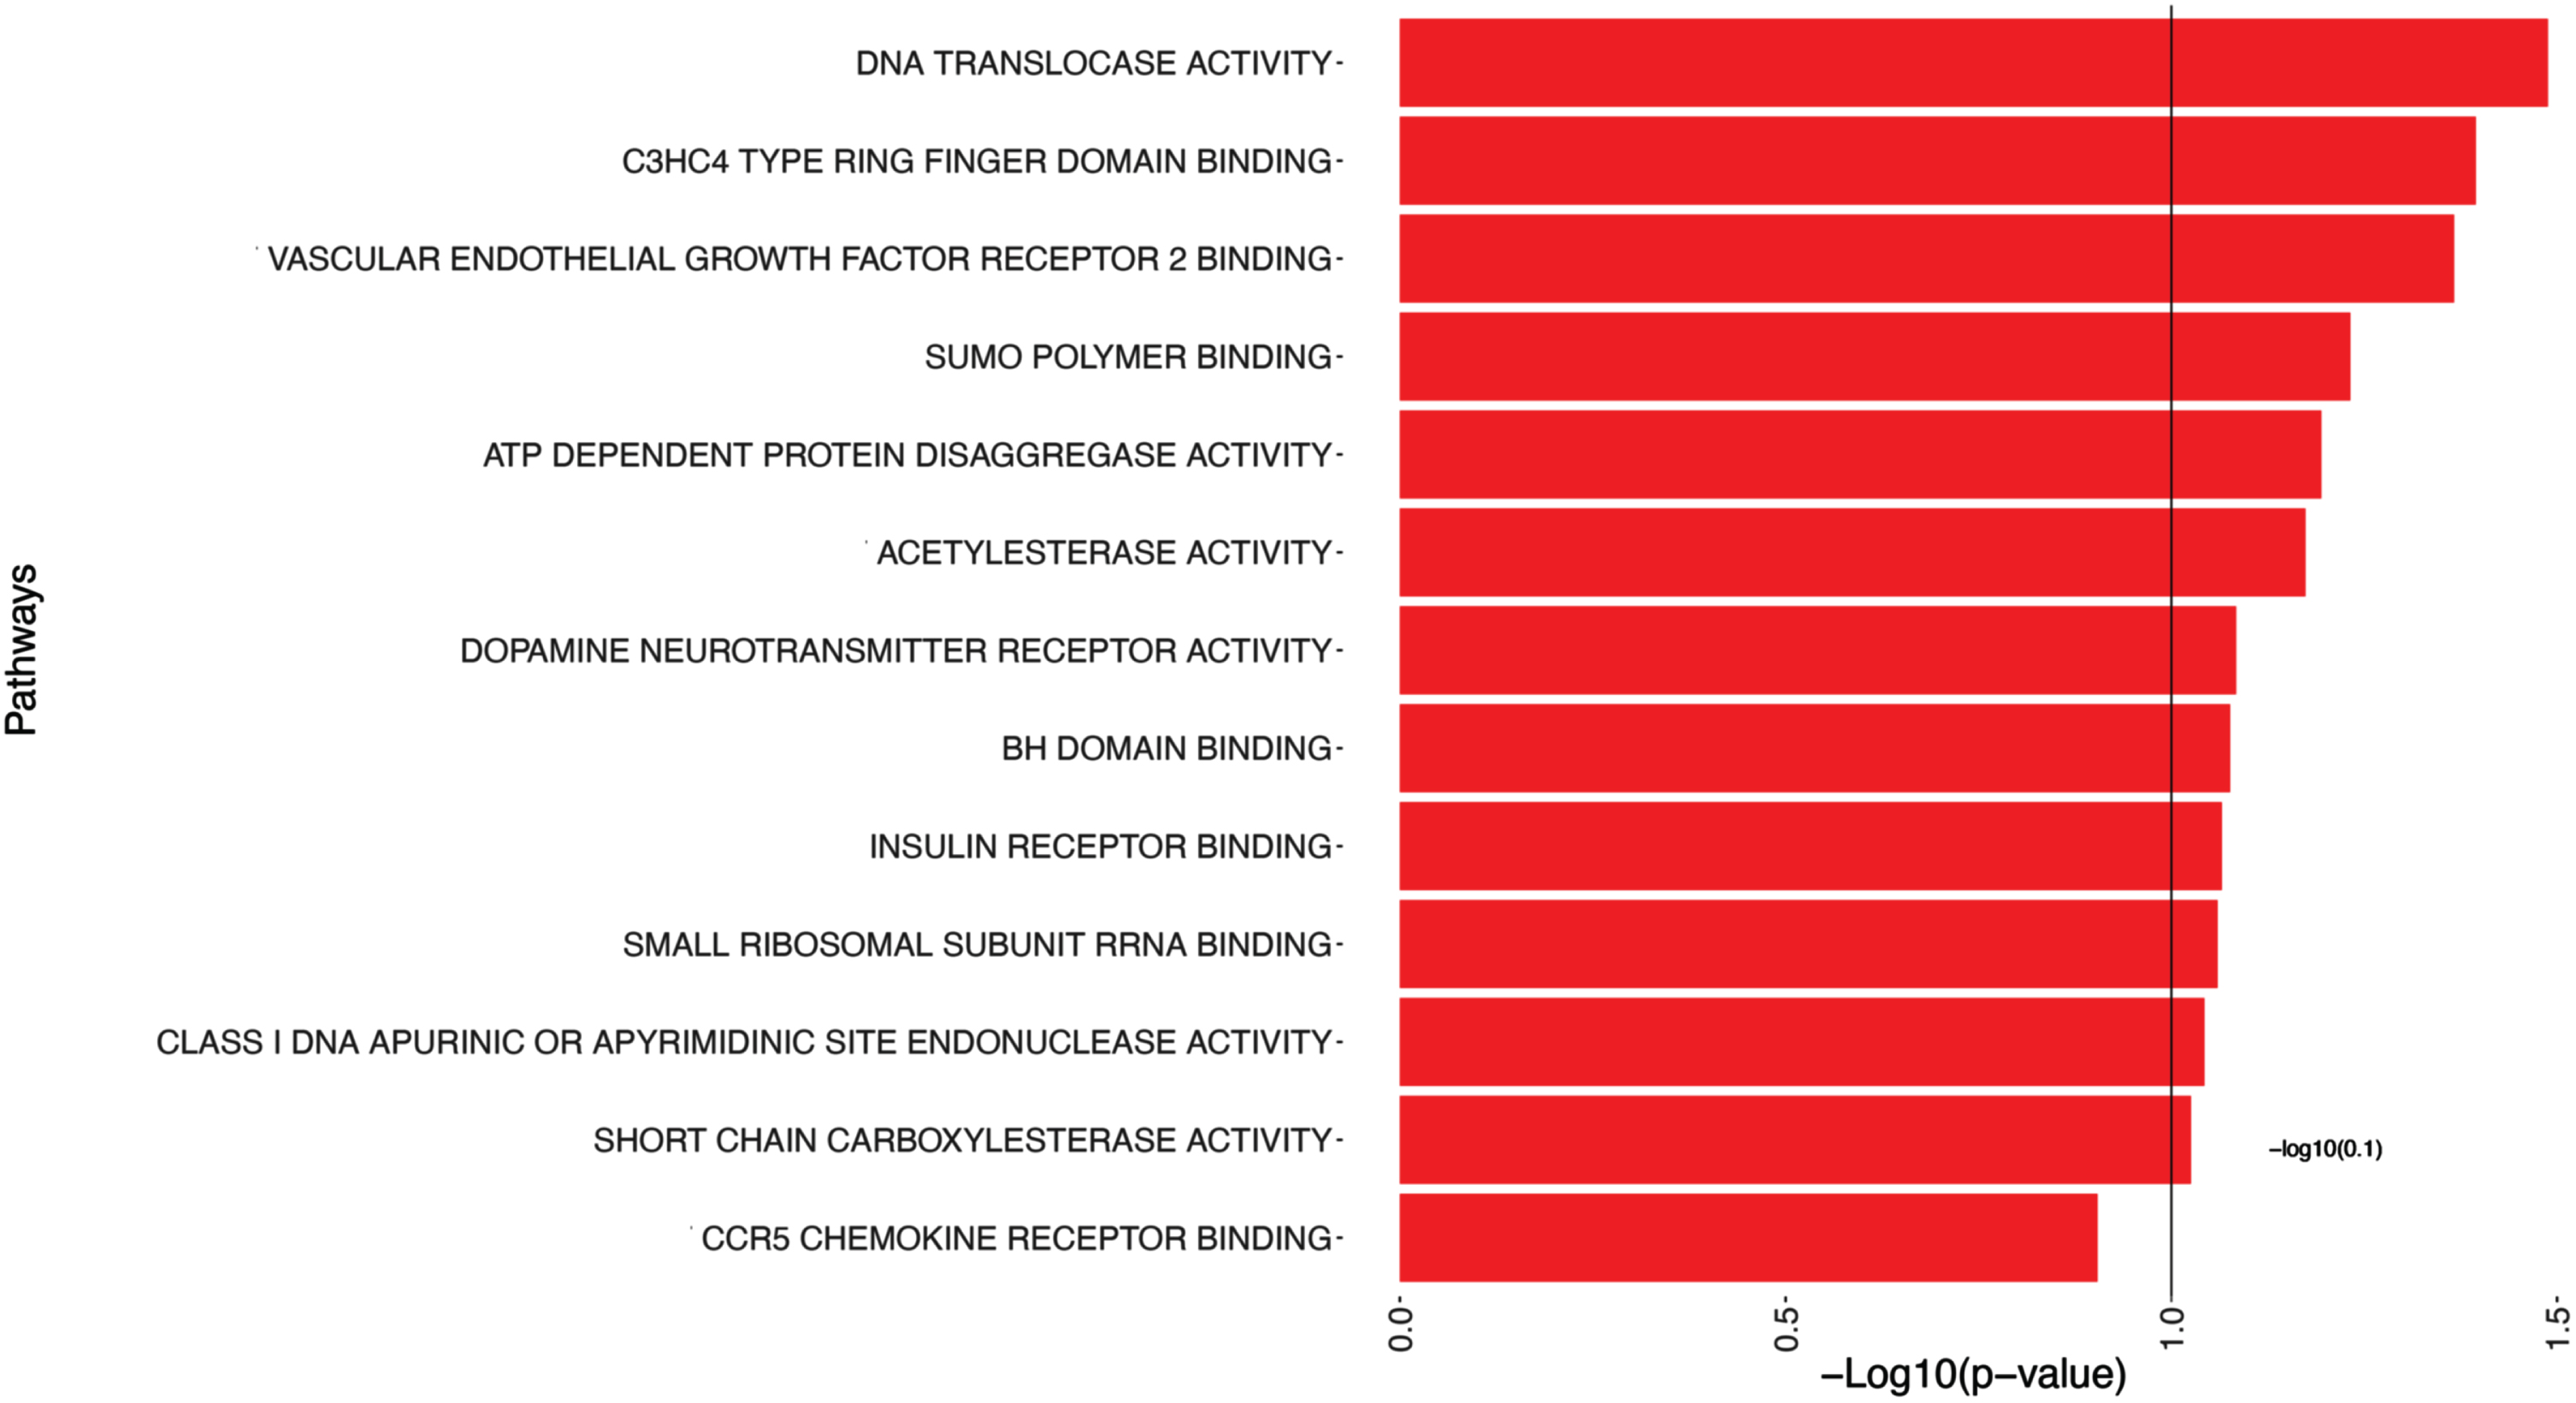
Pathway analysis of Aβ. Each pathway is represented on the y-axis, while the corresponding -log10(p-value) is represented by bars parallel to the x-axis, positioned in front of each pathway. The length of the bars reflects the statistical significance of the pathways with amyloid burden; longer bars indicating greater significance. This visualization allows for a quick assessment of the significance levels for each pathway, aiding in the identification of key pathways associated with Aβ.
Significant pathways associated with Aβ
This table presents the pathways that show significance (p-values smaller than 0.1) in relation to Aβ. The pathways listed provide insights into potential biological mechanisms and molecular processes associated with Aβ.
The 5 significant pathways associated with log(tangles) are presented in Table 4 and illustrated in Fig. 3, such as Bitter Taste Receptor Activity, Protein Glutamine Gamma Glutamyltransferase Activity, Taste Receptor Activity, and Vascular Endothelial Growth Factor Receptor 2 Binding.
Significant pathways associated with log(tangles)
This table shows the pathways that exhibited statistical significance (p-values smaller than 0.1) in relation to log(tangles).
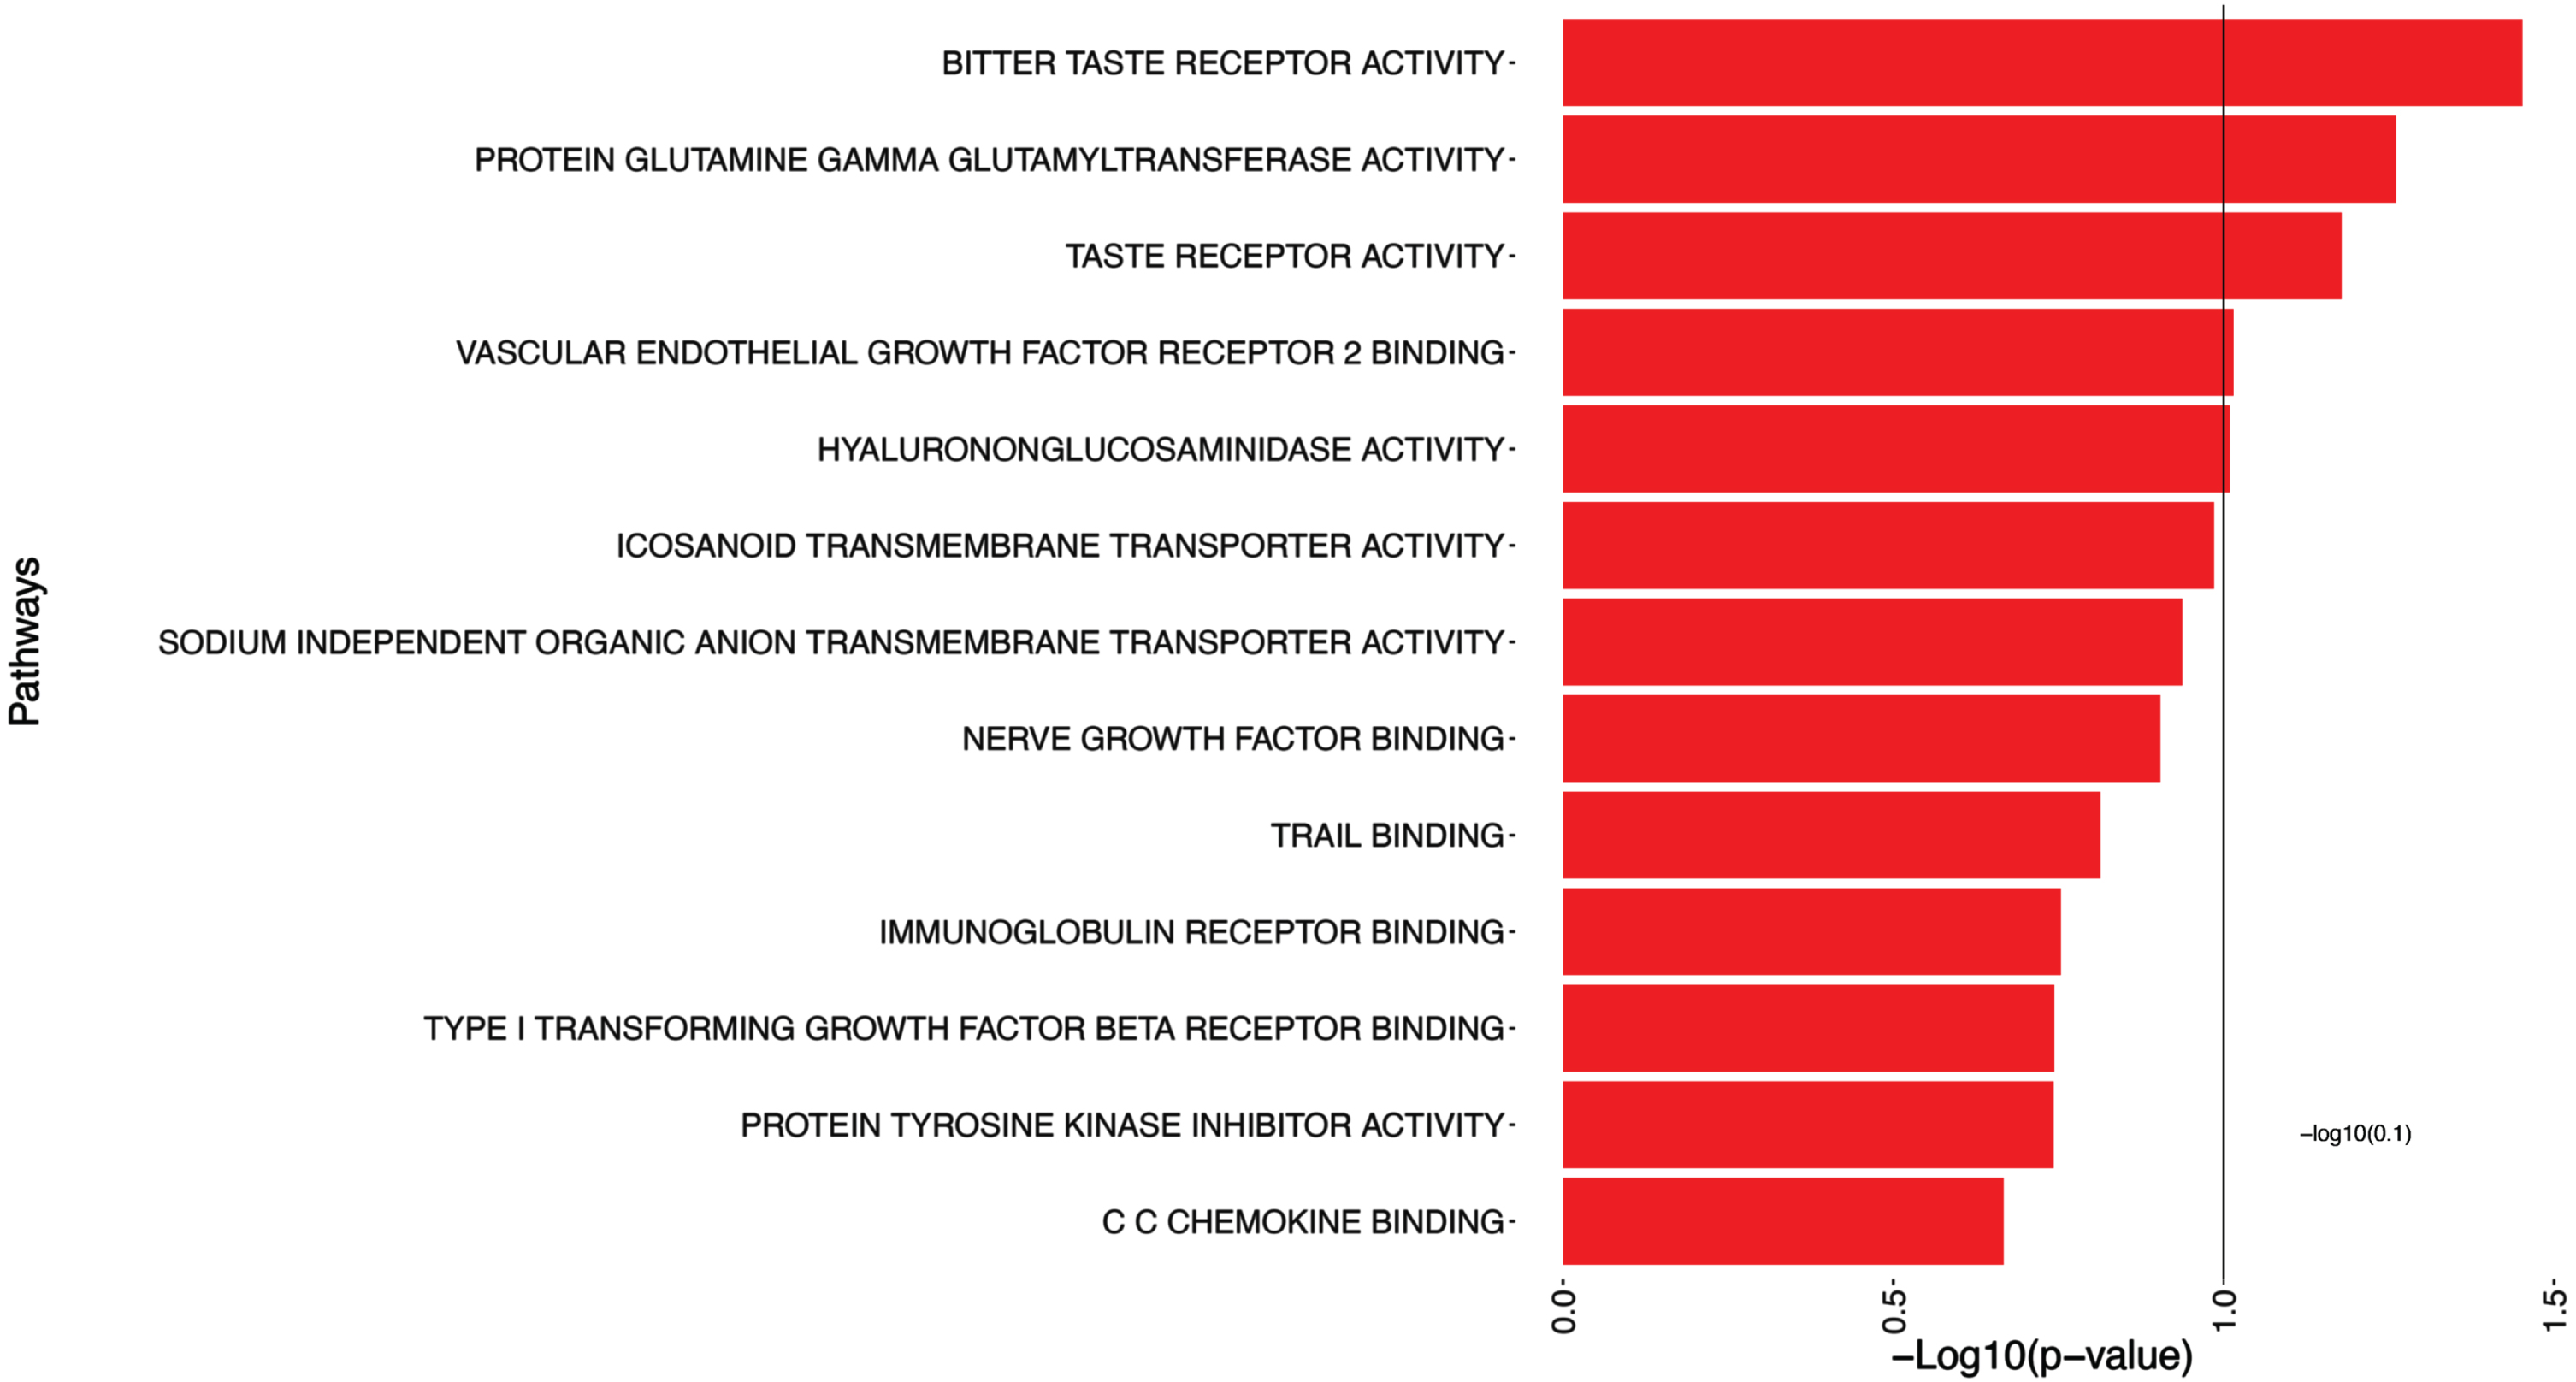
Pathway analysis of log(tangles). This figure presents the results of the pathway significance analysis for log(tangles). Each pathway is displayed on the y-axis, while bars parallel to the x-axis represent the corresponding -log10(p-value). The length of each bar reflects the statistical significance of the pathway association with log(tangles). Longer bars indicate greater significance/smaller p-values.
In addition to the pathways depicted in Fig. 4, Table 5 includes a subset, i.e. the top candidates of pathways with significant associations with the MMSE outcome (with p-values smaller than 0.1). Figure 4 provides a partial representation of 174 top pathways, including Trail Binding, Vascular Endothelial Growth Factor Receptor Binding, Vascular Endothelial Growth Factor Receptor 2 Binding.
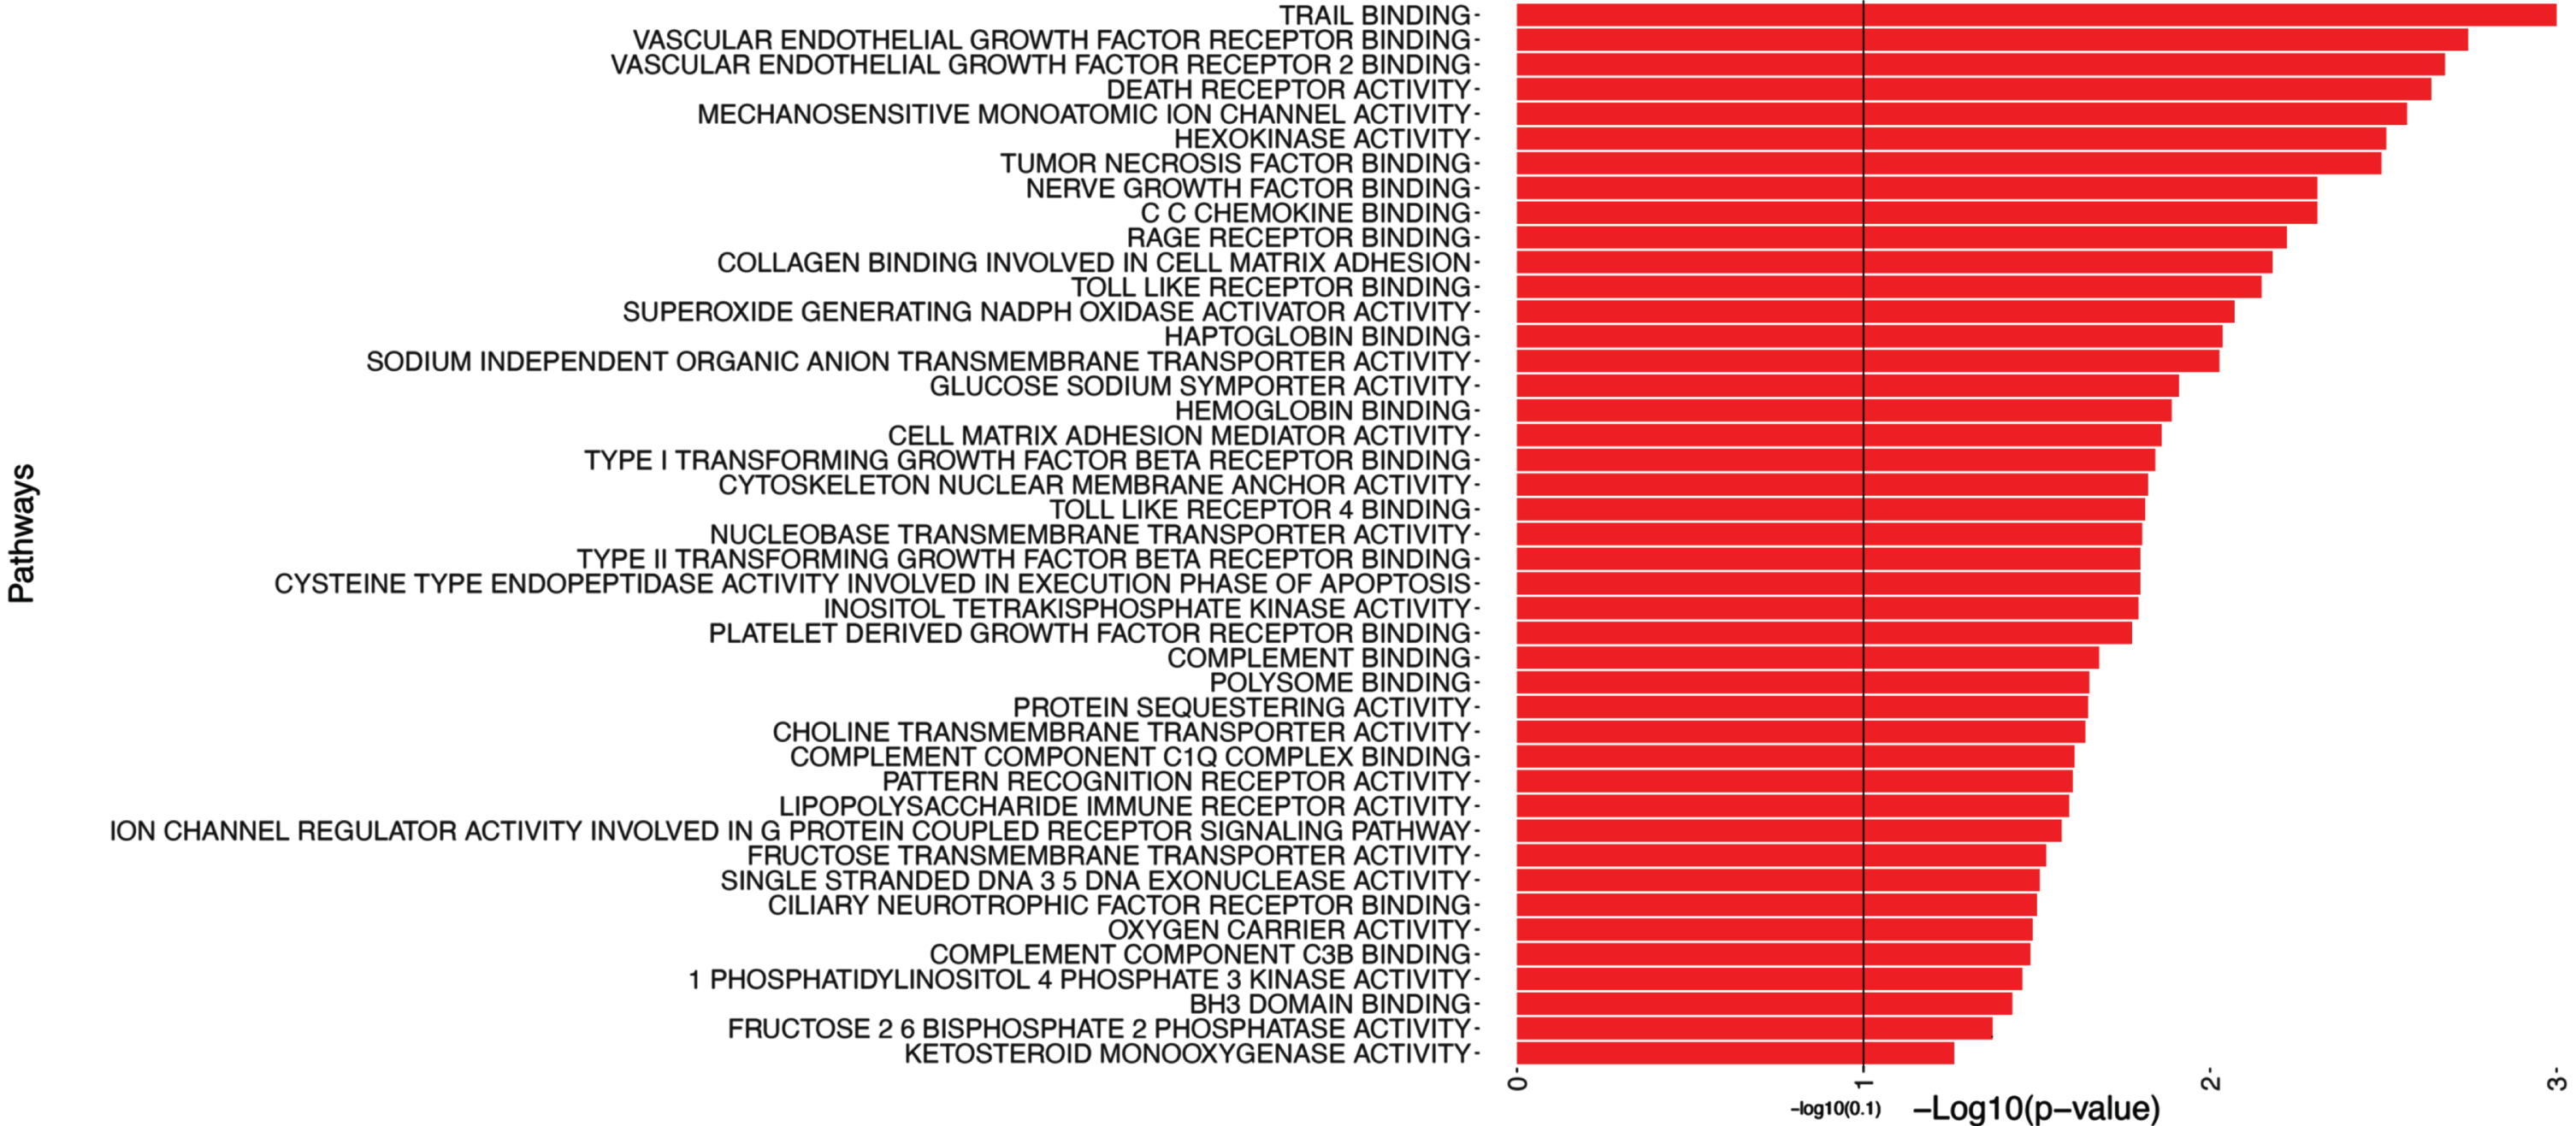
Pathway analysis of MMSE. This figure shows a portion of the pathway significance analysis results for MMSE. Each pathway is plotted on the y-axis, accompanied by bars parallel to the x-axis that represent the corresponding -log10(p-value). The length of each bar reflects the statistical significance of the pathway, with longer bars indicating higher significance. This visual representation enables a quick evaluation of the significance levels associated with each pathway. It assists in identifying key pathways that are linked to MMSE, contributing to a better understanding of the underlying mechanisms influencing MMSE.
Significant gene pathways associated with MMSE outcome
It highlights the top candidate pathways, including Trail Binding, and Vascular Endothelial Growth Factor Receptor 2 Binding, among others.
We then investigated the shared pathways among all 3 studies involving Aβ, log(tangles), and MMSE, shown in Fig. 5. This analysis allows us to gain insights into the shared biological mechanisms and molecular processes that may contribute to the interplay between Aβ, log(tangles), and MMSE.
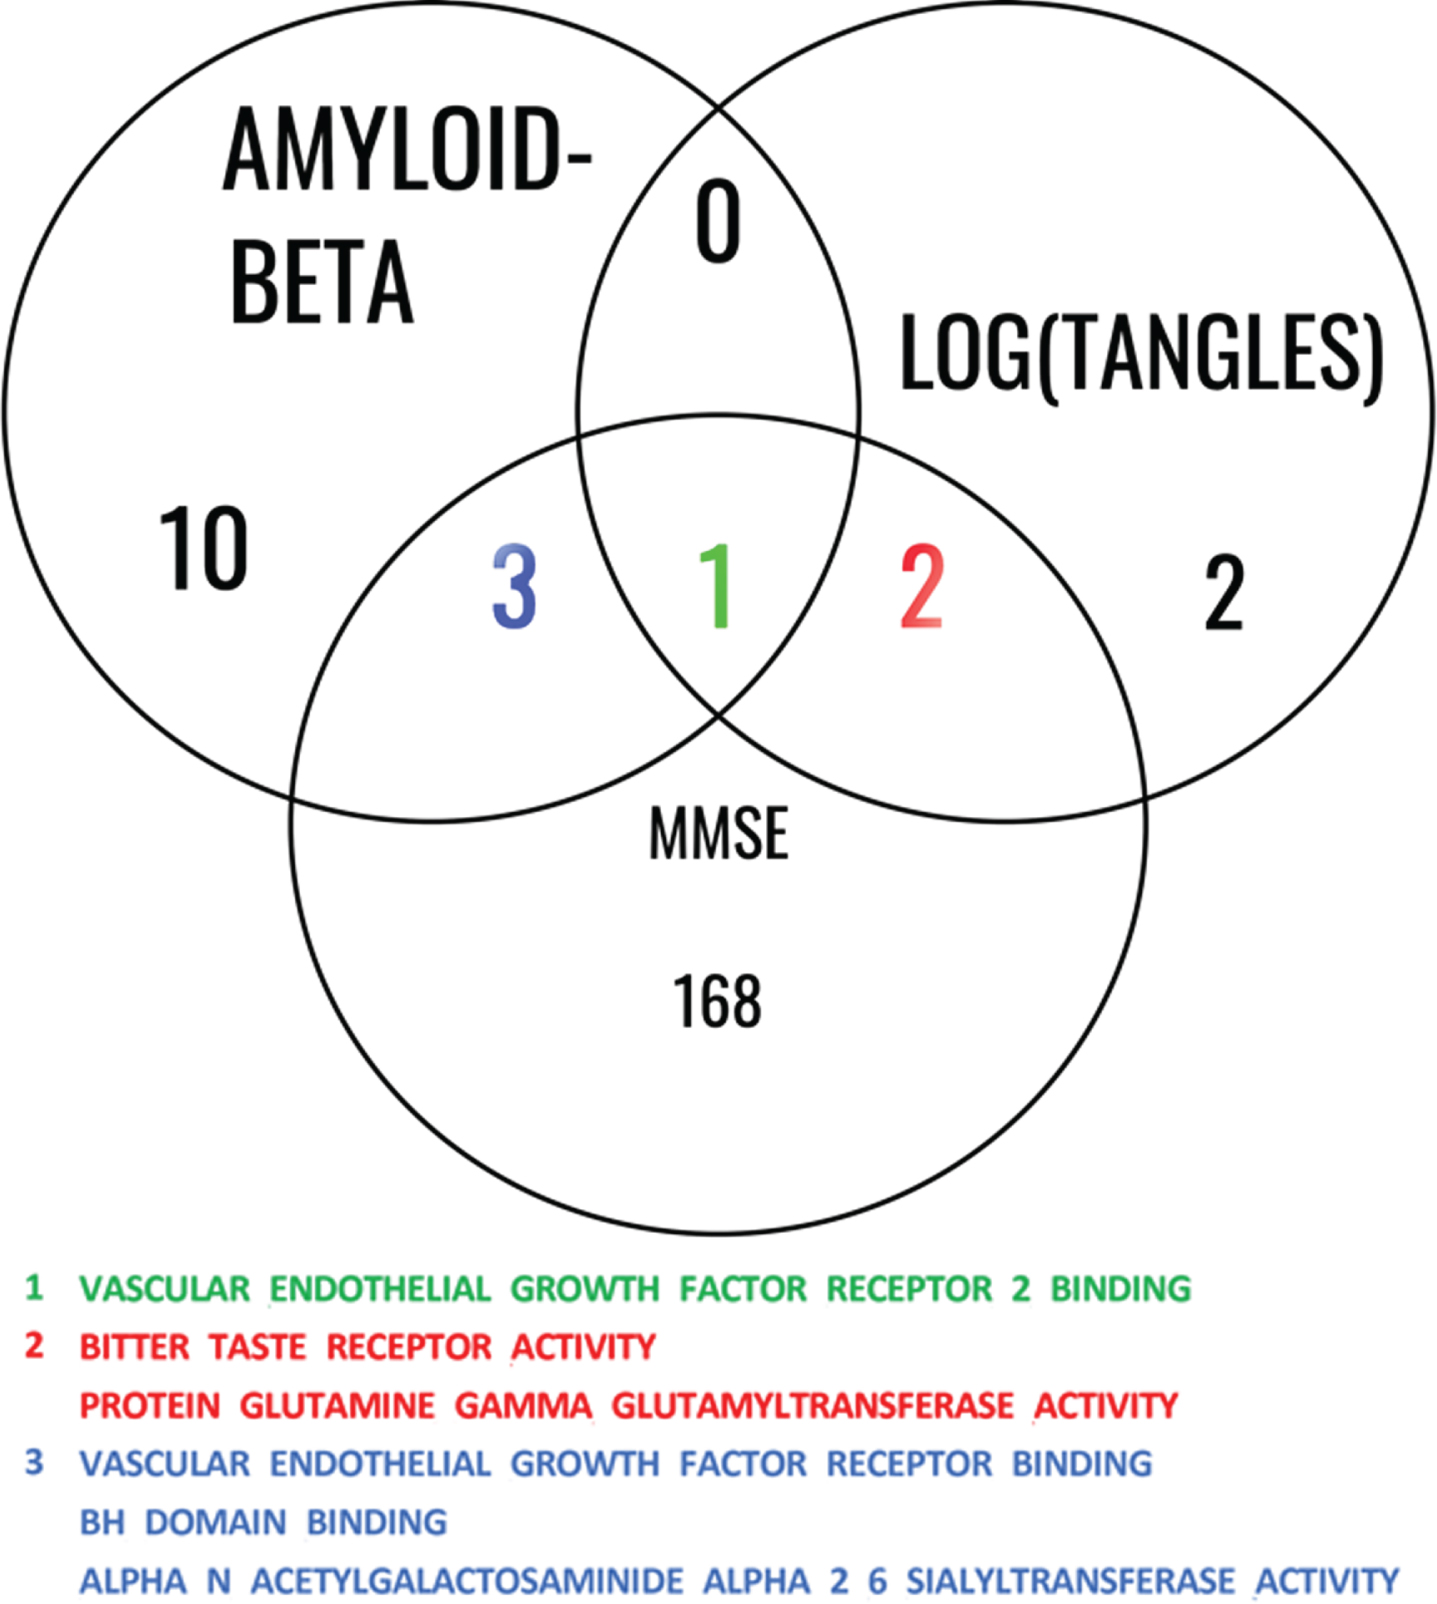
Common significant pathways for Aβ, log(tangles), and MMSE. This Venn diagram illustrates the common pathways identified among the studies involving Aβ, log(tangles), and MMSE. The diagram consists of overlapping circles that represent each study, with labeled sections indicating the shared pathways among them. The shared pathways are listed within the diagram, providing a concise overview of the biological processes and molecular mechanisms that are consistently implicated across these phenotypes. This analysis highlights the interconnectedness of these factors and underlying gene ontology molecular function (GOMF) pathways that contribute to the associations between Aβ, log(tangles), and MMSE.
Finally, we extracted the 9 genes (CDH5, DAB2IP, CADM4, GREM1, ITGA5, ITGB3, CCDC88A, VEGFA, PDCL3) in the VEGF Receptor 2 Binding which was the only common significant pathway among the results from the three models (for Aβ, log(tangles), and MMSE). A partial correlation analysis revealed no strong correlation among the normalized gene expression of the genes within the VEGF RB 2 group. The strongest partial correlation observed was 0.6, which occurred between ITGA5 and CADM expression. The partial correlations between the remaining pairs of genes were all below 0.2. Subsequently, we examined whether any of these genes could act as mediators in the relationship between AD pathology (measured by amyloid and tau) and cognitive function (assessed using MMSE). We use FDR correction to adjust the p-values for multiple comparisons. When predicting MMSE using tau as predictor, ITGA5 was the only significant mediator with adjusted Average Causal Mediated Effect (ACME) p-value of 2e-16 and estimation of 0.043. The Nonparametric Bootstrap Confidence Interval with the Percentile Method for this effect were (0.018, 0.08). The Average Direct Effect (ADE) which measures the unmediated effect had an adjusted p-value of almost 1, with estimated value of 0; while the total effect had the same adjusted p-value of ACME. ITGA5 was also the only mediator with significant adjusted p-value of ACME of 2e-16 when predicting MMSE using the amyloid score, while the estimation was 0.0422 and the confidence interval was (0.016, 0.08). In this case, the adjusted p-value of ADE was almost 1 with an estimation of 0, and the total effect had the same estimation and p-value as those of the ACME.
Following up on the finding of the VEGF-RB pathway significance for all three phenotypes, we verified whether this was supported by the results of differential expression analysis for the VEGF-family genes (Table 6). Higher expression in AD samples relative to normal cognition was observed for VEGFA, VEGFB, VEGFD, PGF, and FLT1 while lower expression in AD samples relative to controls is observed for FLT4, KDR, NRP1, and NRP2. The only significant difference between the two groups after adjusting for multiple comparisons was for VEGFB, thus supporting the results of our initial analyses.
Differential expression of VEGF family related genes in Alzheimer’s disease (AD) samples compared to controls
This table presents the results of a comparative analysis between control and AD samples, focusing on the expression differences of VEGF-family–related genes.
DISCUSSION
The progression of AD manifests through changes in biomarkers that reflect abnormal protein expression, such as Aβ, phosphorylated tau, as well as clinically measurable symptoms including memory decline. In our study, we developed new methods to reveal pathways related to changes in brain RNA-Seq for each of these two neuropathological biomarkers, as well as for MMSE. We observed a larger number of significant pathways for gene expression association with MMSE (174 pathways) than those associated with the two hallmark biomarkers for AD, Aβ (14 pathways), and tau tangles (5 pathways). This underscores the complexity of behaviors, which can change in response to a number of genetic and environmental factors, including the presence of misfolded proteins in AD, such as Aβ and tau. Surprisingly, we did not identify the most genes associated with Aβ, or tau but with cognition (MMSE). More importantly, we identified a single pathway, vascular endothelial grown factor receptor binding (VEGF-RB) that was associated with differences reflective of all three phenotypes analyzed by the continuous gene set likelihood ratio test (gsLRT).
The methodological advance of this study was the extension of gsLRT from binary (e.g. disease/control status) to continuous value phenotypes. Our study extends prior work by analyzing three continuous scale phenotypes (Aβ, tau tangles, MMSE) in a pathway analysis that accounts for the covariates such as age, sex, and APOE genotype (gsLRT for continuous phenotypes). The results indicate the enhanced explanatory capacity of the interaction term between the gene measurement profile and APOE genotypes.
Among the pathways identified as significant for Aβ, we noted several candidate pathways that support changes in DNA repair ability (DNA Translocase Activity) [25], cell mediated immunity (C3hc4 Type Ring Finger Domain Binding) [26], apoptosis (BH Domain Binding) [27], protein synthesis (Small Ribosomal Subunit RRNA Binding) [28] and disaggregation (ATP Dependent Protein Disaggregase Activity), as well as insulin signaling (Insulin Receptor Binding) [29, 30], which have all been connected to AD.
Among the pathways identified as significant for tau tangles we noted two that support alterations in sensory processing, pointing to taste (Bitter Taste Receptor Activity; Taste Receptor Activity). Recent studies have shown alterations in the sour taste [31], while here we have identified changes in pathways associated with bitter taste, and taste in general. Since taste and olfaction are closely linked, these results suggest possible changes in olfactory function. Among sensory changes in AD, olfaction has been proposed as one of the more promising biomarkers for early detection [32]. We also noted pathways pointing to differences in the transfer of amino acids across the membrane, cell survival during oxidative stress (Protein Glutamine Gamma Glutamyltransferase Activity) [33], and glutathione homeostasis, relevant to several neurodegenerative diseases, such as AD, Parkinson’s disease, and amyotrophic lateral sclerosis [33, 34]. Finally, the role of extracellular matrix was suggested by the presence of the Hyalurononglucosaminidase Activity pathway, which has a less understood but complex role in aging and disease [35, 36].
Among the large number of pathways related to MMSE, we noted top candidates involved in apoptosis, through TRAIL which binds to death receptors, suggesting a relation with immune related mechanisms [37].
Aβ and tau biomarkers, in combination with measures of neurodegeneration have been associated with the progression of AD neuropathology and memory loss [38–43]. We note that neuropsychological measures such as MMSE can reflect other causes of cognitive impairment including damage to the cerebrovascular system, although individuals with moderate to severe AD tend to have MMSE scores less than 15 [44].
Our study identified only one pathway as significantly associated with all the three phenotypes we studied, Vascular Endothelial Growth Factor Receptor 2 Binding, pointing to the role of VEGF and related genes. The role of the VEGF signaling family in neurodegeneration and AD has been extensively studied including with multiomic approaches that analyzed bulk RNA-Seq data, single nucleus sequencing data, and mass spectrometry proteomics data [10]. VEGF includes a family of five ligands (VEGFA, VEGFB, VEGFC, VEGFD, and PGF), three tyrosine kinase receptors (FLT1, FLT4, and KDR), and two modulating receptors (NRP1 and NRP2). However, since numerous pathways intersect with VEGF receptor signaling, it has been difficult to identify the specific receptors and molecules that associate with disease endophenotypes or covariates including age and sex.
The presence of VEGF alongside Aβ plaques in AD brains and its strong binding to Aβ suggest that VEGF may contribute to neurodegeneration and vascular dysfunction [45]. Additionally, Aβ inhibits VEGF receptor signaling, impairing angiogenesis [46]. VEGF accumulation around amyloid plaques interacts directly with Aβ, rescuing synaptic dysfunction caused by the toxic Aβ oligomers [47].
VEGF also interacted with tau and Aβ42, predicting hippocampal atrophy and memory decline. Another study [48] revealed that VEGF genes, particularly FLT4 and FLT1, were associated with AD neuropathology and cognition. Higher levels of VEGF were associated with slower hippocampal atrophy and better cognitive function [49]. These findings emphasize the importance of understanding the relationship between VEGF, Aβ and tau pathology in AD, and present a possible target for potential therapeutic interventions.
Several studies have investigated the role of VEGF in cognitive impairment. For example, one study found that VEGF AA genotype is associated with an increased risk of developing AD and MCI, while higher VEGF levels are observed in AD patients [50]. Another study found lower VEGF levels in AD patients and amnestic MCI patients compared to controls, correlating with cognitive decline [51]. Additionally, [52] finds that higher serum VEGF levels in ischemic stroke patients are associated with post-stroke cognitive impairment. Conversely, [53] shows that VEGF signaling is crucial for maintaining cognition and neurogenesis, cautioning against inhibiting VEGF signaling. Interestingly, [54] demonstrates that VEGF levels increase during the early stage of AD but decrease as the disease progresses, suggesting a link between VEGF levels and cognitive decline. VEGF produced by macrophages plays a role in preserving cognitive function in obesity, which can be a risk factor during aging and AD [55]. However, the literature is still controversial and more work is needed to understand the role of various VEGF isoforms role in modulating cognition [56].
Intriguingly, the ensemble of molecules in the VEGF pathways and their interactions have been reported to have varied effects on AD phenotypes. The members of the VEGF measured in the brain and blood have been characterized with respect to cognitive performance, neural and cerebrovascular pathology, and cerebrospinal fluid biomarkers [11, 48]. Blood and brain VEGFA has been reported to be protective against memory impairment and brain atrophy in AD [10]. We included differential gene analysis of the VEGF family members in order to assess specific gene expression differences between samples from AD and cognitively normal samples in the context of the finding of the VEGF-receptor finding pathway showing significance for all three phenotypes. Higher expression levels of VEGFB, PGF, FLT1, and FLT4 were reported to be associated with faster cognitive decline and greater neuropathological lesion development [10] and our data supported this direction of difference in expression levels. The VEGF family is involved in multiple signaling pathways, leading to potentially different effects on AD-related phenotypes; for example, VEGFA can signal through KDR or FLT1 where the receptors can elicit effects in opposing directions [10]. In a study of microglial control of astrocytes in response to microbial metabolites, microglial VEGFB was shown to trigger FLT1 signaling in astrocytes and promote CNS inflammation [57]. Neutropilin expression (NRP1 and NRP2) was decreased AD samples relative to samples from individuals with normal cognition in agreement with prior evidence [10]. NRP1 and NRP2 have well-established roles in angiogenesis [10, 58]. Moreover, interactions between VEGF family proteins with APOE have also been reported. Higher levels of VEGFA were reported to be associated with worse outcomes among APOE ɛ4 carriers and better outcomes among non- ɛ4 carriers [10]. Interestingly VEGFB levels have been positively associated with atherosclerosis and arteriolosclerosis [48], pointing to the need to better understand the VEGFB interactions with APOE.
Seto and colleagues [10] have associated higher VEGFB mRNA expression in the dorsolateral prefrontal cortex with lower cognition and with faster cognitive decline; and snRNA analyses demonstrated these effects to were driven by microglia, oligodendrocytes and their precursor cells, and endothelial cells. Moreover, VEGFB protein levels were robustly related to higher amyloid and tau at autopsy. Thus, although VEGFB is important for neurons survival [59], the associations of high VEGFB expression with AD pathology and cognitive decline suggests that off-target effects, possibly through microglia, oligodendrocytes or endothelia must be considered when evaluating VEGFB as a treatment target.
Our mediation analysis identified among the genes in the VEGFB pathway that ITGA5 acts as a causal mediator between AD pathology and cognition. This is supported by other studies [60] that have identified ITGA5 as one of the top 10 hub genes significantly associated with AD, with potential diagnostic and therapeutic implications. Li et al. [61] investigates ITGA5’s role in gliomas and its impact on the blood-brain barrier. High ITGA5 expression was associated with worse outcomes in glioma patients and influences immune cell infiltration, potentially affecting the blood-brain barrier’s integrity. Integrin α-5 (ITGA5), when paired with Integrin-β1, forms a receptor for fibronectin, constituting a crucial link between the cell and its surroundings [62]. Fibronectin, through its interaction with integrin receptors on the cell surface, controls cell behavior by facilitating communication between the intra and extracellular environments [63]. Wang et al. [64] examined the impact of ITGA5 in cardiac microvascular endothelial cells during atherosclerosis. Interestingly, overexpression of ITGA5, in synergy with Talin-1, reduces cerebral microvascular endothelial cells dysfunction, offering potential benefits for coronary artery disease treatment.
Our study has several strengths. First, the extension of the gsLRT to continuous phenotypes allowed a higher statistical level (continuous versus nominal) of data for the pathway analysis. The relatively large sample size where data was available for all three phenotypes allowed for comparisons at the gene and pathway level.
A limitation of the analysis is that the phenotypes are measured at a single time point. Longitudinal data for the Aβ and tau biomarkers are not available from postmortem brains, though nuclear imaging or fluid biomarkers present a great promise for the future of such longitudinal studies. MMSE is measured over time, so another possible phenotype to consider would be the decline in MMSE from baseline to death. Studies that examine changes in cerebrospinal fluid and blood biomarkers for VEGF over time will provide information on temporal relationships between VEGF family mRNA and protein concentrations and biomarker changes and can open new avenues for exploiting its therapeutic potential [10].
Conclusion
We introduced a novel statistical framework to reveal the relationships between continuous phenotypes and gene expression across pathways, while considering covariates such as sex, age, and education. Our findings provide support for the involvement of VEGF RB2 in modulating cognition in AD. Additionally, our mediation analysis highlights the significant role of one of the VEGF R2 family genes, namely ITGA5 in mediating the relationship between AD pathology and cognition.
Our study proposes a method for pathway identification using continuous phenotypes and public data bases on RNA-Seq, but can potentially be used for proteomic analyses, or extended to multinetwork omic studies and make use of extensive public data base resources or de novo analyses to better understand the mechanistic substrates for neurodegenerative diseases.
Footnotes
ACKNOWLEDGMENTS
We thank all the participants of ROS and MAP studies. Furthermore, we are grateful to Dr. Jordan Bryan for helpful discussions.
FUNDING
RF1 AG057895, R01 AG066184, U24 CA220245, RF1 AG070149. These studies were funded by the National Institute on Aging: P30AG010161 ADCC, P30AG072975 ADRC, R01AG015819 RISK, R01AG017917 MAP, U01AG46152 AMP-AD Pipeline I, U01AG61356 AMP-AD Pipeline II.
CONFLICT OF INTEREST
The authors have no conflict of interest to report.
DATA AVAILABILITY
ROSMAP resources can be requested at https://www.radc.rush.edu. The Code is available at ![]() .
.