
Abstract
Background:
Obesity is a modifiable risk factor for Alzheimer’s disease (AD). However, its relation with tau pathology (i.e., aberrant tau protein behavior in tauopathies such as AD) has been inconclusive.
Objective:
This study investigated the interaction between a high-fat diet (HFD) and tau pathology in adult male mice.
Methods:
Transgenic mice overexpressing human P301S Tau (those with the pathology) and wild-type (WT) littermates were subjected to behavioral tests, functional magnetic resonance imaging (fMRI), diffusion tensor imaging (DTI), and western blotting analysis to investigate the effects of prolonged HFD versus regular diet during adulthood.
Results:
HFD increased body weight in both WT and P301S mice but had minimal effect on blood glucose levels. The brain response to HFD was tau genotype-specific. WT mice exhibited decreased recognition memory and enhanced network connectivity in fMRI, while P301S mice exhibited white matter tract disorganization in DTI as the sole significant finding. The reduction of insulin receptor β, insulin downstream signaling, neuronal nuclear protein, CD68-positive phagocytic activity, and myelin basic protein level were confined to the cortex of WT mice. In contrast to P301S mice, WT mice showed significant changes in the tau protein and its phosphorylation levels along with increased soluble neurofilament light levels in the hippocampus.
Conclusions:
HFD-induced brain dysfunction and pathological changes were blunted in mice with the pathology and more profound in healthy mice. Our findings highlight the need to consider this interaction between obesity and tau pathology when tailoring treatment strategies for AD and other tauopathies.
Keywords
INTRODUCTION
Alzheimer’s disease (AD) is the most common age-related neurodegenerative disorder, and its development and clinical course are determined by genetic and environmental interactions [1]. Epidemiological studies have established obesity as a modifiable risk factor for AD and related dementia [2–4]. When considering obesity in midlife, defined as a body mass index (BMI)≥30, the estimated relative risk of developing AD is approximately 1.6 [2], contributing to up to 20% of all dementia cases [4]. Notably, this causal relationship is age-specific; obesity does not appear to elevate the risk of AD in late life, being underweight is associated with an increased risk of AD [2]. A number of mechanisms, such as increased neuroinflammation, more oxidative stress, blood–brain barrier disruption, synaptic damage, and neuronal death, have been suggested to contribute to obesity-related cognitive decline [5–7]. However, there is controversy regarding its interaction with the core pathologies of AD, such as aberrant tau and amyloid-β (Aβ) protein behavior. Studies that have included cognitively normal individuals have shown that higher levels of obesity are correlated with lower cortical thickness in specific brain regions [8]. However, in the context of AD, this effect may not be mediated by modification of AD-related pathologies [8]. Cross-sectional correlation analyses have demonstrated that higher BMI is associated with lower cortical Aβ uptake in PET imaging in clinically unimpaired older subjects [9, 10] and with nonpathological cerebrospinal fluid (CSF) findings, such as higher CSF Aβ42 and lower tau protein levels, in individuals with mild cognitive impairment (MCI) or AD [11, 12]. However, the proportion of patients with obesity in these studies was small, at around 10%, making it difficult to clearly determine the impact of obesity on AD pathology. In addition, as most subjects recruited into these studies were in later life, when obesity is no longer associated with an increased risk of AD [2], it was not possible to discern the adverse effects of obesity on promotion of AD development in middle age.
Investigations have been conducted in animal models of AD to examine the association between obesity and AD pathology [13–15]. However, these have yielded inconsistent results, potentially stemming from the differences in the timing of initiation, duration, and composition of obesogenic diets among different studies. Furthermore, differences in transgene mutations, promoters, and background strains, which significantly influence tau pathology characteristics [16], as well as susceptibility to the diet, have been observed both within individual studies and across different studies [15]. Hence, further well-defined studies are required using strain-matched controlled mice and careful monitoring of associated changes. In this study, we used wild-type (WT) littermates as controls. The animals were exposed to a high-fat diet (HFD) for a specific duration, focusing on the sensitive period of mid-adulthood to examine the impact of obesity. To validate the premortem status of brain functions and microstructure, we conducted magnetic resonance imaging (MRI) in addition to behavioral analyses. Postmortem pathological examinations focused on tau pathology, which is highly correlated with clinical phenotypes in AD [17] and commonly observed in many brain disorders associated with clinical dementia [18]. Our aim was to precisely investigate the impact of HFD-induced obesity on brain function and structure in relation to the tau genotype using a mouse model.
MATERIALS AND METHODS
Animals
The PS19 mice with human tau P301S mutation on the B6C3F1 background (#008169, The Jackson Laboratory, USA) and their littermate WT were used for the experiment. The selection of PS19 mice as tauopathy model aligns with the study’s objectives because these mice are well-characterized and exhibit AD-like neurofibrillary tangle at midlife, approximately 6 months of age [16, 19]. Further, these mice demonstrate age-dependent non-cognitive and cognitive symptoms, along with neurodegeneration and microgliosis [19, 20]. Two female and one male heterozygous PS19 mice were purchased from Jackson Laboratory and were bred in-house. The animal experiment followed the protocol that had been approved by the Ajou University Institutional Animal Care and Use Committee (IACUC, 2019-0045). The procedures complied with ARRIVE guidelines and were carried out in accordance with the National Research Council’s Guide for the Care and Use of Laboratory Animals. We used heterozygous male mice in this study to avoid early motor paralysis and to mitigate potential sex-dependent variations in susceptibility to the diet intervention. We assumed that the higher metabolic response observed in male mice [21–23] would be associated with more pronounced brain responses [24]. PS19 (n = 18) and WT mice (n = 19) were fed using standard laboratory chow (4% calories from fat and 18% from protein; Rodent NIH-3, Zeigler, USA) or HFD chow (60% calories from fat, 20% from protein and 20% from carbohydrates; D12492, Research diets, USA), from 12 to 36 weeks of age. We chose the diet containing 60% fat as HFD since majority of literatures that adopted HFD used this formula [13, 25–27], and it corresponds to a tolerable high-fat human diet [28]. And we defined the mid-age of P301S mice as 3–9 months of age, given that only 20% of these mice survive beyond 12 months, primarily due to tau accumulations in the spinal cord leading to paralysis [19]. Although WT mice have a significantly longer life expectancy, with their midlife typically occurring around 10 months, we chose the same age range for WT mice to align with PS19 mice [29]. The mice were housed on a 12 h-light-dark cycle and had access to food and water ad libitum. During the controlled diet phase, body weight was measured every 2 weeks, and fasting blood glucose levels (>6 h) were checked every 4 weeks with a glucose analyzer (Gluco Dr.TOP, AGM-4100, allmedicus, Korea). At the 36 weeks of age, behavioral tests and functional neuroimaging were performed. Subsequently, mice were deeply anesthetized with carbon dioxide after overnight fasting and transcardially perfused with cold phosphate-buffered saline (PBS) to get brain tissues.
Behavior test
Y-maze and novel object recognition test were used to evaluate the spatial working memory [30] and object recognition memory [31], respectively. Both tests are based on the willingness of the mice to explore new environments. In the Y-maze test, a mouse was placed in a Y-shaped maze with three arms and allowed to freely explore the arms for 8 min. The movements were recorded using a data acquisition system (SMART video tracking software). An arm alternation was counted when a mouse entered a different arm with more than half of its body during three consecutive arm entries (triads). The percentage of alteration was obtained by dividing the number of alterations by the number of possible total triads (number of total arm entries – 2) [30, 32].
The novel object recognition test was conducted in three steps: familiarization – intersession interval – test session. For familiarization, a mouse was placed in the open field with two same objects and permitted to explore freely for 30 min. The animal was subsequently transferred to the home cage and stayed for 60 min. The test field was cleaned thoroughly using 70% ethanol, and one of the familiar objects was replaced by the novel one for a second trial. After an intersession interval, the mouse was replaced in the middle of arena with both familiar and novel objects, and allowed a free exploration for 10 min. The test session was monitored and recorded with a data acquisition system (SMART video tracking software, PanLab Harvard Apparatus, USA) to track the behavior. Data was analyzed in two parameters, novelty preference and discrimination index as described previously [31, 32]. In accordance with the established exclusion criteria [30, 32], we omitted five PS19 mice that exhibited continuous jumping behavior during the Y-maze test. Additionally, one more PS19 mouse and five WT mice who displayed significant biases in exploratory behavior during the novel object recognition test were excluded for the analysis.
MRI
The Bruker Biospec 9.4T/30-cm horizontal bore animal MRI system (Billerica, MA, USA) was used to acquire resting-state functional MRI (rs-fMRI) and diffusion-tensor images (DTI) in thirteen mice (seven P301S (PS) and six WT) following behavior test. The ear and bite bars were applied to minimize the animal motion. Isoflurane (1%) was used for anesthesia, and electrocardiogram, motion-sensitive respiration signals and arterial oxygen saturation was monitored using a monitoring system (Model 1030, Small Animal Instruments Inc, Stony Brook, USA for fMRI and PhysioSuite, Kent Scientific Corp, USA for OIS studies). The body temperature was maintained around 37°C. T2-weighted was obtained as an anatomic image with the rapid acquisition with refocused echoes (RARE) sequence with parameters as follows: repetition time (TR)/echo time (TE) = 4000/26 milliseconds (ms), RARE factor = 8, number of excitations (NEX) = 5, field of view (FOV) = 20 (readout)×20 (phase encoding) mm2, matrix = 256×256, in-plane resolution = 78×78μm2, slice thickness = 250μm, and contiguous 30 slices without gap in the coronal plane. One 5-min-long rs-fMRI data was acquired using a single-shot gradient echo (GE) echo planar imaging (EPI) sequence with following parameters: echo time spacing = 320 microseconds (μs), sampling frequency = 300 KHz, TR/TE = 1000/16 ms, flip angle = 60°, FOV = 18×12 mm2, matrix = 96×64, in-plane resolution = 188×188μm2, slice thickness = 500μm, contiguous 9 slices without gap in the coronal plane, and dummy scans = 10.
DTI was obtained with the diffusion-weighted spin-echo echo planar imaging sequence: TR/TE = 4500/37 ms, NEX = 3, FOV = 30×30 mm2, matrix = 192×192, in-plane resolution = 156 × 156μm2, slice thickness = 0.75 mm, number of slices = 18 coronal slices, gradient direction = 30, diffusion gradient duration (δ) = 5 ms, diffusion gradient separations (Δ) = 15 ms, and b-values = 1000 s/mm2. The MRI procedure including animal preparation took approximately 50 min for each mouse.
Analysis of the imaging data
All rs-fMRI data were analyzed using the Analysis of Functional Neuroimages package (AFNI) [33], FMRIB Software Library (FSL) [34], Advanced Normalization Tools (ANTs) [35] and custom-written Matlab codes (The Mathworks) [36]. First, the preprocessing pipeline in functional data included slice timing correction, de-spiking fMRI time course, image realignment for minor head motions during intra-scans, linear signal detrending for drift removal, voxel-wise time course normalization, and spatial smoothing with a Gaussian kernel of a 0.2 mm full width at half maximum (FWHM). Additional preprocessing steps were involved for data clearing with regressing out 12 motion confounds (6 parameters + temporal derivatives) and bandpass filtering (0.01 < f < 0.3 Hz). Second, functional data was co-registered to an anatomic image, and then spatially normalized onto the Allen moue brain atlas using deformation parameters obtained between anatomic image and mouse brain atlas. Third, five different regions of interest (ROIs) in each hemisphere were defined on Allen mouse brain atlas: primary motor cortex (MOp), secondary motor cortex (MOs), and three subdivisions of the retrosplenial region (agranular, RSPagl; dorsal, RSPd, and ventral, RSPv). The resting-state time courses were extracted from these ROIs. Fourth, the cross-correlation coefficients were calculated for pairs of time courses to estimate the functional connectivity.
The structure-based diffusion properties were analyzed using diffusion-weighted imaging data with MRtrix3 software package [37], ANTs, and Matlab codes. First, the preprocessing pipeline in DTI data included the image realignment of diffusion-weighted images to B0 image to correct for head motion and eddy-current induced distortions, and voxel-wise diffusion tensor was calculated to generate the DTI-derived images (fractional anisotropy, FA; mean diffusivity, MD; axial diffusivity, AxD; radial diffusivity, RD) using multivariate linear fitting and diagonalization. Second, DTI-derived images were spatially normalized onto the Allen moue brain atlas. Third, two different ROIs including cingulum and corpus callosum in each hemisphere were defined based on the Allen mouse atlas, and then the averages of their diffusion properties were extracted within those ROIs.
Tissue sampling and extractions
The saline-perfused brain was dissected into cortex and hippocampus, frozen, and stored at –80°C deep freezer for western blot. The part of frozen cortex and hippocampus were homogenized in tris-buffered saline (TBS) (Tris 10 mM, NaCl 0.1 M, EDTA 6.4 mM) with protease inhibitor (cOmplete™, Roche) and phosphatase inhibitor cocktail (PhosSTOP™, Roche) and then centrifuged at 100,000 g for 60 min. The supernatant was kept as TBS fraction (TBS-soluble), and the pellet was homogenized in RIPA buffer (TRIS 50 mM, NaCl 150 mM, EDTA 25 mM, Sodium deoxycholate 0.5%, Triton X-100 1%, SDS 0.5%) and centrifuged at 100,000 g for 60 min to get supernatant as RIPA-soluble fraction. The pellet was resuspended with 70% formic acid (3μl/mg), incubated for 60 min with vortexing, and centrifuged at 100,000 g for 30 min. The supernatant was obtained, and the buffer was replaced by PBS to be neutralized and used as formic acid fraction. The serially extracted brain samples were used for the immunoblots of tau and axon skeleton proteins. Simultaneously, we performed a single-step RIPA extraction on separate pieces of frozen cortical and hippocampal tissue. These RIPA extracts were then utilized for western blotting to assess insulin signaling molecules and brain cell markers.
Western blotting
Equal amounts of protein samples (10–20μg) were subjected to tris-glycine SDS polyacrylamide gel and then transferred to a 0.45 mm pore size polyvinylidene difluoride (PVDF) membrane. The blots were blocked with 5% bovine serum albumin in TBST (0.1% Tween-20 in TBS) and incubated with the primary antibody (Table 1) overnight. After washing with TBST these were probed with an appropriate HRP-conjugated secondary antibody and the immunoreactive bands were visualized by Western Bright ECL kit (K-12045-D50, Advansta, USA) and iBright™ CL1500 Imaging System (A44114, Invitrogen™, USA). Ponceau S staining was used as a loading control. The band density of target protein was quantified using ImageJ (NIH, Bethesda, USA), and the individuals were normalized to the matching total protein density on Ponceau S staining. The fold-change of these in reference to the mean of WT-ND mice was obtained and statistically compared among the experimental groups.
List of antibodies used for the experiment
Statistical analysis
The statistical analysis was performed using IBM SPSS v26 (Armonk, NY, USA). Data are represented as mean ± s.e.m with raw dot plots. The analysis in this study was mainly focused on the comparison among four different groups, WT normal diet (ND), WT-HFD, PS-ND, and PS-HFD using two-way ANOVA test to examine an effect of diet and tau genotype, and the interaction of diet×genotype. It was followed by the post hoc analysis when significant using independent t-test or Mann-Whitney U test depending on the normality of data distribution. The normality was estimated by Shapiro-Wilk test. The cross-correlation between the pairs of ROIs on rs-fMRI was calculated using Pearson’s correlation analysis to estimate the functional connectivity. The connectivity changes in reference to the type of diet within the same genotype group were computed by comparing the Pearson correlation coefficients of an individual network using Mann-Whitney U test. For water diffusion parameters on DTI the Mann-Whitney U test was also applied due to small sample size to identify the discrepancy between ND and. HFD. p < 0.05 was considered significant.
RESULTS
HFD-induced weight gain in both WT and P301S mice
The mice were fed either a ND or HFD for 24 weeks starting from the age of 12 weeks (Fig. 1A). Notable HFD-induced weight gain was observed from just after commencement of HFD feeding in mutant mice, which resulted in a higher body weight in HFD-fed mice than the matching ND-fed mice during the whole observation period including at the termination timepoint (26.1 ± 3.0 g in PS-ND and 35.6 ± 3.6 g in PS-HFD at 36-week-old, p < 0.001) (Fig. 1B). However, the weight gain stopped from 32 weeks of age in these mice regardless of diet type, which led to a significant discrepancy in body weight between PS-ND and WT-ND at 36 weeks (p = 0.001). In WT mice, the weight gain was also distinct and persistent. On the other hand, serial fasting blood glucose levels were consistent despite HFD intake except immediately after the start and at the termination of HFD feeding when the blood glucose levels were significantly higher in the PS-HFD mice compared to PS-ND mice (Fig. 1C). A transient genotype-dependent difference was noted at 16 and 24 weeks of age with a lower blood glucose level in PS-ND than WT-ND mice (p = 0.003), and in PS-HFD than WT-HFD mice (p = 0.012). Analysis of the area under the curve (AUC) of serial glucose levels spanning the whole period of controlled diet feeding did not find significant differences according to diet type (Fig. 1D), but a genotype effect was detected with lower glucose levels in PS-HFD than WT-HFD mice (p = 0.012).
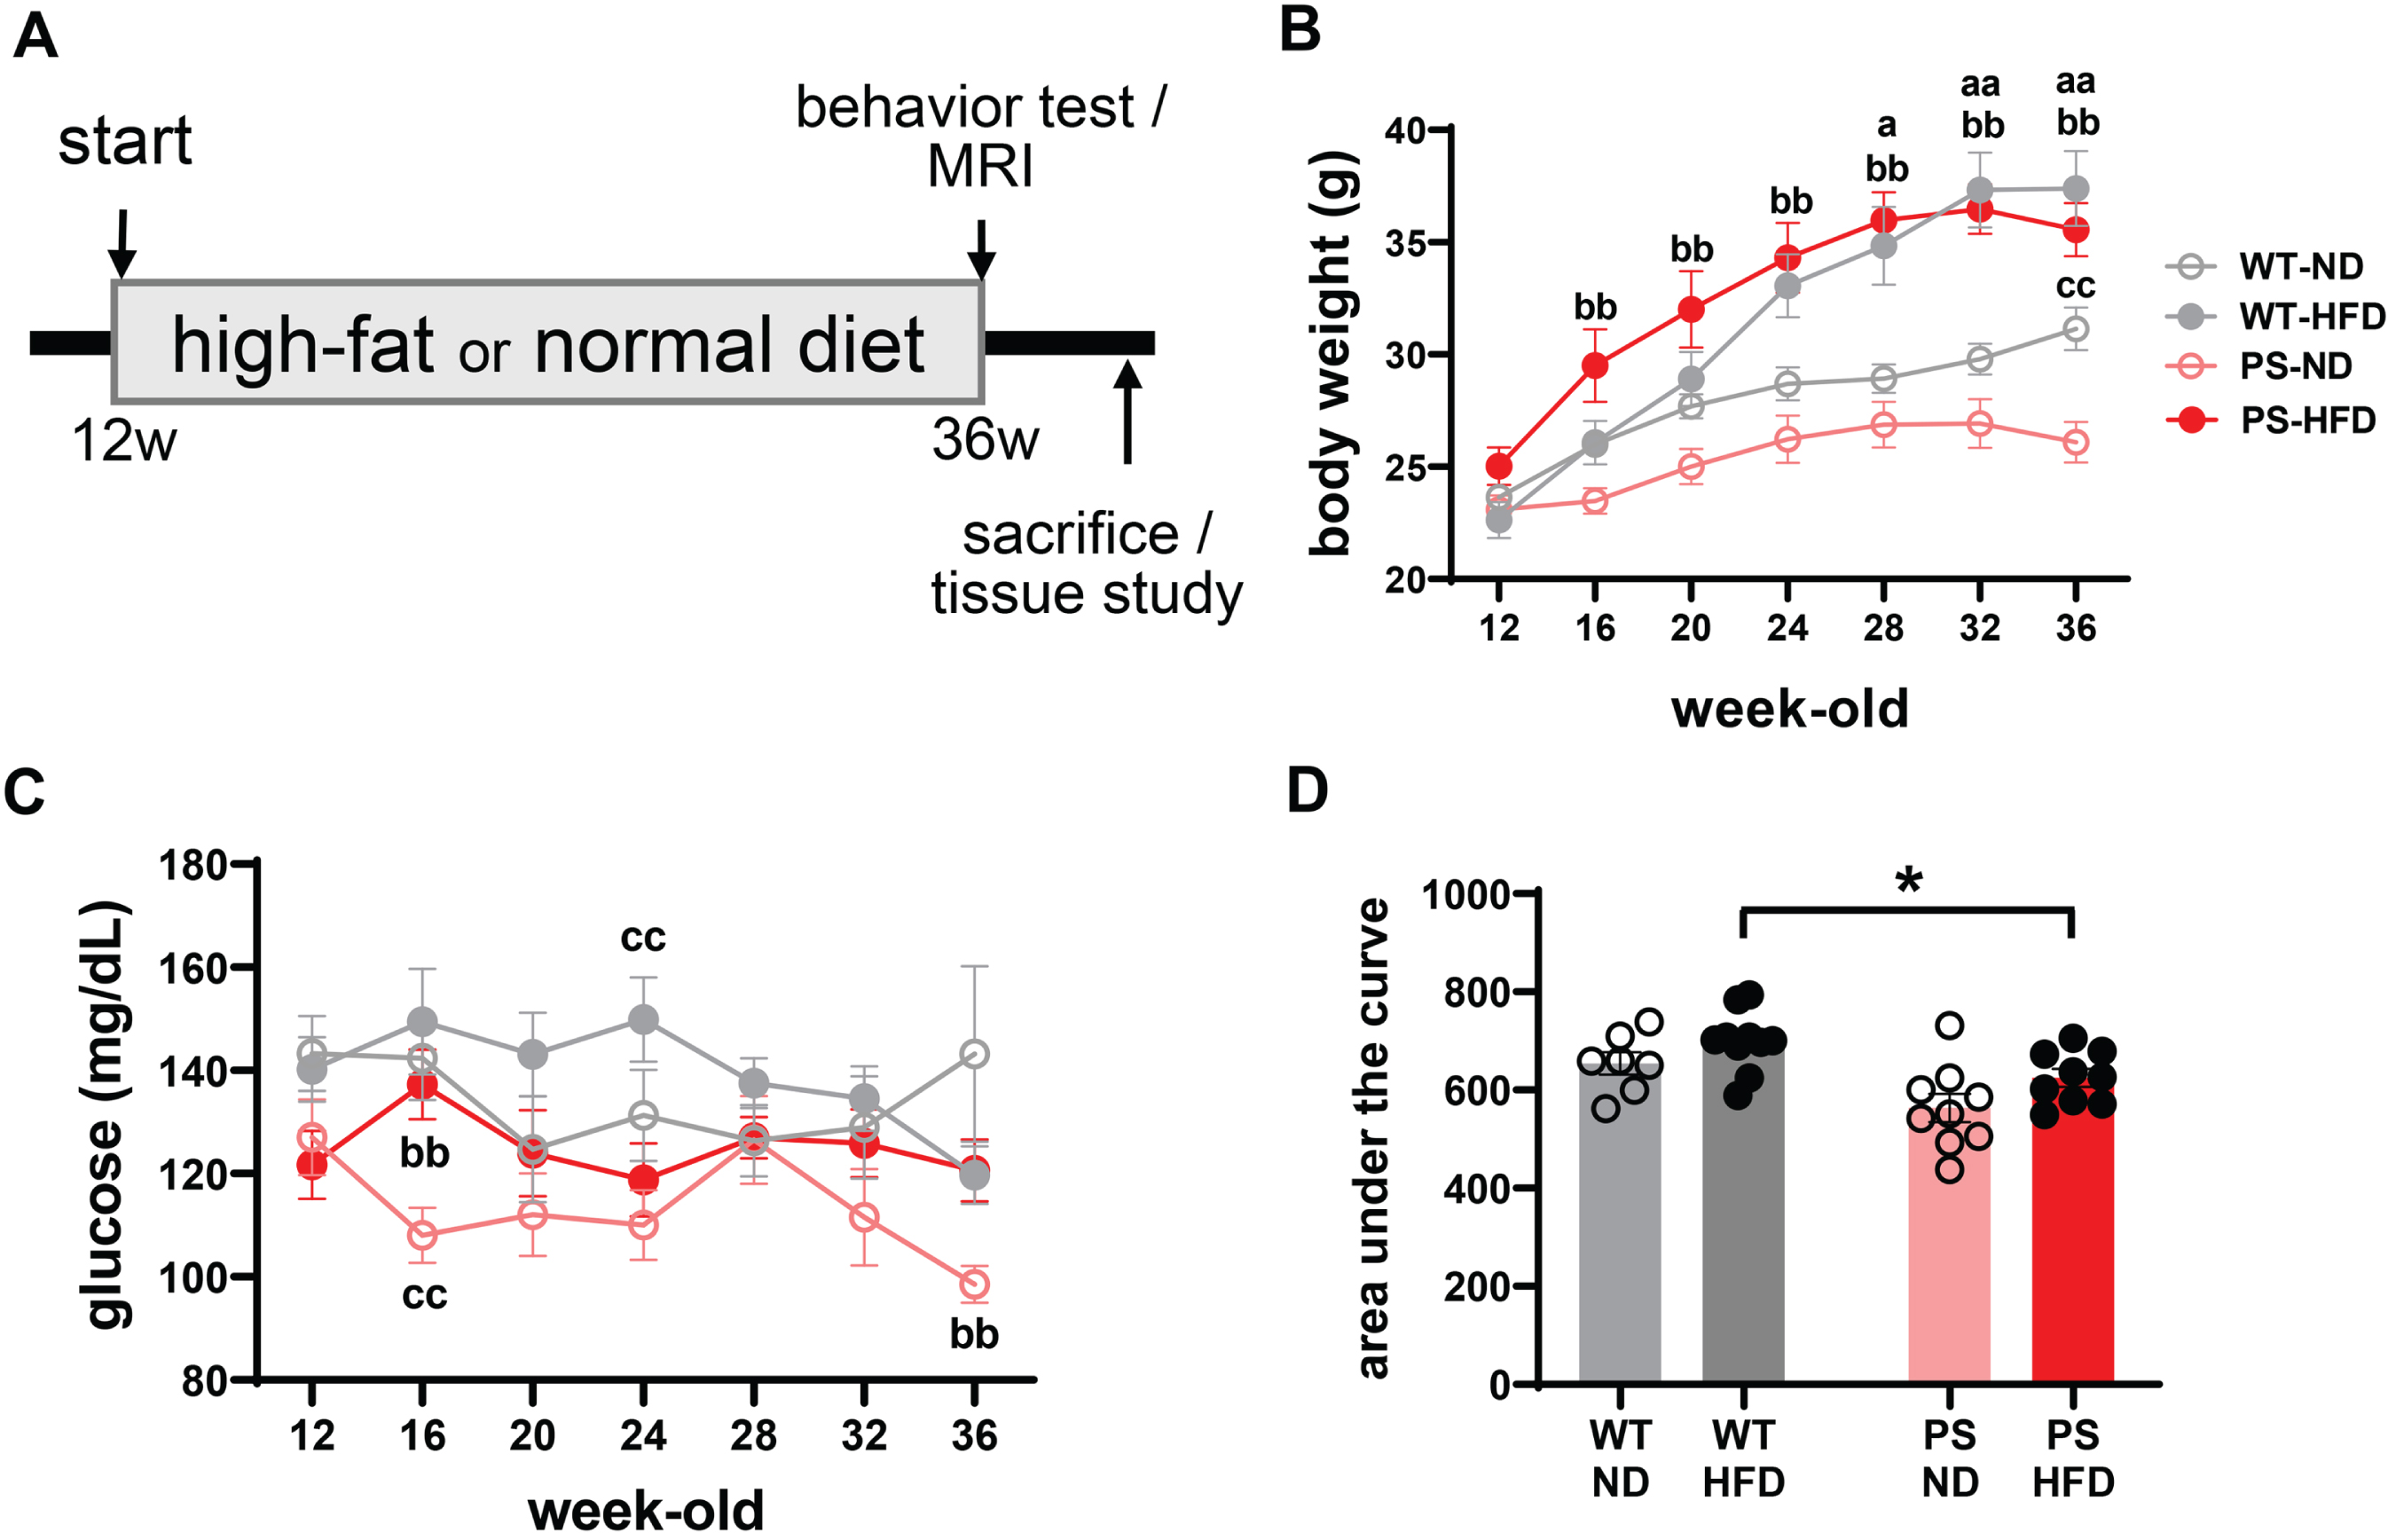
Marked weight gain but minimal changes in blood glucose level in response to a high-fat diet. A) The schematic to show the process of the experiment. B, C) The time- and diet-dependent body weights (B) and blood glucose concentrations (C) in wild-type (WT) and P301S (PS) mice (n = 7 in WT-normal diet (ND), n = 10 in WT-high-fat diet (HFD), and n = 9 respectively in PS-ND and PS-HFD). ap < 0.05 and aap < 0.01 in ND versus HFD in WT mice; bp < 0.05 and bbp < 0.01 in ND versus HFD in PS mice; cp < 0.05 and ccp < 0.01 in WT versus P301S mice on the two-way ANOVA analysis followed by post hoc t-test. D) The comparisons of the summated glucose levels spanning the whole period of controlled diet intake. *p < 0.05 on two-way ANOVA analysis followed by t-test. The error bars represent the standard error of the mean. HFD, high-fat diet; ND, normal diet; PS, P301S; w, weeks; WT, wild-type.
HFD decreases object recognition memory only in WT mice
Y-maze and novel object recognition tests were performed to determine the effects of HFD on behavior and cognitive function. The percentage alteration of arm entries in relation to total arm entries in the Y-maze test as a measure of spatial working memory was comparable among the experimental groups. The total number of arm entries was higher in PS-HFD than WT-HFD mice (p = 0.002, two-way ANOVA followed by t test) (Fig. 2A). These observations indicated comparable short-term spatial memory within the same genotype group regardless of HFD and hyperactive behavior of PS-HFD mice compared to the WT-HFD group. In the novel object recognition test, WT-HFD mice showed a decreased preference for novel objects compared to matched ND mice (p = 0.002) (Fig. 2B), indicating a reduction in recognition memory in WT mice in response to HFD.
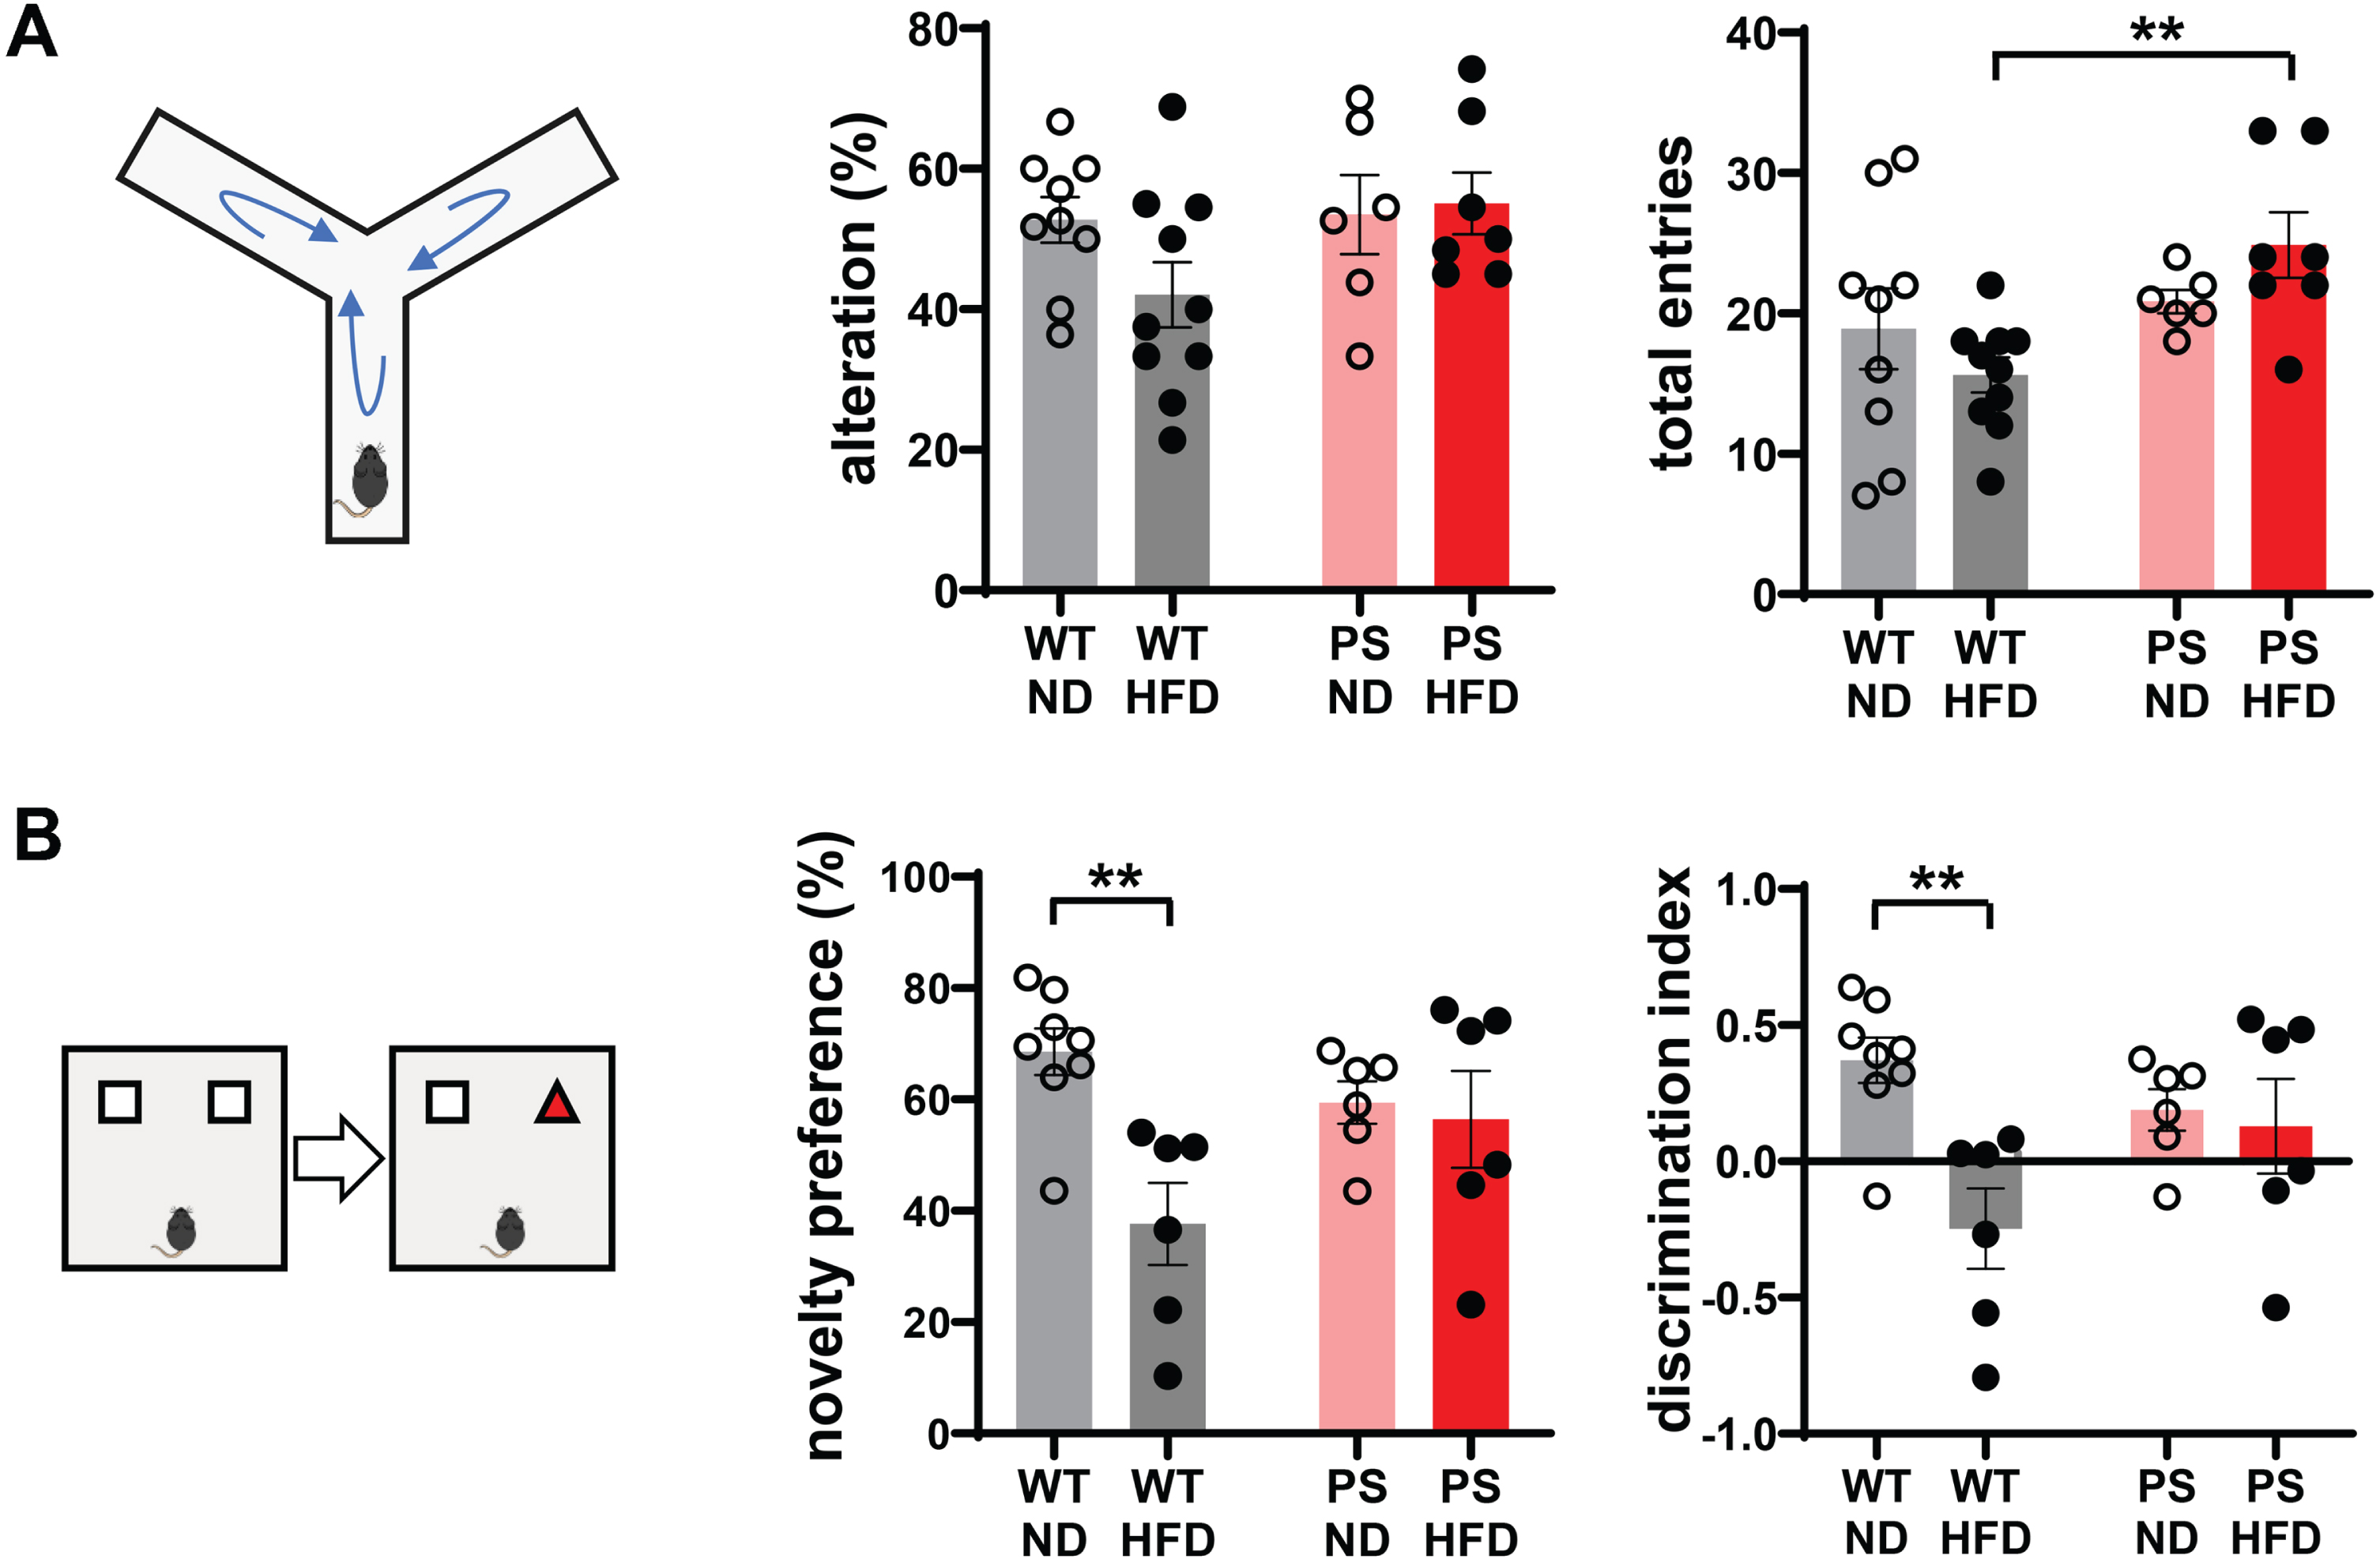
Analysis of behavioral performance showed a decline in recognition memory in wild-type mice on a high-fat diet. A) The Y-maze test demonstrates no difference in percentage alteration of arm entries among the experimental groups and higher total number of arm entries in P301 S (PS) mice with high-fat diet (HFD) than HFD-fed wild-type (WT) mice. n = 9 in WT-normal diet (ND), n = 10 in WT-HFD, n = 6 in PS-ND, and n = 7 in PS-HFD. B) The scores of novelty preference and discrimination index in novel object recognition test are lower in WT-HFD mice compared to WT-ND mice. n = 8 in WT-ND, n = 6 in WT-HFD, n = 6 in PS-ND, and n = 6 in PS-HFD. *p < 0.05, and **p < 0.01 on two-way ANOVA analysis with post hoc t-test. The error bars represent the standard error of the mean. HFD, high-fat diet; ND, normal diet; PS, P301S; WT, wild-type.
Effects of HFD on neural connectivity and white matter tracts in WT and P301S mice
Functional neural connectivity represented by the apparent synchrony of fMRI signals between different regions of interest (ROIs) was assessed in WT (n = 6) and P301S (n = 7) mice. Five ROIs were defined in each hemisphere to examine the heavily interconnected motor network (MOp and MOs) and the medial subnetwork focusing on three subdivisions of the RSP (RSPagl, RSPd, and RSPv) that relay hippocampal information [38] (Fig. 3A). Network analysis showed higher and lower overall functional connectivity in WT-HFD and PS-HFD mice, respectively, compared to the corresponding ND groups (Fig. 3B). Specifically, three retrosplenial cortical networks and one interhemispheric motor connection were significantly increased in HFD-fed WT mice in comparison with ND-fed WT mice (p < 0.05, Mann–Whitney U test): the left RSPagl–left MOp, left RSPd–left MOp, right RSPagl–left MOs, and left Mop–right MOp (Fig. 3C), respectively.
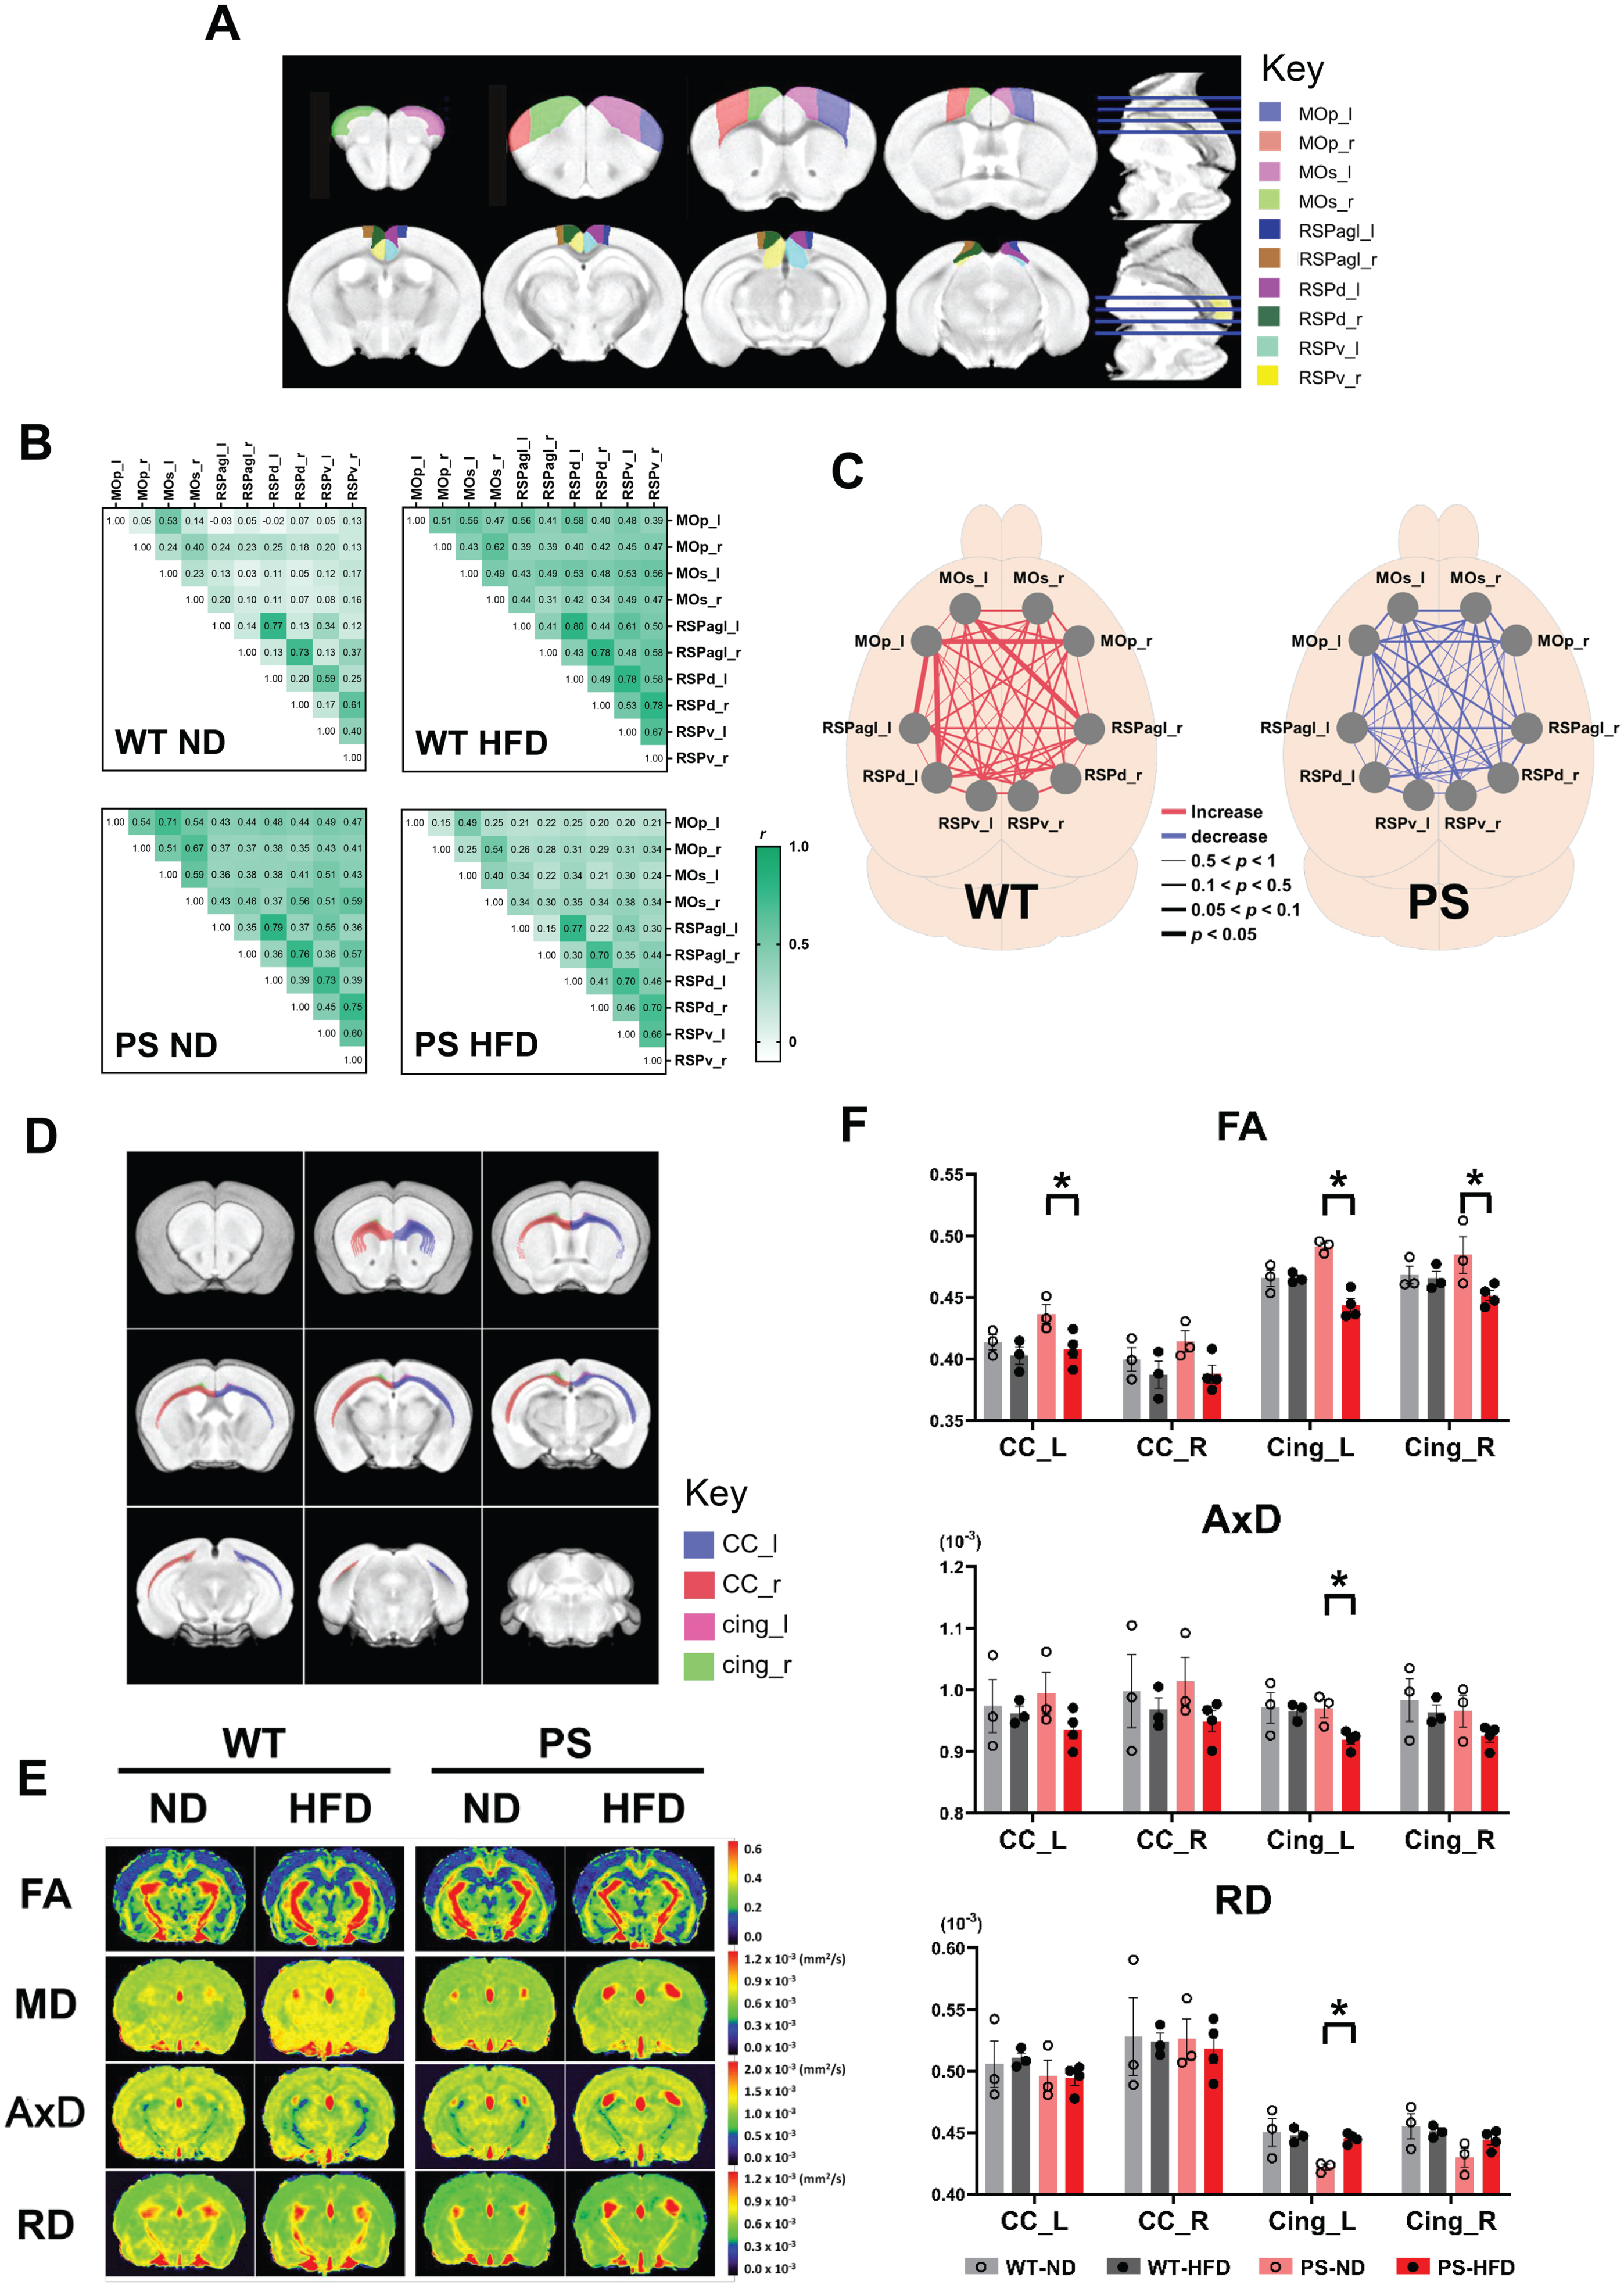
Changes in network connectivity and water diffusion of the neural tracts according to diet type. A) Ten regions of interests (ROIs) that are determined based on the functional organization of the mouse brain are selected for rs-fMRI analysis. left and right primary motor area (MOp_l, light blue; MOp_r, red), left and right secondary motor area (MOs_l, pink; MOs_r, light green), left and right retrosplenial area, lateral agranular part (RSPagl_l, dark blue; RSPagl_r, brown), left and right retrosplenial area, dorsal part (RSPd_l, violet; RSPd_r, dark green), and left and right retrosplenial area, ventral part (RSPv_l, cyan; RSPv_r, yellow). B) The analysis of cross-correlation between the pairs of ROIs shows the network connectivity according to the diet and tau genotype. Pearson’s correlation coefficients are shown as a scaled color and a number in a heatmap. C) The change of network connectivity from normal diet (ND) to high-fat diet (HFD) group are shown in individual networks, wild-type (WT, left) and P301S mice (PS, right) in a separate. The increase and the decrease of the connectivity are demarcated as red and blue color, respectively. The thickness of the line differs according to the p-value on the Mann-Whitney U test that computes the difference of correlation coefficients between ND and HFD group within the same genotype: the thickest line represents p-value <0.05. D) The locations of the corpus callosum and cingulum in which the water diffusions were measured are shown in the MRI template. Left and right corpus callosum (CC_l, light blue; CC_r, red), and left and right cingulum (cing_l, pink; cing_r, light green). E) The representative DTIs demonstrate the fractional anisotropy (FA), mean diffusivity (MD), axial diffusivity (AxD), and radial diffusivity (RD). F) The comparisons of individual DTI parameters in four neural tracts are shown according to the experiment groups. *p < 0.05 on the Mann-Whitney U test. Brain MRI was performed in part of the experiment mice (n = 3 in WT-ND, n = 3 in WT-HFD, n = 3 in PS-ND, and n = 4 in PS-HFD). The error bars represent the standard error of the mean. AxD, axial diffusivity; CC: corpus callosum, Cing: cingulum bundle; FA, fractional anisotropy; HFD, high-fat diet; MOp: primary motor area; MOs: secondary motor area; ND, normal diet; PS, P301S; RD, radial diffusivity; RSPagl: retrosplenial area, agranular part; RSPd: retrosplenial area, dorsal part; RSPv: retrosplenial area, ventral part; WT, wild-type.
DTI was used to characterize microstructural changes in two white matter tracts, the corpus callosum and cingulum bundle, which are closely associated with motor network and hippocampal connectivity, respectively [39] (Fig. 3D, E). The increased neural connectivity observed in rs-fMRI of WT-HFD mice was not reflected in the structural integrity of white matter tracts in DTI (p > 0.05, Mann–Whitney U test). In contrast, substantial changes were observed in water diffusivity of the fiber bundles of the left corpus callosum and bilateral cingulum in PS-HFD mice as decreased FA in comparison with PS-ND mice (p = 0.034) (Fig. 3F). In addition, the RD of the left cingulum was higher and its AxD was lower in PS-HFD mice compared to PS-ND mice (p = 0.034).
HFD-associated reductions of insulin receptor β expression and its downstream signaling were observed only in WT mice
To identify HFD-related pathological changes, western blotting analysis was performed using RIPA-extracted brain tissues obtained separately from the cortex and hippocampus. Initially, we examined the levels of insulin receptor beta (IRβ) and its immediate downstream substrate, insulin receptor substrate-1 (IRS-1), to examine whether chronic HFD feeding induced insulin resistance in the brain (Fig. 4). The level of IRβ was decreased in the cortex of WT-HFD mice compared to genotype-matched ND-fed mice (p = 0.004, two-way ANOVA with post hoc t test). The change was continuous with downstream signaling indicating decreases in the phosphorylated IRS-1 (pIRS-1)/total IRS-1 ratio (p = 0.032) and pGSK3β/total GSK3β ratio (p = 0.008) in the cortex. However, the level of the intervening signaling molecule, pAkt/total Akt ratio, remained unchanged. Notably, there were no discernible changes in the expression levels of IRβ or IRS-1 in P301S mice in relation to HFD intake.
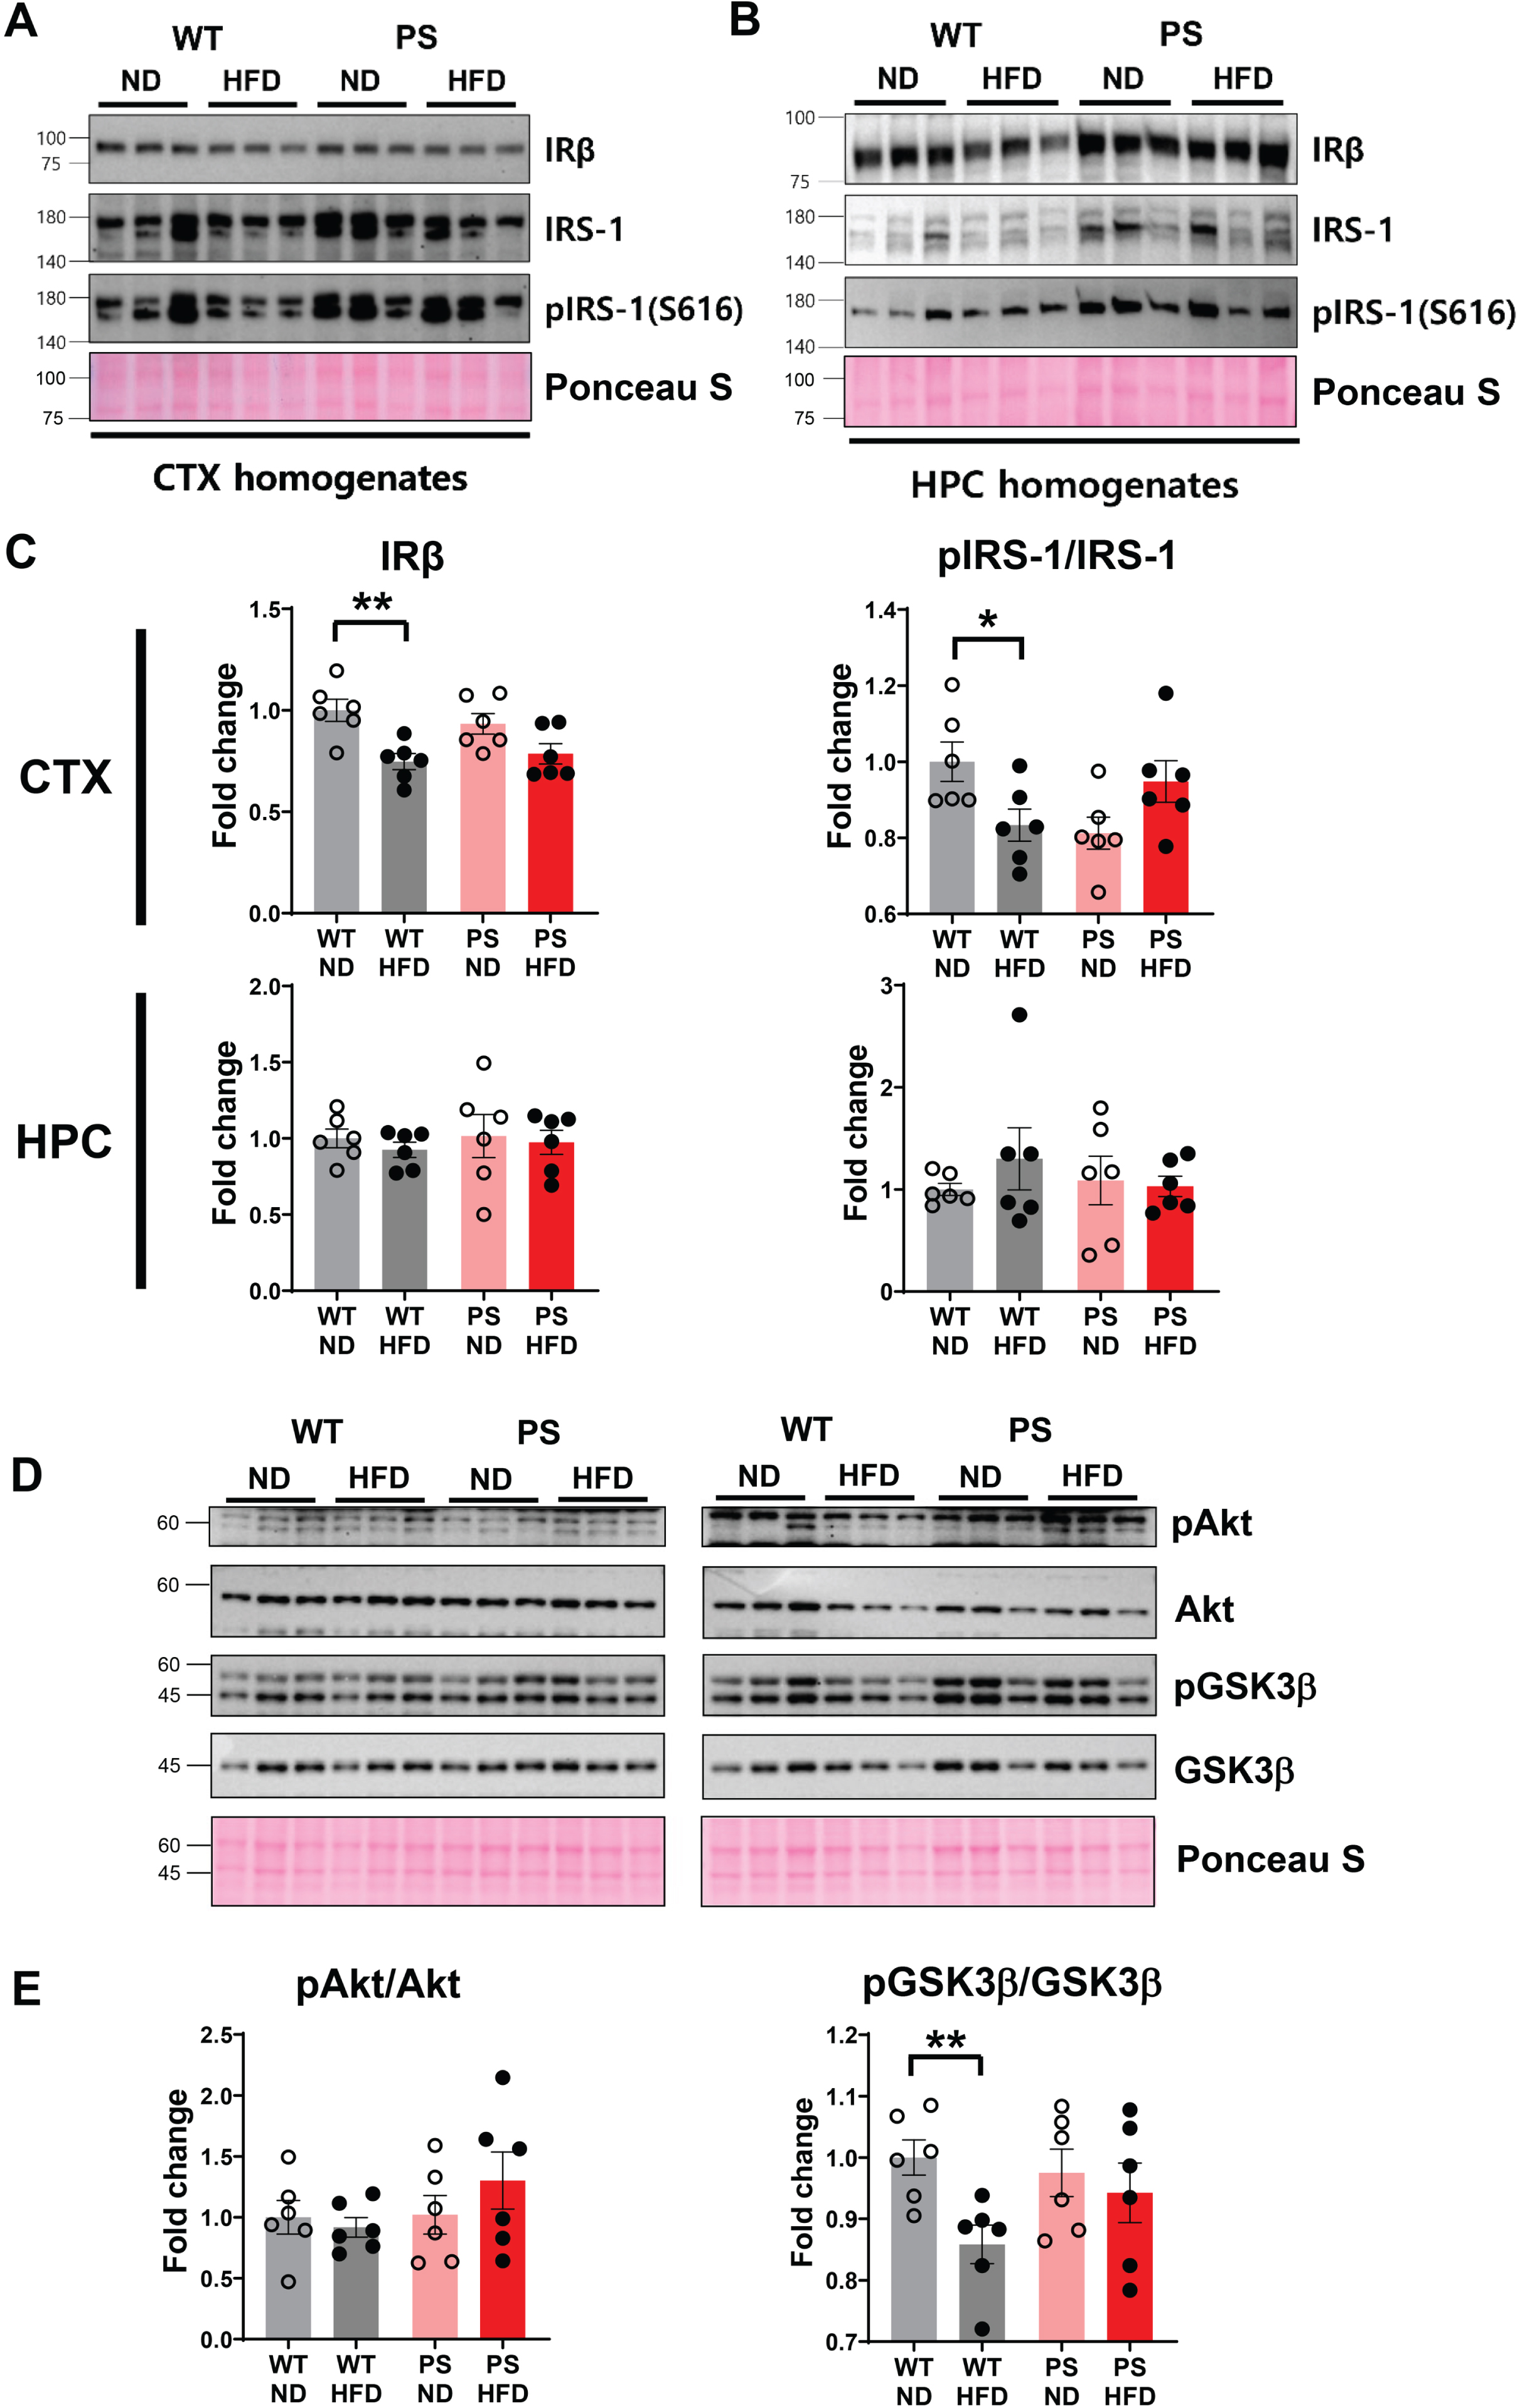
Western blotting analysis of inulin receptor-beta and its downstream molecules using brain extracts from the cortex and hippocampus. A, B) The representative western blot of IRβ, total insulin receptor substrate-1 (IRS-1) and phosphorylated IRS-1 (pIRS-1) at Ser616 in the cortex (A) and hippocampus (B). C) The densitometry analysis shows the IRβ expression and pIRS-1/IRS-1 ratio in all the examined mice (n = 6 in each group) according to the diet and tau genotype. D) The expressions of pAkt at Thr308, total Akt, pGSK3β at Tyr216, and total GSK3β in the cortical extracts are shown on the western blot. E) The corresponding densitometry analysis demonstrates pAkt/Akt and pGSK3β/GSK3β ratio depending on the experimental groups. The Ponceau staining displays the loading of the proteins. *p < 0.05, and **p < 0.01 on two-way ANOVA with post hoc analysis. The error bars represent the standard error of the mean. CTX, cortex; HFD, high-fat diet; HPC, hippocampus; ND, normal diet; PS, P301S; WT, wild-type.
Decreases in neuronal markers and phagocytic microglial activity in HFD-fed WT mice
Next, we examined the impact of HFD on the levels of neuronal nuclear (NeuN) protein and synaptic proteins (Fig. 5). The cortical NeuN level was lower in WT-HFD mice than in WT-ND mice (p = 0.016, two-way ANOVA with post hoc t test). A genotype effect was observed in the expression of NeuN in the hippocampus, which was lower in PS-ND than in WT-ND mice (p = 0.033), but there were no diet-dependent differences within the same genotype. The levels of synaptic proteins, including pre- (α-synaptophysin) and postsynaptic (postsynaptic density protein-95) markers, and glial fibrillary acidic protein (GFAP), a marker of reactive astrogliosis, were comparable across all groups examined.
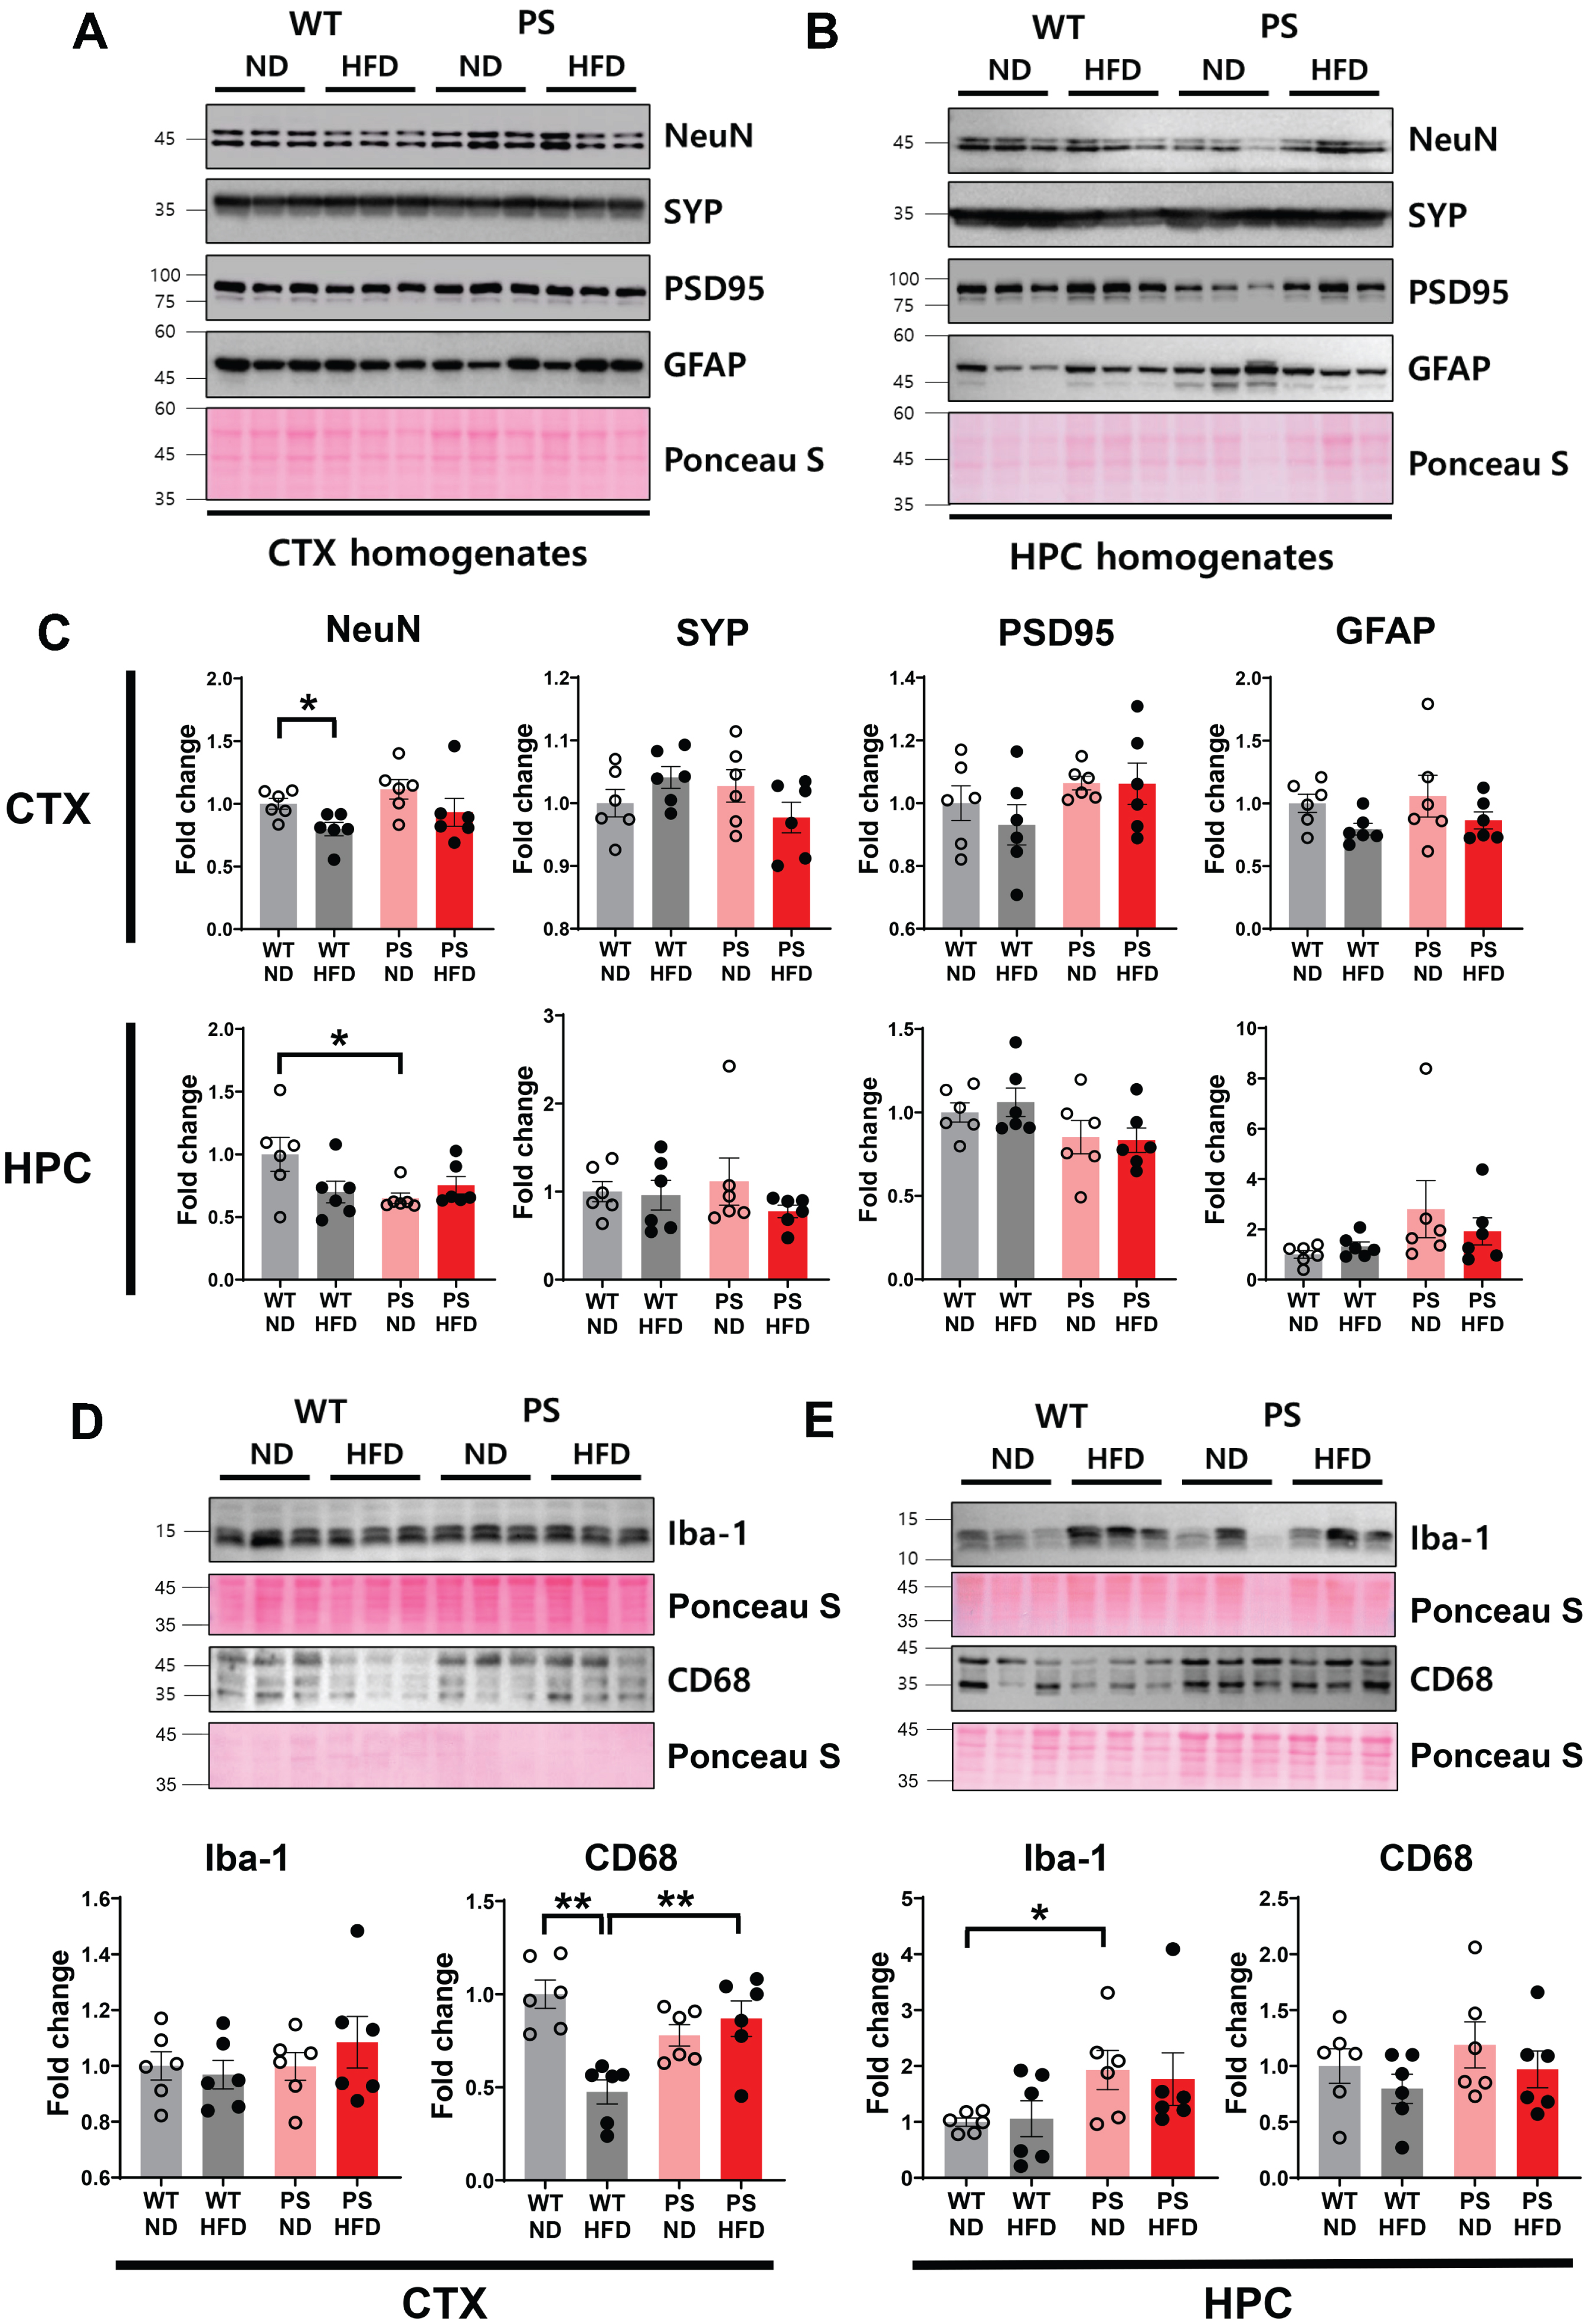
Western blotting analysis of cellular markers and synaptic proteins. A, B) The representative western blot of neuronal nuclear protein (NeuN), α-synaptophysin (SYP), postsynaptic density protein-95 (PSD-95), and glial fibrillary acidic protein (GFAP) in the cortex (A) and hippocampus (B). C) The densitometry analysis shows the four group comparisons on the examined protein levels. D, E) The representative blot shows the expression of ionized calcium binding adaptor molecule 1 (Iba-1) and cluster of differentiation 68 (CD68) with matching densitometry analysis to show the four group comparisons. Western blots were performed in n = 6 mice in all groups. The Ponceau staining displays the loading of the proteins. *p < 0.05 and **p < 0.01 on two-way ANOVA with post hoc analysis. The error bars represent the standard error of the mean. CTX, cortex; HFD, high-fat diet; HPC, hippocampus; ND, normal diet; PS, P301S; WT, wild-type.
Two microglial markers, ionized calcium binding adapter molecule 1 (Iba-1) and cluster of differentiation 68 (CD68), were examined to identify whether microglial activities were altered according to the experimental conditions. In contrast with Iba-1, cortical CD68 expression showed a significant HFD effect (p = 0.009) and HFD×genotype interaction (p = 0.001) in two-way ANOVA. A selective diet effect was observed in WT mice in post hoc analysis, with a marked decrease in WT-HFD mice compared to WT-ND (p = 0.004, post hoc t test). The decrease in CD68 expression in WT-HFD mice was significantly different from that in PS-HFD mice (p = 0.007). These observations suggest that microglia with CD68 positive phagocytic activity [40] are highly responsive to HFD feeding in WT but not P301S mice. Therefore, the prevalent and chronic tau pathology appears to reduce the susceptibility of phagocytic microglia to HFD. However, no HFD-related effect was evident in the hippocampus. A genotype difference in Iba-1 expression was only noted, with a higher level in PS-ND mice than in WT-ND mice(p = 0.027).
HFD-associated tau protein changes in WT mice but not P301S mice
We measured the levels of total, conformationally changed, and phosphorylated tau (pTau) at specified loci that are closely associated with AD [41], in both humans and mice. For this, we used western blotting analysis of serially extracted cortical and hippocampal tissue specimens with buffers of varying solubility, from TBS to RIPA to formic acid. As expected from the overexpression of human mutant tau in neurons of P301S mice [19], significantly higher tau protein levels in all forms examined were observed in P301S than in WT mice (p < 0.05, two-way ANOVA with post hoc analysis) (Fig. 6). Further, formic acid-extractable, highly aggregated tau protein levels were also much higher in P301S mice. However, the diet-specific discrepancy was subtle in the cortex, with a greater reduction of soluble total tau level (TBS fraction) in WT-HFD mice than in WT-ND mice (p = 0.01, two-way ANOVA followed by t test).
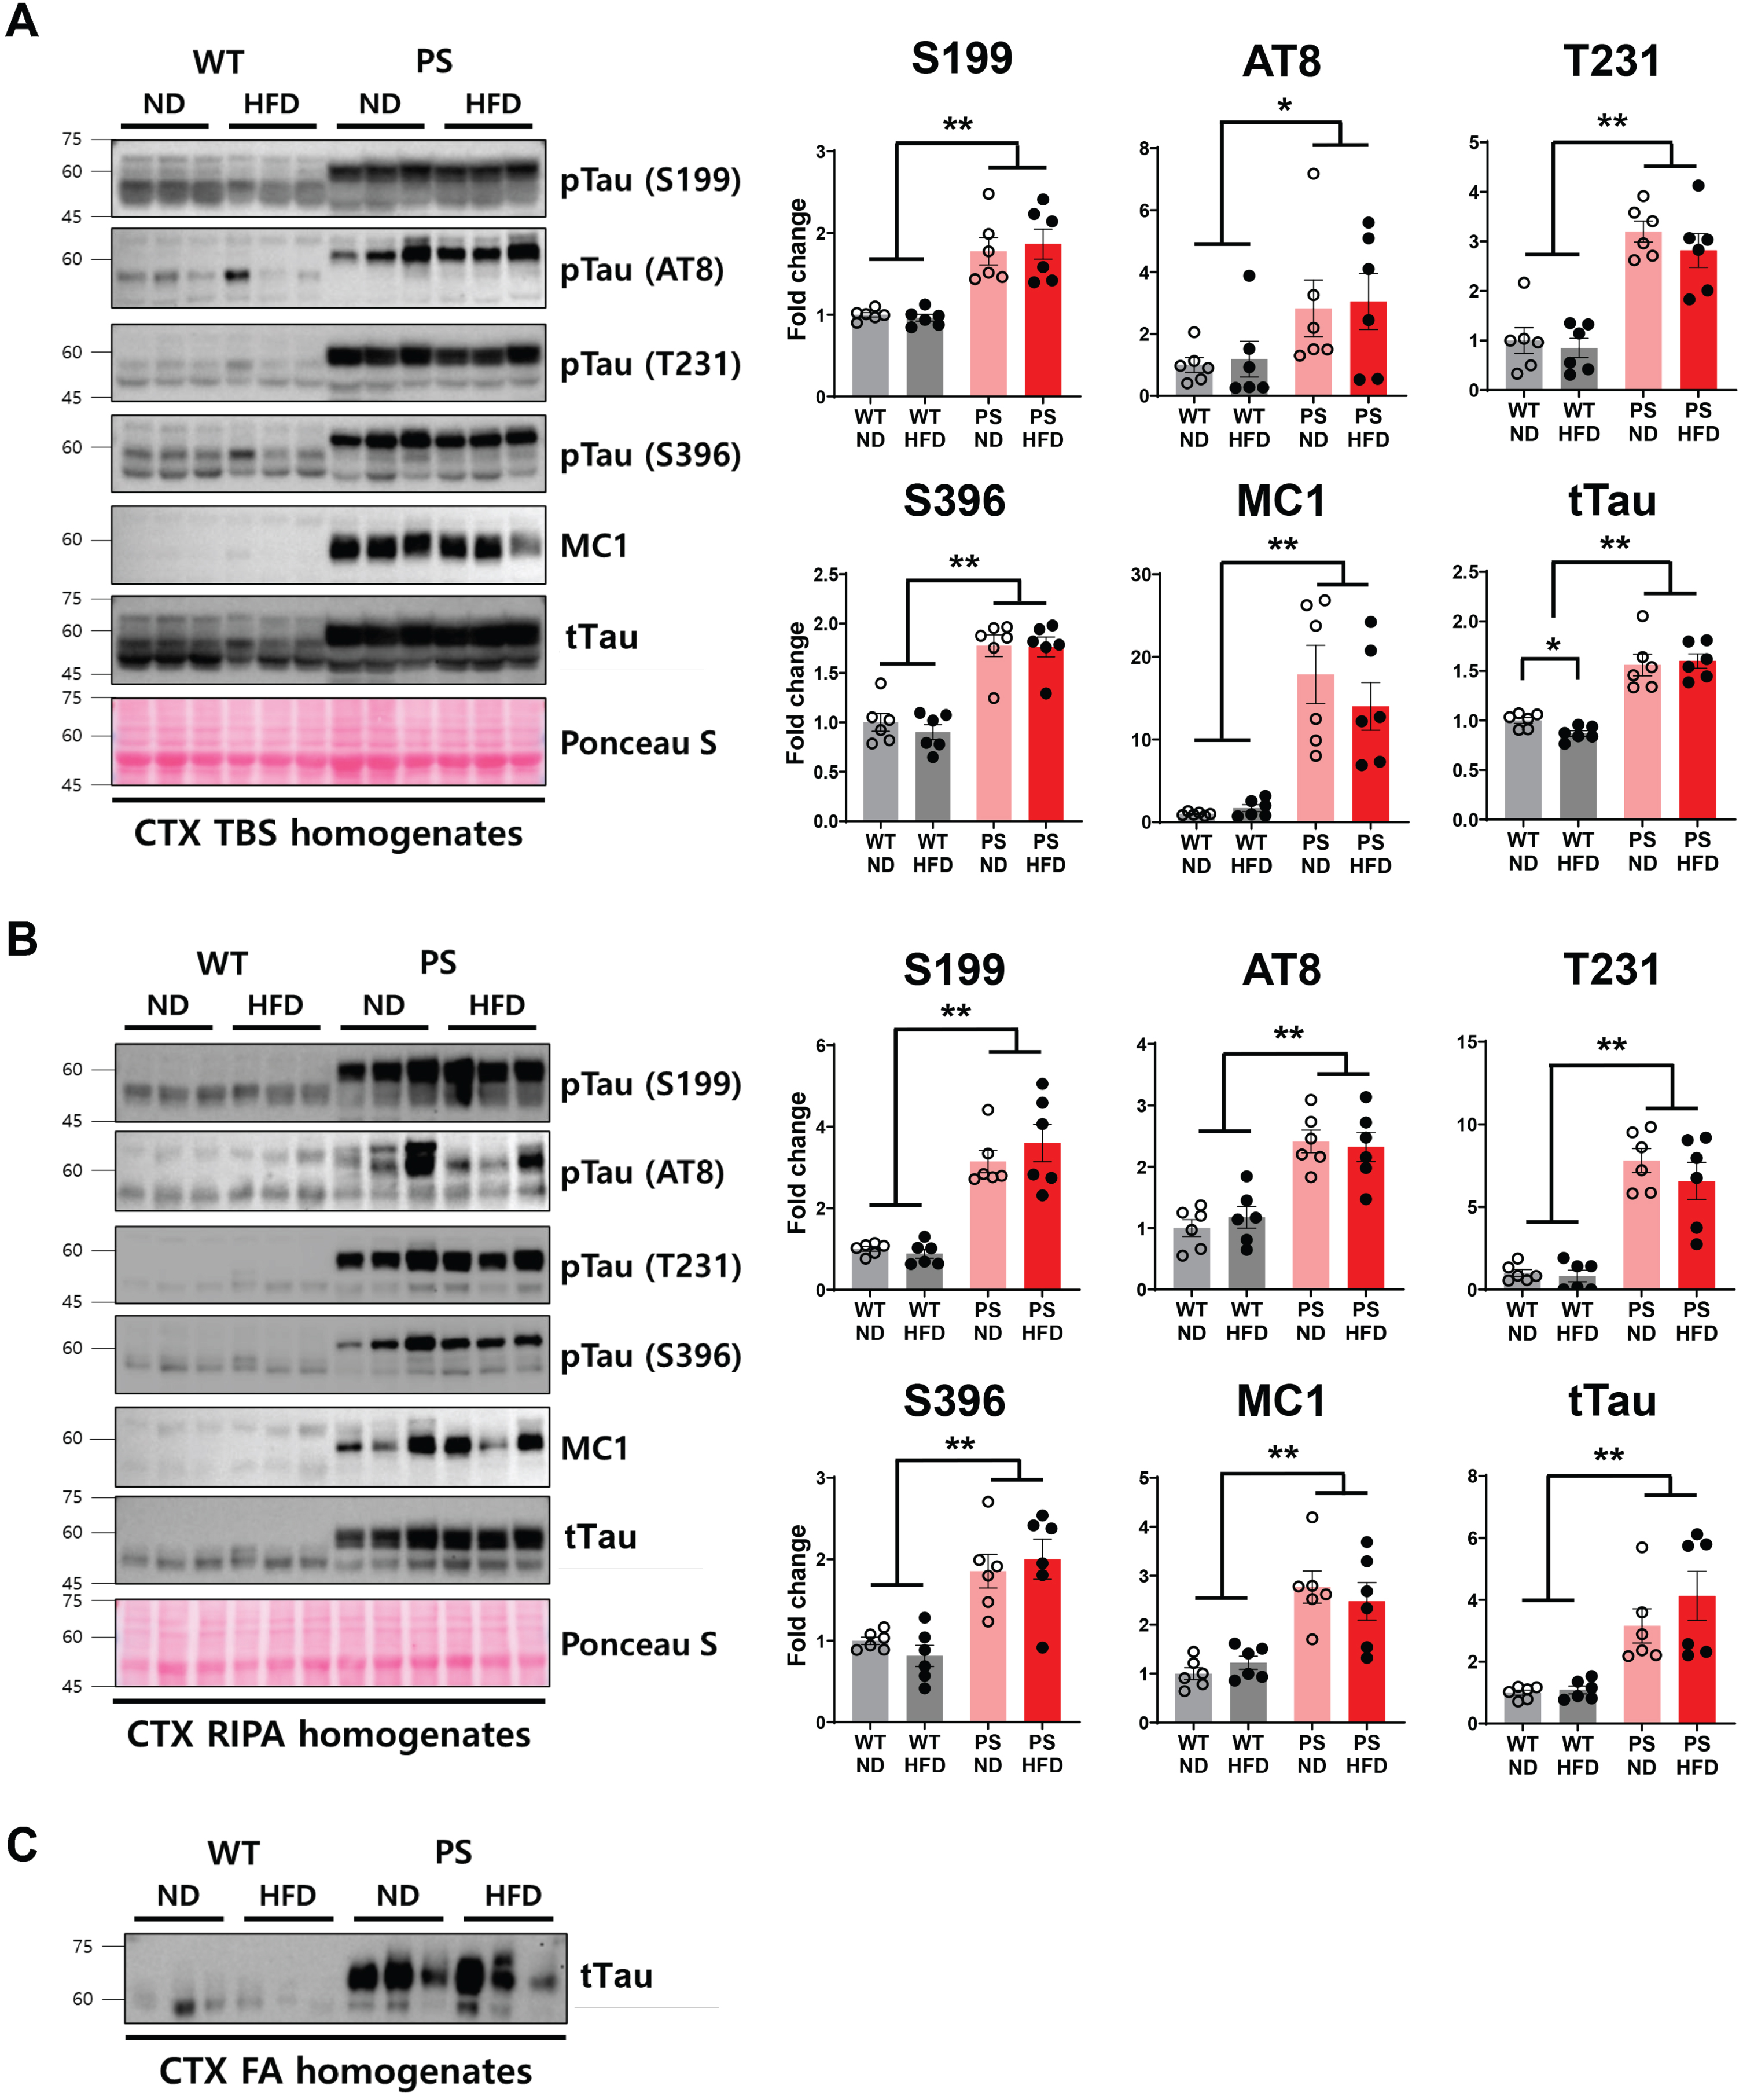
Western blotting analysis using serially extracted brain samples from the cortex to examine both phosphorylated and total tau protein expression. A, B) The representative blot (left) and the corresponding densitometry analysis (right) show the levels of phosphorylated tau at specific sites (S199, S202/T205, T231, and S396), conformationally changed tau (MC1), and total tau according to tau genotype and diet in TBS (A) and RIPA (B) fractions. The Ponceau staining displays the loading of the proteins. *p < 0.05 and **p < 0.01 on two-way ANOVA with post hoc analysis. The error bars represent the standard error of the mean. C) The representative western blot shows the levels of formic acid-extracted insoluble total tau proteins. Western blots were performed in n = 6 mice from individual group. CTX, cortex; FA, the extracts obtained using formic acid; HFD, high-fat diet; ND, normal diet; RIPA, the extracts extracted using RIPA buffer; TBS, the extracts eluted using tris-buffered saline; PS, P301S; WT, wild-type.
In the hippocampus, significantly decreased soluble pTau (S396) was observed in the TBS extract in relation to HFD feeding in WT mice (p = 0.008, two-way ANOVA with post hoc analysis). In addition, the less-soluble RIPA fraction showed increased AT8 antibody-reactive pTau (S202/T205) levels comparable to the level in P301S mice (p = 0.015) (Fig. 7). In contrast, there were no statistically significant changes in phosphorylated or total tau protein levels in relation to HFD feeding in P301S mice.
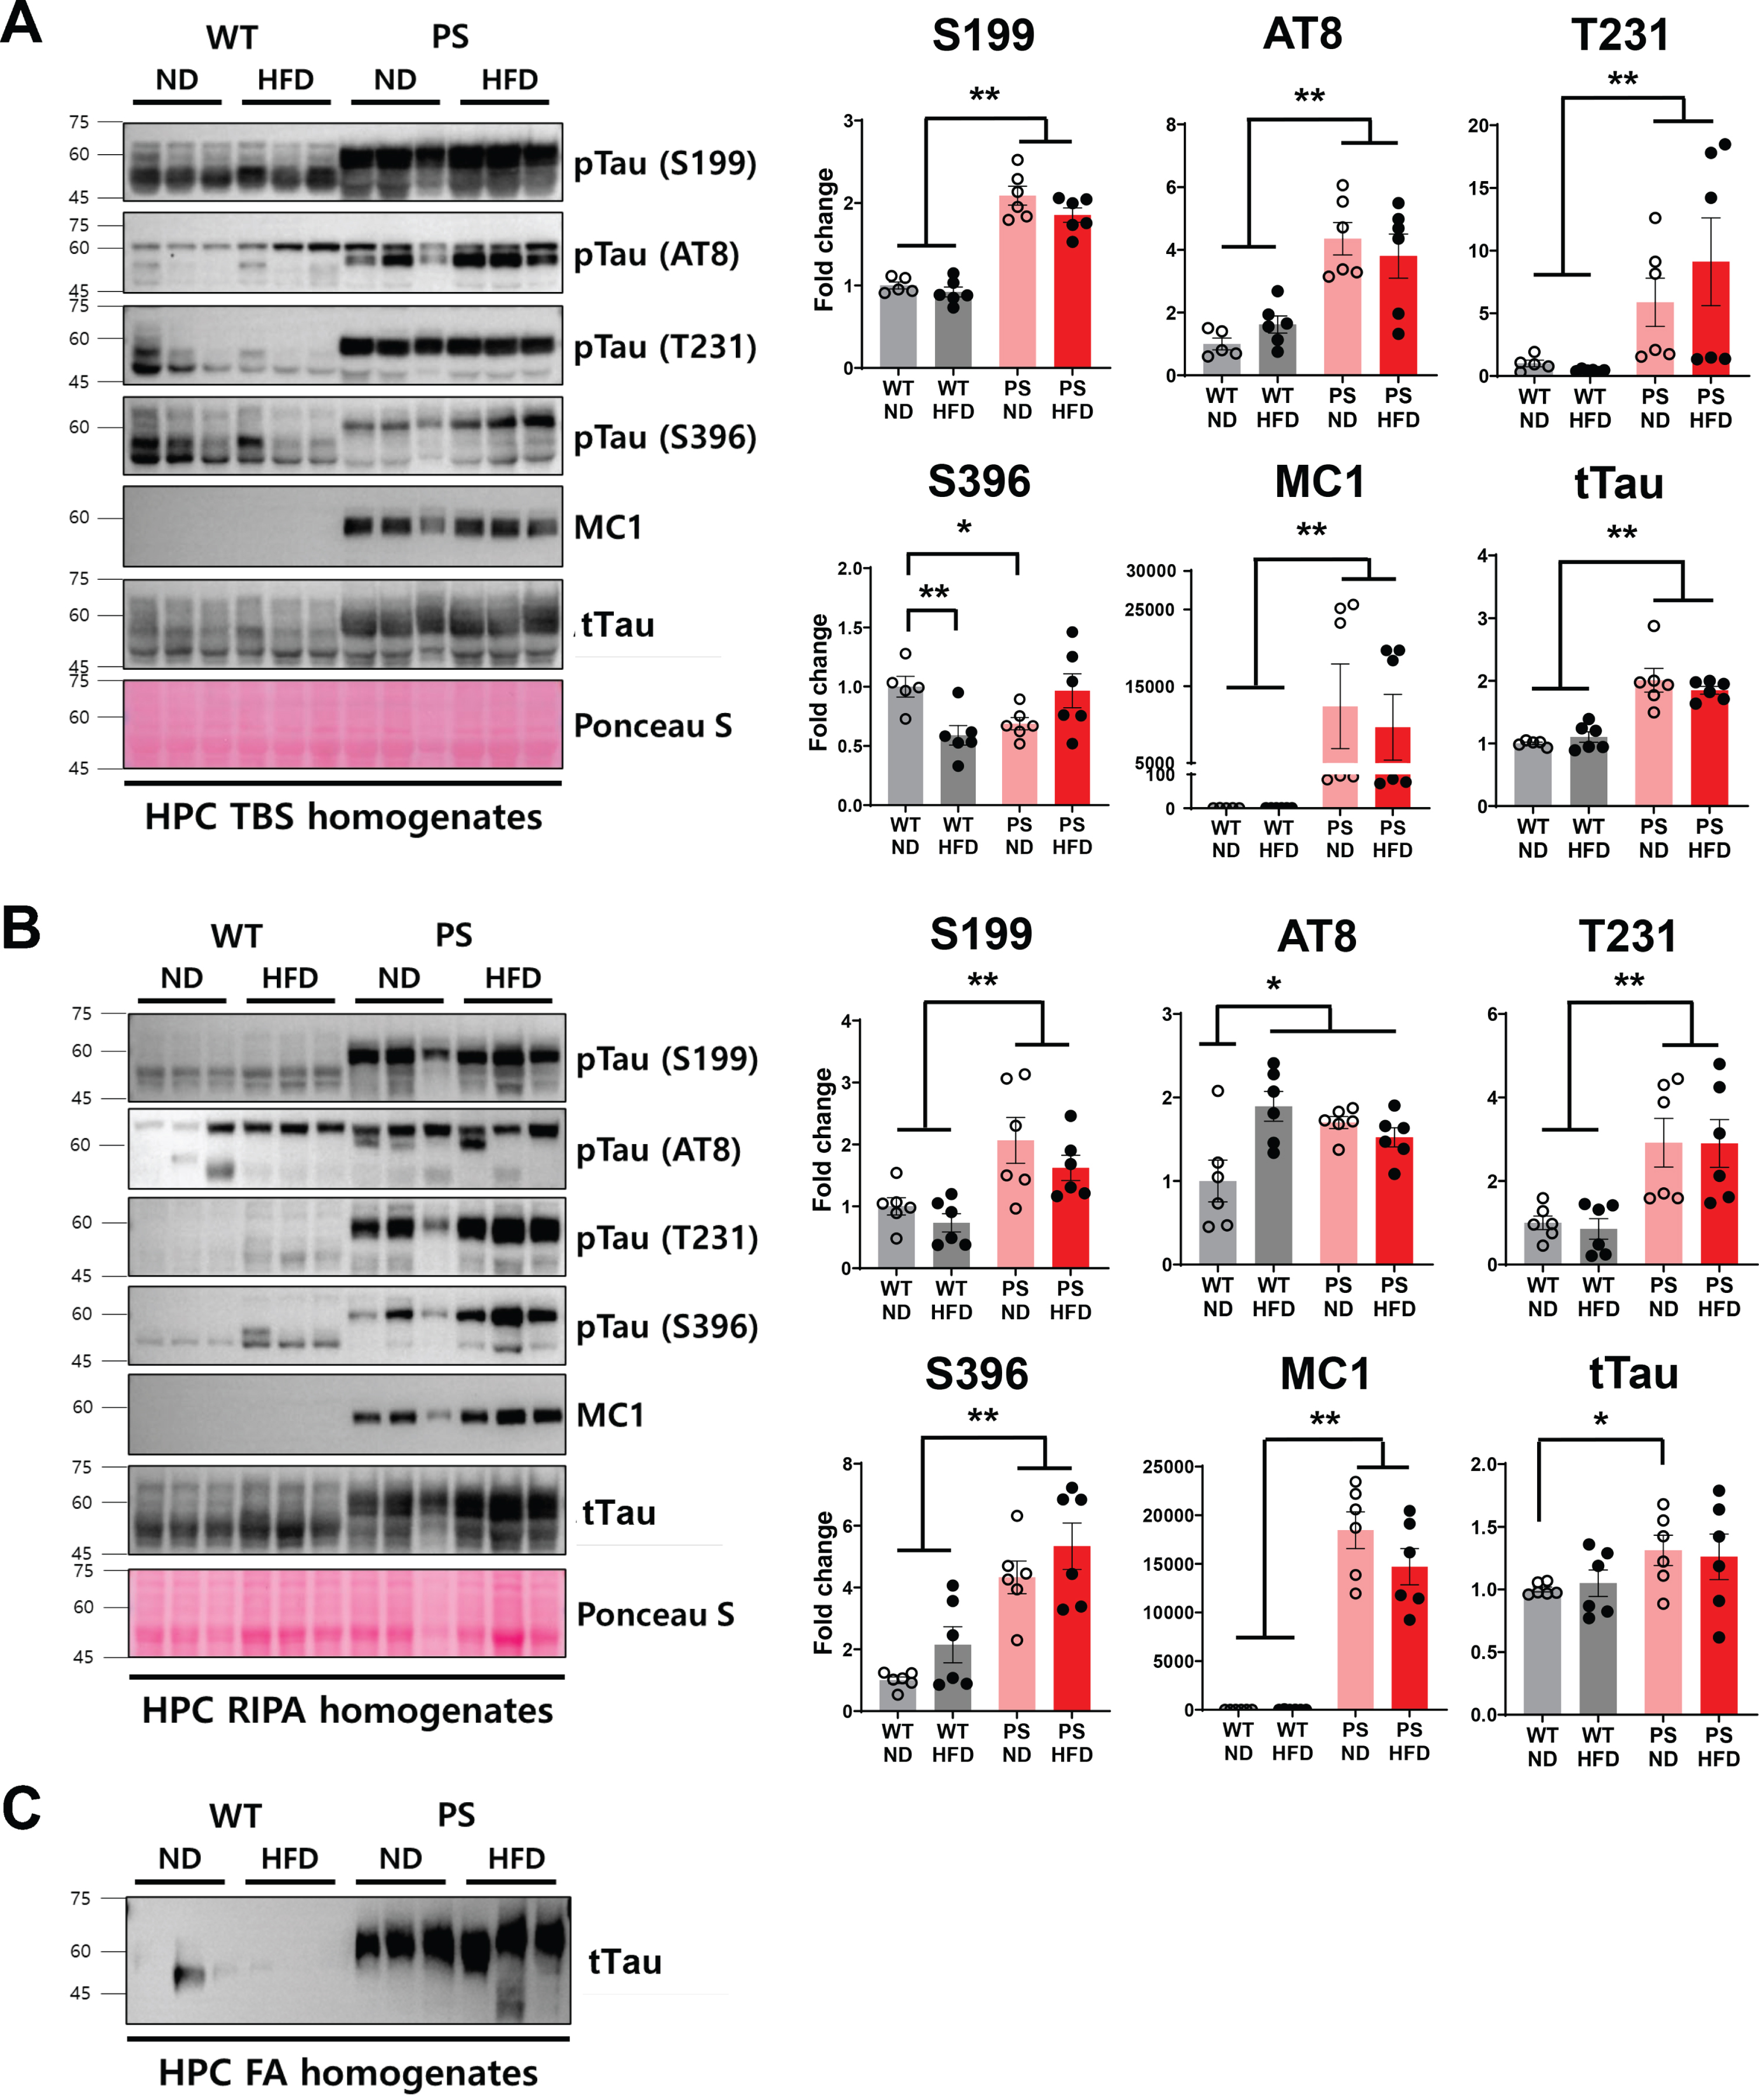
Western blotting analysis using serially extracted hippocampal samples. A, B) The representative blot (left) and the corresponding densitometry analysis (right) demonstrate the levels of phosphorylated (S199, S202/T205, T231, and S396), aggregated (MC1) and total tau in relation to the type of diet and tau genotype. pTau396 levels in TBS extracts (A) and AT8-detectable pTau202/205 expressions in RIPA extracts (B) of the hippocampus are significantly altered by high-fat diet feeding in wild-type mice. The Ponceau staining displays the loading of the proteins. *p < 0.05, and **p < 0.01 on two-way ANOVA with post hoc analysis. The error bars represent the standard error of the mean. C) The representative western blot demonstrates the amounts of formic acid-extracted insoluble total tau proteins. Western blots were performed in n = 6 mice per individual group except for n = 5 in western blot using TBS extracts of WT-ND mice due to the shortage of sample. FA, the extracts obtained using formic acid; HFD, high-fat diet; HPC, hippocampus; ND, normal diet; RIPA, the extracts extracted using RIPA buffer; TBS, the extracts eluted using tris-buffered saline; PS, P301S; WT, wild-type.
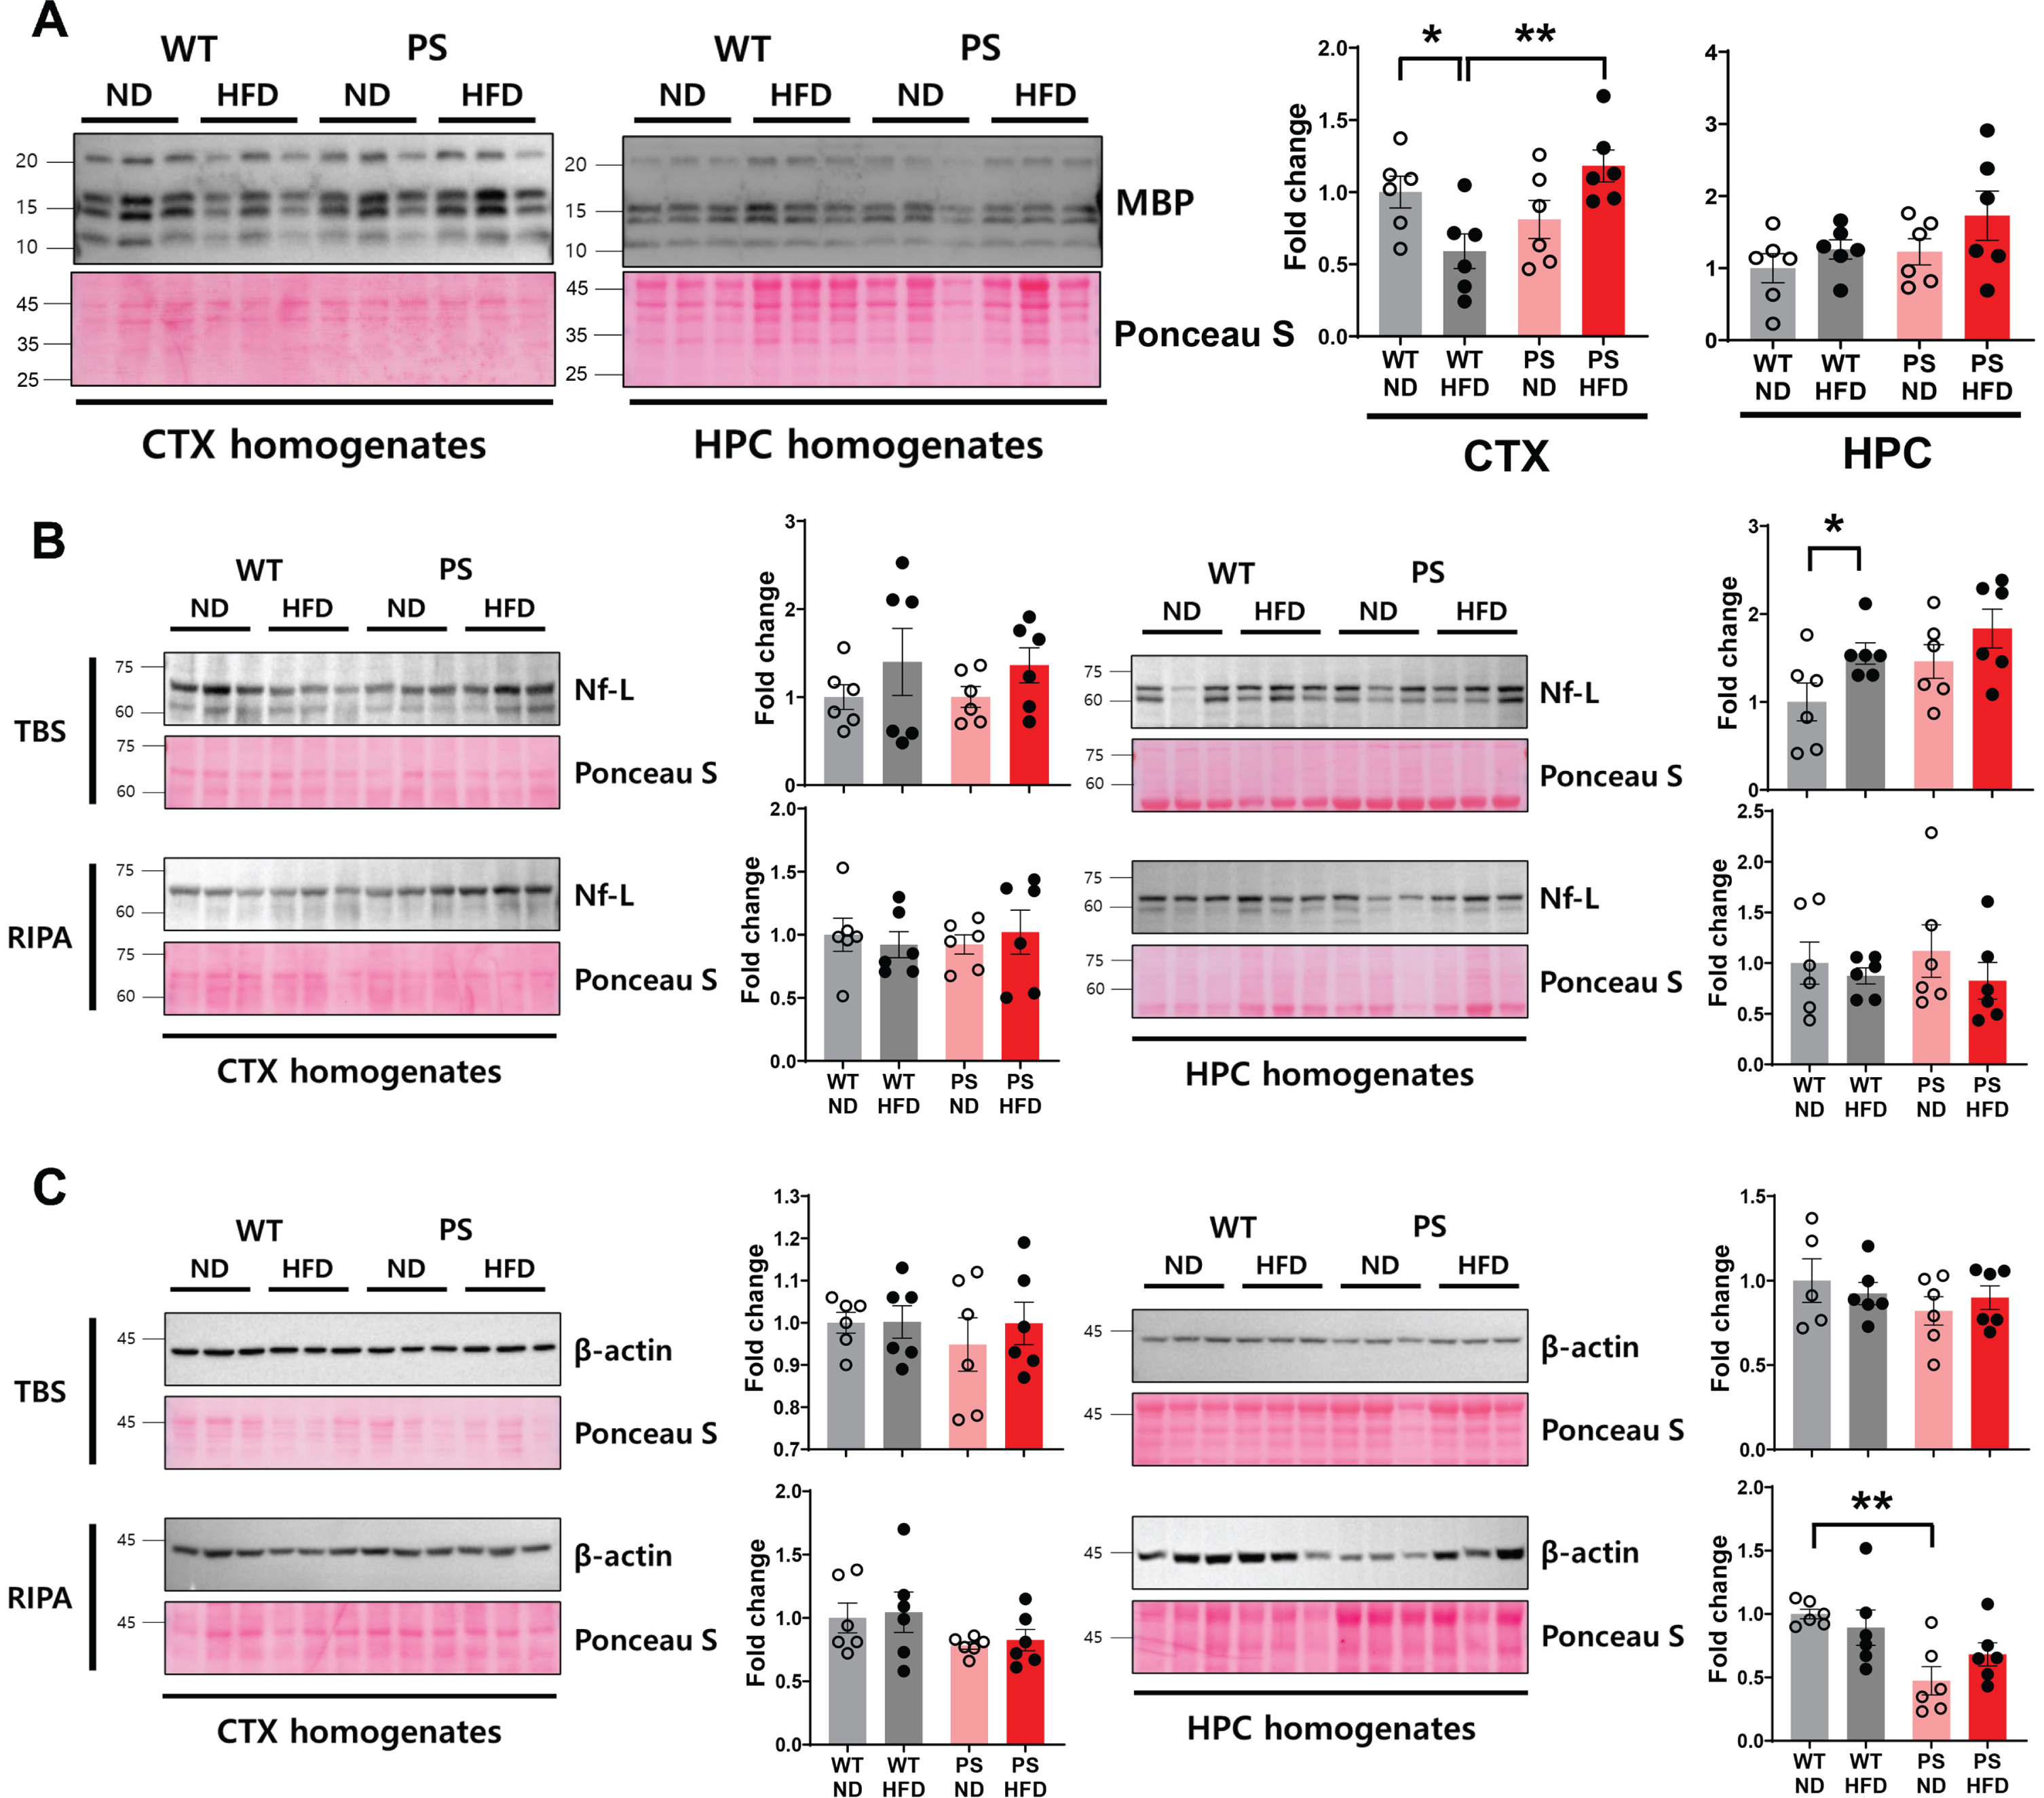
Western blotting analysis of myelin and axon cytoskeletal proteins. A) The representative blot and corresponding densitometry analysis show the changes of myelin basic protein in the cortex and hippocampus in response to high-fat diet (HFD) in both wild-type (WT) and P301S mice. B, C) The representative blot and corresponding densitometry analysis show the neurofilament-light protein (B) and β-actin (C) levels in TBS (upper panel) and RIPA (lower panel) fractions of the cortex (left) and hippocampus (right) according to the experimental groups. Western blots were performed in n = 6 mice from individual group. The Ponceau staining displays the loading of the proteins. *p < 0.05 and **p < 0.01 on two-way ANOVA with post hoc analysis. The error bars represent the standard error of the mean. CTX, cortex; HPC, hippocampus; HFD, high-fat diet; MBP, myelin basic protein; Nf-L, neurofilament-light; ND, normal diet; RIPA, the extracts extracted using RIPA buffer; TBS, the extracts obtained using tris-buffered saline; PS, P301S; WT, wild-type.
Changes in myelin basic protein and neurofilament-light levels in HFD-fed WT mice
As water diffusion properties of neural tracts measured by DTI-MRI are dependent on both myelination and axonal integrity [42], we investigated the levels of myelin basic protein (MBP) and two axonal components, neurofilament-light (Nf-L) and β-actin, to determine whether the HFD-related changes in DTI parameters would be reflected in the changes in these proteins. Western blotting analysis using cortical RIPA extracts showed that MBP levels were decreased in WT-HFD mice compared to the corresponding ND mice (p = 0.03, two-way ANOVA with post hoc analysis). In addition, a genotype effect was observed as a higher MBP level in PS-HFD mice than WT-HFD mice (p = 0.005). HFD feeding in WT mice increased Nf-L levels in the soluble extracts of the hippocampus to reach a difference from those in WT-ND mice (p = 0.049), while Nf-L levels were comparable within P301S mice regardless of diet type. The level of the abundant cytoskeletal protein β-actin showed no differences according to the type of diet, but a genotype difference was observed in two-way ANOVA with a lower β-actin level in PS-ND mice than in WT-ND mice in post hoc t tests of hippocampal RIPA extracts (p = 0.001). Taken together, our findings revealed notable HFD-related changes in MBP and Nf-L in cortical and hippocampal extracts of WT mice.
DISCUSSION
This was the first study to conduct neuroimaging in addition to behavioral and tissue analyses to comprehensively examine the interaction between chronic HFD intake and tau pathology in a mouse model. Both WT and P301S mice fed the HFD showed distinct weight gain compared to the genotype-matched ND group, but the changes in brain function and structure differed significantly between the two genotypes. PS-HFD mice showed decreased integrity of the cingulum bundle in DTI-MRI compared to the genotype-matched ND group. However, there were no significant changes in markers of brain cells or tau protein in western blotting analysis of cortical and hippocampal tissue extracts. Conversely, marked pathological changes were detected in WT mice in response to HFD in addition to decreased memory performance in the novel object recognition test and changes in network connectivity in rs-fMRI. Significant decreases in expression of IRβ and its downstream substrate IRS-1 were observed in the cortex where levels of both NeuN and CD68 (markers of neurons and microglia with phagocytic activity, respectively [40]) were also decreased. The levels of soluble tau in the cortex and pTau396 in the hippocampus were significantly reduced, while the levels of less-soluble AT8-positive pTau (S202/T205) were higher in WT mice fed the HFD than the ND. Significantly decreased MBP levels and increased soluble Nf-L levels were observed in the cortex and hippocampus, respectively. These findings indicate that the susceptibility of the brain to chronic HFD intake is more profound in healthy mice than in those with the tau pathology. The lack of change in tau protein levels in the transgenic mice after chronic HFD feeding is consistent with previous studies on mice overexpressing human WT [43] and mutant tau: Tau22 (MAPT G272 V & P301S) and 3×TG-AD (APPswe, PSEN1 M146 V, and MAPT P301L) [25–27] (Table 2). However, contradictory results have been reported [13, 14]. Increased levels of pTau were identified in another study using Tau22 male mice after 5 months of HFD intake from the age of 2 months [13]. Tau22 mice develop tau pathology from 3-month-old by double mutant MAPT transgene under Thy1 promoter and have a metabolic-susceptible strain background, C57BL6/J [44]. These confounders are thought to bring out different brain responses to HFD from ours. However, the worsening effect of HFD in tau pathology was not replicable in the following study even though the same Tau22 mice model was used [27]. In another study, moderately high calories diet (15.3% fat) that was fed for 8.5 months from 1.5 months of age increased the levels of aggregated and AT8 antibody-detectable pTau levels in the hippocampus of female P301S mice [14]. This is the same mouse model as used in the present study, but fat composite of the diet was much lower, and the start time was earlier (at 1.5 months) than in our experiments. Considering that neurofibrillary tangles become prevalent around 6 months of age in P301S mice, and the earliest phenotypic features, such as gliosis, are evident from 3 months of age [19] 1.5 months of difference is substantial. In addition, the weight gain of P301S mice in response to the high calories diet was 20% compared to the regular diet (4% fat), which is less than ours. These differences appear to cause our results to be different from the previous one. Further, the sex-specific susceptibility to obesity and obesogenic diet, as reported in humans [45], Tau22 transgenic mice [27], and C57BL6/J WT mice [23, 47] may also explain the discrepancy between the results of that previous study and our observations despite using the same animal model. With regard to sex-related differences in susceptibility to the effects of HFD intake, most previous studies have been performed on C57BL6/J mice, and these have reported greater vulnerability to systemic metabolic effects and inflammation in males than females [23, 46]. However, there seems to be a disparity between the susceptibility of the brain and the systemic response. Although HFD-induced systemic effects seem to be greater in male mice, some changes in the brain have been exclusively identified in females, including decreased synaptic plasticity, hippocampal neurogenesis, and CD68 phagocytic activities [24, 27]. These observations suggest the need to study the sex-specific effects of HFD in P301S mice to understand whether the unique findings in this study were dependenton sex.
Summary of studies utilizing tau mouse models to investigate brain responses to high-fat diet
*The diet-effect within the same genotype group; **‘In both’ means that both in tau mice and control mice. F, female; H, high-fat diet; M, male; m, months; MWM, Morris water maze test; N-C, not checked; NOR, novel object recognition test; TG, transgenic; WT, wild-type.
Disorganization of the white matter was a significant finding related to HFD feeding in P301S mice in this study. In the cingulum, the reduced FA was accompanied by a decrease in AxD and increase in RD in PS-HFD mice. These observations suggest that both axonal and myelin damage may be contributing factors, as the decrease in AxD suggests axonal injury while the increase in RD suggests myelin damage [48, 49]. However, the altered white matter integrity was not confirmed by western blotting analysis of MBP and Nf-L, which are major constituents of myelin and axons, respectively, in the cortical and hippocampal extracts. The levels of these proteins were altered in WT mice in relation to HFD, but the mice did not show significant changes in DTI parameters of the white matter although neuronal degeneration was identified based on decreased NeuN levels. This discrepancy was likely because bulk extraction of the cortex and hippocampus is not appropriate to validate the changes in the corpus callosum or cingulum bundle, but rather is better for detection of changes in the gray matter. Therefore, future studies should consider incorporating region-specific and cellular-specific analyses, such as immunohistochemistry and RNA-seq, to provide a more comprehensive understanding of these changes.
To the best of our knowledge, no previous neuroimaging studies have investigated the effects of HFD feeding. Volumetric analyses in a previous study that used structural MRI demonstrated a reduction in brain volume with HFD intake in both 3×TG-AD and WT mice [50]. With regard to white matter changes, histological evaluation has been conducted only for the hypothalamus [51] and spinal cord [52], and the results indicate disruption of myelin in response to chronic HFD intake in WT mice with the C57BL/6 background. In humans, changes in white matter integrity in relation to obesity have been demonstrated via DTI [53, 54]. We observed such changes with increasing tract disruption in P301S mice but not in WT mice although the susceptibility of the brain to HFD was more profound in WT mice. These observations suggest that a brain environment with persistently abundant tau accumulation and aggregation in the neurons renders the white matter tracts more vulnerable to chronic HFD feeding in P301S mice in contrast to WT littermates. The current study did not provide a definitive explanation for the mechanism or significance of these changes. Considering that one of the mechanisms through which tau aggregates are neurotoxic is oxidative stress [55], it is plausible that the chronic stress environment confers a preconditioning effect that makes P301S mice more resistant to the impact of HFD [56]. Further investigations to understand why P301S mice display resistance to the typical effects of HFD, as seen in WT mice, would be particularlyintriguing.
WT mice fed the HFD showed decreased levels of IRβ and its downstream substrate in this study, considered to indicate insulin resistance in the brain [57]. However, noticeable and sustained changes in diet-specific glucose levels in the blood were not observed. Since we exclusively measured fasting glucose levels and did not conduct glucose and insulin tolerance tests, which provide precise information about systemic glucose intolerance and insulin resistance, the possibility that altered glucose homeostasis at the systemic level cannot be fully excluded in HFD-fed mice. Furthermore, aside from their role in regulating peripheral metabolism, the insulin signaling pathways play physiological roles in the brain, including synaptic plasticity, neuronal survival, and microglial function [58, 59]. Therefore, it is possible that the observed changes in the neuronal marker, CD68, microglial phagocytic activity, and MBP in the cortex may have been at least partly due to the impairment of insulin signaling. It is noteworthy that the decreased NeuN expression in WT-HFD mice did not coincide with alterations in synaptic markers. While we successfully identified two synaptic proteins in the total lysates of the cortex and hippocampus and found no group-specific changes, conducting a more in-depth analysis within the synaptosome fraction could offer additional insights into HFD-specific synaptic modifications. Interestingly, the hippocampus showed marked increases in murine pTau S202/T205 levels in the less-soluble fraction of WT-HFD mice up to the same level as in P301S mice. Increased tau phosphorylation at these epitopes is frequently observed within the aggregated tau proteins that mainly constitute the neurofibrillary tangles, a pathological hallmark of AD [60]. We speculated that the increased pTau in the less-soluble fraction of WT mice may be involved in the hippocampus-related brain dysfunction in WT-HFD mice. Changes in functional connectivity centered on the retrosplenial cortical network and diminished object recognition memory were identified in these mice, both of which are related to the hippocampus [31, 61]. Our findings regarding the selective vulnerability of the hippocampus to HFD-related tau pathology in WT mice are important as pTau is frequently accumulated in the hippocampus in aged individuals, defined as primary age-related tauopathy[62].
Conclusion
This study provides novel insights into the interaction between HFD and tau pathology in terms of changes in brain function and structure. Significantly decreased white matter integrity in the cingulum was observed in P301S mice fed the HFD. In contrast, WT mice showed marked changes in functional connectivity, recognition memory, and protein expression of insulin signaling molecules and various brain cell markers in the cortex and hippocampus in relation to HFD intake. Decreases in soluble pTau and increases in aggregable pTau were prominent in the hippocampus. Our observations suggest that chronic tau pathology blunts the impact of HFD-induced obesity in the gray matter and increases its effects in the white matter tracts. Our findings underscore the necessity for a tailored approach in managing obesity-linked risks. This tailored strategy may prioritize the management of white matter changes in AD patients with high tau pathology burden, while implementing a comprehensive approach for healthy individuals. Within this framework, rs-fMRI and DTI can be valuable imaging biomarkers for assessing the impact of a HFD and monitoring the response to treatment.
Footnotes
ACKNOWLEDGMENTS
We thank Dr. Geun Ho Im for setting the parameter of fMRI and DTI studies and Mr. Chanhee Lee for maintaining the MR instruments. MC1 antibody was provided by the laboratory of the late Dr. Peter Davies at the Litwin-Zucker Research Center at the Feinstein Institutes for Medical Research through an agreement with Albert Einstein College of Medicine.
FUNDING
This work was supported by the Basic Science Research Program (2019R1A5A2026045, 2022R1A2C1092672) and the Original Technology Research Program for Brain Science (2018M3C7A1056293) of the National Research Foundation of Korea (NRF) funded by the Korean government, MSIT. The 9.4T MRI facility was funded by the Institute for Basic Science (IBS-R015-D1).
CONFLICT OF INTEREST
The authors have no conflict of interest to report.
DATA AVAILABILITY
The data for this work is available upon direct request to the corresponding author.