
Abstract
Background:
Although the concordance between cerebrospinal fluid (CSF) Alzheimer’s disease (AD) biomarkers and amyloid-PET findings is well known, there are no data regarding the concordance of amyloid-PET with inconclusive CSF values of amyloid-β (Aβ)1 - 42 and p-tau for the diagnosis of AD.
Objective:
To investigate the relationship between the amyloid-PET results with discordant AD biomarkers values in CSF (Aβ1 - 42+/p-tau–or Aβ1 - 42–/p-tau+).
Methods:
An observational retrospective study, including 62 patients with mild cognitive impairment (32/62) or dementia (30/62), suspicious of AD who had undergone a lumbar puncture to determine CSF AD biomarkers, and presented discordant values in CSF between Aβ1 - 42 and p-tau (Aβ1 - 42+/p-tau–or Aβ1 - 42–/p-tau+). All of them, underwent an amyloid-PET with 18F-Florbetaben. An extensive neuropsychological testing as part of their diagnostic process (MMSE and TMA-93), was performed, and it was also obtained the Global Deterioration Scale.
Results:
Comparing the discordant CSF results of each patient with the cerebral amyloid-PET results, we found that in the group with Aβ1 - 42+ and p-tau–CSF values, the amyloid-PET was positive in 51.2% and negative in 48.8% of patients, while in the group with Aβ1 - 42–and p-Tau+ CSF values, the amyloid-PET was positive in 52.6% of patients and negative in 47.4% of them. No significant association was found (p = 0.951) between the results of amyloid-PET and the two divergent groups in CSF.
Conclusions:
No significant relationship was observed between the results of discordant AD biomarkers in CSF and the result of amyloid-PET. No trend in amyloid-PET results was observed in relation to CSF biomarker values.
INTRODUCTION
The pathophysiological process of Alzheimer's disease (AD) is defined by an abnormal processing of the amyloid-β protein precursor, leading to the formation of amyloidogenic amyloid-β (Aβ) peptides that aggregate into neuritic plaques due to excess production or reduced clearance of Aβ [1]. Toxic effects of Aβ oligomers induce a pathological cascade characterized by abnormal tau aggregation in the cerebral cortex leading to a neurodegenerative process involving synaptic dysfunction, glial activation, neuronal loss, atrophy, and ultimately causing a cognitive decline [2].
Currently, the categorization of subjects affected by AD is based on biomarkers evidence of the pathology through the AT(N) classification (amyloid, fibrillary tau and neurodegeneration), measured in imaging (PET and MRI) and cerebrospinal fluid (CSF) biomarkers [3]. CSF t-tau (total tau) and p-tau (tau phosphorylated at threonine 181), together with CSF Aβ1 - 42, are considered core biomarkers to support AD diagnosis [4]. The combination of CSF Aβ1 - 42 and tau, in particular, p-tau, has also shown specificity for differentiating AD from other cognitive impairment processes [5, 6]. In fact, the dual criterion of brain increases in p-tau proteins (high-rise p-tau in CSF or presence of tau accumulation in tau-PET), combined with the presence of an amyloid burden in the brain (low-level Aβ1 - 42 in CSF or presence of Aβ in amyloid-PET), was recently proposed by the National Institute on Aging and Alzheimer’s Association (NIA-AA) for the definition of AD [7].
In our clinical practice, physicians and more often neurologists, increasingly rely on AD biomarkers (CSF and amyloid-PET), which are currently employed in clinical studies to observe in vivo Aβ pathology, since the presence of cerebral amyloidosis increases the likelihood of developing AD [8, 9].
While it has been suggested that measuring the Aβ1 - 42/Aβ1 - 40 ratio in CSF may provide a more precise diagnostic tool for AD compared to assessing Aβ1 - 42 alone [10], it is important to acknowledge that, presently, its utilization is not widespread. This limited use can be attributed to various factors, including economic considerations and the availability of testing, as not all manufacturers offer this specific assay. Currently, the most commonly employed CSF biomarkers for AD diagnosis include Aβ1 - 42, p-tau, and t-tau values.
It is important to highlight the advantages and disadvantages of these procedures for use in routine clinical practice. On the one hand, the main disadvantages of CSF lumbar punctures are the contraindication in patients with anti-coagulant therapy and spine defects, post-lumbar puncture headache, heterogeneity of measurements between laboratories, as well as the fact that is an invasive procedure [11–13]. However, CSF is relatively cheap and CSF Aβ1 - 42 levels correlate inversely with brain amyloid plaque burden and informs about brain tauopathy (p-tau and t-tau). On the other hand, regarding amyloid-PET, the main disadvantage is the availability of the resources and technologies necessary for its use. Nevertheless, amyloid-PET provides a direct information on brain amyloid burden, due to its affinity for fibrillar Aβ isoforms, as well as anatomical information of deposition patterns that can provide indirect data of the disease stage. 18F-amyloid radiotracers detect brain amyloid burden with a sensitivity of 96–98% and up to 100% specificity [14, 15]. Moreover, it is important to highlight that imaging biomarkers are a noninvasive tool, and adverse events are very infrequent [16]. Although the concordance between CSF AD biomarkers and amyloid-PET positivity is well known (more than 90%) [17–21], we have no data related to the concordance of amyloid-PET with inconclusive CSF values for the diagnosis of AD, in relation to Aβ1 - 42 andp-tau.
The aim of this study is to assess the relationship between the results of amyloid-PET with CSF AD biomarkers values when these are discordant (Aβ1 - 42+/p-tau–or Aβ1 - 42–/p-tau+), in order to assess whether there is a tendency to avoid performing an amyloid-PET in these cases, as well as their relationship with the degree of severity of impairment based on the Mini-Mental State Examination (MMSE) scale, the Global Deterioration Scale of Reisberg (GDS), and the Memory Associative Test of the district of Seine-Saint-Denis (TMA-93).
MATERIAL AND METHODS
Subjects
Our tertiary hospital serves a total population of 937,760 inhabitants in Neurology consultations, and specifically at the outpatient Memory Clinic, approximately 500 new patients and 1,500 check-ups are treated each year.
This is a single-center observational retrospective study. We included 62 patients who attended the outpatient Memory Clinic with MCI or dementia, suspicious of AD who had undergone a lumbar puncture to determine CSF AD biomarkers, and presented discordant CSF values between Aβ42 and p-tau (Aβ1 - 42+/p-tau–or Aβ1 - 42–/p-tau+). All of them, underwent an amyloid-PET scan with18F-Florbetaben (Neuraceq®) between July 2020 and January 2023.
The Research Ethics Committee of the Virgen del Rocio and Virgen Macarena University Hospitals approved this study. All procedures performed in studies involving human participants were in accordance with the ethical standards of the institutional and/or national research committee and with the 1975 Helsinki Declaration and its later amendments or comparable ethical standards. Informed consent was obtained from all individual participants included in the study.
CSF collection and biomarkers measurement
CSF samples were collected from all patients after signing informed consent and were always obtained by lumbar puncture performed in the L3/L4 or L4/L5 intervertebral region as part of the diagnostic procedure for AD using CSF biomarkers. After extraction, the CSF were manipulated according to the kit manufacturer’s instructions. The analysis method used was Lumipulse® G β-Amyloid 1–42, Lumipulse® G pTau 181 and Lumipulse® G Total Tau (Fujirebio). The cutoff values used for each biomarker were those proposed by Sjögren et al. [22], modified for adaptation to our center: Aβ1 - 42 (<599 pg/ml), p-tau (>55.9 pg/ml), and t-tau (>404 pg/ml). Cutoff values with a margin of 5% were also taken hypothetically, in order to explore potential associations in patients with discordant results and values close to the cutoff.
Amyloid-PET images
All PET scans were recorded after the intravenous injection of 18F-Florbetaben (FBB) (Neuraceq®), administering a standard dose of 296 MBq (+/–10%) to all patients. PET scans were performed on two different scanners: Biograph mCT 64 (Siemens Healthineers, Germany) and Discovery MI 5R digital PET/CT (General Electric Healthcare, US). Emission acquisition time were 20 and 15 minutes respectively, starting 90 min from radiopharmaceutical injection. PET images were reconstructed with a TrueX TOF iterative algorithm with 4 iterations and 21 subsets (Biograph mCT 64) and a Bayesian penalized-likelihood Q.Clear® reconstruction algorithm (Discovery MI), both corrected for attenuation and diffusion.
Scans were evaluated both qualitatively and semi-quantitatively.
Qualitative analysis
Amyloid-PET scans were classified as positive or negative based on the visual reading of three expert nuclear medicine physicians. It was considered positive if the visual reading showed: Moderate or small area(s) of radiotracer uptake equal to or higher than that presented in the white matter: extending beyond the white matter rim to the outer cortical margin involving most of the slices within the respective region, or pronounced Aβ deposition (a large confluent area of tracer uptake equal to or higher than that presented in white matter extending beyond the white matter rim to the outer cortical margin and involving the entire region including most of slices within the respective region) in the grey matter of the following four brain regions: the temporal lobes, the frontal lobes, the posterior cingulate cortex/precuneus, and the parietal lobes [23, 24]. The three readers shared their results. If the three readers reached different conclusions, they reached a consensus for each case.
Semi-quantitative analysis
Each subject’s amyloid-PET image was spatially normalized to a total-FBB template and smoothed by the validated “robust PET-only Processing” (rPOP) method developed by Iaccarino et al. [25] using Statistical Parametric Mapping software 12 (SPM, http://www.fil.ion/uc.ac.uk/spm) running on MATLAB (MathWorks 2020b) and Analysis of Functional Neuroimages (AFNI, https://afni.nimh.nih.gov/). Then it was quantified neocortical standardized uptake value ratios (SUVr) using the reference regions-of-interest (ROIs) established by the standard Global Alzheimer’s Association Interactive Network (GAAIN, http://www.gaain.org/centiloid-project): the Global Cortical Target Region Subject Set (CTX)/Whole cerebellum (WC), using the FMRIB Software Library v6.0 (FSL) statistics tools. Finally, we convert the SUVr to the Centiloid Scale (CL), applying the formula specifically applicable to FBB developed by Rowe et al. [26] but adapted to the rPOP processing method. It was defined as positive when the SUVr was greater or equal to 1.27 (CL = 35) [15, 26–28].
Neuropsychological test and GDS
Patients underwent extensive neuropsychological testing as part of their diagnostic process. We used the widely known MMSE total scores to measure global cognition [29], and the recently developed TMA-93 to assess memory.
TMA-93 is a neuropsychological test that examines visual binding, learning 10 pairs of semantically related images of common real-life objects. The test is original from Maillet et al. [30], who have authorized its use in Spain exclusively for health activities. In Spain, the test has been developed by the Memory Clinic of our hospital, having demonstrated very good precision in discriminating amnestic MCI from controls without cognitive impairment [31]. Our colleagues also developed a normative study in our population, from which it is known what scores mark the 10th percentiles according to age range and educational level [32]. More recently, the test has been validated with specific AD biomarkers, demonstrating that it improves discrimination and prediction of biomarkers outcomes compared to the gold standard FCSRT+IR [33].
In addition, we obtained the GDS to have an overview of the stages of cognitive function [34]. The results of these parameters were compared with amyloid-PET and CSF AD biomarkers independently.
Statistical analyses
Categorical variables were summarized by frequency and percentage and analyzed by use of χ2 test or Fisher’s exact test. Continuous variables were summarized with mean and SD or median and interquartile range (IQR). For quantitative variables, the normal distribution was assessed with Saphiro-Wilk test. Student’s T-test and its non-parametric alternative Mann-Whitney U test were used to explore the mean differences between groups. For the different statistical tests, 95% confidence intervals were calculated for quantitative variables, and the Odds Ratio [95% CI] for qualitative variables. Significant differences were determined to exist when p < 0.05. Moreover, we performed an inter-observer agreement between three readers through Kappa Fleiss to evaluate amyloid-PET images.
Statistical analysis was calculated by the software IBM SPSS® Statistics version 24. Furthermore, we performed voxel-wise PET image analysis to assess whether there are significant differences in amyloid burden between the two different subgroups of discordant AD biomarkers in CSF (Aβ1 - 42+/p-tau–and Aβ1 - 42–/p-tau+). Statistic maps were thresholded by p < 0.05 with cluster size >20.
RESULTS
Characteristics of patients
Patient characteristics in the overall population and according to CSF results are detailed in Table 1. Of the 62 patients in the study, 33 (53.2%) were male and the median age was 70 years (IQR 13). The major patient group belonged to the subgroup aged over 71 years (48.4%).
Patient characteristics in the overall population and according to CSF results
*Chi-square test. ‡Chi-square test for linear trend. †U-Mann Whitney test. Categorical variables were expressed with frequency and percentage. Continuous variables were expressed with median (IQR) and range (minimum - maximum). Differences in quantitative variables were assessed with mean differences [95% CI] and qualitative variables with Odds Ratio [95% CI]. GDS, Global Deterioration Scale; MMSE, Mini-Mental State Examination; TMA-93, Memory Associative Test of the District of Seine-Saint-Denis; MCI, mild cognitive impairment; AD, Alzheimer’s disease.
According to the GDS, none of the patients was classified with a score of 1 (no cognitive impairment) or 7 (severe dementia), and the most frequent score was GDS 3 (mild cognitive impairment, MCI) with 53.2%. In the Memory Clinic the MMSE and TMA-93 were also administered to all patients, with a median of 25 (IQR 5) and 20 (IQR 13) respectively.
Clinical status was MCI in 32/62 patients (51.6%), and dementia in 30/62 (48.4%).
When comparing the general characteristics between both discordant groups, we only found statistically significant differences in the MMSE scale score, being lower in those with Aβ1 - 42+/p-tau–compared to patients with Aβ1 - 42–/p-tau+ (p = 0.037; U-Mann Whitney test).
Subsequently, a subgroup analysis was performed according to the amyloid-PET result in each discordant group (Table 2), where it was observed that PET-negative patients were significantly younger than PET-positive patients in both discordance groups (p = 0.035; Kruskal Wallis test). No differences were found in the rest of the variables analyzed.
Patient characteristics according to CSF and PET results
†Bonferroni: Aβ1 - 42+/p-tau–/PET+versus Aβ1 - 42+/p-tau–/PET–(p = 0.048). ‡Chi-square test for linear trend. *Kruskal-Wallis test. Categorical variables were expressed with frequency and percentage. Continuous variables were expressed with median (IQR).
In the time interval of the study, 595 lumbar punctures were performed in the Memory Clinic. Thus, the 63/595 that presented discordant results represented 10.6% of total lumbar punctures. The time between lumbar puncture and amyloid-PET was a median of 60 days [IQR = 7].
AT(N) classification
According to the AT(N) continuum of NIA-AA Research Framework, all patients were classified according to CSF AD biomarkers: Aβ1 - 42 (A), p-tau (T), t-tau (N). Detailed classification is shown in Table 3.
Classification of patients according to the NIA-AA Research Framework
‡Chi-square test for linear trend. Classification of patients according to the AT(N) criteria based on CSF AD biomarkers (Aβ1 - 42, p-tau, and t-tau) and its correlation with amyloid-PET (positive or negative).
Most of the patients were classified as A+T–(N–), being 39/62 (63%), of which 22/39 (56.4%) were amyloid-PET positive and 17/39 (43.6%) amyloid-PET negative.
On the other hand, the group of patients classified as A–T+(N+) was the second largest including 15/62 (24.2%) of which 8/15 (53.3%) were amyloid-PET positive and 7/15 (46.7%) were amyloid-PET negative. No significant association was found between the results of amyloid-PET (positive/ negative) and the different A+T–(N) and A–T+(N) classification (p = 0.437; Chi-square test for linear trend).
Image analysis
A qualitative (visual) and semi-quantitative analysis of the PET images were performed. To determine if amyloid-PET scans were normal or abnormal, only the semi-quantitative result was taken into account.
A standard visual analysis procedure of PET images by three readers was performed, which provided a classification of amyloid negative or positive. The inter-observer agreement was analyzed and a kappa value of 0.89 was obtained, which represents an almost perfect agreement (95% CI: 0.7 to 1).
Visually, a total of 29/62 patients (46.8%) were considered amyloid-positive and 33/62 patients (53.2%) had a negative result.
In addition, SUVr and CL were calculated for each amyloid-PET. Based on the semi-quantitative data, a total of 32/62 PET scans (51.6%) presented a SUVr ≥1.27 (CL ≥35) and were considered amyloid-positive, and 30/62 (48.4) presented a SUVr <1.27 (CL <35) being considered amyloid-negative. A total of 3/62 PET scans that were visually considered as amyloid-negative PET, were reclassified as amyloid-positive PET (≈5%) after semi-quantitative analysis.
Of the 62 patients, the median SUVr was 1.3 (IQR 0.5) and the median CL score was 41 (IQR 79). In patients with positive amyloid-PET the median SUVr was 1.6 (IQR 0.2) and the median CL result was 85 (IQR 32), compared with patients with negative amyloid-PET, where the median SUVr was 1.1 (IQR 0.1) and the median CL result was 4 (IQR 18) (p < 0.001).
We analyzed the possible association between amyloid PET results (SUVr and CL) and the CSF biomarkers status. In patients with Aβ1 - 42+/p-tau–the median SUVr was 1.4 (IQR 0.3) and the median CL result was 49 (IQR 51). In patients with Aβ1 - 42-/p-tau+ the median SUVr was 1.3 (IQR 0.3) and the median CL result was 40 (IQR 43). As shown in Fig. 1, no significant association was found (p = 0.63: T-test and U-Mann Whitney test) between the results of SUVr and CL in the two divergent groups in CSF (Aβ1 - 42+/p-tau–and Aβ1 - 42–/p-tau+).
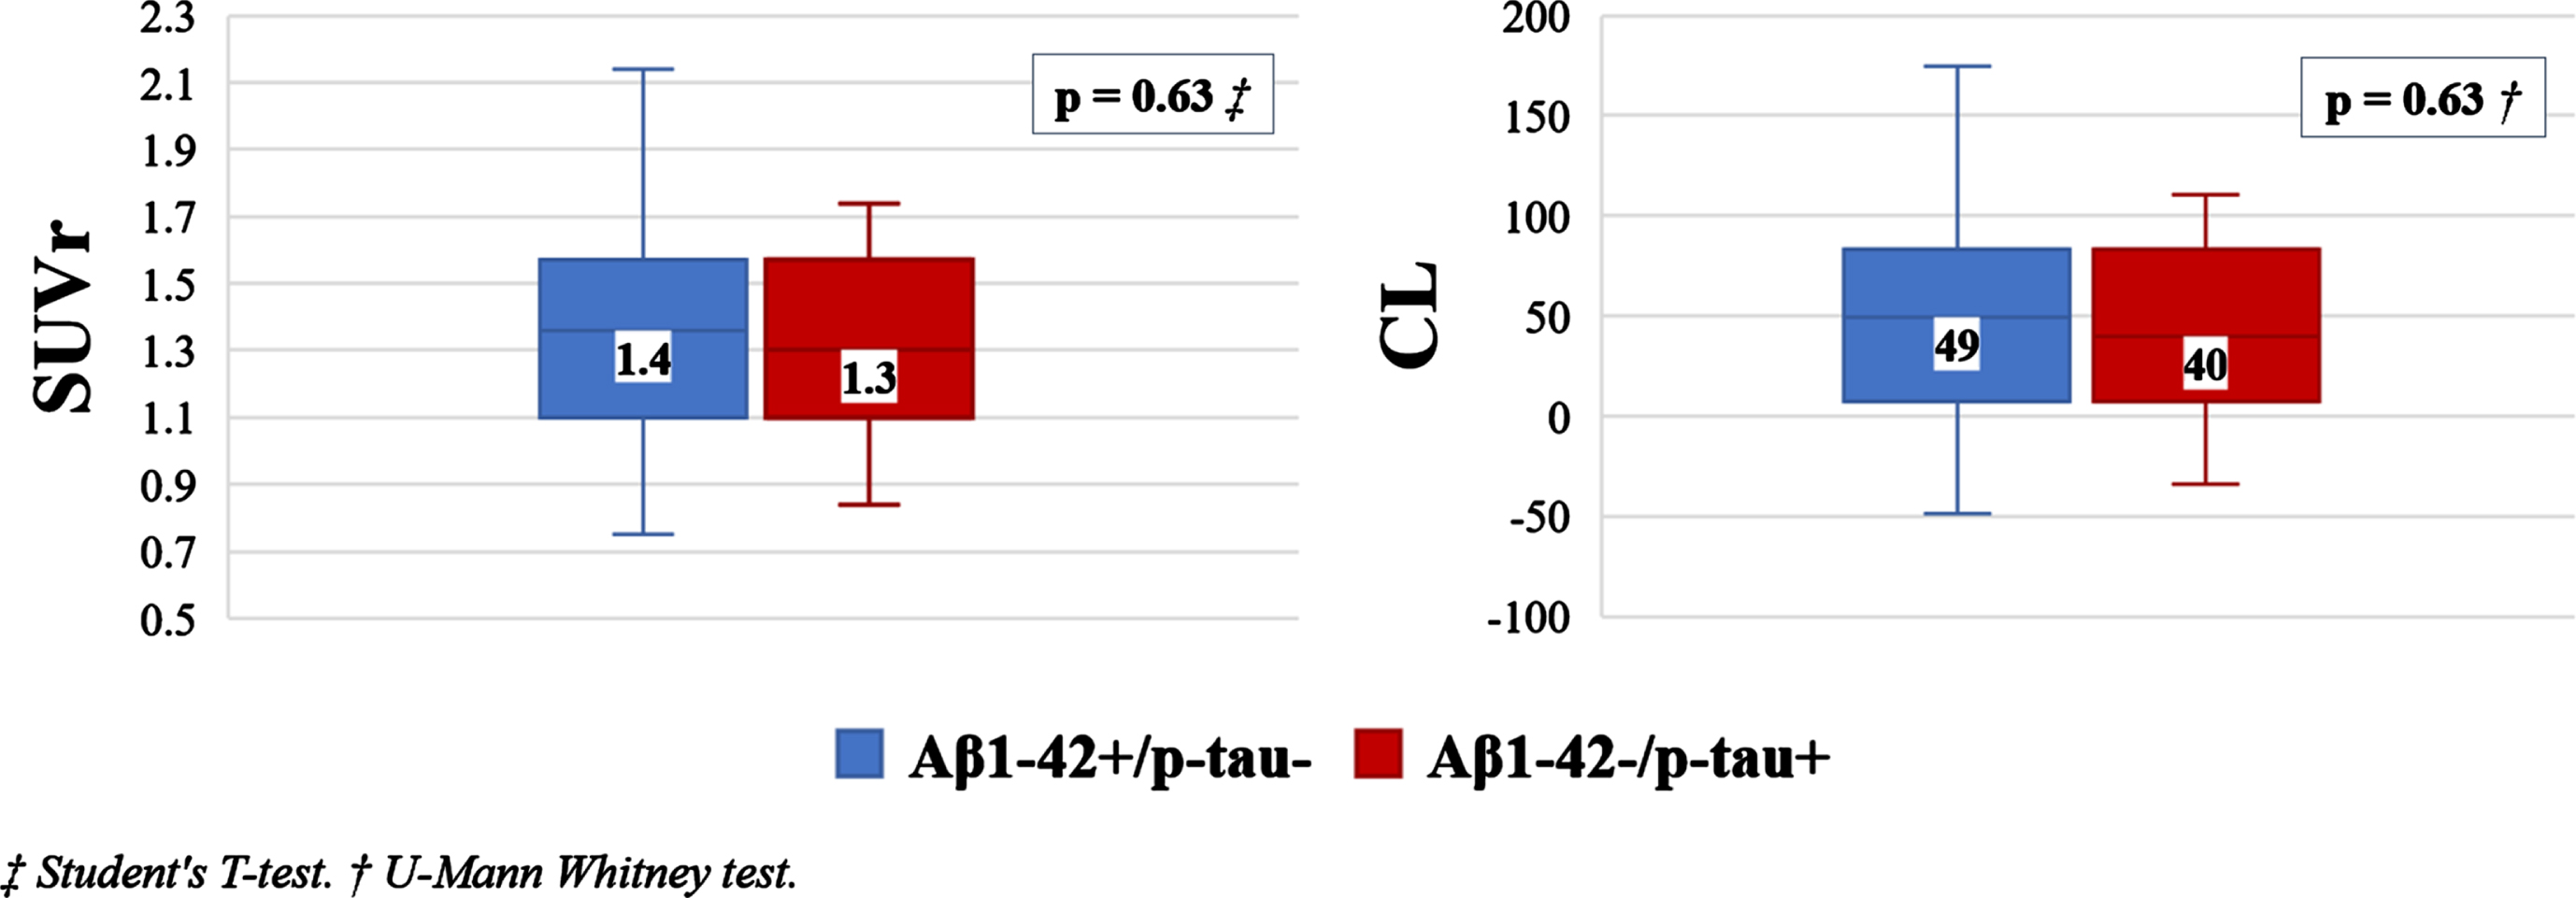
Box plot showing SUV ratio (SUVr) and Centiloid Scale (CL) values according to discordant CSF results.
In addition, a voxel-wise PET imaging analysis was performed. Amyloid-positive PET of the two discordant subgroups, and the amyloid-negative PET of these two subgroups, were compared separately. It was not found statistically significant difference (p = 0.05).
Amyloid-PET results and discordant CSF results
The amyloid-PET result was considered as the gold standard.
As shown in Fig. 2, a total of 32/62 patients (51.6%) were amyloid-positive based on PET and 30/62 patients (48.4%) had a negative result, which means absence of cerebral Aβ plaque accumulation.
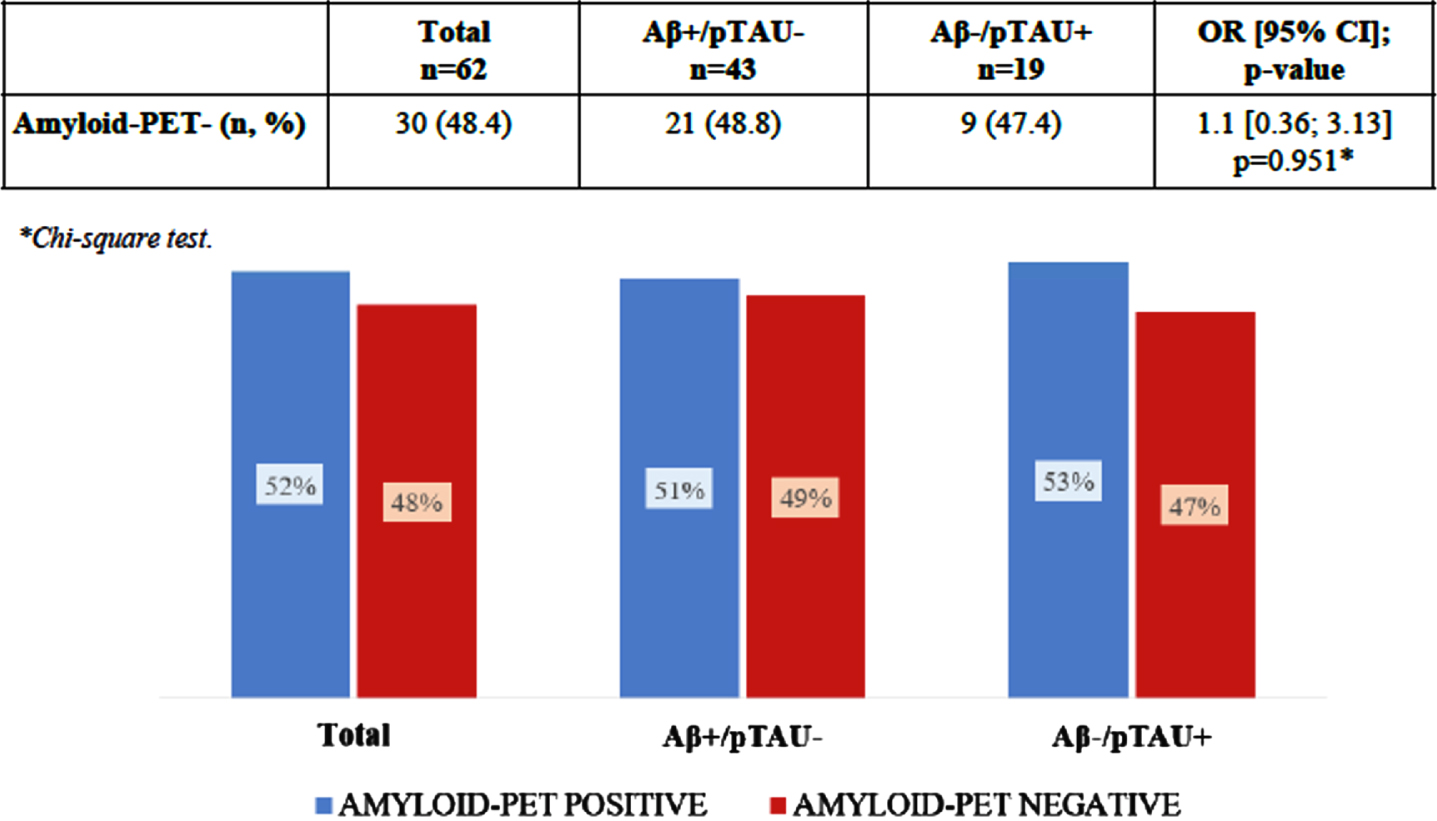
Amyloid-PET results and discordant CSF results.
CSF results were discordant in all of the 62 patients, 43 of them (69.3%) presented Aβ1 - 42+/p-tau–and the other 19 cases (30.7%) presented Aβ1 - 42–/p-tau+.
Comparing the discordant CSF results of each patient with the cerebral amyloid-PET results (positive/negative), we found that in the group with Aβ1 - 42+ and p-tau–CSF values, the amyloid-PET was positive in 22/43 (51.2%) and negative in 21/43 (48.8%) of patients, while in the group with Aβ1 - 42–and p-tau+ CSF values, the amyloid-PET was positive in 10/19 (52.6%) of patients and negative in 9/19 (47.4%) of them.
In summary, no significant association was found (p = 0.951; Chi-square test) between the results of amyloid-PET (positive/ negative) and the two divergent groups in CSF (Aβ1 - 42+/p-tau–and Aβ1 - 42-/p-tau+).
Hypothetically extending the cutoff values of CSF AD biomarkers by 5%, the status would change from discordant to concordant in 4/62 patients (6.4%), of whom 3 would belong to the Aβ1 - 42–/p-tau+ group and 1 to the Aβ1 - 42+/p-tau–group. Of these 4 patients, 3 would present a positive amyloid-PET and 1 a negative amyloid-PET (belonging to the Aβ1 - 42-/p-tau+ group).
Amyloid-PET results and clinical diagnosis
We looked for a relationship between the amyloid-PET result and the clinical diagnosis of each patient, finding that 50% (16/32) of patients with dementia were amyloid positive based on PET, compared to 50% (16/32) of MCI patients. There was also no independent association between clinical condition and amyloid-PET (p = 0.511; Chi-square test).
Neuropsychological tests and GDS scale
We analyzed the possible association between amyloid-PET results and the MMSE, TMA-93, and GDS scores. In this cohort with cognitive impairment probably due to AD and with discordant CSF biomarkers, MMSE values presented a median of 25.5 (IQR 7) for negative amyloid-PET and a median of 24.5 (IQR 5) for positive amyloid-PET. No statistically significant differences were found (p = 0.461; U-Mann Whitney test). Regarding the GDS, no statistically significant differences were found between the result of the amyloid-PET images and each of the cognitive impairment states based on the GDS (p = 0.907; Chi-square test).
Finally, the TMA-93 values presented a median of 19 (IQR 15) for positive amyloid-PET results and a median of 22 (IQR 12) for negative amyloid-PET, finding statistically significant differences (p = 0.042; U-Mann Whitney test).
On the other hand, we analyzed the possible association between neuropsychological scores and CSF biomarker status (Table 1). We found that the MMSE score was lower in those patients with Aβ1 - 42+/p-tau–compared to patients with Aβ1 - 42-/p-tau+ (p = 0.037; U-Mann Whitney test). In contrast, we found no differences in TMA-93 and GDS scores between the two groups. The MMSE and TMA-93 values according to discordant CSF results are represented in Fig. 3.
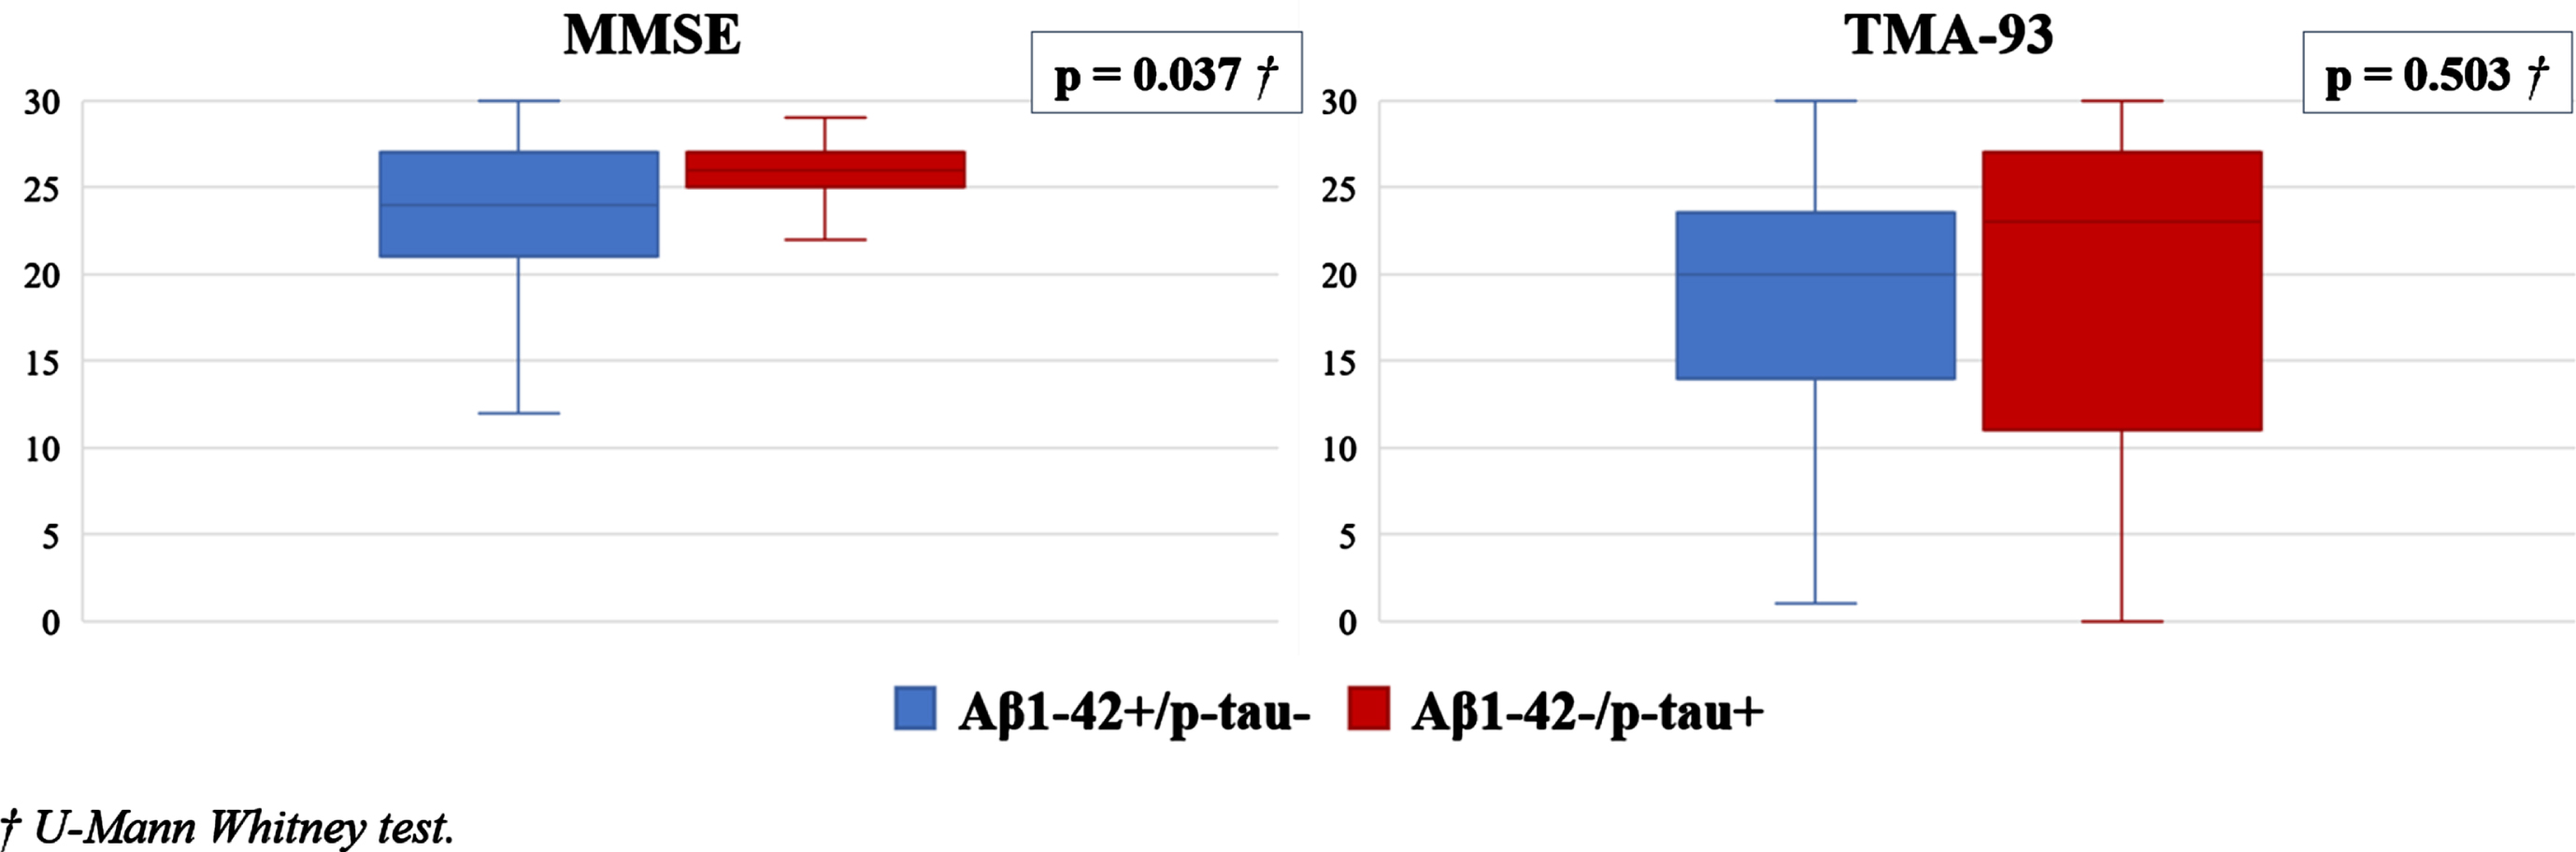
Box plot showing MMSE and TMA-93 values according to discordant CSF results.
DISCUSSION
Comparing the discordant CSF AD results of each patient with the cerebral amyloid-PET status (positive/negative), it was found that in the group with Aβ1 - 42+ and p-tau- CSF values, the amyloid-PET was positive in 51.2% and negative in 48.8% of patients, while in the group with Aβ1 - 42- and p-tau+ CSF values, the amyloid-PET was positive in 52.6% of patients and negative in 47.4% of them. Based on these data, we have not found a statistically significant relationship between amyloid-PET results and discordant values of AD biomarkers in CSF. Likewise, no trend was observed in the result of amyloid-PET in relation to CSF biomarkers, neither when Aβ1 - 42 was in the pathological range nor when it was in the normal range.
It is worth noting the significant proportion of discordant CSF AD biomarkers in this study, in relation to the total number of CSF determinations, being 63/595 (10,6%). This relevant proportion of inconclusive cases has a high clinical impact on the management of these patients, making amyloid-PET a key tool for definitive diagnosis.
Following the AT(N) classification system [7], our analysis discerned two main categories of patients: A+T–(N–) constituting 63% of the total population and A–T+(N+) comprising 24.2% of the total. Among the A+T–(N–) subgroup, 56.4% had positive amyloid-PET, while 43.6% tested negative. Importantly, we observed no statistically significant correlation between amyloid-PET results within this subgroup. Similarly, within the A–T+(N+) subgroup, 53.3% displayed positive amyloid-PET results, while 46.7% exhibited negative results. No statistically significant differences were evident either.
Shifting our focus to patients categorized as A+T–(N+), we identified only four individuals in this group, none of whom presented positive amyloid-PET scans. In contrast, within the A–T+(N–) subgroup, we encountered two patients with positive amyloid-PET scans and an additional two with negative outcomes.
When examining discordance subgroups, the presence or absence of neurodegeneration biomarkers (N) did not prove to be a determining factor in predicting the amyloid-PET results. In fact, all four patients categorized as A+T–(N+) exhibited negative amyloid-PET scans.
On the other hand, we found that patients with a lower score on the TMA-93 test were associated with a higher frequency of amyloid positive PET, although we did not find statistically significant differences between amyloid PET status and the score on the neuropsychological test MMSE and on the GDS scale. These results contradict some studies already published on the subject. For example, in 2019 Timmers et al. examined the relationships between amyloid-PET and concurrent and long-term cognitive performance in 107 patients, and their findings suggest that higher Aβ burden is associated with lower concurrent global cognition and a faster rate of decline in a variety of cognitive domains [35]. However, it is necessary to clarify that our study does not refer to the general population, but to a specific subgroup of patients with cognitive impairment probably due to AD and discordant CSF biomarkers. These results could indicate that this subgroup of patients has a different atypical behavior than other patients with cognitive impairment. However, this is preliminary work that would need to be confirmed in further studies where larger sample sizes would be necessary.
CSF biomarkers are measures of CSF protein concentrations that reflects the rates of both production and clearance at a given point in time [36, 37]. On the other hand, amyloid-PET represents the magnitude of the neuropathological burden or damage accumulated over time. Thus, low levels of CSF Aβ1 - 42 are associated with amyloid plaque formation and are considered an excellent biomarker of a pathological state but not a measure of amyloid plaque burden as is amyloid-PET. Similarly, p-tau levels in CSF are best considered a biomarker of a pathological state that is associated with p-tau formation and not a measure of pathological tau deposits as is tau-PET [7].
It should be noted that the combination of biomarkers we use in this research agree with those used in other laboratories and research studies. The combination of increased CSF p-tau with normal Aβ1 - 42 values, or decreased CSF Aβ1 - 42 with normal p-tau values are atypical patterns sometimes observed in CSF measurements. In fact, according to the series published by Reimand et al. [38], 58% (n = 42/72) of the patients in whom amyloid-PET was requested after a CSF determination, were due to obtaining discordant Aβ1 - 42 and p-tau values (23/42 Aβ1 - 42–/p-tau+ and 19/42 Aβ1 - 42+/p–Tau–). In those patients, amyloid-PET allowed to rule out AD in 38% patients, changing initial diagnosis from AD to non-AD. In our study, amyloid-PET allowed us to rule out AD in 48.4% patients with discordant CSF biomarkers of AD. Therefore, amyloid-PET should be considered in these patients with discordant AD CSF results, since it is a frequent situation in clinical practice.
So far, we have not found references about the specific statistical correlation between discordant AD biomarkers values in CSF and the result of amyloid-PET. Although in 2019, Manca et al. [39] published a cross-sectional study of 25 patients with MCI and suspected AD where they observed that when Aβ1 - 42 values were still in a very high range (<843 pg/ml), despite presenting high p-tau values, they most frequently had a negative amyloid-PET (93%).
It is worth noting the high number of patients who presented negative Aβ1 - 42 values and negative amyloid-PET but with positive p-tau values, which constituted 14.5% of the total number of patients in our sample (9/62). This subgroup would fit with the recently described tau-first subtype of AD by Aksman et al. [40] In this research, they performed two separate analyses using cross-sectional data from the Alzheimer’s Disease Neuroimaging Initiative. The first analysis was a tau-PET based analysis, which used several regional SUVRs from amyloid-PET (AV-45) and Tau PET (AV-1451) from 402 subjects with both scans at the same visit. The second analysis was a tau-CSF based analysis, with a total dataset of 996 subjects. They found two PET-based subtypes in the tau-PET based analysis: an amyloid-first subtype in the 83% of subjects, and a tau-first subtype in a 16% of subjects. The tau-CSF based analysis confirms these subtypes presenting and amyloid-first subtype in the 83% of subjects, and a tau-first subtype in the 17% of subjects. These results are consistent with ours.
Hypothetically adjusting the cutoff values of CSF AD biomarkers by 5%, we observed a change in the status of four patients from discordant to concordant. Specifically, three of these individuals would now fall into the Aβ1 - 42–/p-tau+ group, and one would belong to the Aβ1 - 42+/p-tau–group.
Among the three patients transitioning from the Aβ1 - 42–/p-tau+ subgroup to the Aβ1 - 42+/p-tau+ subgroup, all showed positive amyloid-PET scans. This alteration could suggest the possibility of a tau-first subtype of AD [40], potentially involving seroconversion.
In contrast, the patient initially classified in the Aβ1 - 42–/p-tau+ subgroup, who would switch to the Aβ1 - 42+/p-tau+ subgroup and exhibit a negative amyloid-PET result, may be indicative of a non-AD neurodegenerative condition, such as frontotemporal lobar degeneration (FTLD). Notably, this patient presented a decreased p-tau/t-tau ratio, a marker known to distinguish FTLD-TDP from FTLD-Tau, AD, and healthy elderly with a significant sensitivity and specificity [41].
There are other AD biomarkers in CSF, different from those analyzed in this research, that are also valid although perhaps less frequently studied, such as the Aβ1 - 42/Aβ1 - 40 ratio [10, 42]. According to the research of Janelidze et al. [43] in patients with subjective cognitive decline and MCI, the CSF Aβ1 - 42/Aβ1 - 40 ratio was a significantly better predictors of abnormal amyloid-PET than CSF Aβ1 - 42 alone. It can be expected that the Aβ1 - 42/Aβ1 - 40 ratio may decrease the number of discordance with amyloid-PET, but few departments currently use it routinely, either for economic reasons or due to lack of availability.
The possible limitation of this study is the restriction to a single site center and cross-sectional nature, which makes it difficult to generalize our results.
Another potential limitation of our study is the age distribution of the patients. It is well-established that the accumulation of Aβ increases with age. Postmortem histological investigations have revealed substantial amyloid deposits in 25–45% of individuals older than 75 years, even in the absence of cognitive impairment [44]. In our study, a substantial proportion of participants (48.4%) were aged 71 years or older, which could potentially lead to false-positive results in certain cases.
In addition, some unexpected results derive from the fact that this is not a systematic study but taken from a heterogeneous sample of patients treated in a Memory Clinic of a tertiary hospital for very diverse clinical conditions, which include diverse cognitive disorders and younger cases, in whom FTLD is a very common pathology. However, that reflects the routine clinical practice, in which a great wide of patients are attended.
Conclusions
Based on the data obtained, no significant relationship was observed between the results of discordant AD biomarkers in CSF and the result of amyloid-PET, there being no trend in relation to CSF biomarkers values. The present study hence provides additional evidence that amyloid PET imaging constitutes a useful diagnostic tool, particularly in cases where there are discrepancies in CSF AD biomarker values.
Footnotes
ACKNOWLEDGMENTS
The authors have no acknowledgments to report.
FUNDING
The authors declare that no funds, grants, or other support were received during the preparation of this manuscript.
CONFLICT OF INTEREST
Emilio Franco-Macías is an Associate Editor of this journal but was not involved in the peer-review process nor had access to any information regarding its peer-review.
The remaining authors declare that they have no conflict of interest to report.
DATA AVAILABILITY
The datasets generated and/or analyzed during the current study are available from the corresponding author on reasonable request.