
Abstract
Background:
Brain volume is associated with cognitive decline in later life, and cortical brain atrophy exceeding the normal range is related to inferior cognitive and behavioral outcomes in later life.
Objective:
To investigate the likelihood of cognitive decline, mild cognitive impairment (MCI), or dementia, when regional atrophy is present in participants’ magnetic resonance imaging (MRI).
Methods:
Multi-center MRI data of 2,545 adults were utilized to measure regional volumes using NEUROPHET AQUA. Four lobes (frontal, parietal, temporal, and occipital), four Alzheimer’s disease-related regions (entorhinal, fusiform, inferior temporal, and middle temporal area), and the hippocampus in the left and right hemispheres were measured and analyzed. The presence of regional atrophy from brain MRI was defined as ≤1.5 standard deviation (SD) compared to the age- and sex-matched cognitively normal population. The risk ratio for cognitive decline was investigated for participants with regional atrophy in contrast to those without regional atrophy.
Results:
The risk ratio for cognitive decline was significantly higher when hippocampal atrophy was present (MCI, 1.84, p < 0.001; dementia, 4.17, p < 0.001). Additionally, participants with joint atrophy in multiple regions showed a higher risk ratio for dementia, e.g., 9.6 risk ratio (95% confidence interval, 8.0–11.5), with atrophy identified in the frontal, temporal, and hippocampal gray matter, than those without atrophy.
Conclusions:
Our study showed that individuals with multiple regional atrophy (either lobar or AD-specific regions) have a higher likelihood of developing dementia compared to the age- and sex-matched population without atrophy. Thus, further consideration is needed when assessing MRI findings.
INTRODUCTION
Alzheimer’s disease (AD) is the most common form of dementia. Magnetic resonance imaging (MRI) of the brain has provided crucial biomarkers for cognitive impairment and dementia, including AD. Previous epidemiologic studies have demonstrated strong associations between individual brain size, cognitive impairments, and dementia [1–5] after adjusting for head size, age, and sex. In comparison to the analogous cohort, the presence of larger brain volumes has been associated with additional health benefits during aging [1]. In contrast, reduced brain volume is linked to an increased risk of future dementia [2]. Total brain size and regional brain volume, e.g., frontal and/or hippocampal area, were also reported to be associated with cognitive ability and future dementia [3, 4]. Several studies support the idea that pathological neurodegeneration, including brain tissue atrophy or ventricle enlargement, precedes cognitive decline [6, 7]. Various structural change patterns have been shown to be related to the clinical diagnosis of dementia, which led to the development of imaging-based biomarkers of dementia based on MR measurements. Currently, there is no cure for dementia; however, identification of easily detectable diverse patterns with cognitive decline and understanding of the underlying pathological process holds great clinical value in administering early clinical interventions and/or treatments to prevent further neurodegeneration [8, 9]. The lobar brain and AD-specific ROIs are well-known in the field and relatively easier to identify than other smaller and/or subparts of structures, e.g., hippocampal subfield. The study of those ROIs using MRI will advance the understanding of the cognitive decline associated with atrophy patterns in later life.
The measurement of brain volume through MRI has provided important insights in the field. Previous studies have suggested that patients with brain shrinkage also have poorer cognition and suffer more often from dementia than those without brain shrinkage [5]. Another study demonstrated that AD-related structural changes can be identified prior to the occurrence of cognitive symptoms [10]. Structural brain MRI volume has been successfully used in distinguishing converters from non-converters and individuals with mild cognitive impairment (MCI) from cognitively normal participants [11–17]. Lower regional volume, including the medial temporal lobe, insula, hippocampus, and amygdala, is a risk factor for dementia [18].
It is essential to investigate the atrophy at global level, including lobar and AD specific regions to distinguish cognitive normal, MCI, and dementia group. Measuring lobar volume from MRI is important for understanding the spatial distribution of brain atrophy [19], diagnosing and differentiating types of dementia [20, 21], monitoring treatment effects [22], advancing research, and providing valuable insights into the underlying mechanisms of the disease.
There remains a need to investigate brain volume in a large East-Asian population, as this has not been adequately addressed in many major studies. This study examined the correlation between various regional brain volumes and the presence of cognitive decline (MCI or dementia) at the time of scanning. To our knowledge, this is one of the first studies to assess the likelihood of dementia using a large cross-sectional East Asian population. Some studies have examined the association between grey matter (GM) shrinkage in multiple areas and the risk of cognitive decline in adults [10–17]. Recent studies suggest that various brain atrophic patterns lead to cognitive decline [23]. To better understand brain differences related to MCI or dementia, multiple atrophy patterns must be considered. We aimed to identify the atrophy patterns of regional GM in which independent or concurrent brain shrinkage is associated with the prevalence of cognitive decline using brain MRI data in multi-center studies. Specifically, this study aimed to investigate the likelihood of a cognitive decline in relation to regional GM atrophy patterns in nine regions, including four lobes, four AD-related brain regions, and the hippocampus. AD-related brain regions were incorporated due to the preponderance of AD as the prevailing type of dementia. We further expanded the investigation of the likelihood of cognitive decline to include patients with mild cognitive impairment and dementia.
MATERIALS AND METHODS
Study design and participants
Data from six multi-center studies involving MRI scans of 2,545 individuals were used, comprising cognitive normal (CN) controls (n = 1,246), mild cognitive impairment (MCI) (n = 971), and dementia (n = 336) groups (Table 1). The distribution of participants per site is provided in the Supplementary Table 1. Our MCI and dementia groups were based on the clinical dementia rating scales, where MCI had a clinical dementia rating of 0.5, and dementia had a clinical dementia rating of 1 or higher (shown in Table 2). Expert psychiatrists and radiologists in the study team adjudicated every case of dementia and MCI. Among participants under 55 years of age, seven were diagnosed with MCI. Additionally, healthy younger participants who visited the center and were diagnosed with no other neuropsychiatric disease were included to account for young and cognitively normal brain features in the analysis.
Demographics across the cognitive normal (CN), mild cognitive impairments (MCI), and dementia groups
N, number of participants.
Summary scores for mini mental status examination (MMSE) scores and clinical dementia rating (CDR) scores of participants across cognitive status
This study obtained approval from the Institutional Review Board approval of the individual centers. The development dataset was approved by Wonkwang University Hospital (approval no. 2019-09-002-002), the Catholic Aging Brain Imaging (CABI) database, which holds brain MRI scans of patients enrolled at the Catholic Brain Health Center, Yeouido St. Mary’s Hospital, and Eunpyeong St. Mary’s Hospital at the Catholic University of Korea (approval no. XC20RIDI0035V, PC20EISI0007, SC20RISI0198, 2020-3348-0007), Seoul National University Hospital (approval no. D-2106-221-1233), Yonsei University Health System (approval no. 1-2021-0025), and SMG-SNU Boramae medical center (approval no. 30-2020-325).
This study was designed based on the ethical and safety guidelines provided by the Institutional Review Boards of the Catholic University of Korea and Wonkwang University, and the study protocol was approved by the same board. Written informed consent was obtained from all participants.
Diagnosis of dementia
The diagnosis of dementia and MCI were made using the revised criteria of the Diagnostic and Statistical Manual of Mental Disorders, Third Edition, and the clinical criteria reported by Petersen et al. [24], respectively. Expert psychiatrists and radiologists in the study team adjudicated every case of dementia and MCI. The study did not employ specific dementia subtyping protocols during participant recruitment. However, it carefully selected individuals without a medical history of major neuropsychiatric disorders (such as Parkinson’s disease, Huntington’s disease, progressive supranuclear palsy), brain tumor, hydrocephalus, traumatic brain injury, lacunar infarction, or major depressive disorders. In addition, AD is the most common cause of dementia in older adults (60–80%). As a result, the study’s population would predominantly consist of individuals with neurodegenerative diseases, particularly AD. Although not explicitly stated, the majority of our dementia cohort primarily comprises participants with probable AD, as per the criteria set by the National Institute of Neurological and Communicative Disorders and Stroke/Alzheimer’s Disease and Related Disorders Association.
MRI acquisition and processing
Regional volume was measured using a software protocol based on T1-weighted images from 3T MRI scanners. Three sites conducted MRI scans using SEIMENS scanner (two Skyra and one Magnetom) with MPRAGE T1 sequence, and the other three sites performed MRI scans using Philips Medical System (two Achieva and one Ingenia CX) with 3D T1 sequence. Further details are summarized in Table 3. MRI scans were obtained at seven different sites. All data were processed using Neurophet AQUA 3.0. The AQUA 3.0 pipeline for MRI processing includes resampling, zero-padding, intensity normalization, and deep-learning-based segmentation was performed as previously described [25]. The results of AQUA showed the robustness of its outcome (intraclass correlation against FreeSurfer tool >0.75) for multi-center studies in previous research [26, 27]. Following whole brain segmentation into 103 sub-regions, images were merged into five volumetric measures of grey matter volume (GMV) for frontal, parietal, cingulated, temporal, and occipital lobes, and AD Signature GMVs for medial and lateral temporal lobes, inferior parietal lobe, and insula as suggested in previous studies [19, 28–32].
Imaging parameters used in this study are summarized
RT, repetition time; ET, echo time; FA, flip angle.
Mean (mL) and standard deviation of the grey matter (GM) volumes for men and women
CN, cognitive normal; MCI, mild cognitive impairment; D, dementia; LH, left hemisphere; RH, right hemisphere; Significant association of regional volume to the age (A), gender (G), dementia (D), or MCI (M) were marked with A,G,D,M, respectively, at the significant level of 0.001 when each regional volume was linearly fitted with age, sex, and cognitive status.
Statistical analysis
All analyses were performed using R statistical software (version 4.1.2). To show that our multi-center data conformed with the expected decrease in GMV with cognitive decline, we used a simple analysis of variance (ANOVA) test to show differences in regional GMV across cognitive normal, MCI, and dementia. The atrophy level of each regional GMV was determined using the z-score. Sex-stratified mean and standard deviation (SD) were extracted from the cognitively normal controls (N = 1,243), and z-score deviation from sex-matched controls was calculated for the MCI and dementia groups. Regional GMV with atrophy was then defined as a z-score deviation less than – 1.5. Risk ratio with a 95% confidence interval (95% CI) of MCI and dementia were calculated in each and multiple regional GMV atrophy compared with participants without atrophy (risk ratio function form statistical package R, epitools version 0.5–10.1). We used 1.5 SD as a conventional threshold for atrophy based on previous studies [33, 34]. A statistical significance level of 0.05 (two tailed) was, and Bonferroni correction was applied for multiple comparison correction where applicable.
RESULTS
Table 2 shows the baseline demographics of the total study population across the CN, MCI, and dementia groups. The age group was also divided into 31–34, 35–44, 45–54, 55–64, 65–69, 70–74, 75–79, 80–84, 85–89, and 90–99 years old. There were 48.8% (N = 1243) CN, 38.0% (N = 967) MCI, and 13.2% (335) dementia participants in this study. There were more women than men (68.8%, N = 1751). The proportion of women increased in the CN (68.6%, N = 853), MCI (68.6%, N = 663), and dementia groups (70.1%, N = 235). As shown in Table 2, the proportion of MCI increased up to 85 years of age (50.5% in 80≤ age <85) and then decreased (37.8% in 90≤ age <100), while the dementia group continuously increased after 65 years of age (from 3.7% in 65≤ age <70 to 53.3% in 90≤ age <100).
Table 4 shows the measured mean volumes of the regions of interest (ROIs) as potential risk factors for MCI and dementia in each sex and cognitive group. The mean volumes significantly decreased with older age, and women showed significantly smaller volumes in all nine ROIs. After adjusting for age and sex, the volumes were different between the CN, MCI, and dementia groups in both hemispheres.
Additionally, we examined the comparative risk of cognitive decline associated with regional atrophy (defined as a deviation of ≤1.5 SD from the age and sex-matched norm) at the individual level of ROIs and across multiple ROIs.
First, we investigated the frequency of individuals with regional atrophy (≤1.5SD) for each nine ROI, as summarized in Table 5. The frequency of regional atrophy was significantly different across the groups. As expected, 5.2% – 6.8% of the CN group showed regional atrophy given the 1.5 SD threshold. More than 30% of individuals with dementia exhibited atrophy in the right hemisphere (RH) hippocampus (32.8%, N = 110) and left hemisphere (LH) hippocampus (39.1%, N = 131), LH entorhinal GM (32.2%, N = 108), RH entorhinal GM (33.7%, N = 113), LH temporal GM (30.1%, N = 101), RH temporal GM (30.7%, N = 103), and RH middle temporal GM (20.7%, N = 103). Individuals with MCI also showed a higher frequency of atrophy in the RH hippocampus (23.3%, N = 225), LH hippocampus (19.2%, N = 186), LH entorhinal GM (18.4%, N = 178), and RH entorhinal GM (18.6%, N = 180) than in other ROIs.
Percentage (frequency) of ROIs with atrophy† across three pathological groups
CN, cognitive normal; MCI, mild cognitive impairment; P, group difference test using χ2-test; †Atrophic ROI, ≤ 1.5 SD regions of interests (left or right hemispheres).
Risk ratio for cognitive decline† when the ROI in either, left, and right hemisphere presenting atrophy
†Cognitive decline, mild cognitive impairments (MCI) or dementia; ‡atrophic ROI when smaller than 1.5 SD of the cognitive normal group; CI, confidence interval; Significant level at 0.05, 0.01, 0.001 marked with star (*,**,***). Significant level after multiple comparison correction for 18 ROIs were 0.003 and marked with†.
The risk ratio of MCI and dementia in participants with regional atrophy are summarized in Table 6. The risk ratio of MCI in individuals with atrophy in any ROI was significantly higher, ranging from 1.39 (95% CI: 1.21, 1.58) in parietal GM atrophy to 1.89 (95% CI: 1.74, 2.07) in hippocampal atrophy. The risk ratio of dementia in individuals with atrophy in all nine ROIs was significant, showing the highest increased risk of 4.17 (95% CI 3.52–4.95) with entorhinal GM atrophy and the lowest increased risk ratio of 1.82 (95% CI: 1.41–2.34) compared with individuals without atrophy at the 1.5 S Dlevel.
The total number of regions with atrophy among lobar and AD-related regions was investigated (Fig. 1). The percentage of participants without atrophy decreased significantly from CN (60.1% for lobar ROI, 61.4% for AD-related ROI), MCI (33.0% for lobar ROI, 32.0% for AD-related ROI), to dementia (6.9% for lobar ROI, 6.5% for AD-related ROI) when considering lobar and AD-specific ROIs with the hippocampus. In contrast, the proportion of participants diagnosed with MCI or dementia (light grey on the right side figure, MCI+D in Fig. 1) increased from 40.0% (No atrophy ROI), 61.7% (one atrophic ROI) to 72.7% (two or more atrophic ROI) in lobar ROI with the hippocampus and from 38.6% (no atrophic ROI), 54.4% (one atrophic ROI) to 74.4% (two or more atrophic ROI) in lobar ROI with the hippocampus. As expected, the number of atrophic ROI increases from CN, MCI, to the dementia group (Fig. 2).
The risk ratios of MCI and dementia in individuals with atrophy in multiple regions are summarized in Tables 7 and 8 (or supplementary figures), respectively.
In the analysis of lobar GM with the hippocampus (Table 7), the highest risk was 9.6 (95% CI, 8.0–11.5) in three-regional atrophy of the frontal-temporal-hippocampus (Lobar set index, 19; p = 0.001) and 7.3 (95% CI, 5.7–9.4) two-regional atrophy of parietal-hippocampus (ROI index = 5; p < 0.001), and 7.1 (95% CI, 5.0–10.1) three-regional atrophy of frontal-parietal-hippocampus (ROI index = 21, p < 0.001). The regional atrophy in two (M2) or more (M3, M4, or M5) areas generally presented a higher risk ratio than the atrophy in only one (M1). The risk ratio for MCI was generally lower (ranging from 1.5 to 2.2) than that of the dementia group.
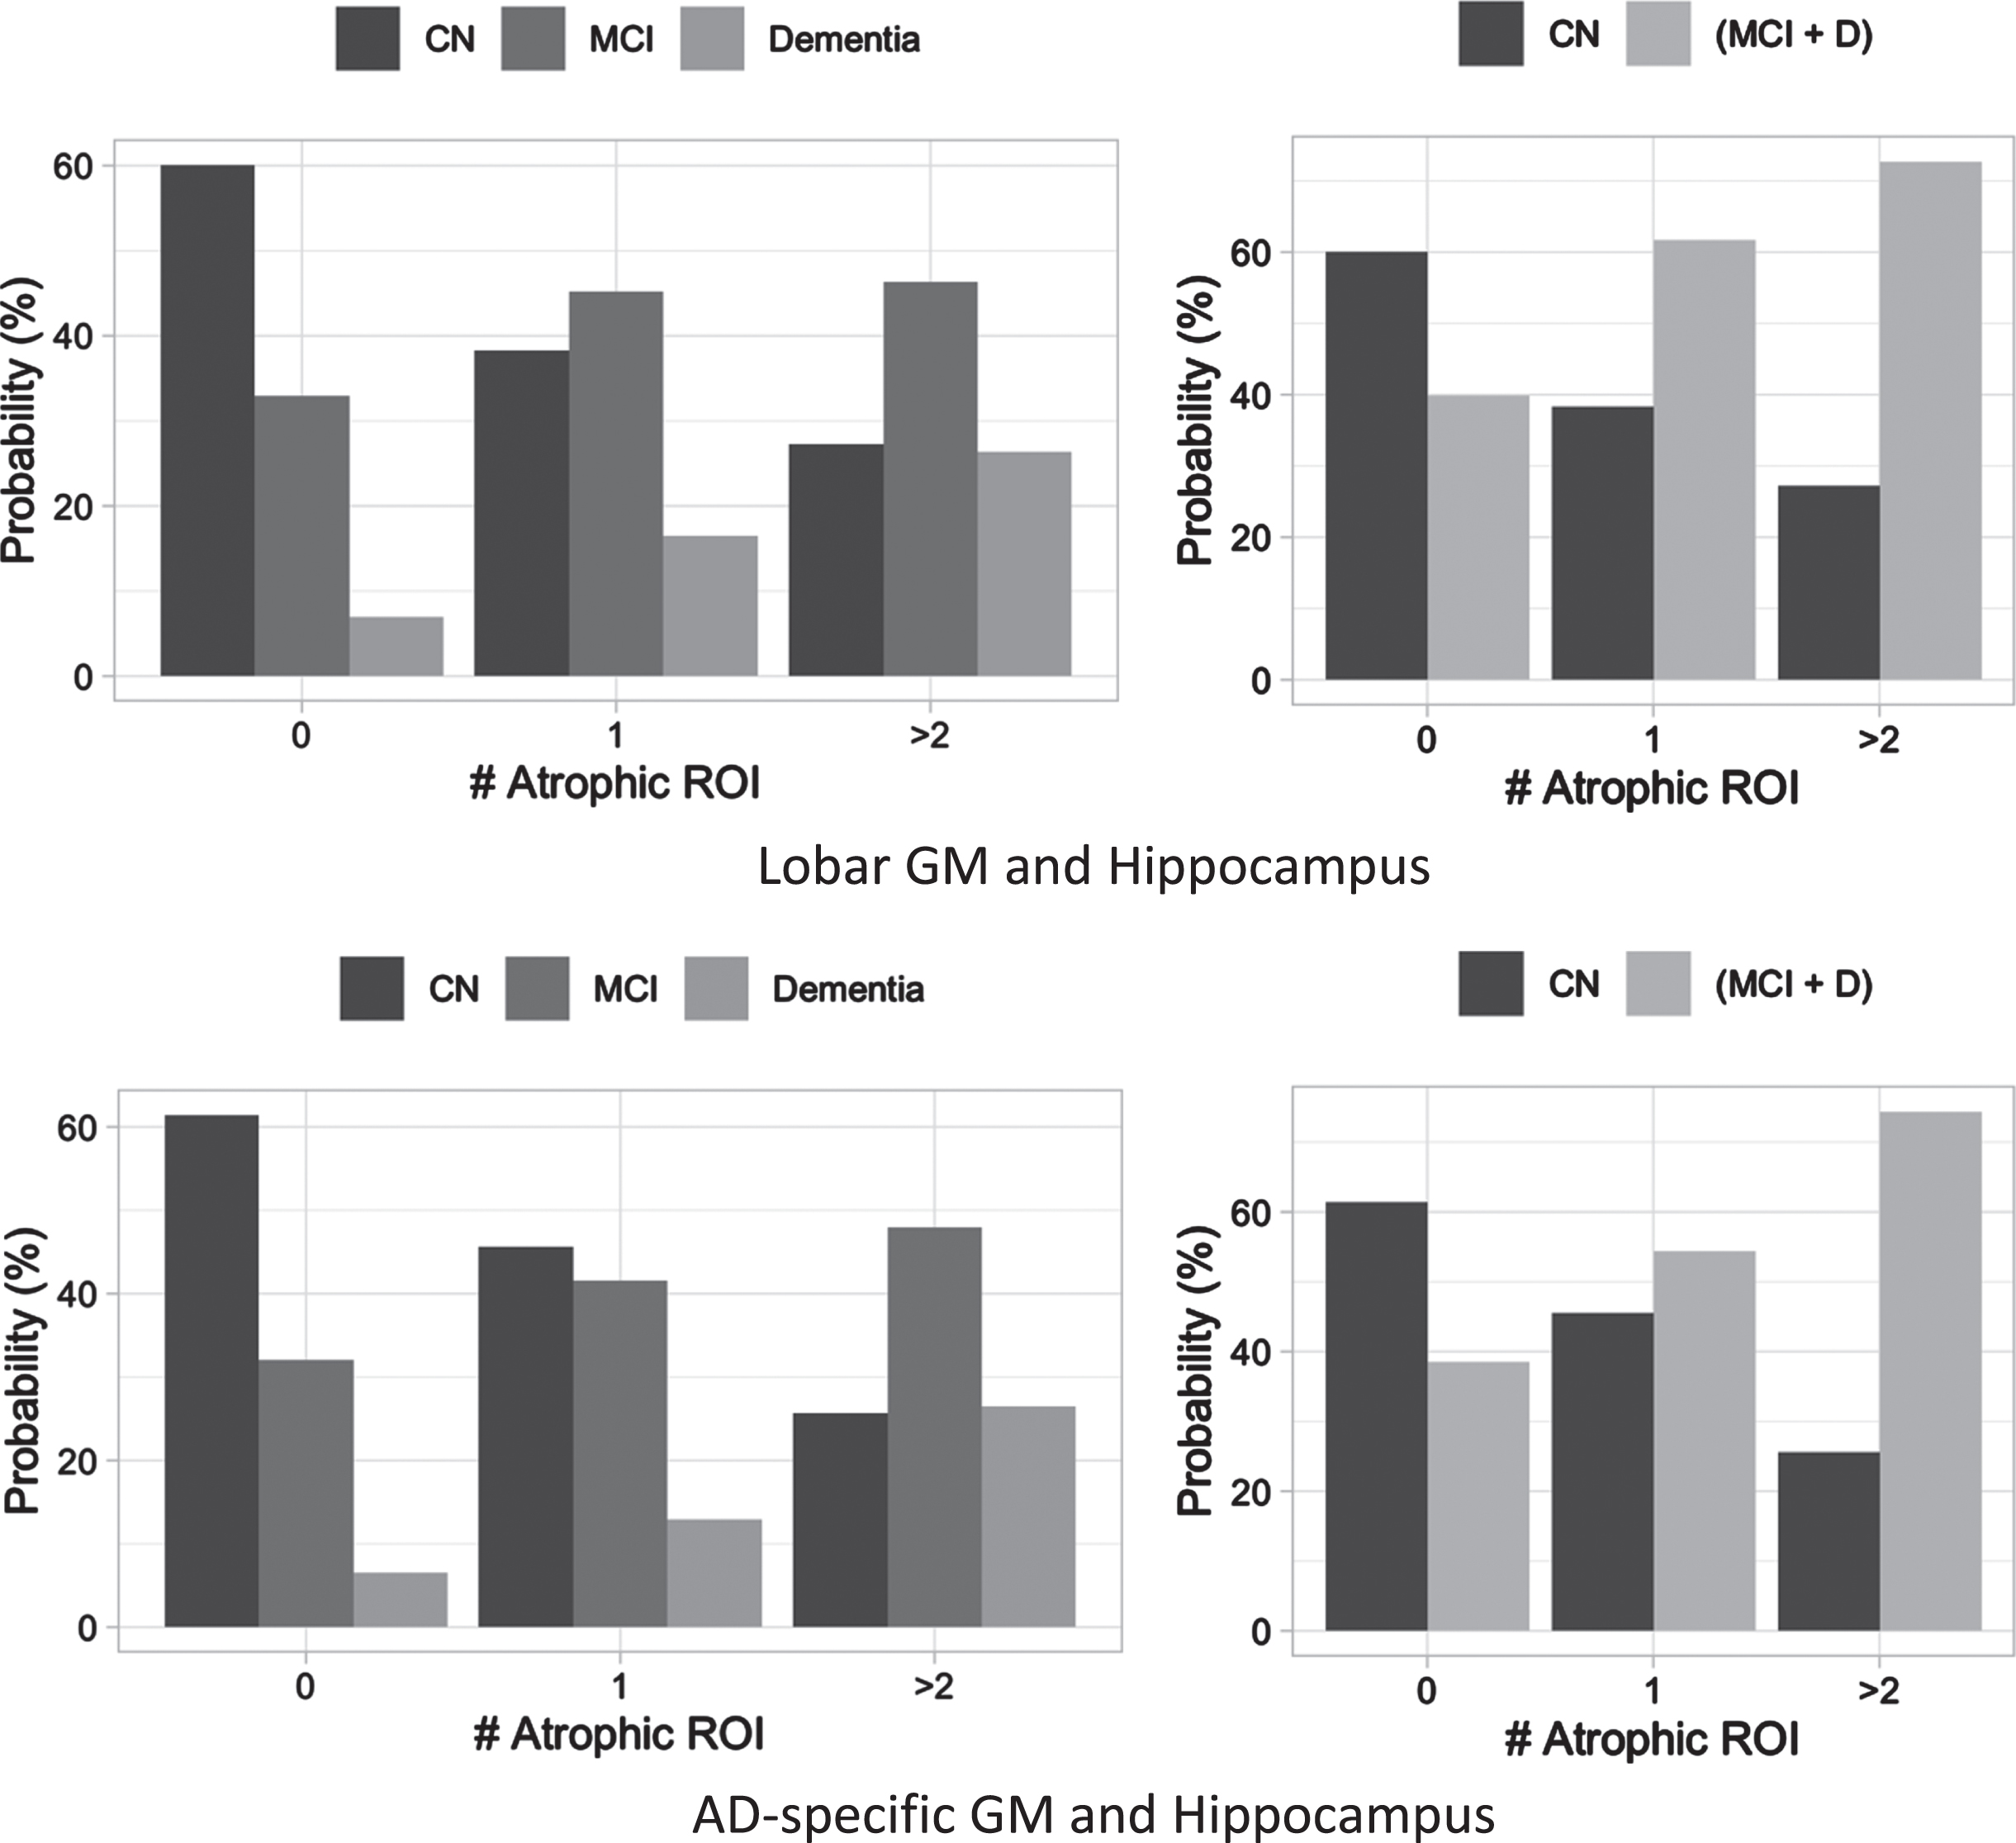
Percentage (frequency) of participants with region count with atrophy (# Atrophic ROI). Figures on the top show lobar GM, including frontal, occipital, parietal, and temporal lobes; Figures on the bottom show AD-specific regions of interest (ROI), including entorhinal, fusiform, middle temporal, and inferior temporal GM. Figures on the left column show the frequency according to three groups (cognitive normal, CN versus mild cognitive impairment, MCI versus dementia), and figures on the right column show the prevalence probability according to two groups (CN versus cognitive decline group where combining MCI and dementia). †Atrophic ROI when smaller than 1.5 SD of the cognitively normal group.
The results of the analysis of AD-specific regions with the hippocampus are summarized in Table 8 (also in the Supplementary Material). The highest risk ratio was 8.5 (95% CI, 6.3–11.4) with atrophy in four AD-related ROIs (AD-specific set index, 27; p < 0.001), 8.2 (95% CI, 6.4–10.5) with all five ROI atrophy (AD-specific set index, 31; p < 0.001), and 7.9 (95% CI, 5.6–11.3) entorhinal-inferior temporal-hippocampus (AD-specific set index, 25; p < 0.001). A significantly higher risk ratio for MCI was also observed for 17 ROI combinations, and the highest risk ratio was 2.6 (95% CI, 2.1–3.3) with fusiform-hippocampus (AD-specific set index, 3; p < 0.001). Figure 3 also shows the trend of risk ratio when existing hippocampal atrophy is in combination with other ROIs. As shown in the figure, the general trend of increasing risk ratio with a higher number of atrophic ROI was observed.
DISCUSSION
In this study of an older Korean population, decreased levels of regional GMV were significantly associated with a higher risk ratio of MCI and dementia. Additionally, decreased levels of the hippocampus, entorhinal GMV, and left inferior temporal GMV were significantly associated with the increased risk ratio of MCI and dementia. Our multiple ROI investigation further revealed that the reduced regional GMV in the joint area (e.g., inferior and middle temporal; entorhinal and hippocampus/fusiform/middle temporal area) presented a higher risk ratio for dementia. These findings suggest that multiple regional brain atrophy may serve as an effective neuroimaging biomarker for identifying participants at high risk of dementia in clinical settings. Specifically, our results suggest that individuals with atrophy in multiple ROIs, especially the AD-related ROIs, have an increased likelihood of developing MCI or dementia and thus require further attention.
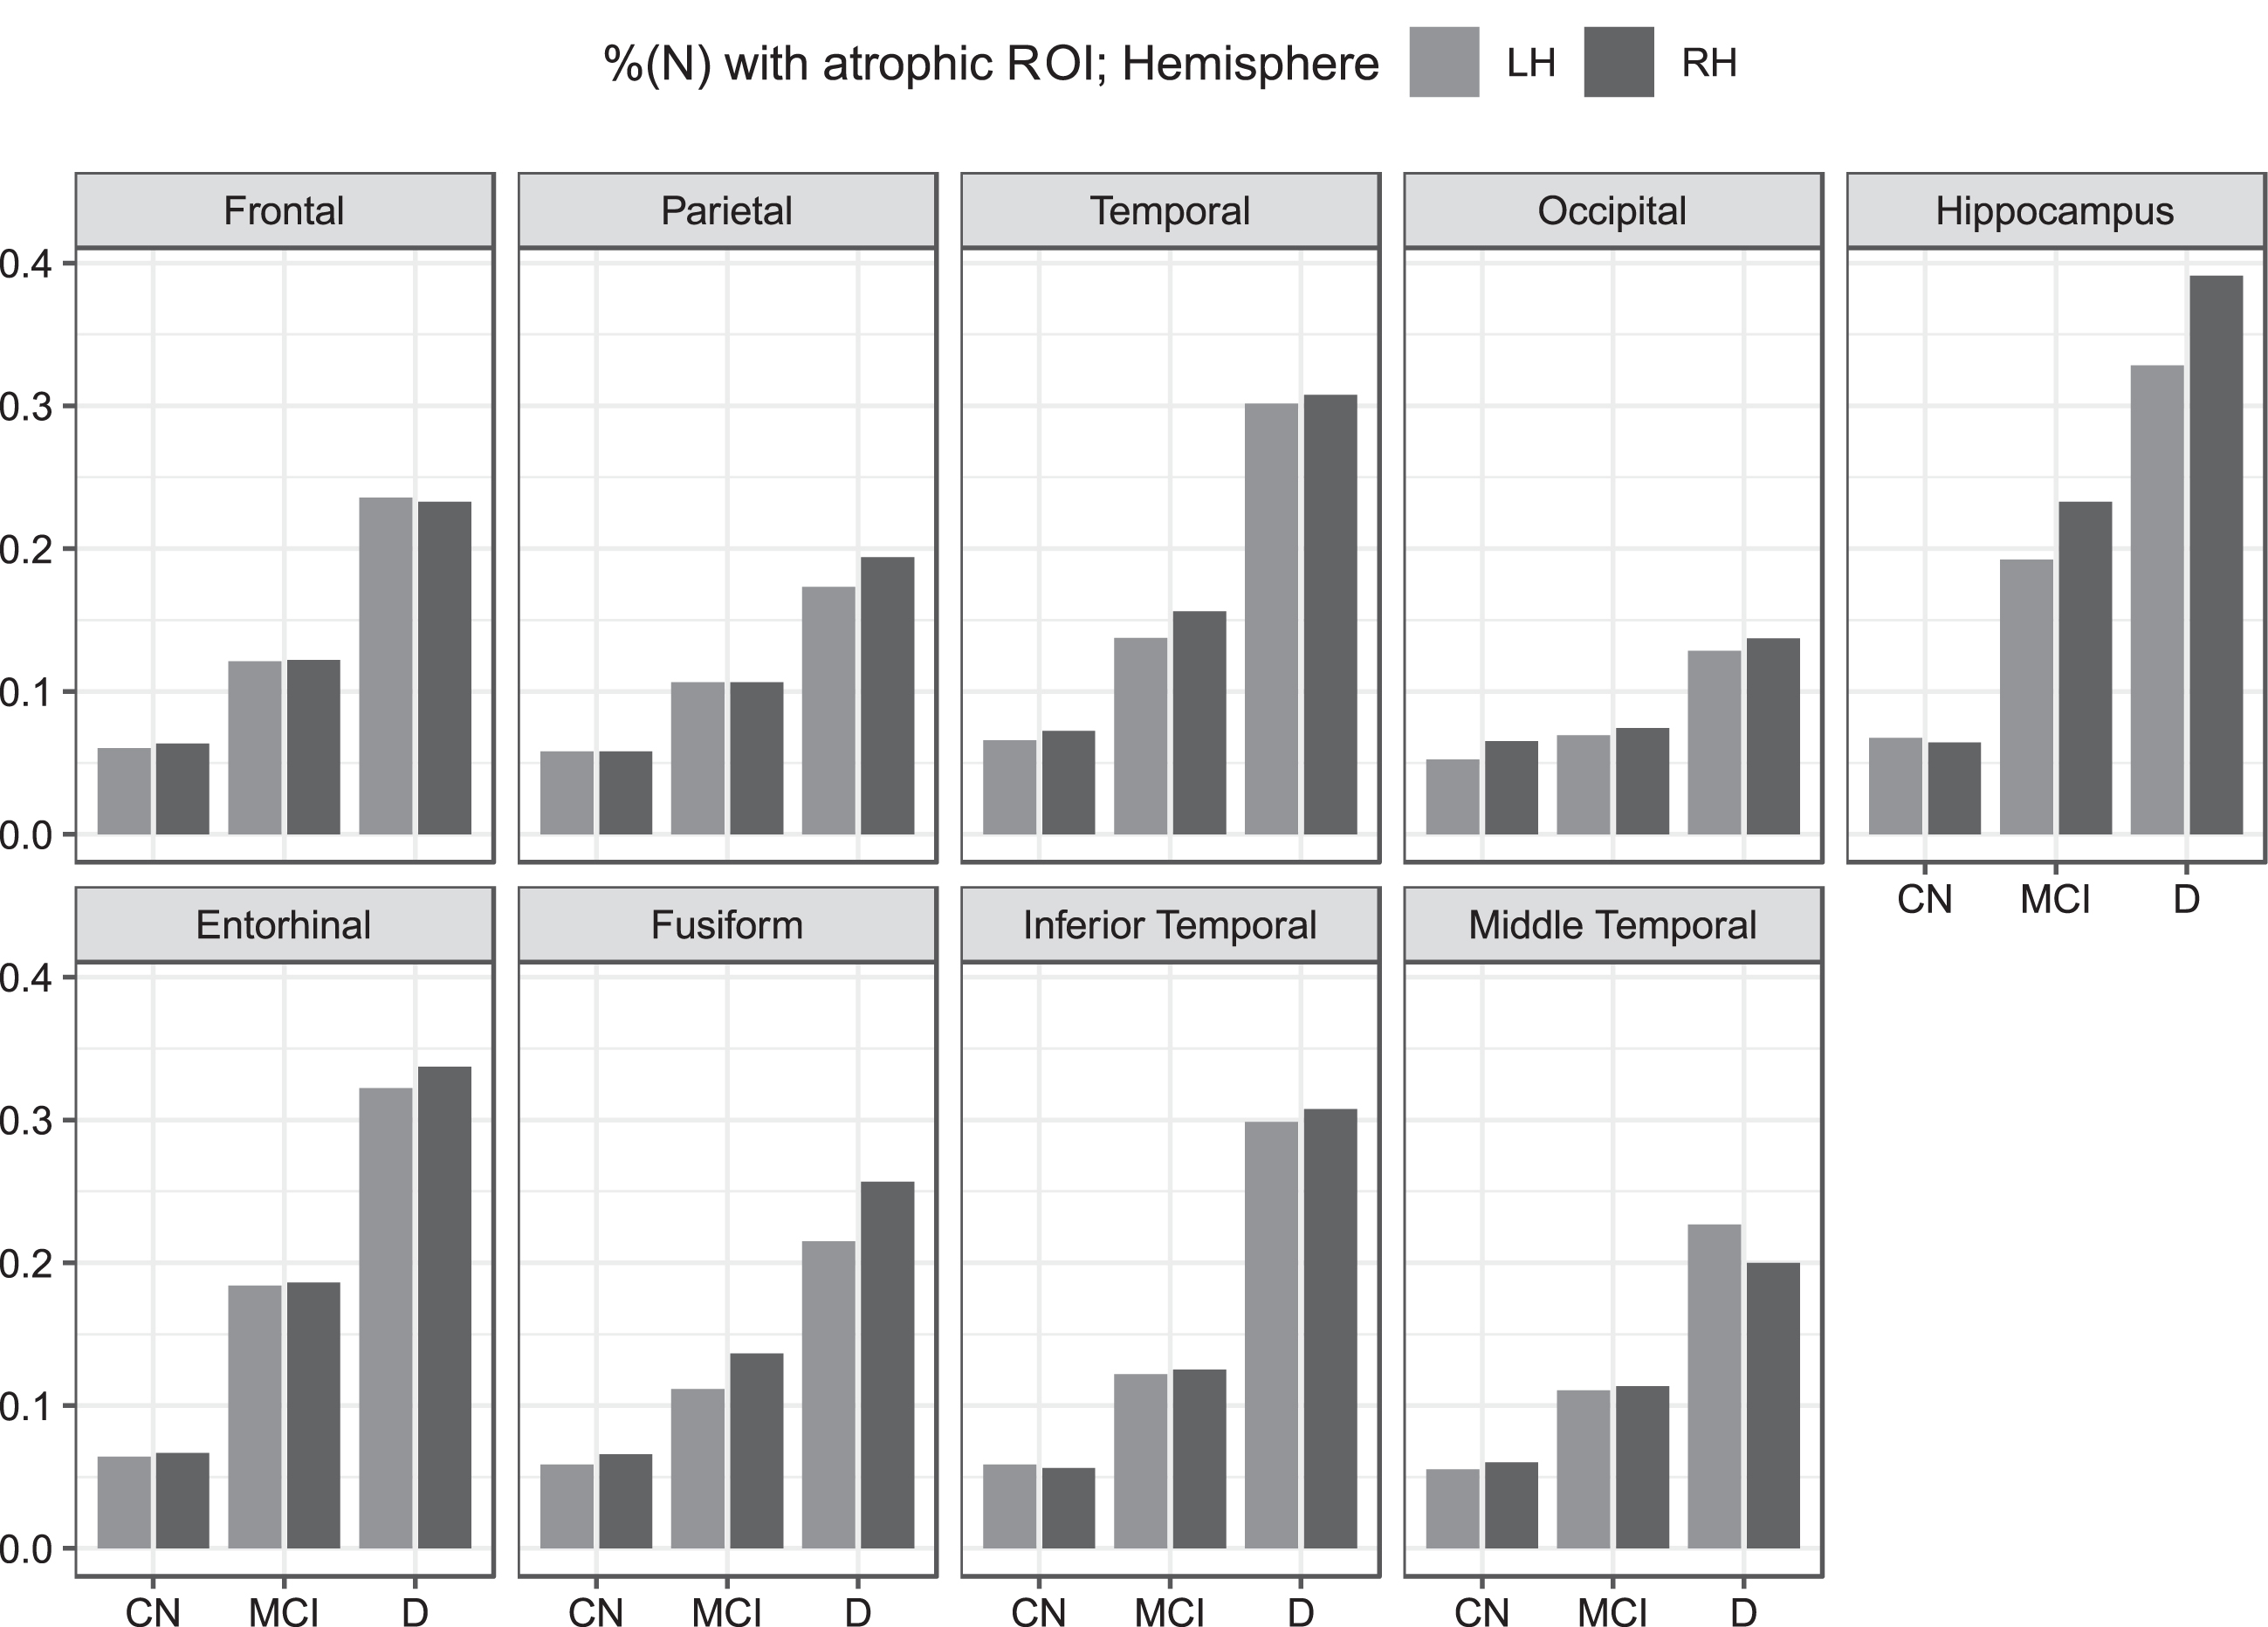
Percentage of atrophic ROI (<1.5 SD) for the three diagnostic groups of cognitive normal (CN), mild cognitive impairments (MCI), and dementia (D) when atrophy was identified in each ROI. ROIs in the left hemisphere (LH, light grey) and right hemisphere (RH, dark grey) are marked separately.
Our results highlight the importance of AD-specific regions, specifically for entorhinal and inferior temporal GM. Our results clearly indicated the dose-response relationship between AD-specific ROIs and dementia risk ratio (Fig. 2). We showed that the risk ratio increases for any atrophy in entorhinal or inferior temporal GM; however, individuals with a greater number of atrophic ROIs have a higher risk ratio for dementia. To our knowledge, the result shown in Fig. 3 is the first of its kind. Specifically, any additional atrophic ROI (e.g., middle temporal GM, fusiform GM, or hippocampus) to the entorhinal and inferior temporal GM increased the risk ratio significantly up to 9.8 compared to the participants without atrophic ROI.
In our study, there were more participants with regional atrophy in dementia for AD signature ROIs than lobar ROIs. For example, the percentage of participants with regional brain atrophy was as high as 49.8% in the dementia group for the entorhinal GM area, followed by the hippocampus (27.8%) and the inferior temporal GM (24.6%). Our result supports the fact that AD is the leading cause of dementia globally. The prevalence of dementia in Korea is 6.93% (95% CI = 4.48–9.23%) among those aged >60 years [35]. In the United States, the prevalence of dementia is 13.9% among individuals aged ≥71 years [36]. In the same study, AD and vascular dementia accounted for 69.9 % and 17.4%, respectively [36].
Our results also suggest that a relatively earlier change in brain volume occurred in the temporal area (entorhinal and inferior temporal GM) and hippocampus for MCI. These results are consistent with those of previous studies which reported brain volumetric changes in MCI [37–39]. Significantly higher risk ratios for MCI were observed when individuals had lower volumes in the temporal and hippocampal areas. The atrophy of the hippocampus is well-established in MRI studies. One study reported that the atrophy of the hippocampus on MRI could predict dementia and AD during a 6-year follow-up [37]. Another study found that hippocampal atrophy was associated with an increased risk of dementia or cognitive decline [38]. Atrophy in the temporal area has also been reported for individuals with MCI (late-onset AD) [39]. Additionally, the entorhinal volume has been identified as a good predictor of conversion from MCI to AD [40].
Summary of the risk ratio for cognitive decline† when lobes and hippocampus were jointly considered
†Cognitive decline, mild cognitive impairments (MCI) or dementia; ‡ atrophic ROI when smaller than 1.5 SD of the cognitive normal group; *, **, ***, Statistically significant at the level of 0.05 (*), 0.005 (**), and 0.001 (***); # Statistically significant <0.0015 (multiple comparison N = 32); F, frontal GM; O, occipital GM, P, parietal GM; T, temporal GM; H, hippocampus; The joint association of the ROIs with atrophy (≤1.5 SD of our cognitive normal) were indexed from 0 to 31, where ‘O’ indicating atrophic ROI for the corresponding index.
The risk ratio of dementia was significantly high, with lower volumes in any of the nine ROIs investigated in this study. The risk ratio was highest with entorhinal GM (5.12,<0.001), followed by inferior temporal GM (2.70, p < 0.001), hippocampus (2.63, p < 0.001), temporal GM (2.45, p < 0.001), and middle temporal GM (2.01, p < 0.001). Our findings support the fact that brain atrophy is a critical indicator of cognitive decline in later life. General brain volume atrophy has been observed in various types of dementia, including frontotemporal, Lewy body, and mixed pathology dementia [41–43].
The risk ratio increased up to 2.9 for MCI and 9.8 for dementia with multiple atrophic ROIs compared with only one atrophic ROI. Higher risk ratios were observed from multiple ROIs with atrophy in AD-specific ROIs. On the other hand, atrophy in multiple lobar regions, including the hippocampus, increased the risk ratio of MCI or dementia to a lesser extent, e.g., up to 2.2 for MCI and 6.7 for dementia. Our results correspond with that of a previous study that reported the importance of medial temporal GM and the hippocampus in predicting dementia compared with frontal or temporal GM [18].
Summary of the risk ratio for cognitive decline† when AD-specific ROI and hippocampus were jointly considered
†Cognitive decline, mild cognitive impairments (MCI) or dementia; ‡ atrophic ROI when smaller than 1.5 SD of the cognitive normal group; *, **, ***, Statistically significant at the level of 0.05 (*), 0.005 (**), and 0.001 (***); †Statistically significant <0.0015 (multiple comparison N = 32); E, Entorhinal GM; IT, Inferior temporal GM; MT, medial temporal GM; H, hippocampus; The joint association of the ROIs with atrophy (≤1.5 SD of our cognitive normal) were indexed from 0 to 31, where ‘O’ indicating atrophic ROI for the corresponding index.
Our study has several limitations. First, because of its cross-sectional nature, we could not draw definite causal relationships between brain atrophy, MCI, or dementia. Second, there was a low number of participants with atrophy in multiple areas, and this is currently being addressed. Additionally, the calculated risk ratio might have overestimated the actual likelihood of the disease. Further, pathological confirmations (e.g., amyloid PET) and disease severity (e.g., early dementia or later-stage dementia) have not been accounted for in this study. Future studies are needed.
In conclusion, the utilization of structural brain MRI for the identification of regional atrophy has yielded promising outcomes, shedding light on the pathological brain alterations associated with MCI and dementia, primarily probable AD. This study provides investigated, for the first time, the combined impact of atrophic ROIs on the risk ratio for MCI and dementia within a sample of adults. The findings from our study have practical implications for both clinical practice and research. Using ROIs that relatively easier to identify, the atrophic patterns can aid clinicians in identifying and managing patients at a higher risk of developing dementia and inform clinical trial design to potentially develop more effective treatments for this specific subgroup.
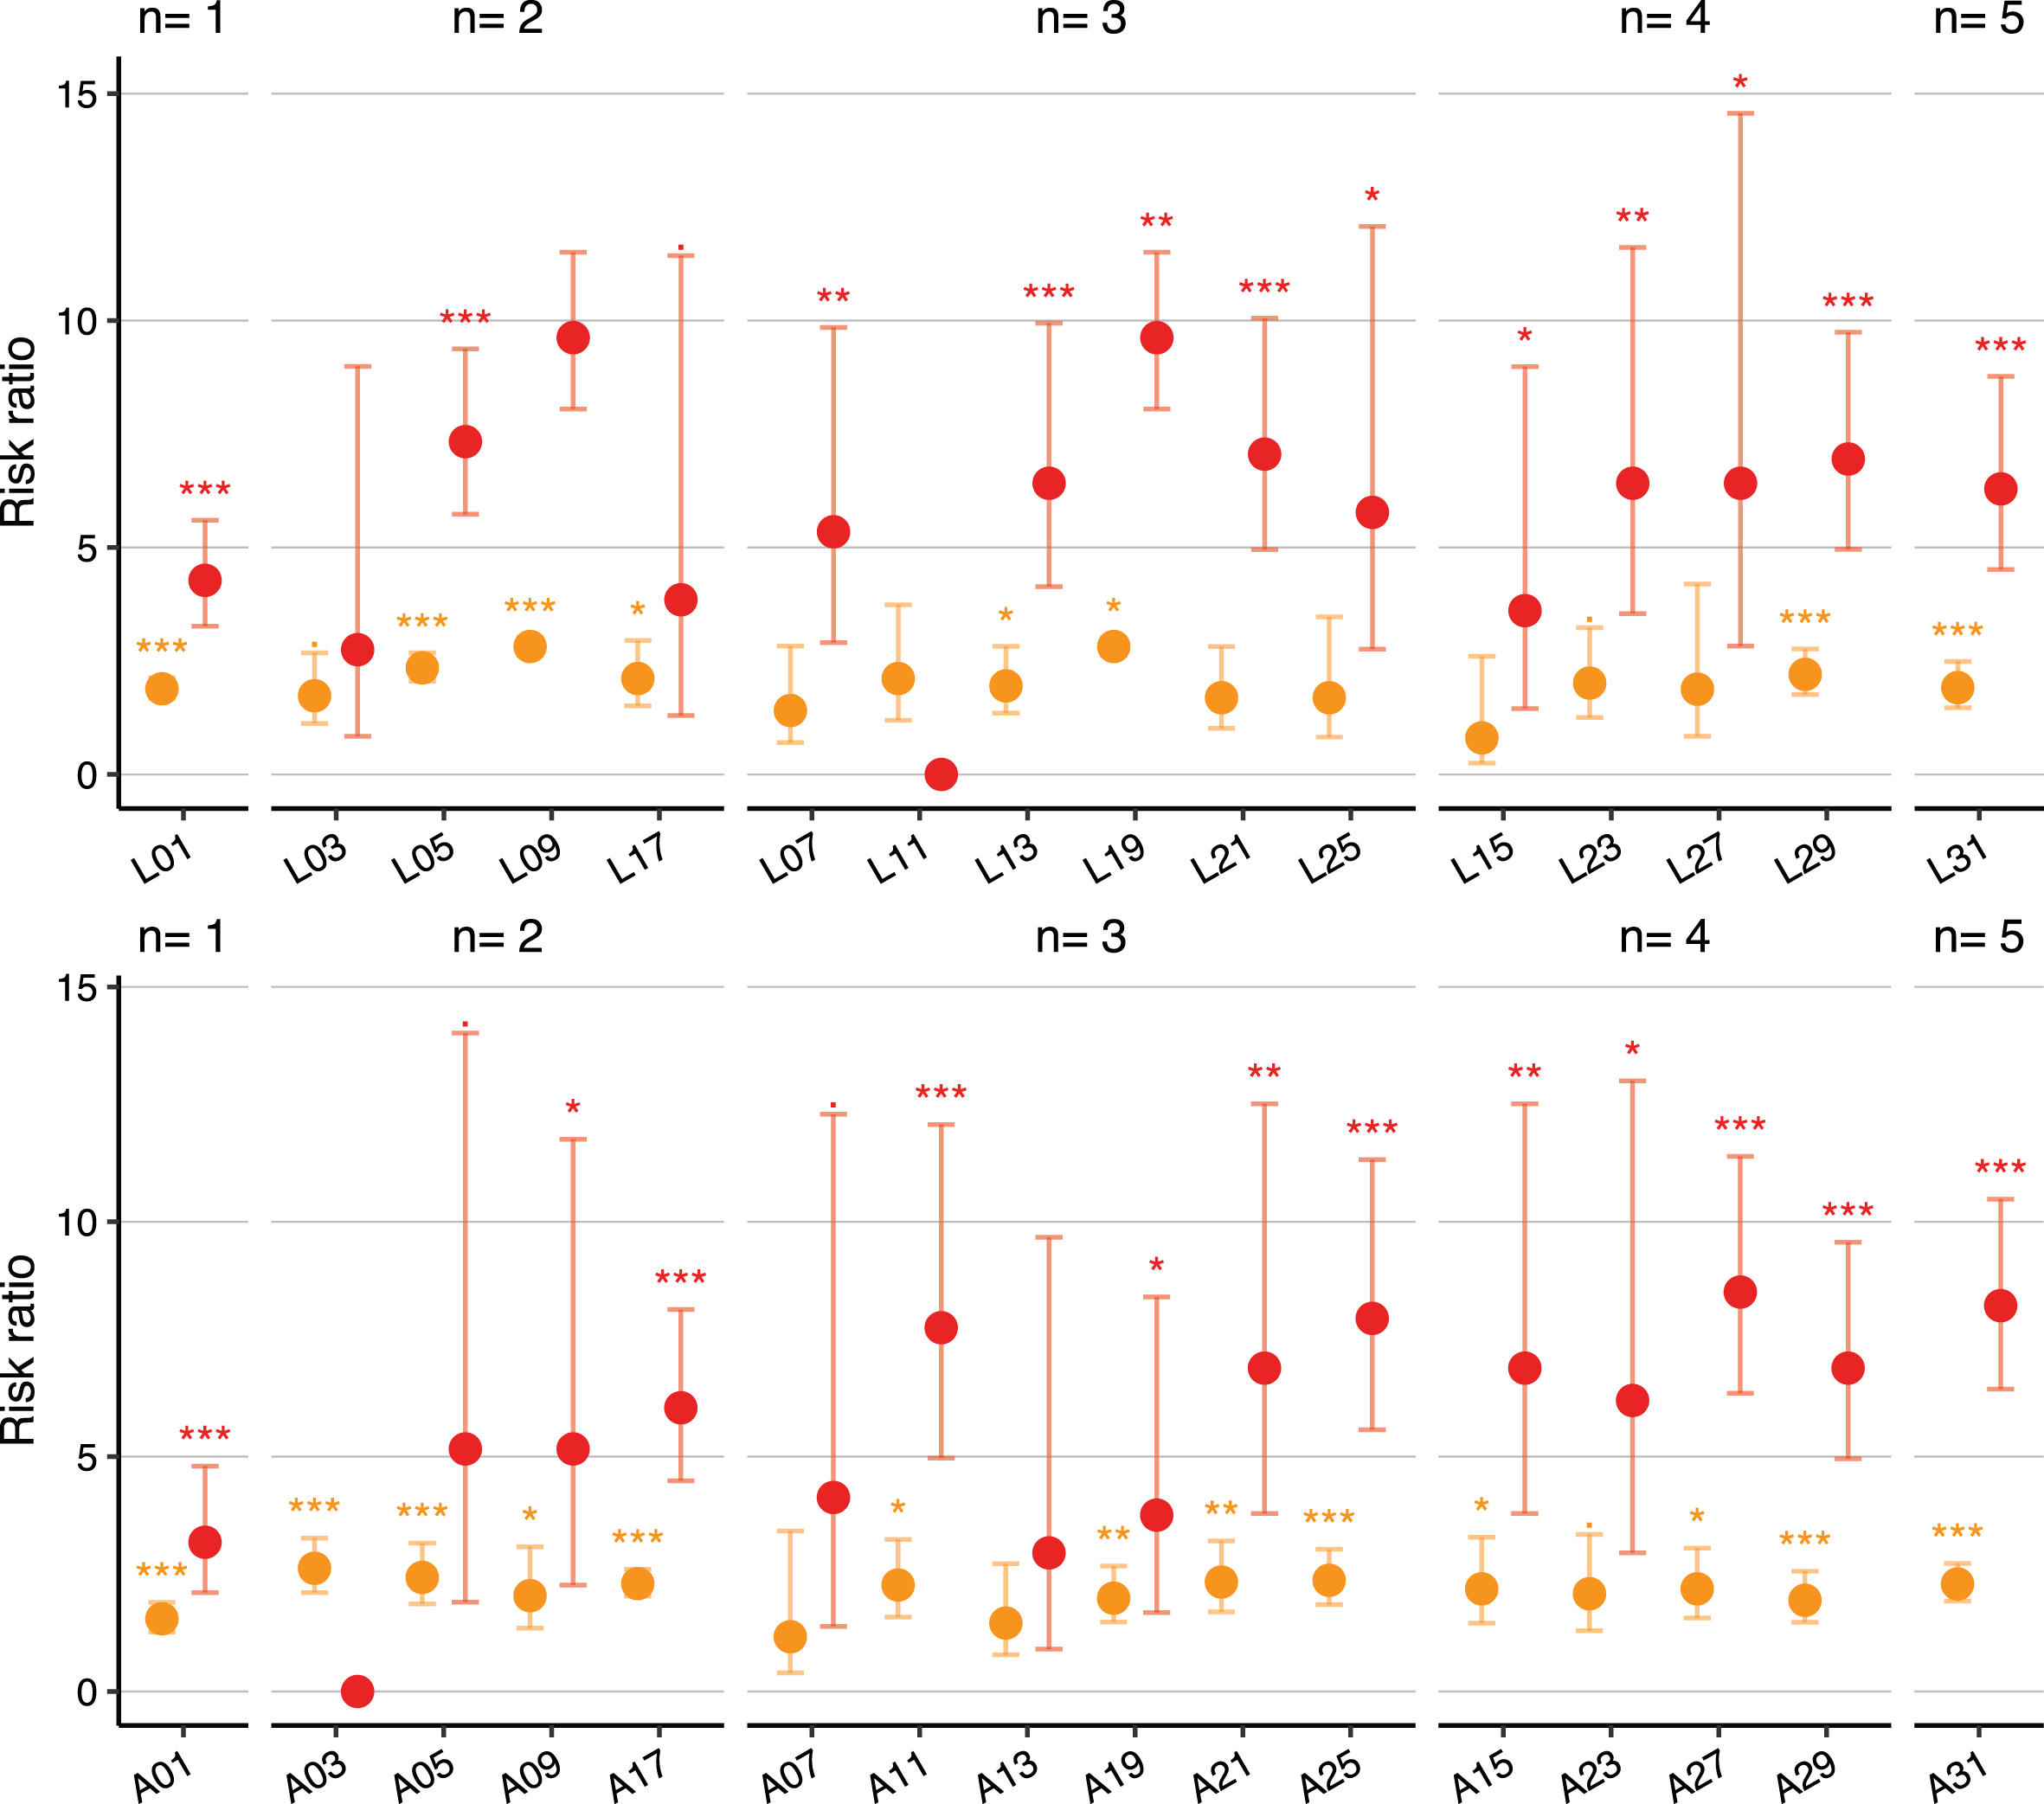
Risk ratio for MCI (orange) and dementia (red) when atrophy was observed for the hippocampus alone or in combination with other ROIs when compared with the individuals without atrophic ROI. From both lobar (L) and AD-specific (A) ROI investigations, the general trend of increasing risk was observed from hippocampus atrophy alone (n = 1), one additional ROI atrophy (n = 2; 03, 05, 09, 17), two additional ROI atrophy (n = 3; 07, 11, 13, 19, 21, 25), three additional ROI atrophy (n = 4; 15, 23, 27, 29), to all five ROIs (n = 5; A31). The statistically significant levels of 0.05 (*), 0.005 (**), and 0.001 (***) are marked in the graph.
Footnotes
ACKNOWLEDGMENTS
I thank all the members of the Neurophet Research Team for their expertise and assistance throughout all aspects of the current research and for their help in writing the manuscript.
FUNDING
This research was supported by the Korea Health Technology R&D Project through the Korea Health Industry Development Institute (KHIDI) and Korea Dementia Research Center (KDRC), funded by the Ministry of Health & Welfare and Ministry of Science and ICT, Republic of Korea (grant number: HU20C0315).
CONFLICT OF INTEREST
The authors have no conflict of interest to report.
DATA AVAILABILITY
Data sharing is not applicable to this article as no datasets were generated or analyzed during this study.