
Abstract
Background:
The cerebrospinal fluid (CSF) levels of tau phosphorylated at threonine 217 (p217tau) or 181 (p181tau), and neurofilament light chain (NfL) are definite biomarkers of tauopathy and neurodegeneration in Alzheimer’s disease (AD).
Objective:
To validate their utility in excluding other neurological diseases and age-related changes in clinical settings.
Methods:
We developed monoclonal antibodies against p217tau and NfL, established novel ELISAs, and analyzed 170 CSF samples from patients with AD or other neurological diseases.
Results:
In AD, p217tau is a more specific and abundant CSF component than p181tau. However, CSF NfL levels increase age-dependently and to a greater extent in central and peripheral nervous diseases than in AD.
Conclusions:
CSF p217tau correlates better with AD neurodegeneration than other tau-related biomarkers and the major phosphorylated tau species. The clinical usage of NfL as a neurodegeneration biomarker in AD requires exclusion of various central and peripheral neurological diseases.
Keywords
INTRODUCTION
In the Alzheimer’s disease (AD) continuum, amyloid-β (Aβ) deposition starts 20 years before the onset of symptomatic cognitive decline, and then phosphorylated tau emerges. After a long incubation period, neurofibrillary tangles (NFT) and neurodegeneration appear, and cognitive decline generally progresses to clinical dementia [1, 2], which lasts for 10 years. This natural course of AD was proposed in detailed studies of the time course of dominantly inherited AD (DIAD) [2–4] and has been endorsed in sporadic AD cohort studies [5–8]. The signatures of these pathological and clinical processes are now able to be traced using biomarkers found in cerebrospinal fluid (CSF) or plasma as well as via positron emission tomography (PET) of Aβ amyloid and NFT tau deposition. In addition to Aβ40, Aβ42, and Aβ ratios as biomarkers of Aβ amyloidosis, phosphorylated tau at threonine 181 (p181tau) or phosphorylated tau at threonine 217 (p217tau), total tau (t-tau), and neurofilament light chain (NfL) have recently been proposed as biomarkers of tauopathy (T+) and neurodegeneration (N+) in the National Institute on Aging and Alzheimer’s Association’s (NIA-AA) research framework for a biological definition of AD [1, 9].
p217tau and p181tau precede t-tau in the sequential alterations seen in the CSF in DIAD and sporadic AD [4]. p217tau is superior to p181tau as a marker of tauopathy from the preclinical to dementia stages of AD [10–13]. As for biomarkers of neurodegeneration, the appearance of t-tau in CSF and NFT on PET emerge later and are correlated with symptomatic cognitive decline [4]. In DIAD, CSF and serum NfL levels were found to increase 6.8 years before the onset of symptomatic cognitive decline and were correlated with cortical thinning and cognitive decline [14]. Abnormal CSF NfL levels were detected in later AD stages involving both Aβ and tau pathology and were found to be correlated with worse global cognition [15]. However, changes in CSF t-tau and p181tau levels are not entirely specific to AD [12]. Increased CSF p181tau levels are sometimes observed in other tauopathies [16–18]. CSF t-tau levels increase after various types of central nervous system (CNS) disorders and increase markedly in acute cerebrovascular disease and prion disease [19]. NfL has recently been described as the “C-reactive protein of neurology” in CNS and peripheral nervous system (PNS) diseases [20]. CSF NfL levels increase in amyotrophic lateral sclerosis (ALS) [21, 22], multiple sclerosis (MS) [23], non-AD dementia, other neurodegenerative diseases [24, 25], and acute and chronic immune-mediated neuropathies (IMN) [26, 27]. Clinically, these alterations in CSF NfL levels are observed in the asymptomatic preclinical stages and are correlated with prognosis [14, 28]. Recently, the CSF NfL level has been suggested to be a non-specific marker of aging and white matter disorders in AD [29]. These findings indicate that the CSF levels of these biomarkers should be evaluated in patients with CNS or PNS disease to allow them to be used in clinical practice after disease-modifying therapy for AD.
Here, we developed two novel enzyme-linked immunosorbent assays (ELISAs) for measuring CSF p217tau and NfL levels. Using these ELISAs and in-house ELISAs for p181tau and t-tau [30], 170 CSF samples from patients with AD or other CNS or PNS diseases were analyzed to elucidate 1) the feasibility and specificity of p217tau, p181tau, t-tau, and NfL as biomarkers for differential diagnosis; 2) differences in the levels and characteristics of each marker; and 3) factors affecting the clinical usage of p217tau, p181tau, t-tau, and NfL as biomarkers of AD.
MATERIALS AND METHODS
Patients
A total of 170 CSF samples from 157 patients with neurological diseases and 13 healthy and cognitively unimpaired control subjects (HCU) were examined. Forty-nine CSF samples from AD cases that fulfilled the NIA-AA criteria [31], including 4 cases of DIAD with PSEN-1 mutations (including 1 cognitively unimpaired [CU] patient, 1 patient with mild cognitive impairment [MCI], and 2 patients with dementia) and 45 sporadic AD cases (including 2 CU patients, 19 patients with MCI, and 24 patients with dementia), were analyzed. The other neurological diseases included 37 cases of ALS (9 bulbar-onset and 28 limb-onset) that had been diagnosed with the Gold Coast criteria [32], 18 cases of Parkinson’s disease (PD) [33], 14 cases of MS [34], 7 cases of neuromyelitis optica spectrum disorder (NMOSD) with Aquaporin 4-IgG [35], 20 cases of IMN (11 cases of Guillain-Barr
The age, sex, and the CSF levels of p217tau, p181tau, t-tau and NFL in HCU and patients with AD or other neurological diseases. The data are shown as the mean±standard deviation
*p < 0.05, ¶p < 0.01, ‡p < 0.001, §p < 0.0001. AD, Alzheimer’s disease; DIAD, dominantly inherited Alzheimer’s disease; SAD, sporadic Alzheimer’s disease; PD, Parkinson’s disease; MS, multiple sclerosis; NMOSD, neuromyelitis optica spectrum disorders; ALS, amyotrophic lateral sclerosis; CM, cervical spondylotic myelopathy; IMN, immune-mediated neuropathies; OND, other neurological diseases; HCU, healthy and cognitively unimpaired controls.
CSF sampling
Lumbar puncture to obtain a CSF sample was performed in the morning after fasting in accordance with the standard protocol. The CSF samples were immediately centrifuged at 1,400 g at 4°C for 10 min and stored in polypropylene vials at –80°C until the analysis.
ELISAs
Reagents
CSF t-tau and p181tau levels were measured using a Human Total Tau Assay kit (ELISA #50161) and a Human Phospho Tau 181P Assay kit (ELISA #50171, Immuno-Biological Laboratories Co., Ltd., Japan: IBL), respectively [30]. For the p217tau ELISA, monoclonal antibody E17A1 against the longest isoform of human tau, composed of 441 amino acid residues (tau441) (AG960; Sigma-Aldrich, Merck, Darmstadt, Germany) was generated for usage as a capture antibody. A rat monoclonal antibody (69A10) specific to tau peptides phosphorylated at threonine 217 (RTPSLPpTPPTRE) was also generated. The Fab’ fragment of 69A10 conjugated with horseradish peroxidase (HRP) was prepared [38] and used as a detection antibody.
For the NfL assay, 2 monoclonal antibodies (clone 51A1 and clone 31A1) were raised against a recombinant human 68-kDa neurofilament protein (His tag) (#ab224840, abcam, Cambridge, UK). Antibody 51A1 was used as a capture antibody for NfL, and antibody 31A1 was processed into an Fab’-HRP fragment and used as a detection antibody in the NfL ELISA. Recombinant NfL was used as a standard protein.
Expression of antigens
Human p217tau protein was generated by a protein expression system. cDNA coding for the longest human isoform of tau441 was ligated into pcDNA3.4, and GSK3β cDNA was ligated into pCI-Neo (a gift from Dr. Akihiko Takashima), before the plasmids were cotransfected into the Expi293 Expression System (Thermo Fisher Scientific, Waltham, MA). Human p217tau was purified from the culture medium using 69A10 coupled with Affigel 10 beads (Code.1536099, BIO-RAD, Hercules, CA). The concentration of human p217tau was determined using a total tau ELISA.
Development of antibodies
Briefly, we immunized Wistar rats (Charles River, Wilmington, MA) against human tau peptides phosphorylated at threonine 217 (RTPSLPpTPPTRE) to produce antibodies against p217tau, and immunized BDF1 mice (Charles River) against the human tau441 (AG960) to produce E17A1 or the recombinant human 68-kDa neurofilament protein (His tag) (#ab224840) to produce 51A1 and 31A1. Then, harvested lymph node cells were fused with myeloma cells (X63-Ag8.653), cultured in HAT culture medium, and antibody-producing strains were selected via the limiting dilution method after 2 weeks. The following clones were selected: 1) The clone that produced antibody 69A10, which reacted with the p217tau peptide, but did not react with tau peptides that were phosphorylated at residue 205 (GSPGpTPGSRS) or residue 181 (APKpTPPSS) or tau peptides that were not phosphorylated at residue 217 (RTPSLPTPPTRE), residue 181 (APKTPPSS), or residue 205 (GSPGTPGSRS); 2) the clone that produced antibody E17A1, which reacted strongly with recombinant human tau441; and 3) the clones that produced antibodies 51A1 and 31A1, which reacted with human NfL, but did not react with human neurofilament heavy chain (NfH) or neurofilament medium chain (NfM). Four-parameter, dose-response, best-fit curves were drawn for 69A10 (R2 = 0.9989: Fig. 1a) and NfL (R2 = 0.9914; Fig. 1b) using GraphPad Prism based on the results of cross-reactivity tests.
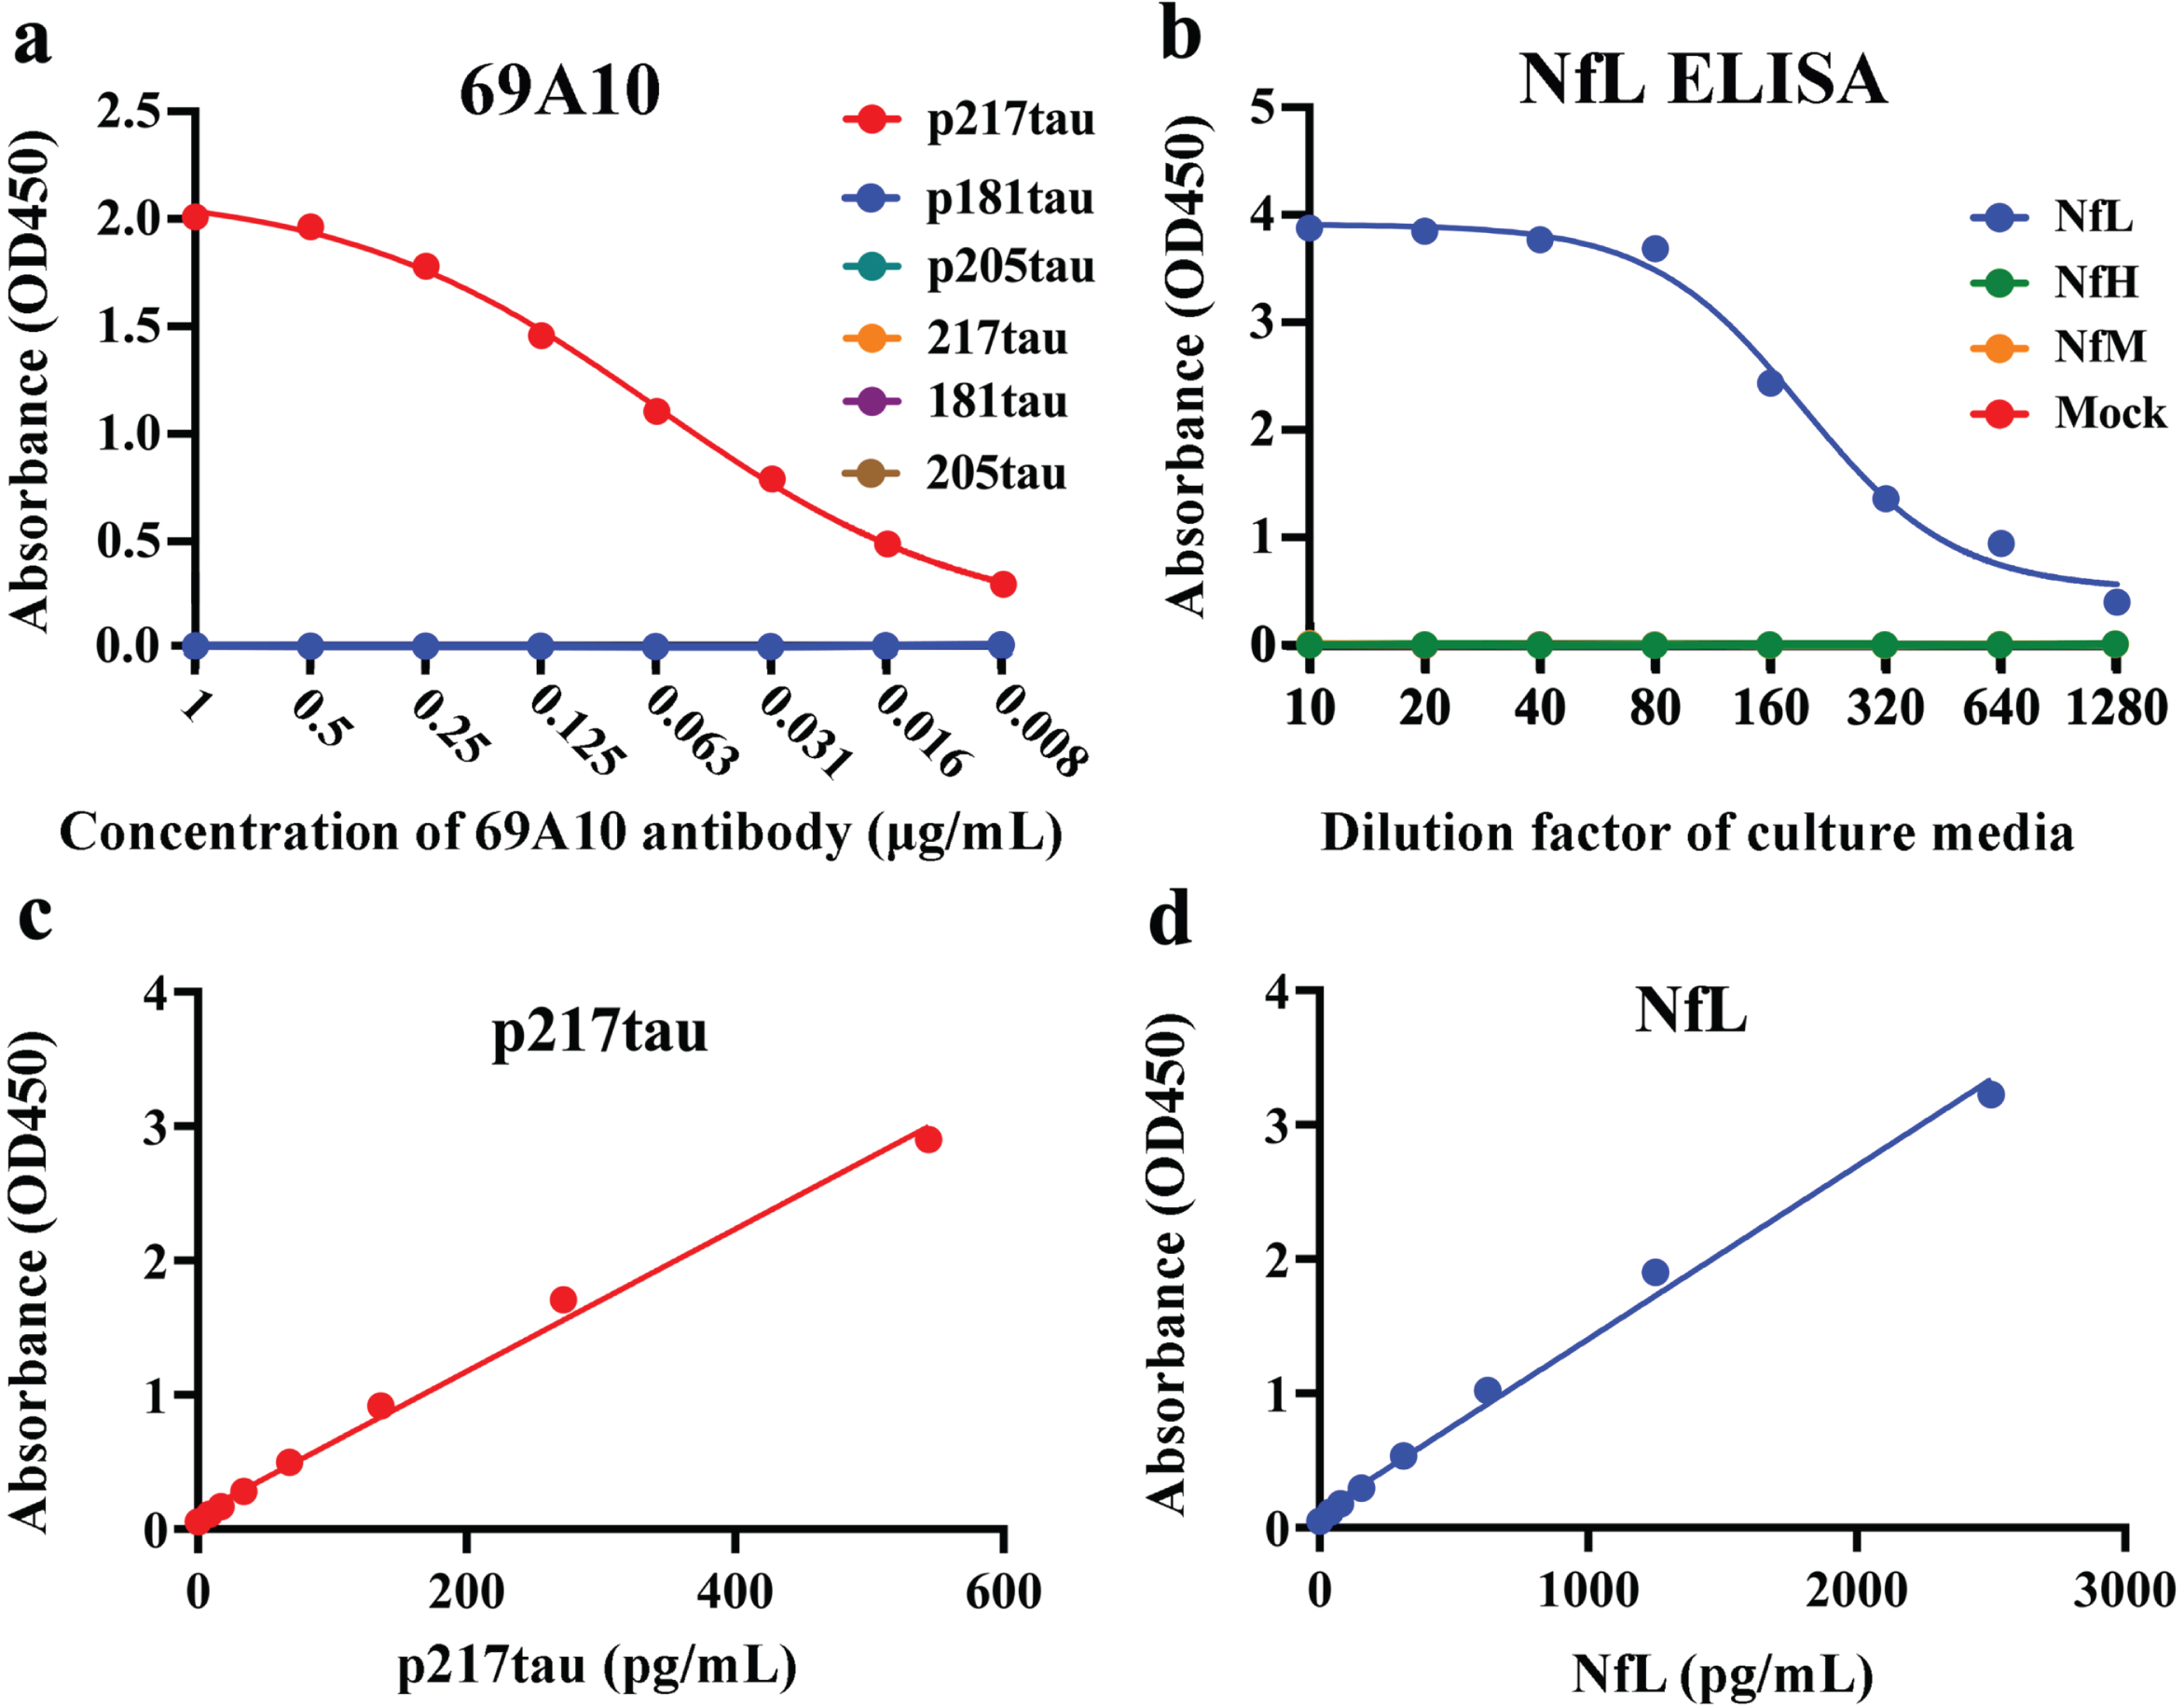
Basic profiles of the p217tau and NfL assays. a) Cross-reactivity test of the antibody 69A10 with tau peptides: p217tau (RTPSLPpTPPTRE; red), p181tau (APKpTPPSS; blue), p205tau (GSPGpTPGSRS; green), 217tau (RTPSLPTPPTRE; orange), 181tau (APKTPPSS; purple), and 205tau (GSPGTPGSRS; brown). The X-axis shows the concentration of antibody 6A10. b) Cross-reactivity test of the NfL ELISA with human NfL (blue) or human NfH (green) or NfM (orange). The X-axis shows the cultured media dilution factor adjusted for the respective protein expression level. c) Assay standard curve of the p217tau ELISA. d) Assay standard curve for the NfL ELISA.
ELISA protocol
A hundred μL of capture antibodies (10μg/mL) in 100 mM carbonate buffer (pH 9.5) was added to each of the 96 wells of an ELISA plate. The plate was incubated for 30∼36 h at 4°C for antibody coating and washed twice with phosphate-buffered saline (PBS; pH 7.4), before 200μL of PBS containing 1% bovine serum albumin (BSA) was added for 1 h for blocking. After discarding the blocking solution, 100μL of standard proteins or 100μL CSF mixed with 100μL of diluent buffer (1% BSA in PBS, 0.05% Tween20, 0.05% Proclin300 [Sigma-Aldrich, St. Louis, MO], and 50μg/mL normal mouse IgG) was added to each well, before the plate was incubated overnight at 4°C. After washing was performed 4 times with PBS, 100μL of peroxidase-labeled detection Fab’ antibodies were added to each well. The plate was incubated for 30 min at 4°C. After washing the plate 5 times with PBS, 100μL of peroxidase substrate solution (TMB PLUS2® Cat. No. 4395, Kementec, Denmark) was added. After incubation for 30 min, 100μL of 1.5 N sulfuric acid was added to stop the reaction. The optical density values were measured at a wavelength of 450 nm (SpectraMax® ABS, SoftMax Pro 7.1.2, Molecular Devices, CA). The standard curve of the p217tau ELISA exhibited the following equation: Y = 0.0053X+0.1148 (R2 = 0.9934). The assay sensitivity and range values were 3.8 pg/mL and 9.2∼590 pg/mL, respectively (Fig. 1c). The standard curve of the NfL ELISA exhibited the following equation: Y = 0.001288X+0.1163 (R2 = 0.9929). The assay sensitivity and range values were 6.2 pg/mL and 39.1∼2500 pg/mL, respectively (Fig. 1d).
Statistical analyses
Regression analyses were carried out to test for correlations between the ELISA results and age-dependent changes. Since normality tests (the D’Agostino & Pearson, Anderson-Daring, Shapiro-Wilk, and Kolmogorov-Smirnov tests) and normal QQ plot analysis showed that the data were not normally distributed, the Kruskal-Wallis test for non-parametric data was used. There were 8 degrees of freedom in Fig. 1a-d, and 2 degrees of freedom in Fig. 2a-d, and p < 0.0001. Dunn’s multiple comparisons test was adopted as a post-hoc test for the comparisons with the HCU. Compared with the HCU, there were no differences in the sex distribution of any disease group, but the age distribution of the MS group differed significantly. The results of the statistical analyses are shown in Table 1. Since F-values were not calculated in the Kruskal-Wallis test, both the number of degrees of freedom and the p-value are shown for each result. Area under the receiver operator characteristic curve (ROC) analysis was carried out to assess the diagnostic utility of CSF biomarkers for discriminating between the AD patients and the HCU, and between AD and the other neurological diseases. The optimal cut-off value for each CSF marker was selected based on the likelihood ratio [sensitivity/(1-specificity)] [39]. The Mann-Whitney test and Fisher’s exact test were used for comparisons between 2 groups. All tests were two-tailed and performed with GraphPad Prism, version 9 (GraphPad Software, San Diego, CA), or R, version 3.5.1, and the statistical significance level was set at 5%.
RESULTS
Measurement of p217tau
The AD patients exhibited significantly higher CSF p217tau levels than the HCU (p < 0.0001, Table 1, Fig. 2a). CSF p217tau levels increased significantly according to the progression of AD: ADCU (p < 0.005 compared with the HCU)<ADMCI (p < 0.0001)<ADD (p < 0.0001) (Fig. 3a). No significant increases in CSF p217tau levels were observed in the other neurological diseases examined or the HCU (Fig. 2a). The intra- and inter-assay coefficients of variation (CV) of the p217tau ELISA were 2.0% and 7.0%, respectively.
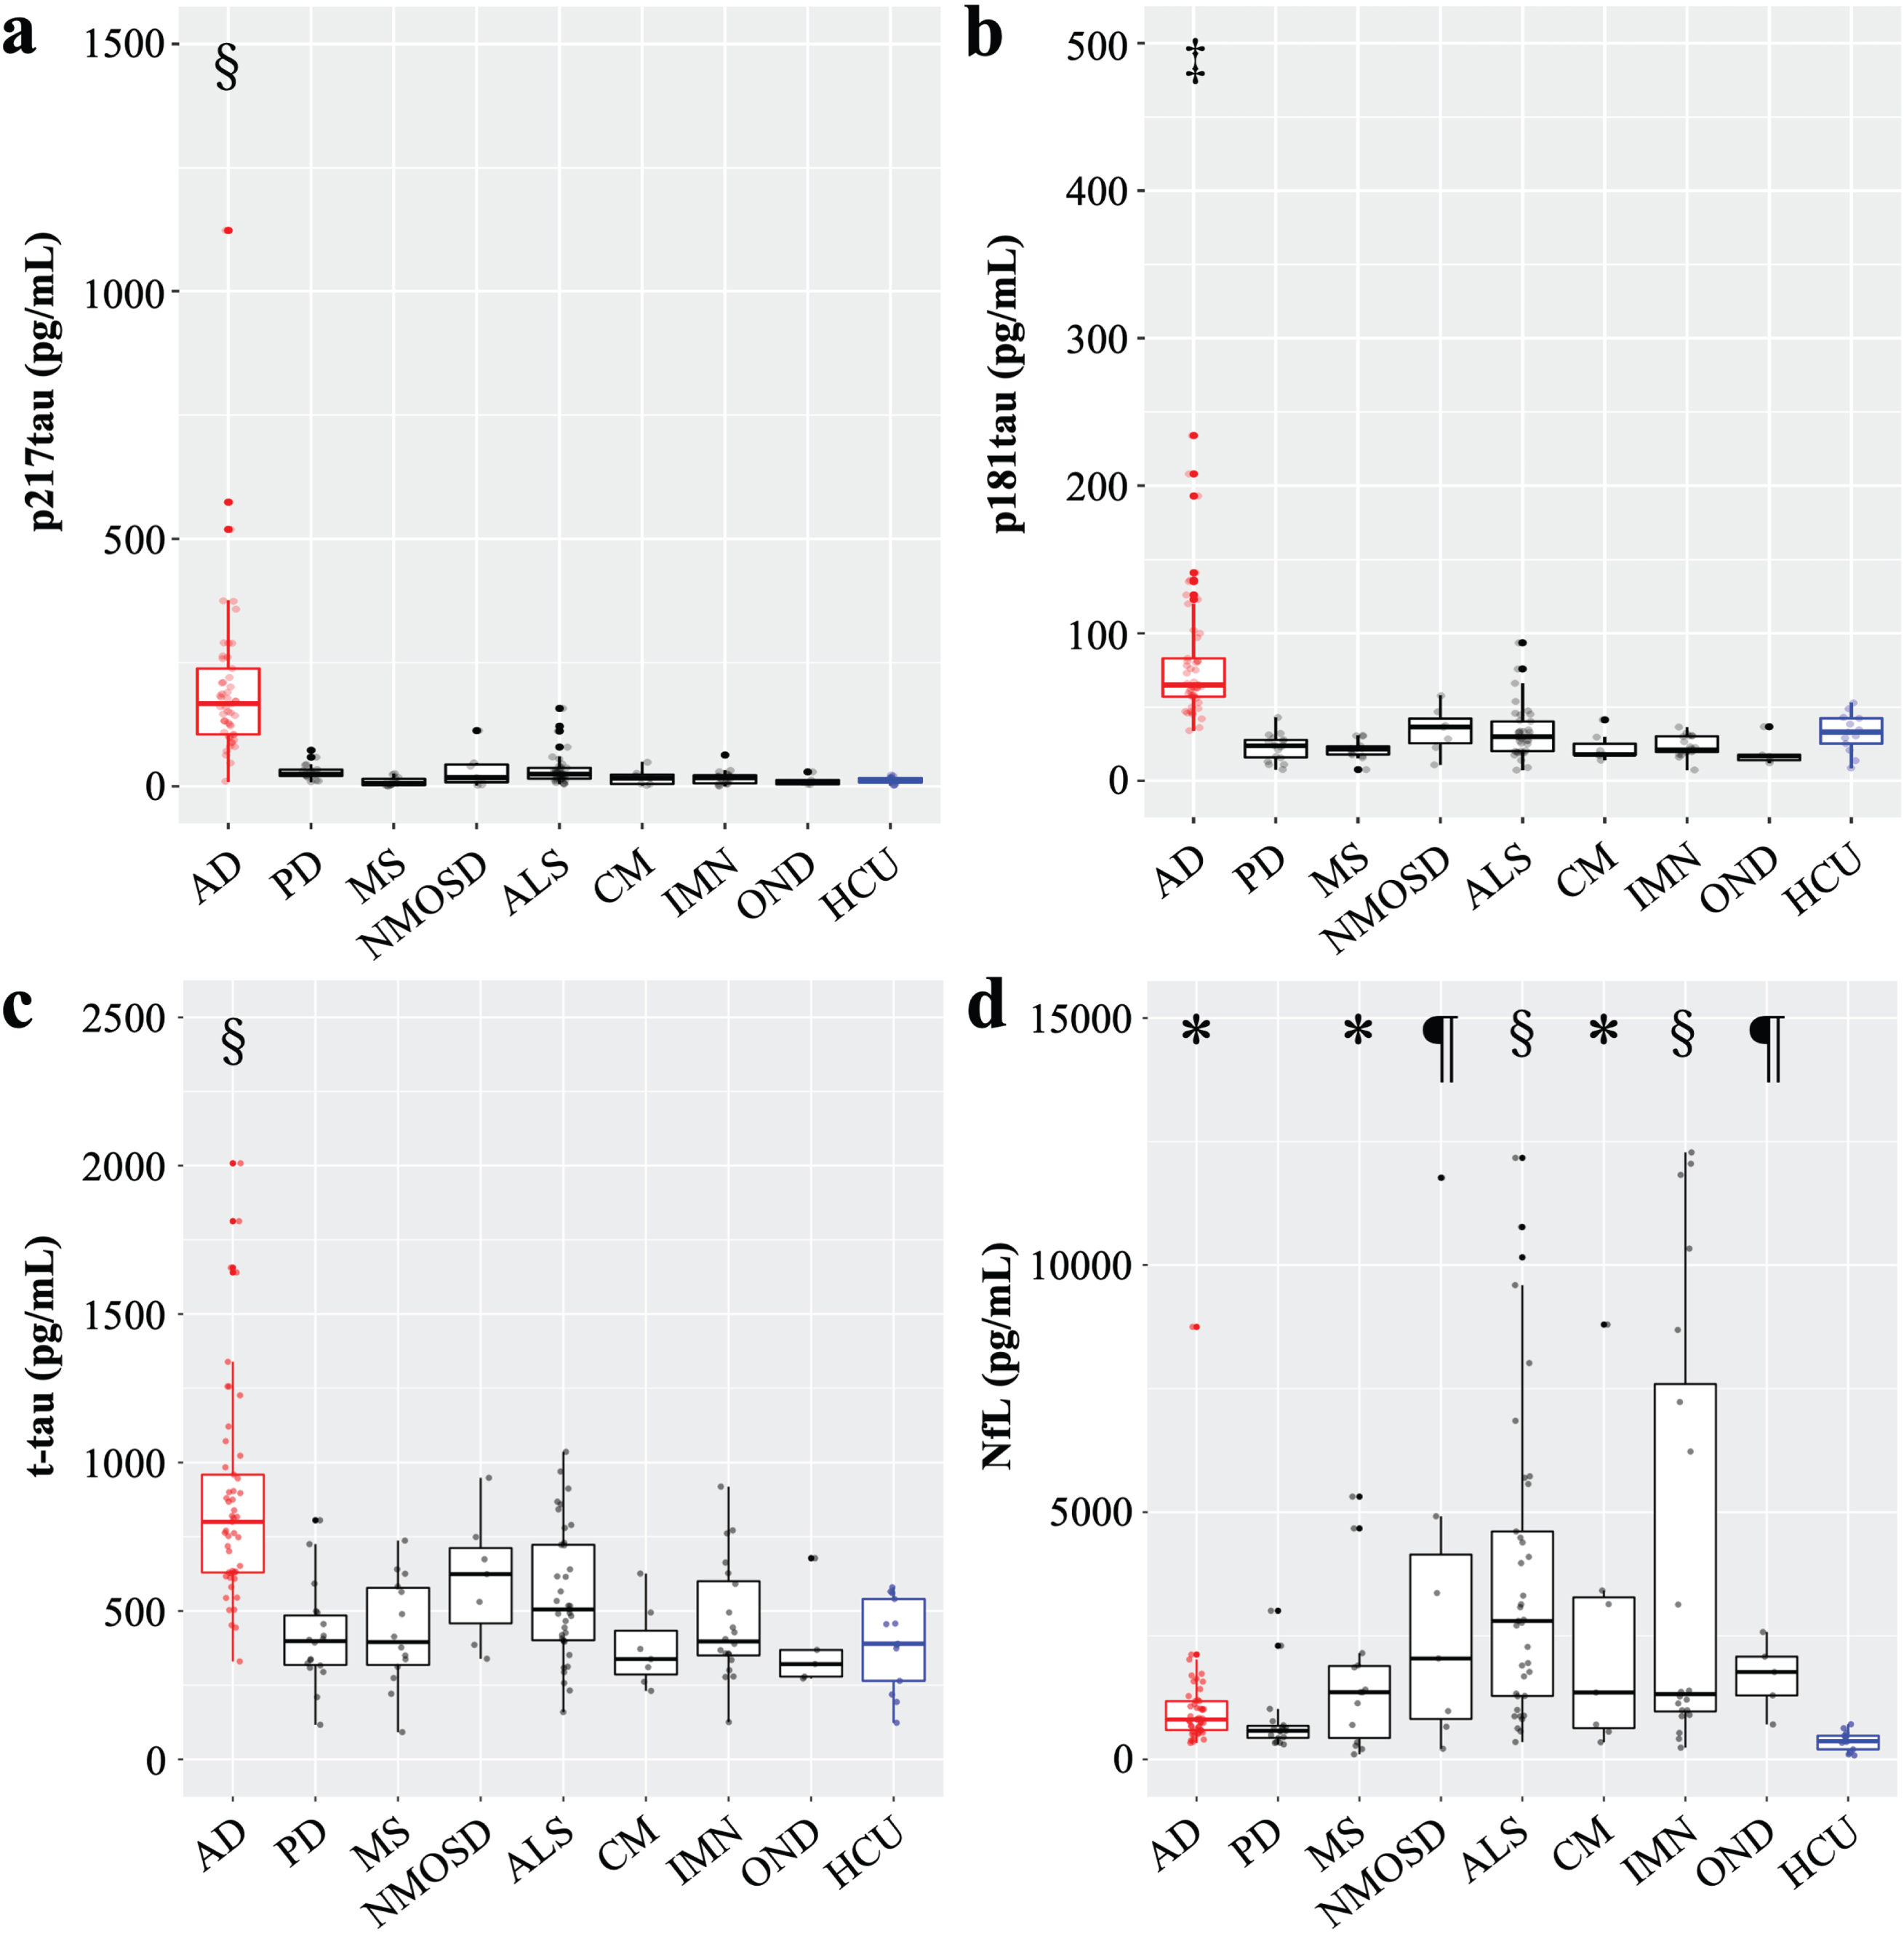
CSF phosphorylated-tau, total tau, and neurofilament light chain levels in various neurological diseases. a) The CSF p217tau level; b) The CSF p181tau level; c) The CSF t-tau level; d) The CSF NfL level; In the comparisons shown in a-d, the Kruskal-Wallis test was used, there were 8 degrees of freedom, and p < 0.0001. Dunn’s multiple comparisons test was used for post-hoc testing in the comparisons with the HCU. *p < 0.05, ¶p < 0.01, ‡p < 0.001, §p < 0.0001.
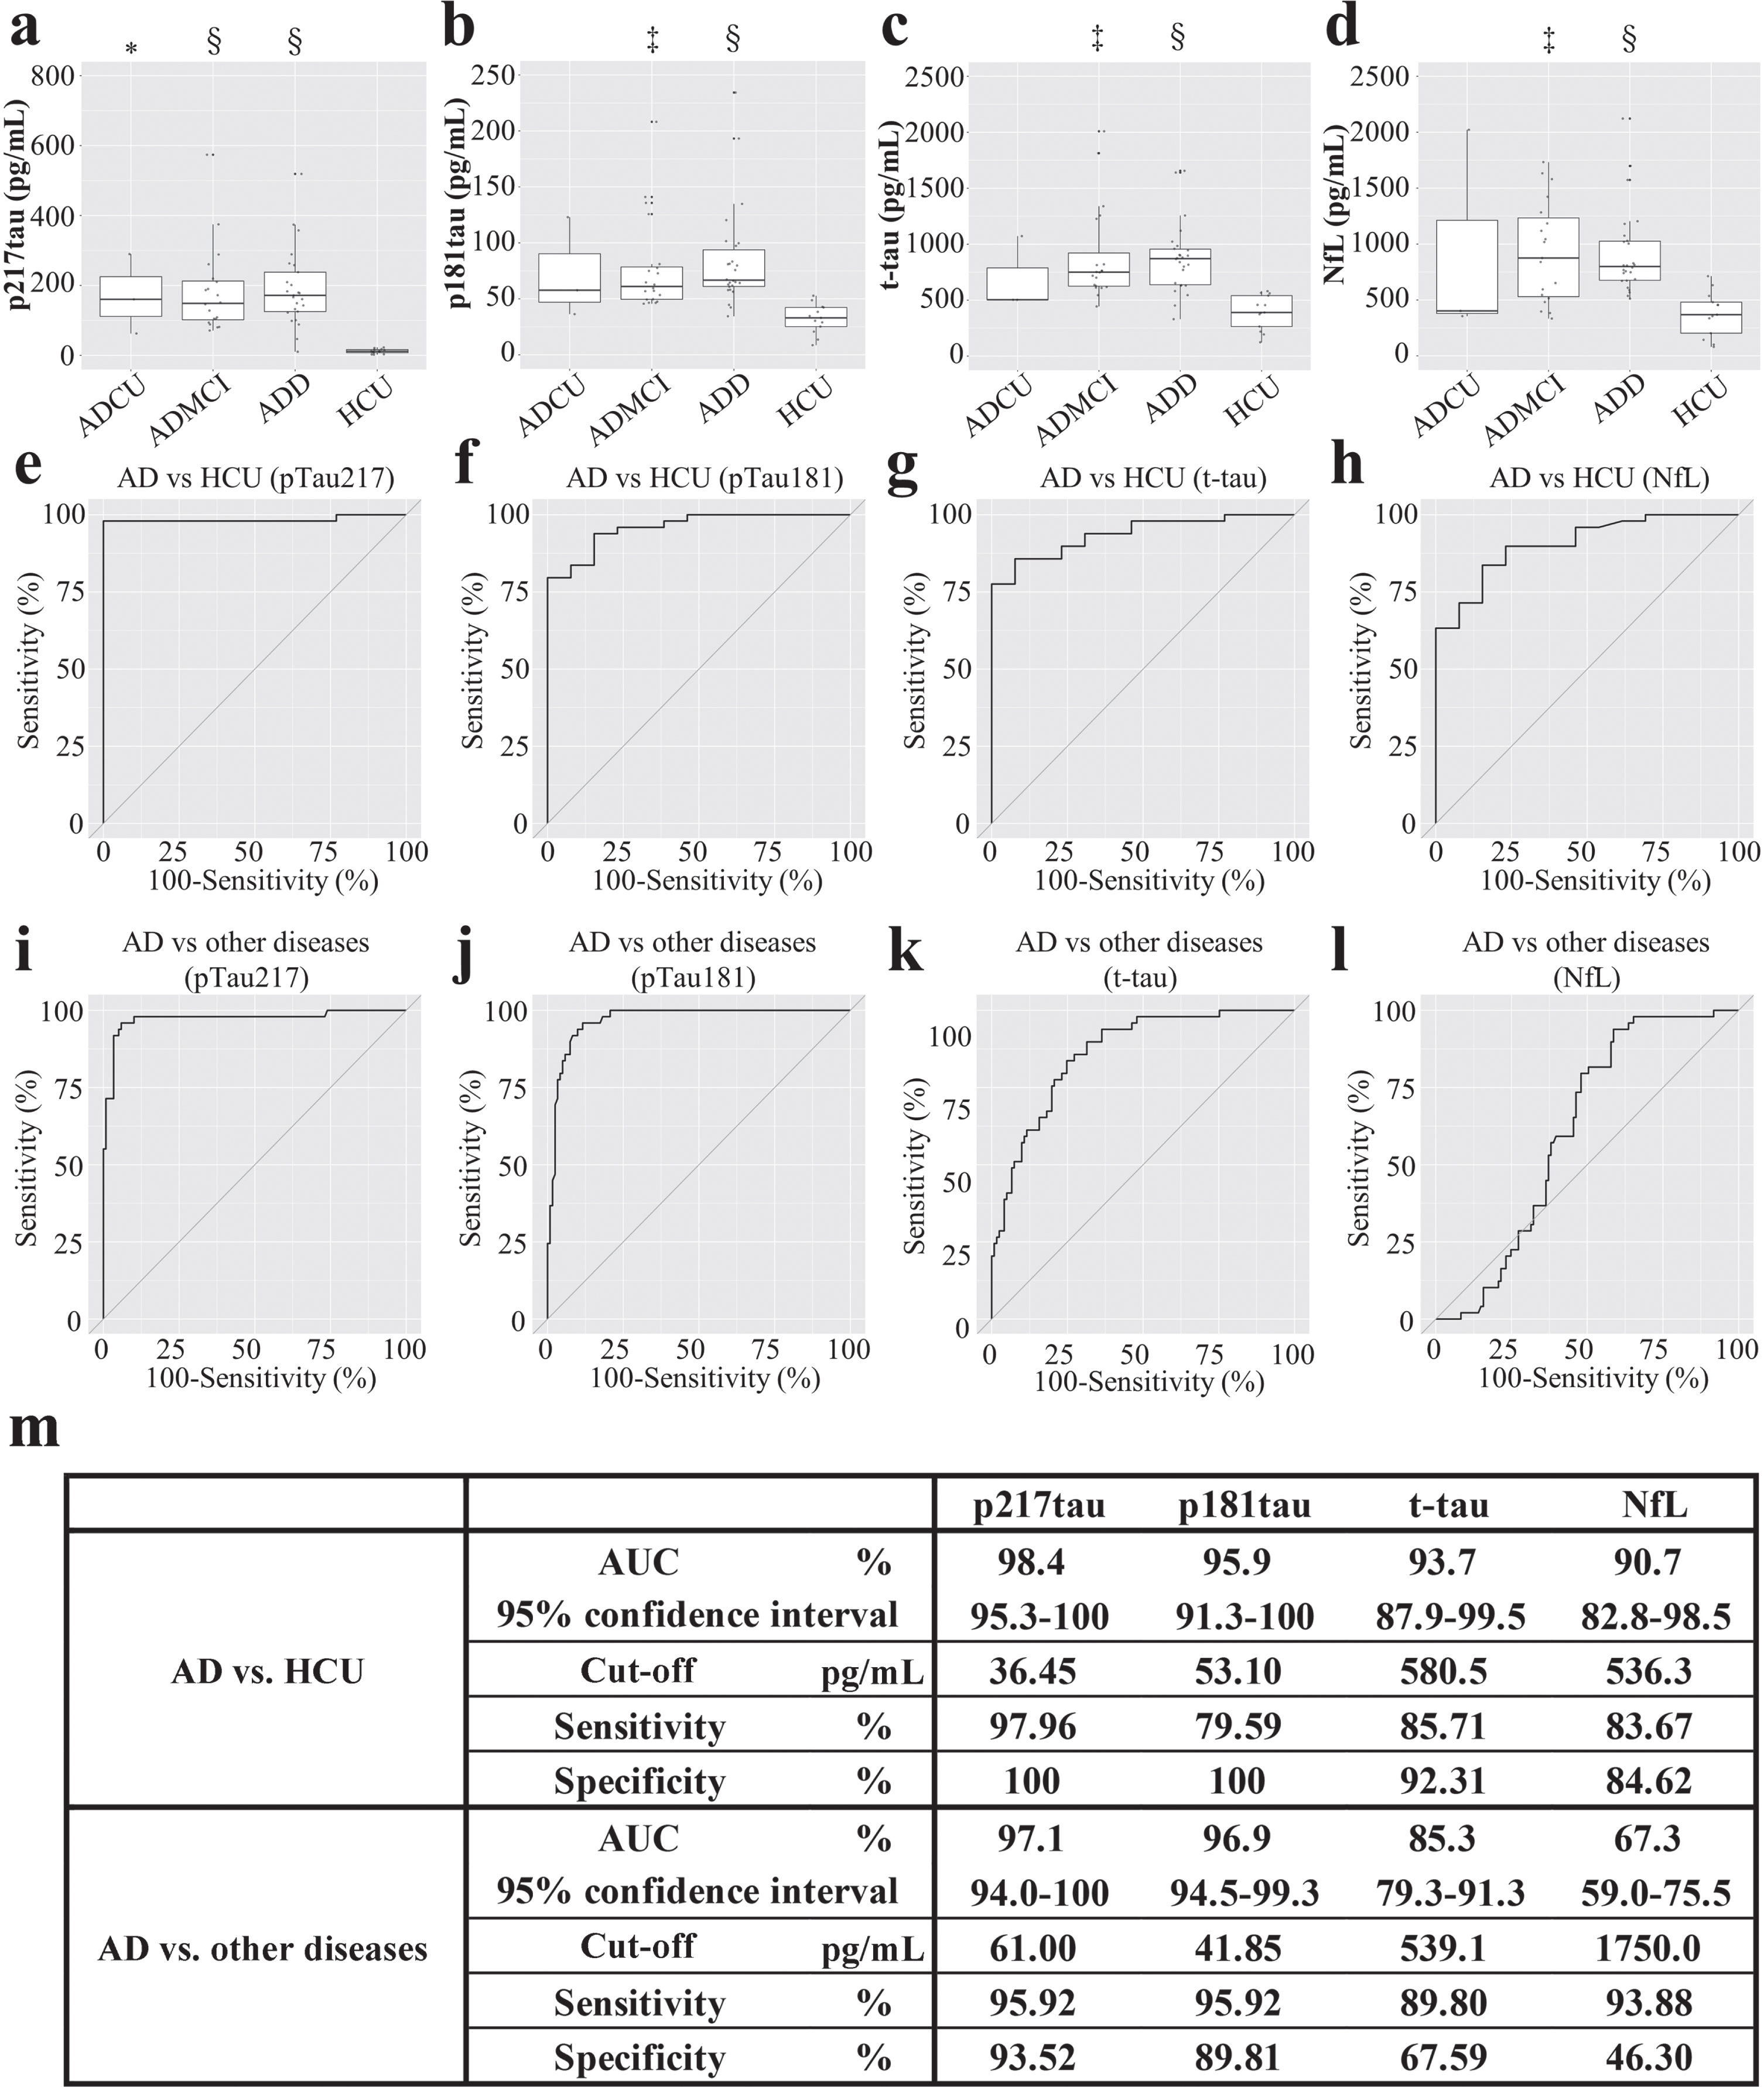
CSF phosphorylated-tau, total tau, and neurofilament light chain levels of AD patients. a) The CSF p217tau levels of the ADCU (170.9±114.0 pg/mL), ADMCI (181.8±121.9 pg/mL), and ADD (226.5±212.3 pg/mL) patients. b) CSF p181tau levels of the ADCU (72.3±45.1 pg/mL), ADMCI (77.8±42.5 pg/mL), and ADD (84.2±44.9 pg/mL) patients. c) CSF t-tau levels of the ADCU (693±359 pg/mL), ADMCI (890±422 pg/mL), and ADD (869±308 pg/mL) patients. d) CSF NfL levels of the ADCU (926±949 pg/mL), ADMCI (1319±1804 pg/mL), and ADD (1191±1316 pg/mL) patients; The Kruskal-Wallis test was used, there were 2 degrees of freedom, and p < 0.0001. *p < 0.05, ‡p < 0.001, §p < 0.0001; ADCU, cognitively unimpaired stage of AD; ADMCI, mild cognitive impairment due to AD; ADD, dementia due to AD; e-h) ROC curve for differentiating AD patients from the HCU; i-l) ROC curve for differentiating AD from other neurological diseases. m) The area under the ROC curve (AUC), cut-off values were selected based on the likelihood ratio, and the associated sensitivity and specificity values.
Measurement of p181tau
Significantly higher CSF p181tau levels were observed in the AD patients than in the HCU (p < 0.001; Table 1, Fig. 2b). Specifically, significantly higher CSF p181tau levels were seen in the ADMCI (p < 0.001) and ADD (p < 0.0001; Fig. 3b) patients than in the HCU. No significant increases were observed in the other neurological diseases examined (Fig. 2b).
Measurement of t-tau
Significantly higher CSF t-tau levels were seen in the AD patients than in the HCU (p < 0.0001, Table 1, Fig. 2c). Specifically, significantly increased CSF t-tau levels were observed in the ADMCI (p < 0.001) and ADD (p < 0.0001) patients, but there was no significant difference between the CSF t-tau levels of these 2 groups (Fig. 3c). No significant increases were observed in the other neurological diseases examined (Fig. 2c).
Measurement of NfL
Significantly higher CSF NfL levels were seen in the AD patients than in the HCU (p < 0.05, Table 1, Fig. 2d). Specifically, significantly higher CSF NfL levels were seen in the ADMCI (p < 0.001) and ADD (p < 0.0001) patients than in the HCU (Fig. 3d). Among the other neurological diseases examined, significantly higher CSF NfL levels were observed in MS (p < 0.05), NMOSD (p < 0.01), ALS (p < 0.0001), CM (p < 0.05), IMN (p < 0.0001), and OND (p < 0.01) than in the HCU (Fig. 2d). The intra- and inter-assay CV were 2.4% and 9.7%, respectively.
ROC analysis of biomarker utility for diagnosing AD
In a comparison between the AD patients and HCU, the area under the ROC curve (AUC) was 0.98 for p217tau, 0.96 for p181tau, 0.94 for t-tau, and 0.91 for NfL. The optimal cut-off points and associated sensitivity and specificity for differentiating AD patients from HCU were 36.45 pg/mL, 97.96%, and 100% for p217tau; 53.10 pg/mL, 79.59%, and 100% for p181tau; 580.5 pg/mL, 85.71%, and 92.31% for t-tau; and 536.3 pg/mL, 83.67%, and 84.62% for NfL, respectively. p217tau discriminated between the AD patients and HCU most effectively (Fig. 3e-h). Analyses of the abilities of these biomarkers to differentiate between AD and other neurological diseases showed that the AUC values of p217tau, p181tau, t-tau, and NfL were 0.97, 0.97, 0.85, and 0.67, respectively. The optimal cut-off points and associated sensitivity and specificity for differentiating AD from other neurological diseases were 61.00 pg/mL, 95.92%, and 93.52% for p217tau; 41.85 pg/mL, 95.92%, and 89.81% for p181tau; and 539.1 pg/mL, 89.8%, and 67.59% for t-tau, respectively. The equivalent values for NfL were 1750 pg/mL, 93.88%, and 46.3%, respectively (Fig. 3i-l). Thus, p217tau is superior to the other biomarkers for diagnosing AD, and NfL could not discriminate AD from other neurological diseases efficiently.
Age-dependent changes in p217tau, p181tau, t-tau, and NfL levels
The CSF levels of p217tau, p181tau, t-tau, and NfL increased age-dependently in the HCU; p217tau: Y = 0.4198X –1.689, coefficient of determination (R2) = 0.4866, p < 0.01; p181tau: Y = 0.5090X+3.437, R2 = 0.6533, p < 0.001; t-tau: Y = 5.005X+109.0, R2 = 0.4606, p = 0.01 (Fig. 4a); and NfL: Y = 7.884X –73.86, R2 = 0.6768, p < 0.0001 (Fig. 4b). The magnitudes of the age-dependent rates of increase in the CSF levels of these biomarkers demonstrated the following pattern: NfL > t-tau > p181tau > p217tau.
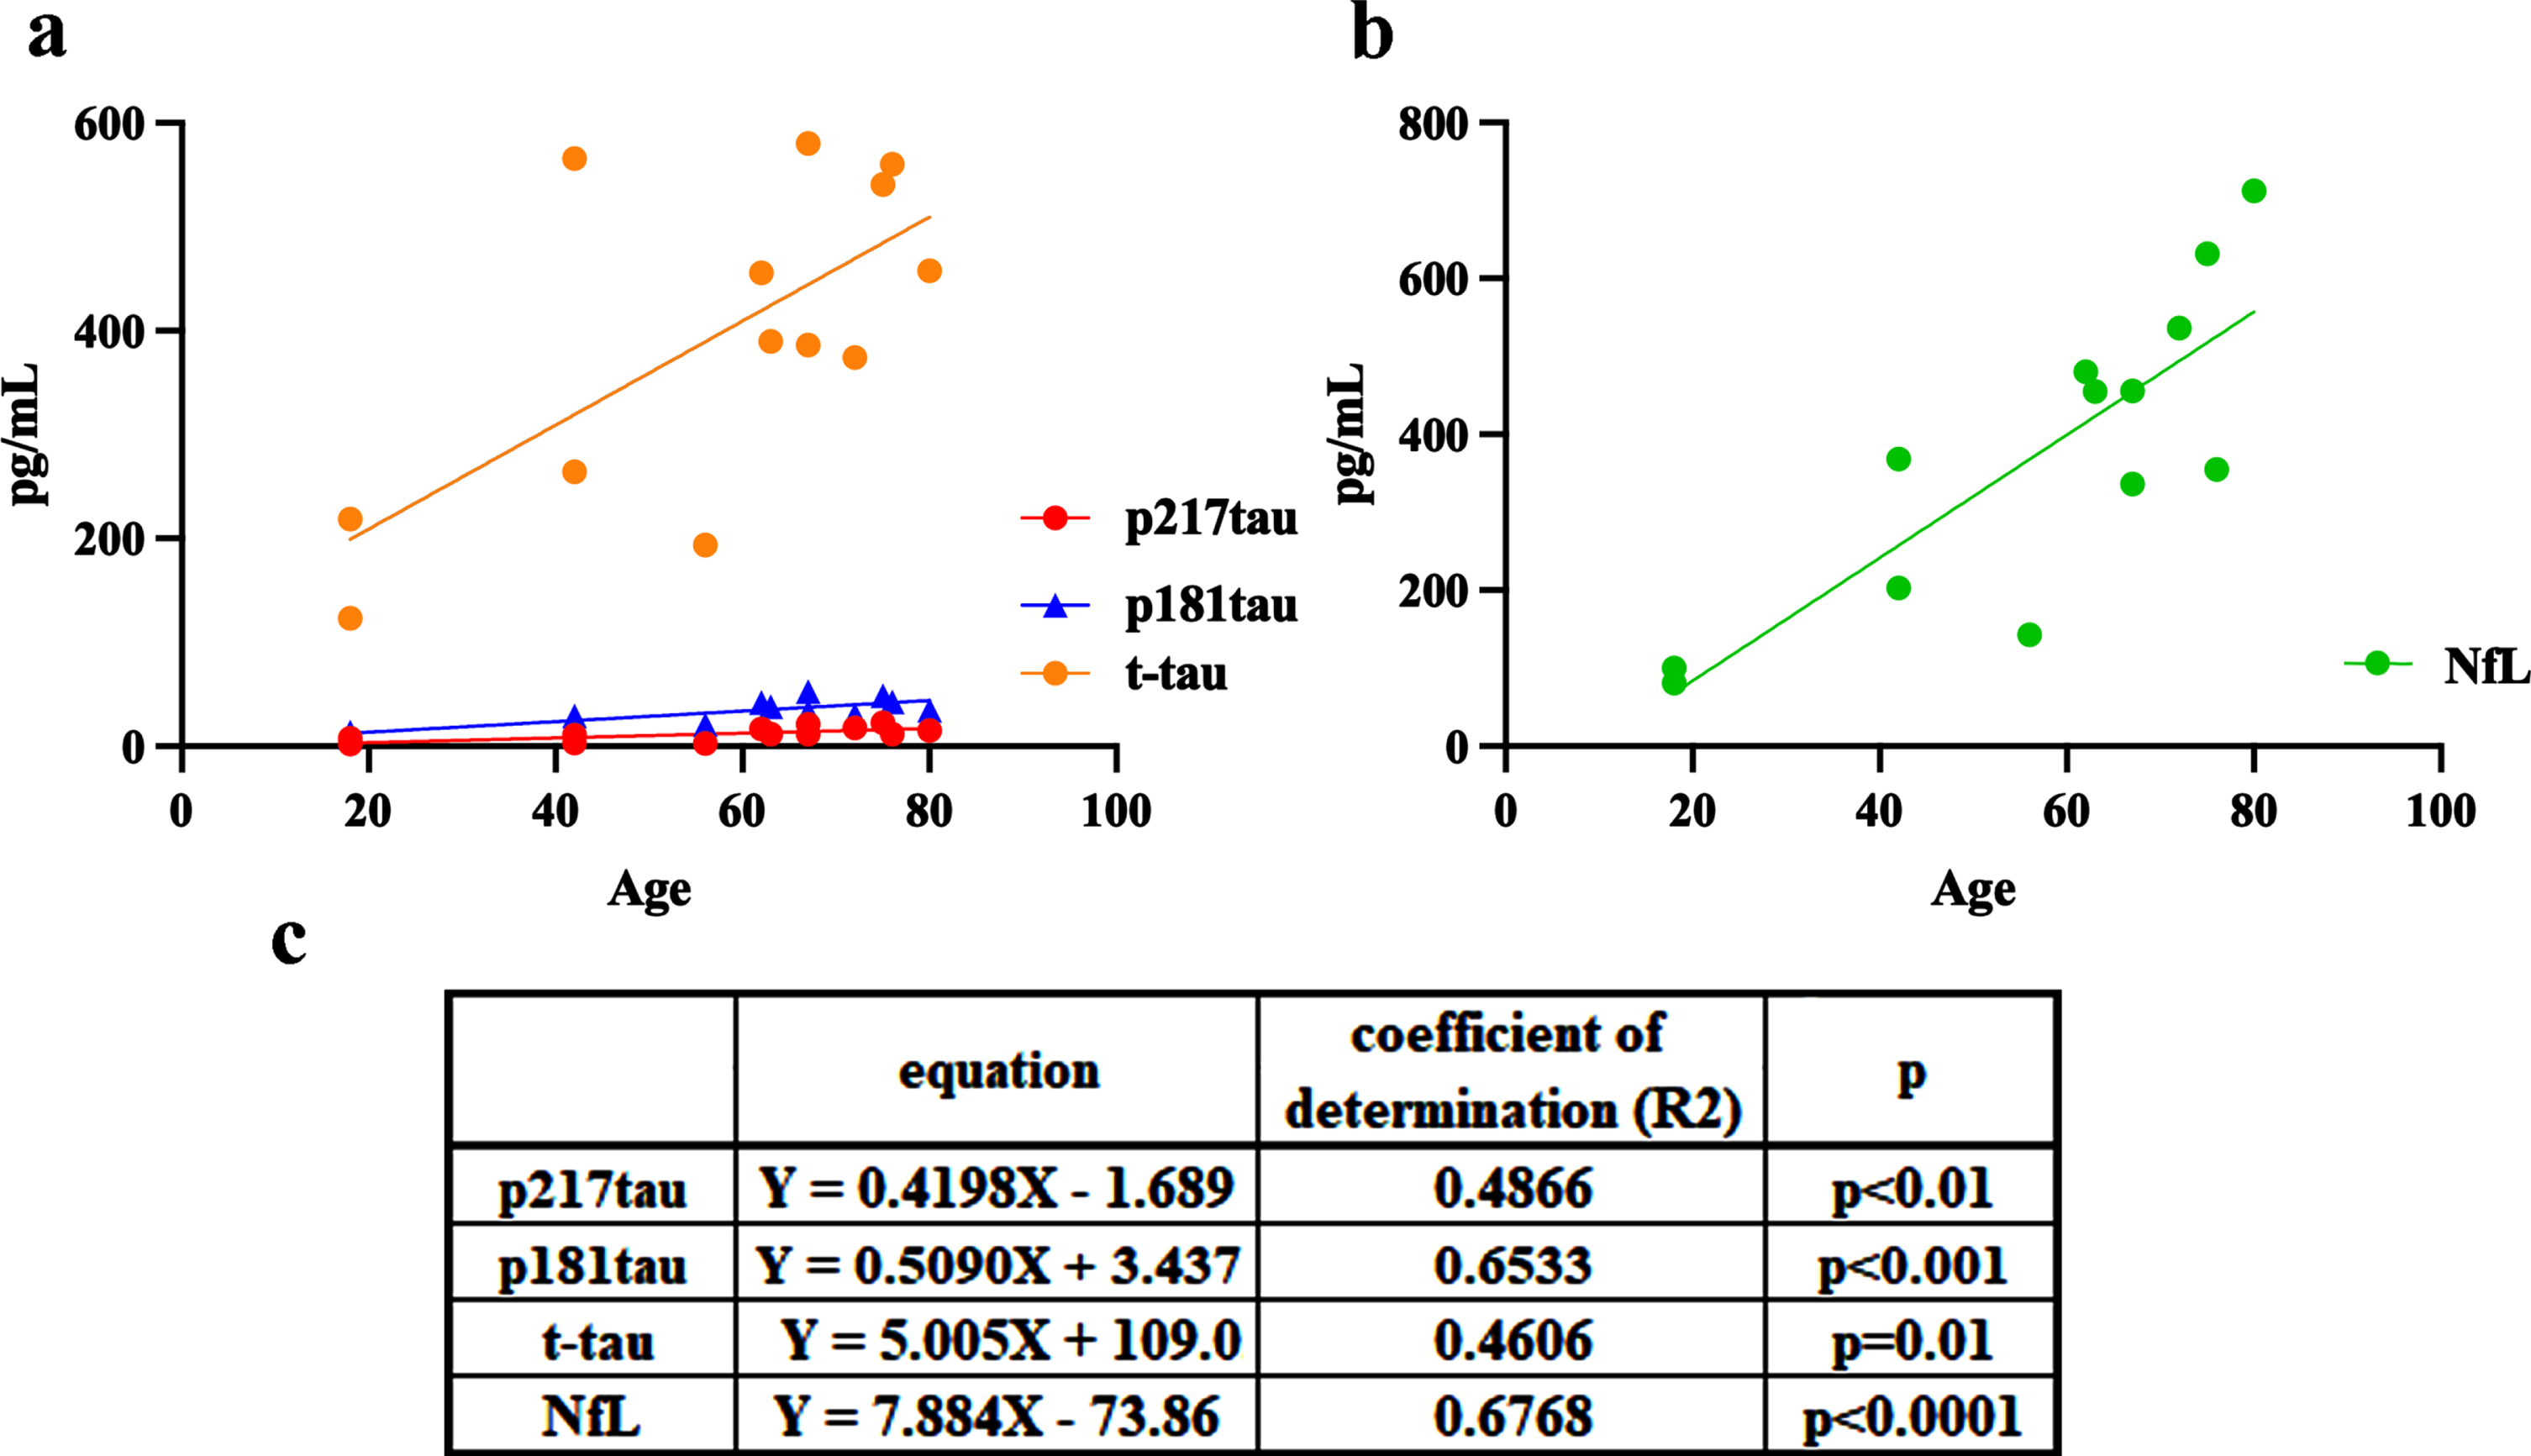
Age-related changes in CSF p217tau (red), p181tau (blue), t-tau (orange), and NfL (green) levels in the healthy and cognitively unimpaired control (HCU) group. c) The equations and coefficients of determination.
The phospho-protein/total protein ratios (p217tau/t-tau and p181tau/t-tau)
The percentage of tau that was phosphorylated at position 217 was 3.0±1.2% in the HCU, 23.8±10.1% in the ADCU patients, 20.5±7.5% in the ADMCI patients, and 24.4±13.7% in the ADD patients. The percentage of tau that was phosphorylated at position 181 was 8.3±1.6% in the HCU, 10.0±2.4% in the ADCU patients, 8.9±2.0% in the ADMCI patients, and 9.6±2.2% in the ADD patients. The percentage of p217tau compared with that of p181tau was inverse between the HCU and AD patients and was 7-fold higher in the AD patients (20.5∼24.4%) than in the HCU (3%). In contrast, the ratio of p181tau to t-tau did not differ markedly among the HCU and the ADCU, ADMCI, and ADD patients, varying from 8.3∼10%. In the other examined neurological diseases, the percentage of tau that was phosphorylated at position 217 was 7.7±3.6% in PD, 2.6±2.9% in MS, 5.0±5.0% in NMOSD, 5.9±3.9% in ALS, 4.3±3.2% in CM, 3.7±2.6% in IMN, and 2.7±1.5% in OND. The percentage of tau that was phosphorylated at position 181 was 5.8±1.9% in PD, 5.7±2.1% in MS, 5.7±1.7% in NMOSD, 6.1±1.9% in ALS, 6.5±2.4% in CM, 5.6±2.0% in IMN, and 5.0±0.5% in OND, indicating that the ratio of p181tau to t-tau was almost the same in these neurological diseases as it was in the HCU. Thus, the phosphorylation of tau at threonine 217 and 181 showed contrasting dynamics in AD and the examined neurological diseases (Fig. 5a).
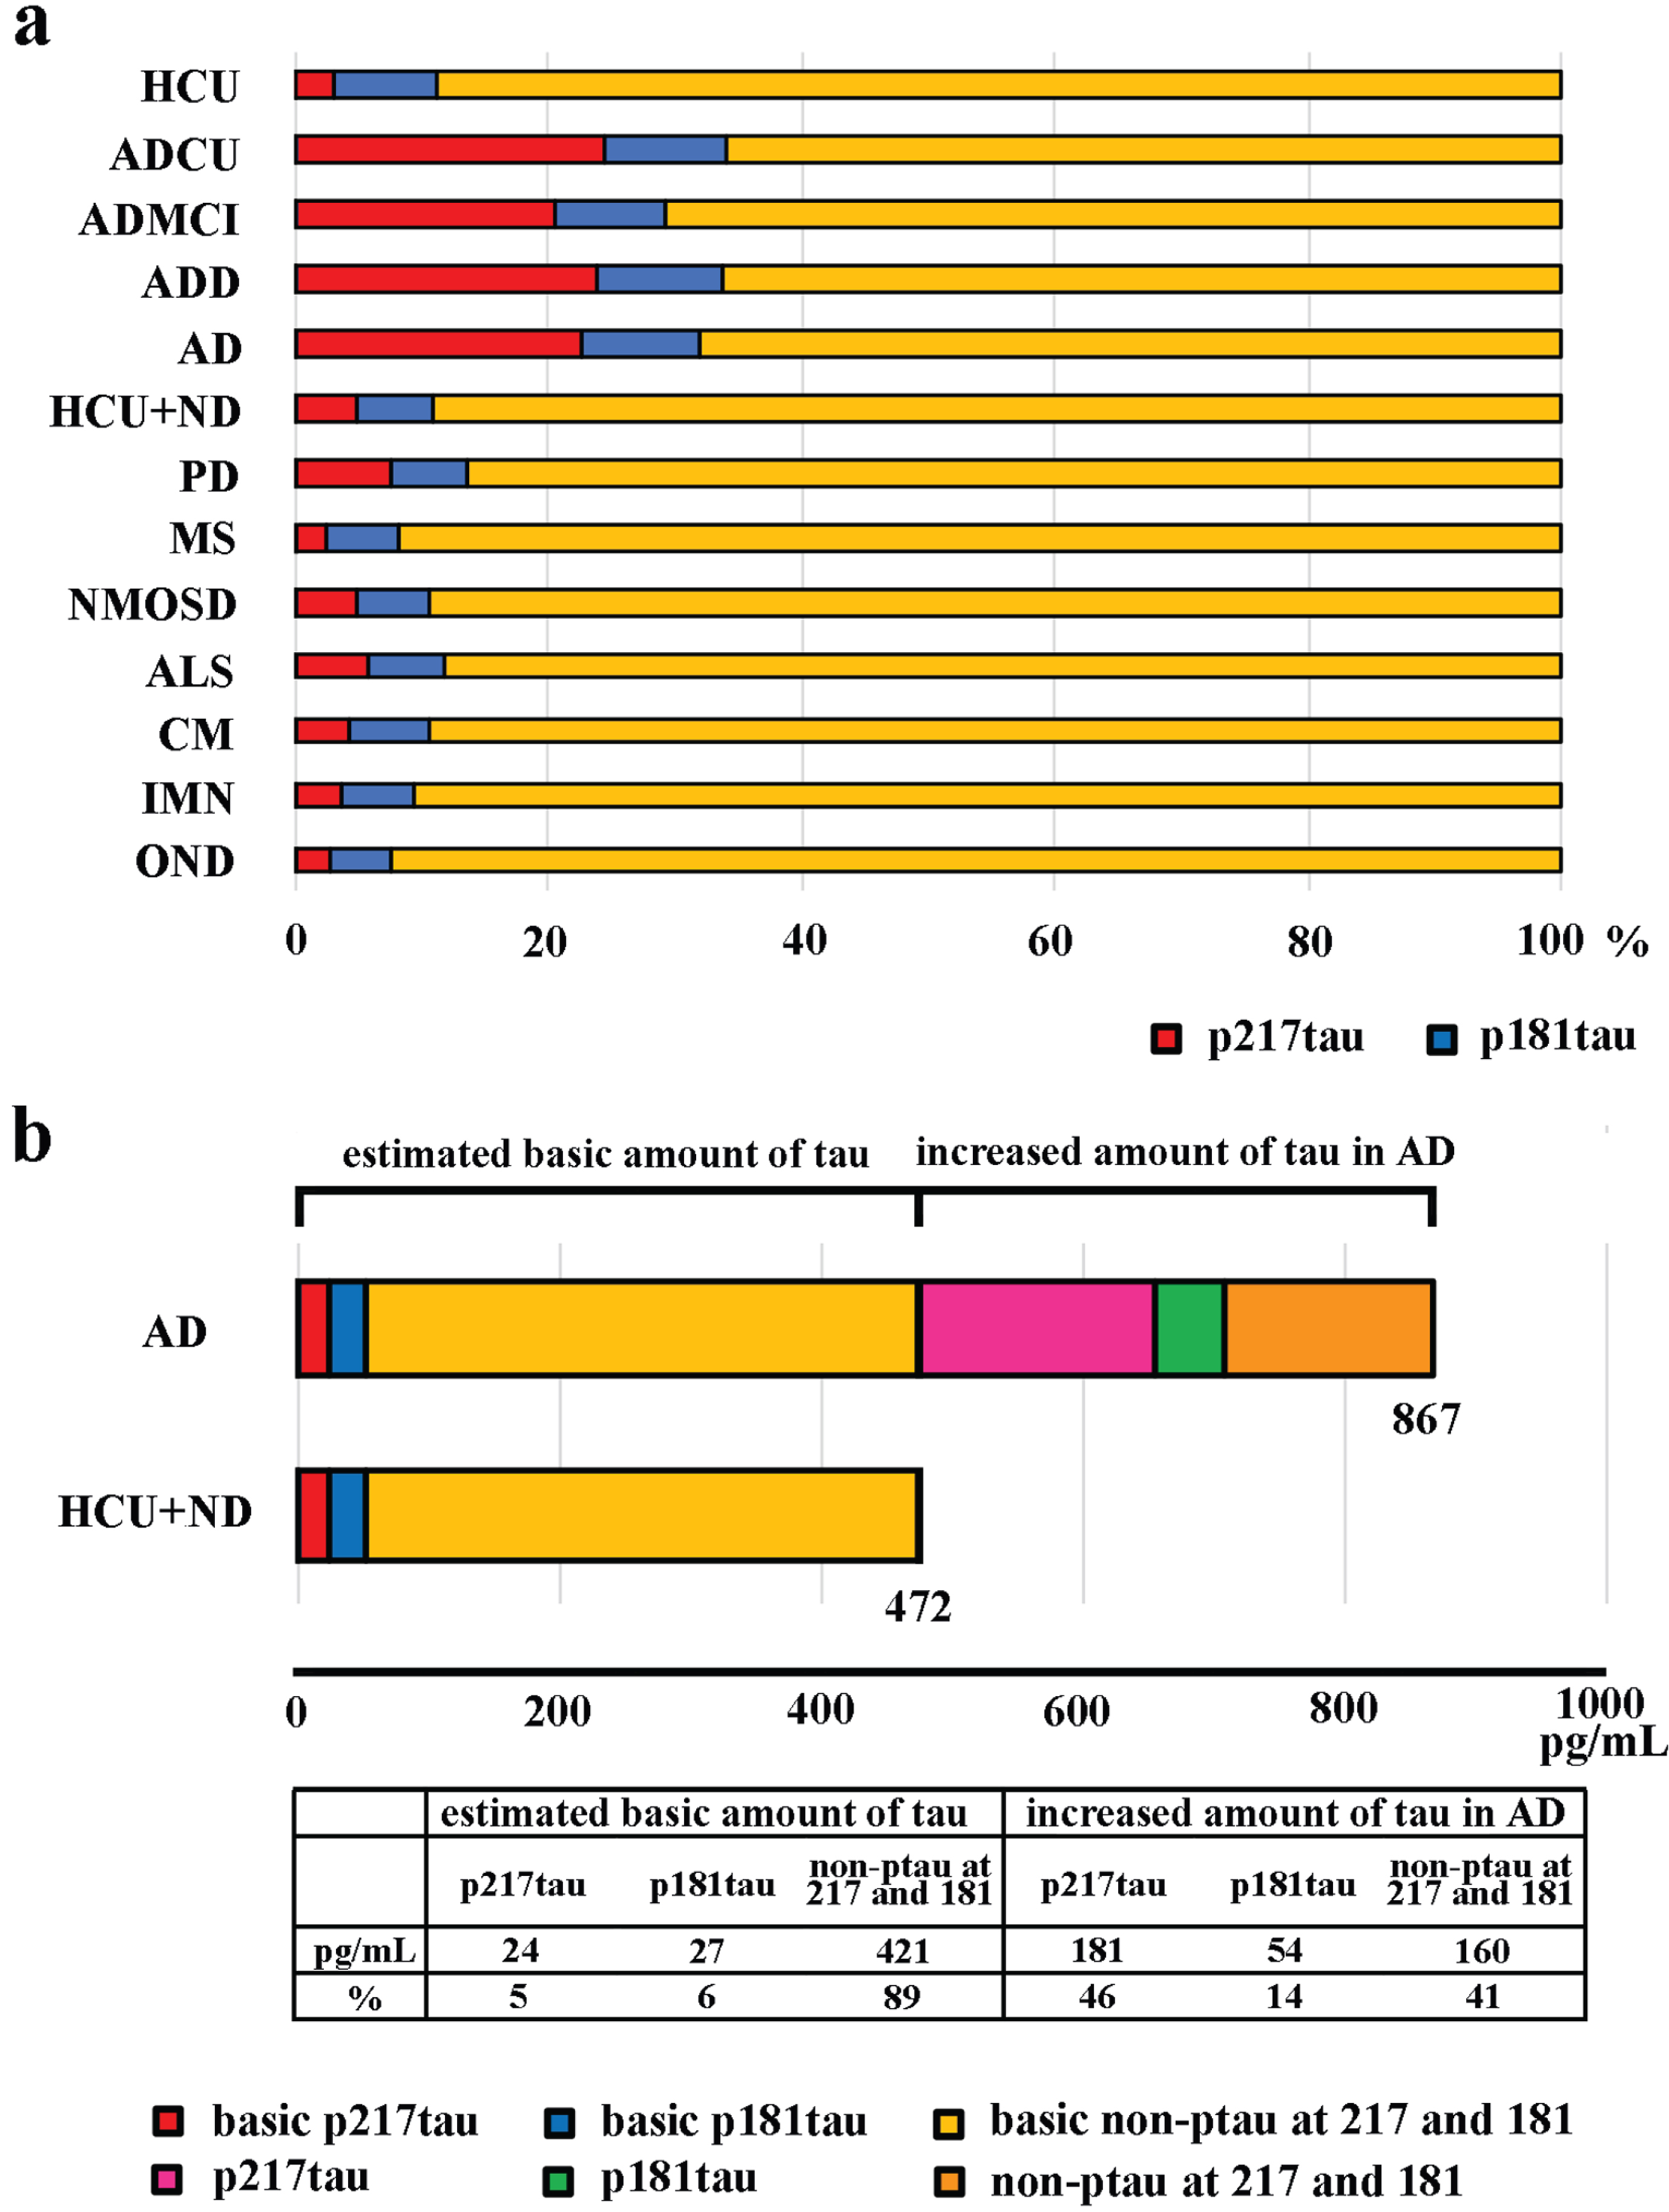
Phospho-protein/total protein ratios (p217tau/t-tau and p181tau/t-tau). a) The percentages of p217tau (red) and p181tau (blue) among t-tau (yellow) in the HCU, each AD stage, AD, and other neurological diseases; ND, neurological diseases other than AD. b) Phosphorylated proportions of the estimated baseline level of t-tau in CSF in the HCU+ND (472 pg/mL) group and the extra CSF t-tau seen in the AD patients (867 pg/mL); The red and blue portions indicate the percentage phosphorylation at the 217 and 181 sites, respectively. The pink and green portions indicate the percentage phosphorylation at the 217 and 181 sites, respectively, among the extra t-tau seen in the CSF of the AD patients.
Next, we estimated the amount of tau in the CSF under non-AD conditions [40, 41] and the percentages of phosphorylation at sites 217 and 181. We also estimated the amount of tau present in the CSF due to AD and the percentages of phosphorylation at sites 217 and 181 for this tau (Fig. 5b). The first set of parameters were estimated as the mean CSF levels of t-tau, p217tau, and p181tau seen in the HCU+the patients with other neurological diseases, which showed that the mean CSF t-tau level was 472 pg/mL and included 24 pg/mL of p217tau and 27 pg/mL of p181tau (Fig. 5b; HCU+ND). It was estimated that AD increased the amount of t-tau in the CSF by 395 pg/mL (867-472 pg/mL). Of this, about 46% was phosphorylated at the 217 site, and 14% was phosphorylated at the 181 site (Fig. 5b).
The p217tau to p181tau ratio was 2.29±0.53 in ADCU, 2.26±0.56 in ADMCI, 2.57±1.51 in ADD, 2.43±1.16 in AD, 1.48±1.01 in PD, 0.49±0.50 in MS, 0.96±0.85 in NMOSD, 1.07±0.78 in ALS, 0.79±0.63 in CM, 0.70±0.47 in IMN, 0.52±0.26 in OND, and 0.36±0.06 in the HCU. These findings indicated that, compared with the levels observed in the HCU and the patients with other neurological diseases, the increase in the CSF p217tau level seen in the AD patients was 2-fold higher than the equivalent increase in the CSF p181tau level. Thus, the main AD-induced CSF alteration was an increase in the CSF p217tau level.
Changes in NfL levels seen in clinical subtypes of ALS, PD, MS, and IMN
Compared with those seen in the HCU (374±199 pg/mL), significantly higher CSF NfL levels were observed in both bulbar-onset ALS (3448±2110 pg/mL) and limb-onset ALS (3757±3398 pg/mL), but no differences in CSF NfL levels were observed according to the site of ALS onset (Fig. 6a). Higher Upper Motor Neuron scores [42] were associated with significantly higher CSF NfL levels (score 0–4 : 2093±2329 pg/mL, 5–8 : 2715±1321 pg/mL, 9–12 : 3817±2560 pg/mL, 13–16 : 4749±4000 pg/mL) (p = 0.04; Fig. 6b). The Medical Research Council sum score [43] was not correlated with the CSF NfL level (scores: 35–42 : 3314pg/mL, 43–48 : 3811±4332 pg/mL, 49–54 : 3984±3486pg/mL, 56–60 : 3426±2572 pg/mL; Fig. 6c). There was no difference in the CSF NfL level between the groups with Mini-Mental State Examination (MMSE) scores of < 23 points (2000±2080 pg/mL) and ≥ 24 points (3944±3185 pg/mL) (Fig. 6d). Among the PD patients, CSF NfL levels did not change significantly with the Hoehn-Yahr stage classification [44] (stage 2 : 1141±1025 pg/mL; stage 2.5 : 501.3±274.1 pg/mL; stage 3 : 594.5±83.17pg/mL; stage 4 or 5 : 1751±1779 pg/mL; Fig. 6e). No significant difference in CSF NfL levels was observed between MS affecting the brain (2151±2041 pg/mL) and MS affecting the spine (1022±863.1 pg/mL; Fig. 6f). No significant difference in the CSF NfL levels of IMN patients was observed between the acute subtype (GBS and MF: 5425±4923 pg/mL) and chronic subtype (CIDP, MMN, and VN: 1797±2418 pg/mL; Fig. 6g).
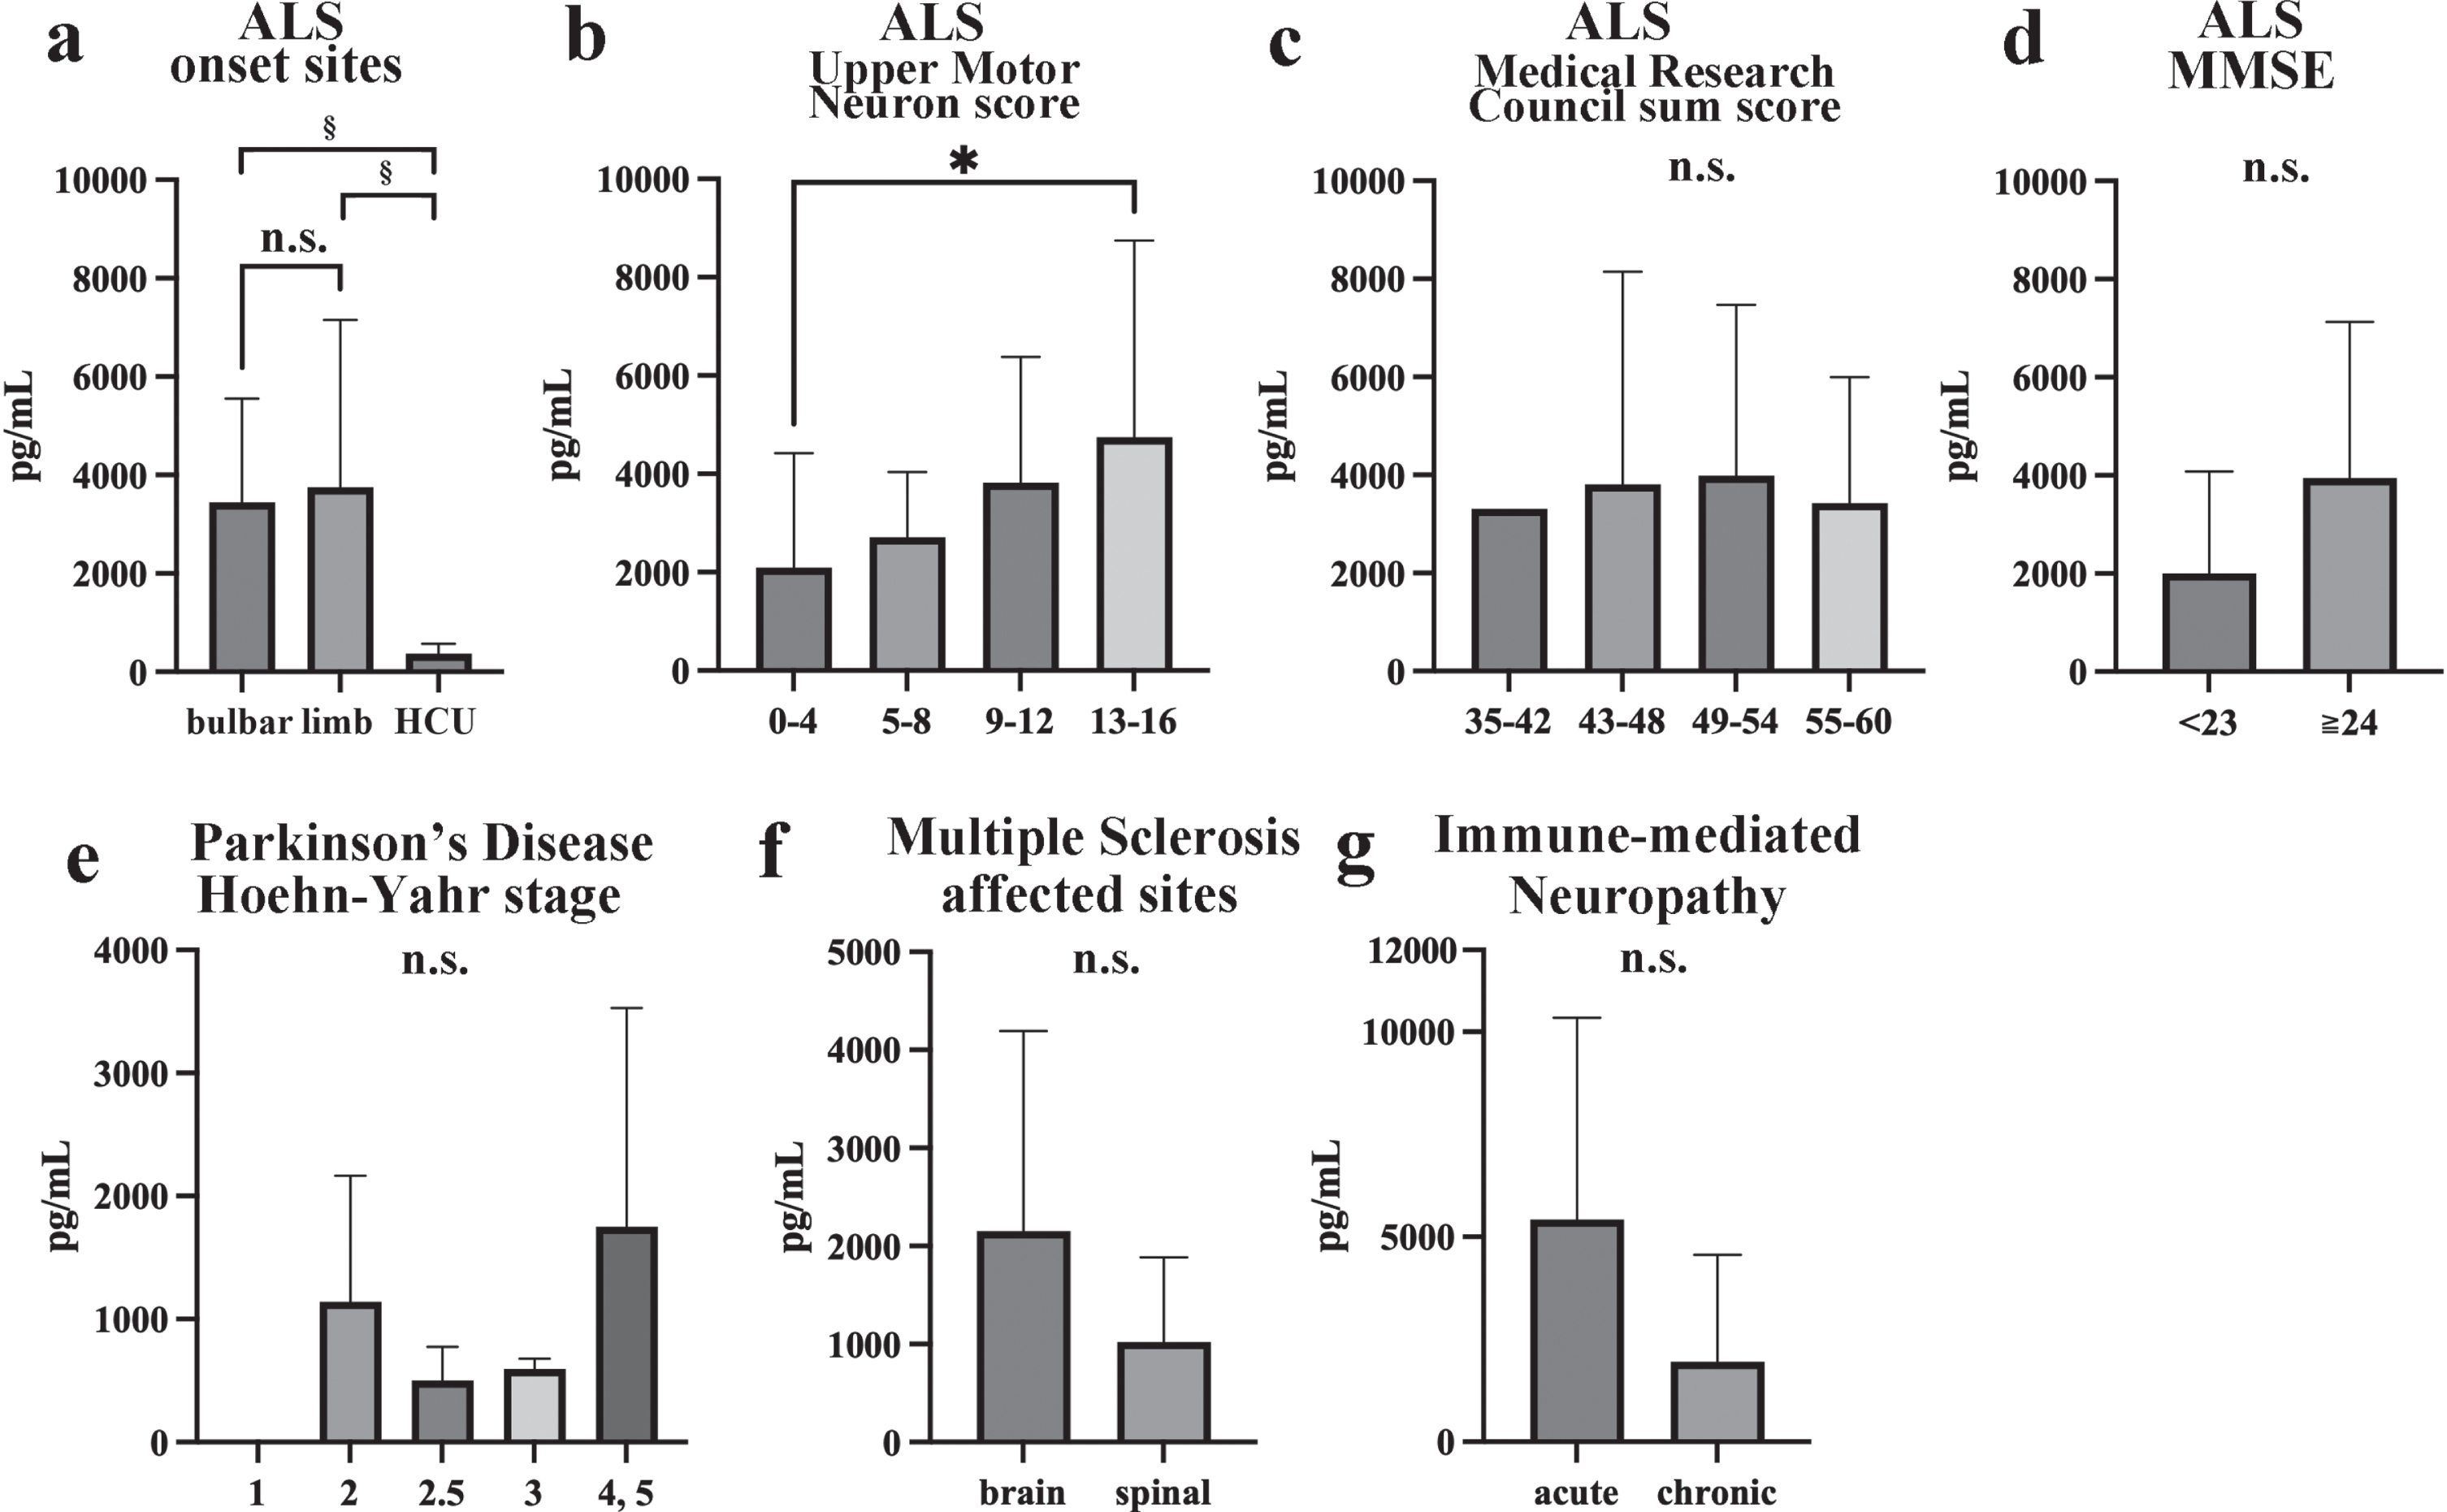
Changes in NfL levels seen in clinical subtypes of ALS, PD, MS, and IMN. Statistical comparisons of NfL levels among bulbar-onset ALS, limb-onset ALS, and HCU (a), among Upper Motor Neuron scores (b), among the Medical Research Council sum scores (c), between MMSE scores in ALS (d), among the Hoehn-Yahr stage classifications in PD (e), between brain or spinal cord in MS (f), and between acute or chronic onset IMN (g). *p < 0.05, ¶p < 0.01, ‡p < 0.001, §p < 0.0001.
DISCUSSION
Basic assay profiles showed that our conventional ELISA systems exhibited sufficient precision and accuracy for use as assays of CSF p217tau and NfL levels. The mean CSF p217tau levels of the AD patients and HCU were 204.8 pg/mL and 11.9 pg/mL, respectively. In comparisons with other assay systems, the abovementioned CSF p217tau levels corresponded to those obtained with a quantitative mass spectrometry assay [4, 12] or the Eli Lilly IBA413/LRL Meso Scale Discovery (MSD) assay used in a Mayo Clinic Study [11]. However, the same Lilly MSD assay showed 3∼4 times higher CSF p217tau levels in ADD patients in the BioFINDER cohort [10, 45]. In addition, two Simoa assays using different antibodies showed much lower [13] or higher CSF p217tau levels [46] than our assays. Differences in ethnicity, the clinical stages of AD, and the assay environment may explain these discrepancies, indicating that standardization is necessary in real-world clinical practice. Our novel ELISAs are easy-to-use conventional systems for routine clinical usage, suggesting that the introduction of an automatic assay system and its application to highly sensitive plasma assay would be useful.
In the HCU, the CSF levels of p217tau, p181tau, t-tau, and NfL increased age-dependently (Fig. 4). Since the age-dependent rates of increase in CSF t-tau and NfL levels were especially high, the age-adjusted estimation of CSF t-tau and NfL levels would be necessary during the clinical usage of these parameters for diagnosis or follow-up studies. Since CSF t-tau levels become high from the third decade of life and increase with age [8], tau seems to be physiologically released from the brain into the CSF, as suggested by Sato [40].
In our study, the mean CSF NfL level of the AD patients was 1081 pg/mL, and that of the HCU was 374 pg/mL. CSF NfL levels have been previously measured mainly using the UmanDiagnostics 47 : 3/2 : 1 antibody system and various detection devices [47–52]. Comparing these data, the CSF NfL levels measured by our ELISA were identical to those recorded in AD patients by the aforementioned system, but the measurements we obtained in the HCU and the ADD patients were slightly low. Since the HCU were comprised of relatively young subjects and the AD group mainly consisted of patients with ADMCI or mild ADD, the CSF NfL levels of the HCU and the ADD patients seemed to be low compared with those seen in other studies.
Significantly increased CSF levels of p217tau (p < 0.0001), p181tau (p < 0.001), and t-tau (p < 0.0001) were observed in the AD patients (Fig. 2a-c). Compared with HCU, higher levels were observed for p217tau (17.2 fold), p181tau (2.5 fold), and t-tau (2.2 fold) in AD patients. No significant increases in p217tau, p181tau, or t-tau CSF levels were observed in the various neurological diseases examined. These findings suggest that increased CSF p217tau, p181tau, and t-tau levels are correlated with AD pathology, and that the changes in CSF p217tau levels seen in AD are substantial. In separate analyses based on the clinical stage of AD, significant increases in CSF p217tau levels were observed in ADMCI and ADD (Fig. 3a-c). Although the number of subjects was small, CSF p217tau levels were also significantly increased in ADCU. These findings corresponded with those of previous studies that found that increases in CSF p217tau levels are first seen in the preclinical cognitively unimpaired stage of AD [4, 53].
ROC analyses of sensitivity and specificity indicated that p217tau is superior to p181tau and t-tau as a biomarker of AD. Our data were compatible with those of other studies [46, 53]. ROC analyses of the ability of the biomarkers to discriminate between AD and the other neurological diseases examined showed the same order (p217tau>p181tau>t-tau). These findings confirm that elevated CSF p217tau levels are more strongly associated with AD pathology than other tau-related biomarkers. CSF t-tau levels are also increased by non-tauopathy-associated brain disorders, such as meningoencephalitis, acute cerebrovascular disease, and prion disease [19, 55]. On the contrary, CSF p181tau levels do not increase in these diseases or other tauopathies, except for AD [54–56]. In this study, we found that CSF p217tau levels do not increase in other neurodegenerative or neuroinflammatory diseases or in immune-mediated peripheral neuropathies. As it was previously reported that CSF p217tau levels do not increase in other tauopathies [53], we should use our ELISA to examine whether CSF p217tau levels increase in non-AD tauopathies, cerebrovascular disease, and prion disease, in order to further validate it.
The CSF t-tau level was 1.84-fold higher in AD patients than in the HCU and the patients with other neurological diseases. Based on this estimation, almost 46% of the additional tau protein was phosphorylated at the 217 site, and 14% was phosphorylated at the 181 site (Fig. 5b). The phosphorylation rate at the 217 site of tau was increased up to 6-fold in AD, whereas that of the 181 site was only increased 1.6-fold [12]. Hanes also reported an AD-specific increase in the CSF level of p217tau [46]. We also noticed that, compared with those seen in the HCU and the patients with other neurological diseases, the CSF p217tau to p181tau ratio was reversed only in AD. Wesseling detected tau phosphorylation at the 181 site in control brains (Braak stage 0-I), but phosphorylation at the 217 site appears early in AD brains (Braak stage III-IV), suggesting that small amounts of p181tau are basically released into the CSF [57]. Tau is physiologically released from the brain into the CSF, and tau synthesis is correlated with the presence of Aβ amyloid plaques [40]. Acute brain disorders, such as that caused by meningoencephalitis, cerebrovascular disease, or prion disease increases t-tau levels, but not p181tau levels, in the CSF [54, 55]. Thus, increases in CSF p217tau levels and the p217tau to p181tau ratio are considered to be AD-specific events.
Recent studies have reported that CSF NfL is a sensitive biomarker of central and peripheral neurological disorders due to degeneration, inflammation, cerebrovascular disease, or trauma [25–27, 58]. Aging and the white matter disorders that accompany cerebrovascular disease increase CSF NfL levels [29]. In contrast, our study showed that CSF NfL levels were markedly increased, especially in spinal cord disease associated with ALS, CM, or NMOSD, and in peripheral neuropathy, such as that caused by GBS or CIDP. The CSF NfL level was correlated with upper motor neuron injury, as reported previously [59]; however, these marked increases did not correlate very strongly with the clinical progression of symptoms (Fig. 6a-g). In these various neurological diseases, elevated CSF NfL levels may first appear in the preclinical stages [14, 28]. The elevation of CSF NfL levels was also less marked in AD than in these neurological diseases. Taking these findings together, CSF NfL level cannot be used as a biomarker for discriminating other neurological diseases from concomitant AD. This point is considered to be critically relevant for the usage of the CSF NfL level as a biomarker of neurodegeneration in AD for clinical diagnosis or in clinical trials of AD treatments.
The main limitations of this study were the fact that it was not a cohort study and only included a small number of HCU subjects. For the abovementioned reasons, we selected control subjects without any systemic or neurological complications. This approach reduced the number and mean age of the HCU. In addition, half of the AD patients had MCI, and the rest had mild dementia. Both of these factors may have influenced the relatively low CSF p217tau and NfL levels of the HCU and ADD patients. Another limitation is the lack of patients with non-AD dementia or other tauopathies for comparison. The final limitation is the lack of AD cases diagnosed long before the onset of MCI. We should validate and standardize our novel ELISAs for p217tau and NfL using CSF and plasma in large cohort studies involving long-term follow-up.
Footnotes
ACKNOWLEDGMENTS
We thank Akihiko Takashima for providing the GSK3β cDNA/pCI-Neo and Yoshikazu Tsunemi, Satoru Hirano, Michiko Tanaka, Naoko Nakahata, Kaoru Sato, and Sakiko Narita for their research assistance.
FUNDING
The study was supported by Grants for Scientific Research (C) from the Ministry of Education, Science, and Culture of Japan. Numbers: 18K07385, 22K07511.
CONFLICT OF INTEREST
The authors have no conflicts of interest to report.
DATA AVAILABILITY
Data sharing is available on request.