
Abstract
Background:
Alzheimer’s disease (AD) brains accumulate DNA double-strand breaks (DSBs), which could contribute to neurodegeneration and dysfunction. The genomic distribution of AD brain DSBs is unclear.
Objective:
To map genome-wide DSB distributions in AD and age-matched control brains.
Methods:
We obtained autopsy brain tissue from 3 AD and 3 age-matched control individuals. The donors were men between the ages of 78 to 91. Nuclei extracted from frontal cortex tissue were subjected to Cleavage Under Targets & Release Using Nuclease (CUT&RUN) assay with an antibody against γH2AX, a marker of DSB formation. γH2AX-enriched chromatins were purified and analyzed via high-throughput genomic sequencing.
Results:
The AD brains contained 18 times more DSBs than the control brains and the pattern of AD DSBs differed from the control brain pattern. In conjunction with published genome, epigenome, and transcriptome analyses, our data revealed aberrant DSB formation correlates with AD-associated single-nucleotide polymorphisms, increased chromatin accessibility, and upregulated gene expression.
Conclusion:
Our data suggest in AD, an accumulation of DSBs at ectopic genomic loci could contribute to an aberrant upregulation of gene expression.
Keywords
INTRODUCTION
Alzheimer’s disease (AD), a progressive neurodegenerative disorder that accounts for most dementia cases, has become a global challenge with the aging of the population [1]. At the molecular level, AD is hallmarked by extracellular amyloid plaques and intracellular neurofibrillary tangles [2]. Extracellular amyloid plaques are formed from the abnormal accumulation of amyloid-β protein (Aβ), which potentially disrupts communication between nerve cells. Intracellular neurofibrillary tangles occur when tau protein becomes abnormally phosphorylated, leading to the formation of clumps within nerve cells [2]. These pathological changes result in the death and functional impairment of brain cells and a gradual decline in cognitive function featuring memory loss and difficulty with language, problem solving, and other complex tasks [3]. Despite recent advances in AD research, the exact cause of AD remains unclear. Currently, there is no cure for AD, and all treatment options aim to lessen AD symptoms and improve quality of life. Thus, there is an urgent unmet need to understand the molecular mechanism underlying AD in order to identify therapeutic targets for AD prevention and treatment.
Mounting evidence suggests that genomic integrity is essential for the survival and function of neuronal cells and that loss of genomic integrity and accumulation of DNA damage are involved in neuronal aging and degeneration [4–10]. Since neurons are post-mitotic and long-lived, DNA damage could be especially damaging. Among all forms of DNA damage, DNA double-strand breaks (DSBs) are perhaps the most deleterious. DSBs can occur as a result of various factors, such as ionizing radiation, exposure to chemicals or other genotoxic agents, errors in DNA replication and repair mechanisms. The numbers of DSBs are increased in AD brain cells [10–12]. When DNA breaks occur, cells respond by activating a complex signaling pathway known as the DNA damage response (DDR) to repair the damage and maintain genomic stability. Mutations in the genes that encode proteins in the DDR pathway have been linked to neurodegenerative diseases, including AD [13–16]. In addition, multiple mouse models of neurodegeneration exhibit increased DSB formation, including tauopathy models, the CK-p25 model, 5XFAD, and the hAPP-J20 model [11, 17–19]. Taken together, these results implicate DSBs in AD pathology.
DSBs are formed in brain cells as a physiological response when mice are exposed to novel environments and repaired within 24 h [17]. Further studies have shown that these DSBs are not randomly distributed in the genome but positioned in certain loci to facilitate the expression of early response genes [20, 21]. Thus, it is not known whether the landscape of DSBs is altered in AD pathology. Moreover, dysregulation of gene expression and chromosomal accessibility has been reported in human AD brains, but it is not known whether ectopic DSBs correlate with this dysregulation.
One of the earliest events following DSB formation is the phosphorylation of the histone variant H2AX at serine 139, resulting in the rapid formation of γH2AX around DSB sites [22]. The γH2AX signal serves as a marker for DSBs. Moreover, the identification of chromatin enriched for γH2AX can be exploited to derive the locations of DSBs [20, 23]. Thus, to characterize the genomic distribution of DSBs in AD brains, we mapped the DSBs on a genome-wide level in human postmortem brains (frontal cortex) from 3 nondemented (ND) and 3 AD patients by performing Cleavage Under Targets and Release Using Nuclease (CUT&RUN) for γH2AX followed by high throughput-sequencing. During this chromatin profiling strategy, γH2AX-targeted controlled cleavage by nuclease releases DNA around sites of DSBs into the supernatant for paired-end DNA sequencing [24]. Our results show that there is an 18-fold increase in the number of DSBs in AD brains. These ectopic DSBs in AD are localized at genomic areas that are correlated with upregulated gene expression.
MATERIALS AND METHODS
Human samples
Autopsy brain tissue samples (frontal cortex) were obtained from the University of Kansas Alzheimer’s Disease Research Center (KU ADRC) Neuropathology Core. The samples were homogenized on dry ice and aliquoted for CUT&RUN. For information on the human samples used in this study (AD, n = 3 males; controls, n = 3 males), please refer to Fig. 1A.
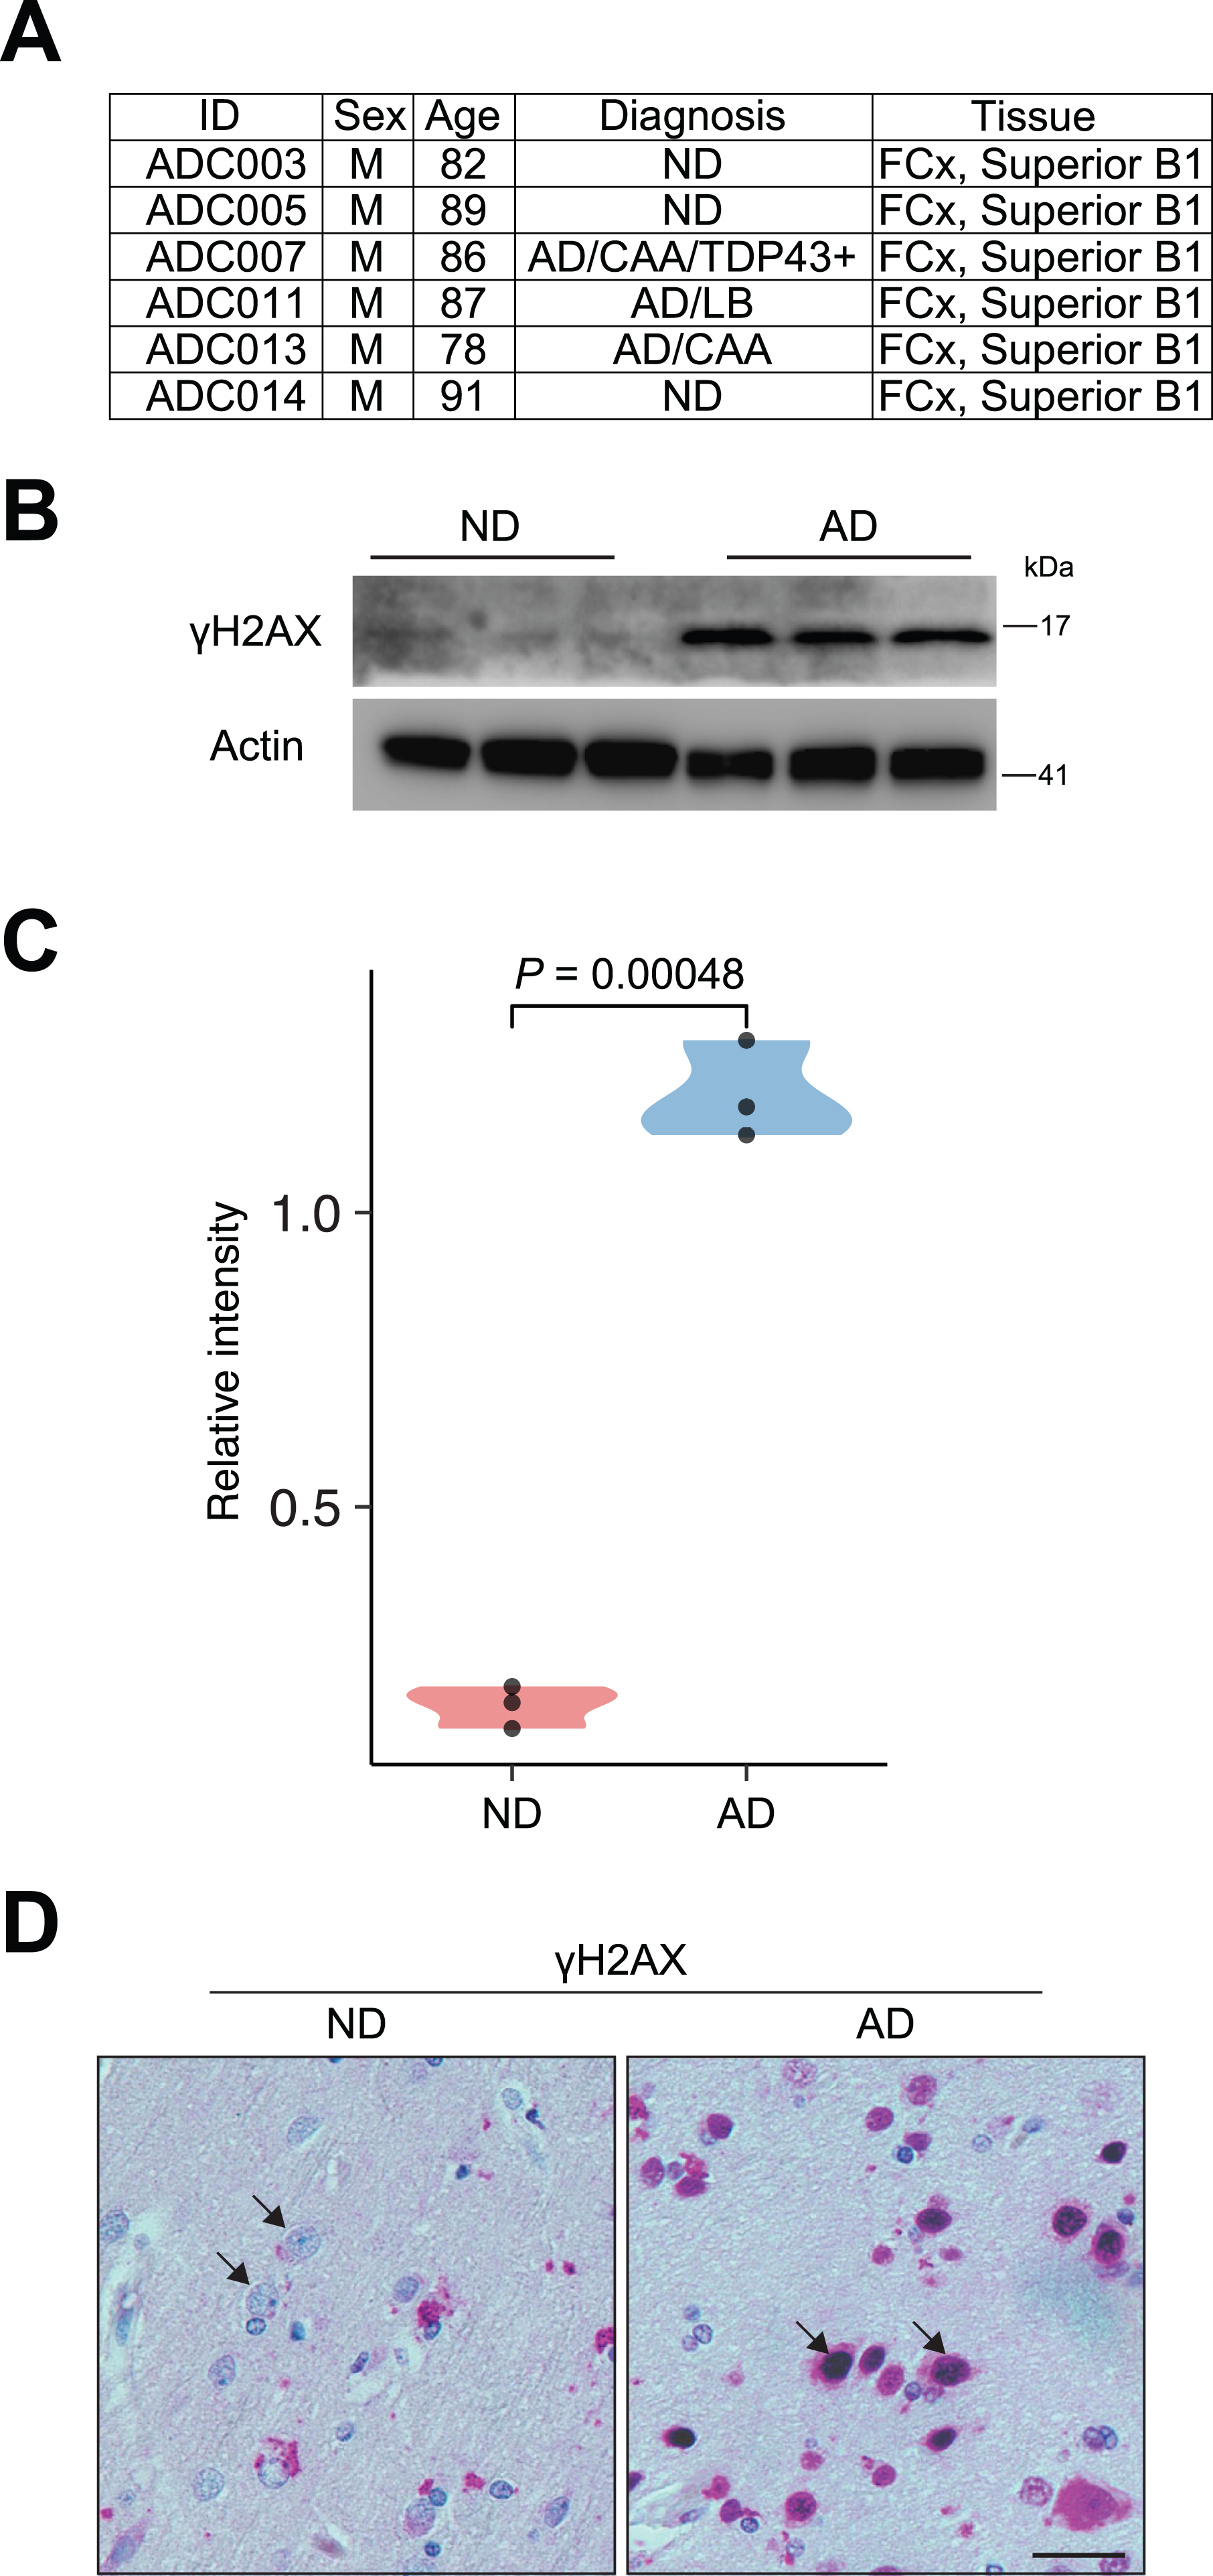
γH2AX signal reveals accumulation of DSBs in AD brain. A) Detailed information of the human cortex from postmortem human patients with AD and ND is included. B) Representative immunoblots of γH2AX expression in the human brain slides from ND and AD individuals. C) Quantification immunoblots of γH2AX expression relative to Actin in the human brain slides from ND and AD individuals. D) Images of immunostaining of γH2AX in frontal cortex slides from ND and AD individuals. Arrows indicate neurons. Scale bars, 10μm.
Western blot
Total protein was extracted in RIPA buffer containing 1 mM PMSF (Sigma) and protease inhibitor cocktail (Sigma P8340). The lysates were removed after centrifugation at 12,000× g for 15 min at 4°C, and the protein concentrations in supernatants were measured (DC protein assay; Bio-Rad). Equal amounts of protein from each sample were mixed with LDS sample buffer (Invitrogen) plus sample reducing agent (Invitrogen) and denatured for 10 min at 70°C. The proteins were loaded in 4–12% Bis-Tris gels (Thermo Fisher) and transferred to PVDF membranes. The blots were probed with a γH2AX antibody (Sigma-Aldrich, 05-636, clone JBW301) at a 1:1,000 dilution overnight at 4°C, washed and reacted with secondary antibody. Detection was performed with Clarity ECL Western Blotting Substrate (Bio-Rad).
Immunohistochemistry
For immunohistochemistry, human FFPE histological sections were dewaxed, rehydrated in an ethanol series, and then subjected to microwave antigen retrieval in 0.01 M citrate (pH 6.0) and methanol/H2O2 treatment. After blocking with 5% goat serum, the slides were sequentially incubated with γH2AX antibody (Sigma-Aldrich, 05-636, clone JBW301) at a 1:1,000 dilution and HRP-labeled secondary antibodies. A NovaRed kit (Vector, SK-4800) was used for visualization.
Preparation of nuclei from human brain specimens
Frozen human brain tissue was thawed on ice and minced sharply into <1 mm pieces. Next, 500μl of chilled Nuclei EZ Lysis Buffer (Millipore Sigma, NUC-101, no. N3408) was added, and the tissue was homogenized 10–20 times in a Dounce homogenizer. The homogenate was transferred to a 1.5-ml Eppendorf tube, and 1 ml of chilled Nuclei EZ Lysis Buffer was added. The homogenate was mixed gently with a wide-bore pipette and incubated for 5 min on ice. The homogenate was then filtered through a 70-μm mesh strainer and centrifuged at 500× g for 5 min at 4°C. The supernatant was removed, and the nuclei were resuspended in 1.5 ml of Nuclei EZ Lysis Buffer and incubated for 5 min on ice. The nuclei were centrifuged at 500× g for 5 min at 4°C. After carefully removing the supernatant (sometimes the pellet was loose), the nuclei were washed in wash buffer (1× PBS, 1.0% BSA and 0.2 U μl– 1 RNase inhibitor). The nuclei were then centrifuged and resuspended in 1.4 ml of wash buffer for two additional washes. The nuclei were then filtered through a 40-μm mesh strainer. Intact nuclei were counted after counterstaining with Trypan blue in a standard cell counter.
CUT&RUN
For CUT&RUN, 500,000 nuclei were washed 1× with CUT&RUN wash buffer (20 mM HEPES, pH 7.5, 150 mM NaCl, 0.5 mM spermidine), bound to activated ConA beads, permeabilized in wash buffer (wash buffer + 0.002% digitonin), incubated with γH2AX antibodies, washed in wash buffer, incubated with pA-MN (EpiCypher 15-1016), and washed in wash buffer. Following the final wash, the cells were washed with ice-cold low-salt wash buffer and digested using MNase digestion buffer for 25 min on ice. Solubilized chromatin was released using an isosmotic stop buffer and was collected using a PCR cleanup kit column.
CUT&RUN Library Prep was performed using the Illumina NovaSeq 6000 Sequencing System at the University of Kansas Medical Center – Genomics Core (Kansas City, KS). Fragmented input and immunoprecipitated chromatin (5 ng) were used to initiate the TruSeq ChIP Sample Prep Kit library preparation protocol with modifications for CUT&RUN sample input (Illumina Cat# IP-202-1012). The fragmented chromatin underwent end repair and 3’ adenylation prior to Illumina indexed adapter ligation. No gel size selection of the ligation product was performed. Ten cycles of PCR amplification with a modified extension time of 10 seconds were performed using Illumina adaptor-specific priming with final library purification using KAPA Pure magnetic bead purification (KAPA Cat# KK8002).
Library validation was performed using a DNA 1000 Assay Kit (Agilent Technologies 5067-1504) on an Agilent TapeStation 4200. The concentration of each library was determined by qPCR using a Roche LightCycler 96 using FastStart Essential DNA Green Master Mix (Roche 06402712001) and KAPA Library Quant (Illumina) DNA Standards 1–6 (KAPA Biosystems KK4903). The libraries were pooled based on equal molar amounts to 1.85 nM for multiplexed sequencing.
The pooled libraries were denatured with 0.2 N NaOH (0.04 N final concentration) and neutralized with 400 mM Tris-HCl pH 8.0. Dilution of the pooled libraries to 370 pM was performed in the sample tube on the instrument, after which onboard clonal clustering of the patterned flow cell was performed using a NovaSeq 6000 S1 Reagent Kit v1.5 (200 cycle) (Illumina 20028318). A 2×101 cycle sequencing profile with dual index reads was completed using the following sequence profile: Read 1–101 cycles×Index Read 1–6 cycles×Index Read 2– 0 cycles×Read 2–101 cycles. Following collection, the sequence data were converted from the.bcl file format to the.fastq file format using bcl2fastq software and demultiplexed into individual sequences for data distribution using a secure FTP site or Illumina BaseSpace for further downstream analysis.
CUT&RUN data processing and analysis
TrimGalore was used to trim the raw.fastq files to remove adaptors. The trimmed.fastq files were then mapped to the hg19 genome utilizing Bowtie2. The same procedure was run to align the.fastq files to a masked Saccharomyces cerevisiae v3 (sacCer3) genome for spike-in control DNA, which was also downloaded from the University of California Santa Cruz (UCSC) (https://genome.ucsc.edu/). Sambamba was then used to remove duplicates. For IGV visualization, deepTools was used with the “bamCoverage” function to generate normalized CPM.bw files. For peak calling, the recently developed SEACR was utilized and run in “relaxed’ mode to produce peak files, as the BED files used were already normalized to the number of yeast spike-in reads. DeepTools was further applied for heatmap visualization with the functions “computeMatrix” and “plotHeatmap”. The “dba.peakset” function of the Diffbind R package was further applied to identify overlapping peaks on the basis of the bound peaks. The links of CUT&RUN peaks and their related genes were established with the “annotatePeaks.pl” function in Homer. Motif enrichment analyses were performed using the “findMotifsGenome.pl” function in Homer, leading to known enrichment results and de novo enrichment results, and the latter were chosen in this study.
RESULTS
Upregulated γH2AX expression in AD brains
We obtained autopsy brain tissue (frontal cortex) from postmortem human AD and nondemented (ND) patients through the KU Alzheimer’s Disease Research Center Neuropathology Core. The age, sex, and diagnostic information of these patients is shown in Fig. 1A. First, we used γH2AX [19, 25] to examine DSBs in these samples. Western blot analysis showed that the levels of γH2AX were significantly upregulated in AD samples, suggesting the accumulation of DSBs (Fig. 1B, C). Immunohistochemistry (IHC) for γH2AX using histological sections from these patients showed that while the occasional γH2AX signal was sparse in ND samples, strong nuclear accumulation of γH2AX was frequently observed in AD samples, especially in neuronal cells, which were characterized by large nuclei (Fig. 1D). Thus, consistent with past literature [10–12], our study using γH2AX demonstrates a profound increase in DSBs in AD brains (frontalcortex).
CUT&RUN to map DSB sites in ND and AD samples
DSB formation induces rapid phosphorylation of histone H2AX at Ser139 (γH2AX) around the break sites. Thus, the identification of γH2AX-enriched chromatin can be used to infer the genomic loci of DNA breaks [20, 27]. To determine whether DSB sites are altered in AD samples, we extracted nuclei from the ND and AD samples and conducted CUT&RUN using a γH2AX antibody followed by high-throughput genomic sequencing to profile the genome-wide occupancy of γH2AX. Differential binding analysis of CUT&RUN and hierarchical clustering revealed that all 3 ND samples, namely, ADC3, ADC5 and ADC14, were clustered together, while all 3 AD samples, namely, ADC7, ADC11, and ADC13, were clustered together (Fig. 2A). Further analysis revealed an 18-fold increase in the number of peaks detected in AD versus ND samples; while only 2,723 peaks were detected in ND samples, 49,166 peaks were detected in AD samples (Fig. 2B), suggesting an accumulation of DSBs in AD samples.
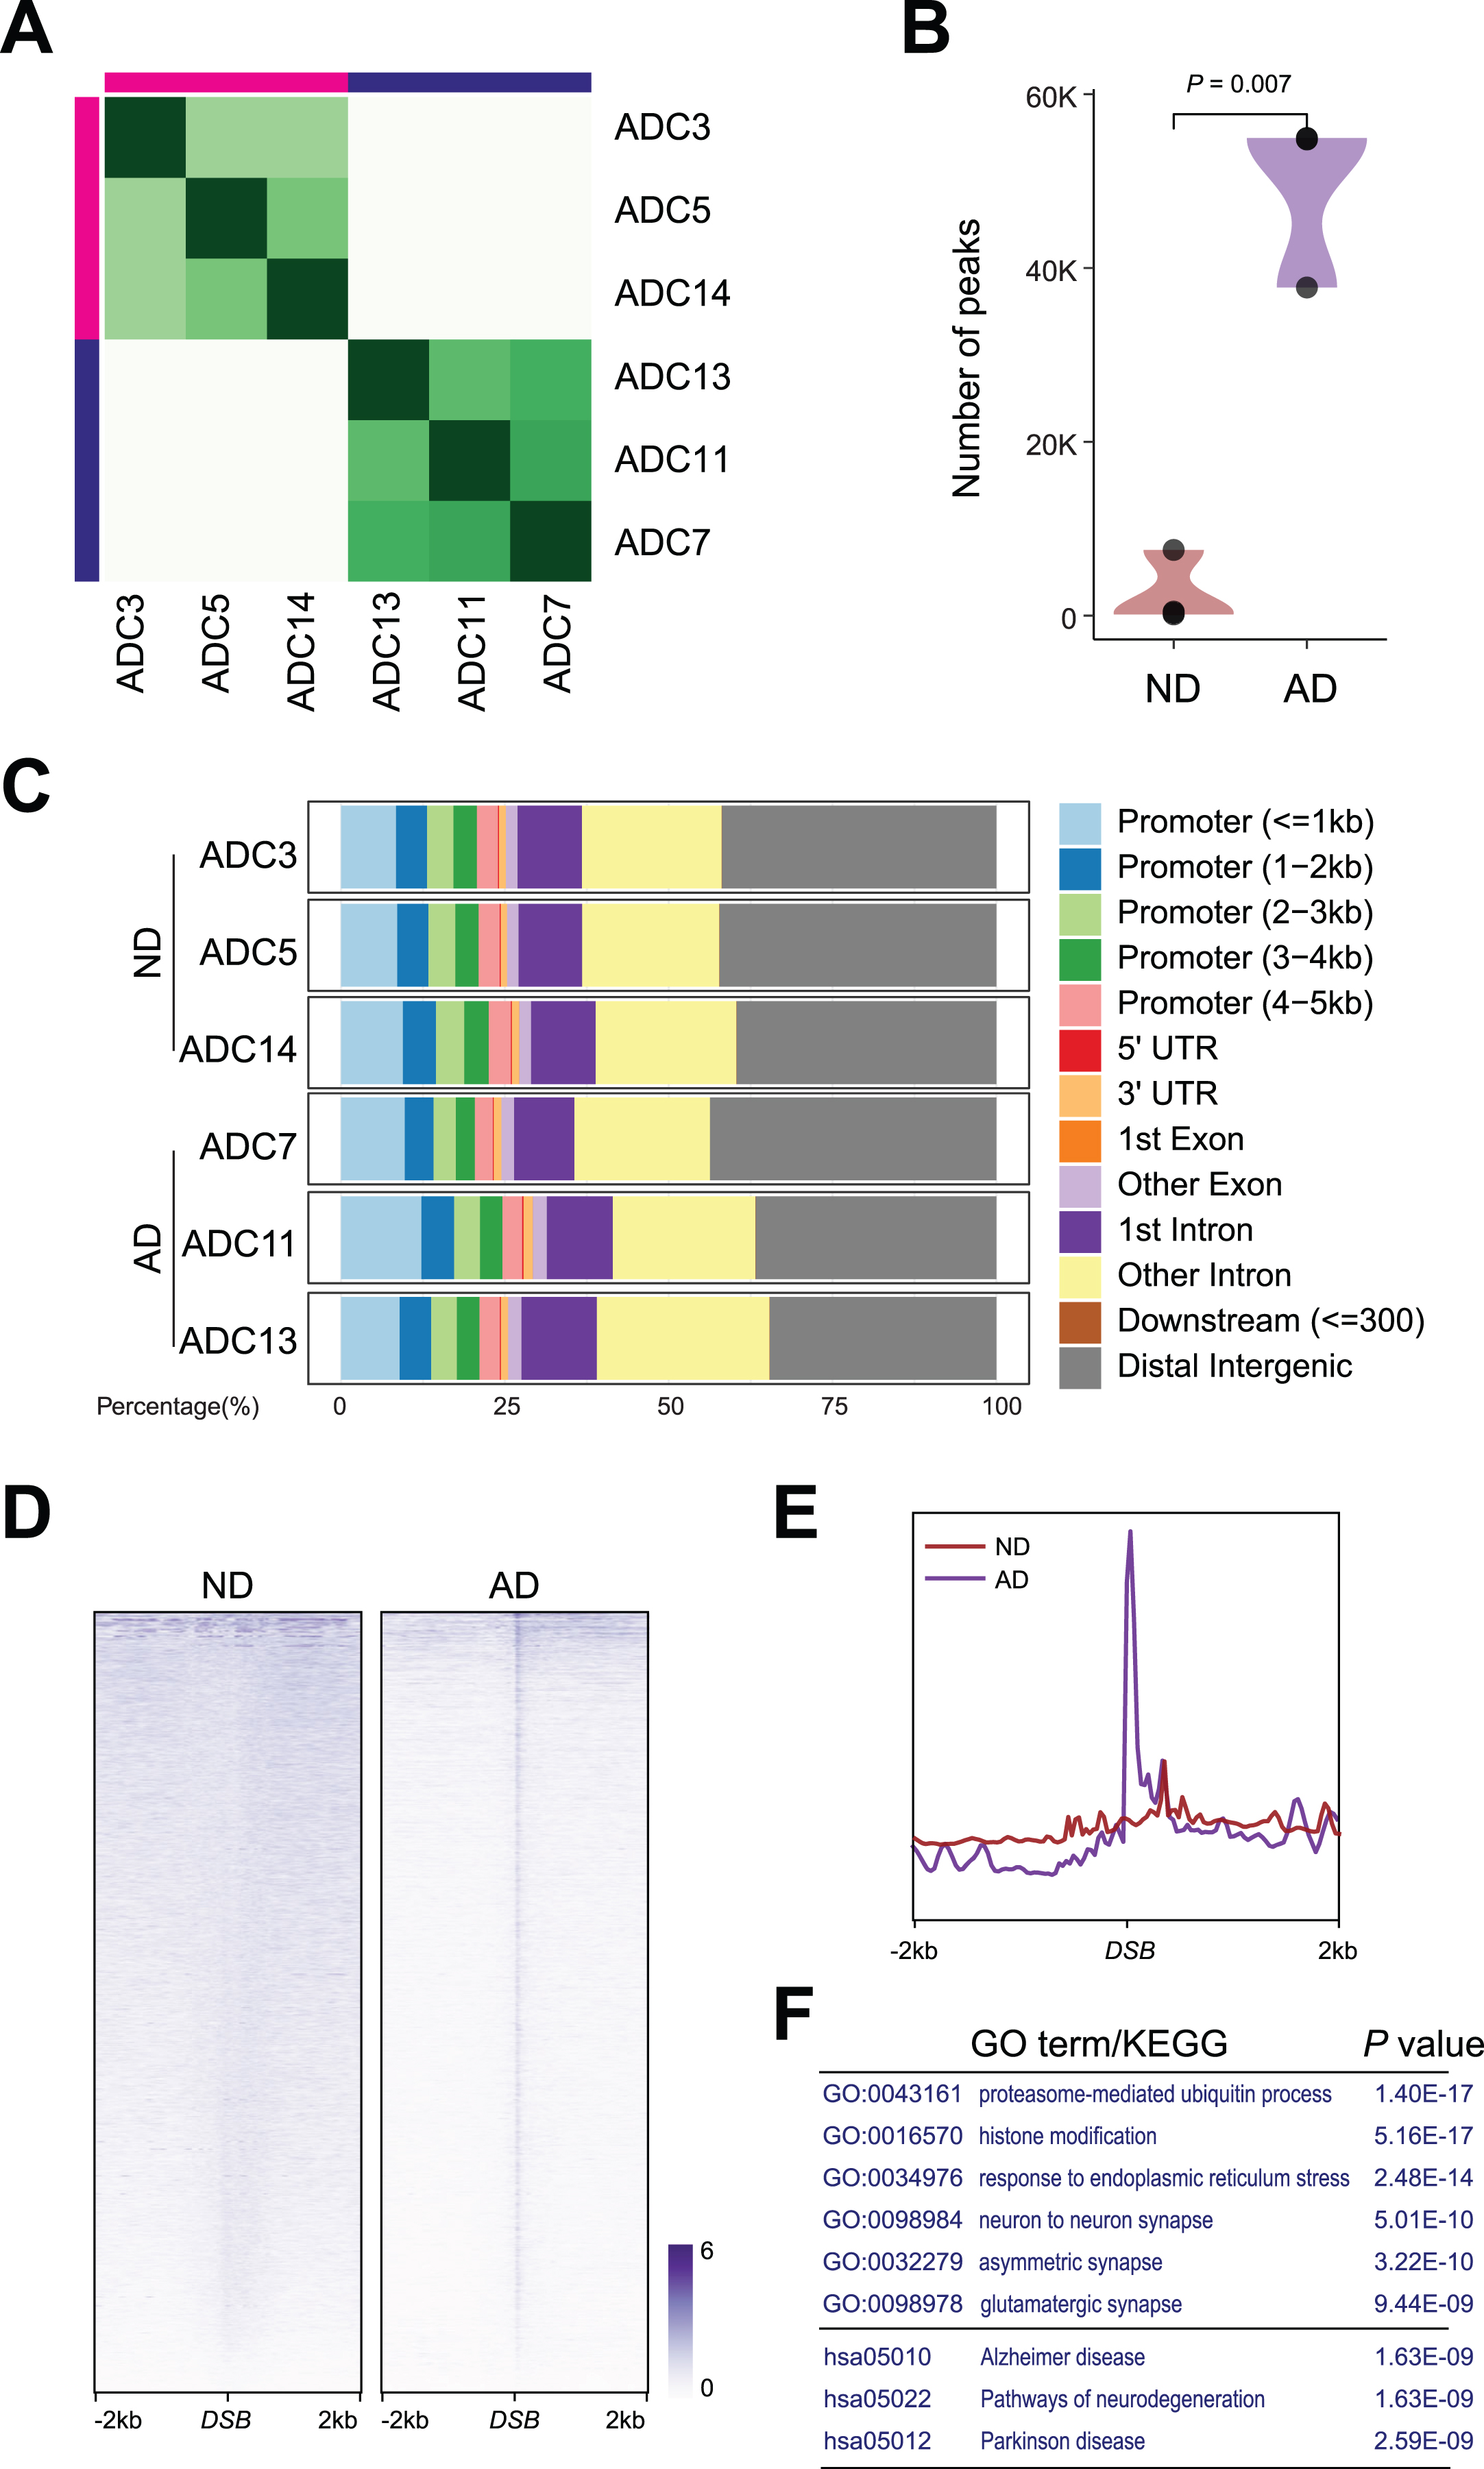
DSB sites in ND and AD samples. A) Heatmap representation of Diffbind clustering of the indicated CUT&RUN experiments. B) Violin plot showing number of peaks between AD and ND. C) Distribution of differential γH2AX sites in genome. D) Heatmaps showing distribution of DSBs binding in AD and ND. E) Distribution of DSBs in a ±2 kb window of γH2AX binding sites. F) Gene ontology (GO) and Kyoto Encyclopedia of Genes and Genomes (KEGG) analysis for DSBs in AD.
The ratio of the genomic distribution of DSBs was comparable in both ND and AD samples. γH2AX binding showed strong enrichment (>30%) at distal intergenic regions. Moreover, almost 25% of the binding occurred at transcriptional start sites (TSSs) and proximal promoters (Fig. 2C).
Importantly, γH2AX in AD samples exhibited a strong central peak, presumably at DSB sites (Fig. 2D). As shown in the profile plot in Fig. 2E, genome-wide γH2AX occupancy around DSBs was elevated in AD samples. Functional identification analysis demonstrated that these DSB sites in AD samples occurred at genes that encode regulators of proteasome-mediated ubiquitin processes (e.g., PML, CUL3, and MDM2), histone modification (e.g., TET3, KMT2A, and SETD1), ER stress (e.g., BAX, STUB1, and XBP1), synapses (e.g., LGMN, MEF2C, and APP), and Alzheimer’s disease (e.g., APP, BACE2, and APOE) (Fig. 2F).
Distribution of DSBs in ND and AD samples
We further examined the enrichment profiles of γH2AX occupancy in ND and AD samples, which showed distribution around the promoter, intron, exon, 3’UTR and intergenic regions (Fig. 3A). As shown in the profile plot in Fig. 3B, genome-wide γH2AX occupancy around DSBs in ND and AD samples was enriched at promoters, introns, exons, 3’UTRs, and intergenic regions. Similar to the trend observed in the overall peaks in Fig. 2D, AD samples showed higher levels of γH2AX occupancy in all these genomic regions (Fig. 3B). Thus, both the total number of γH2AX peaks (Fig. 2B) and the number of DSBs (Figs. 2D, 3A) were higher in AD samples than in ND samples.
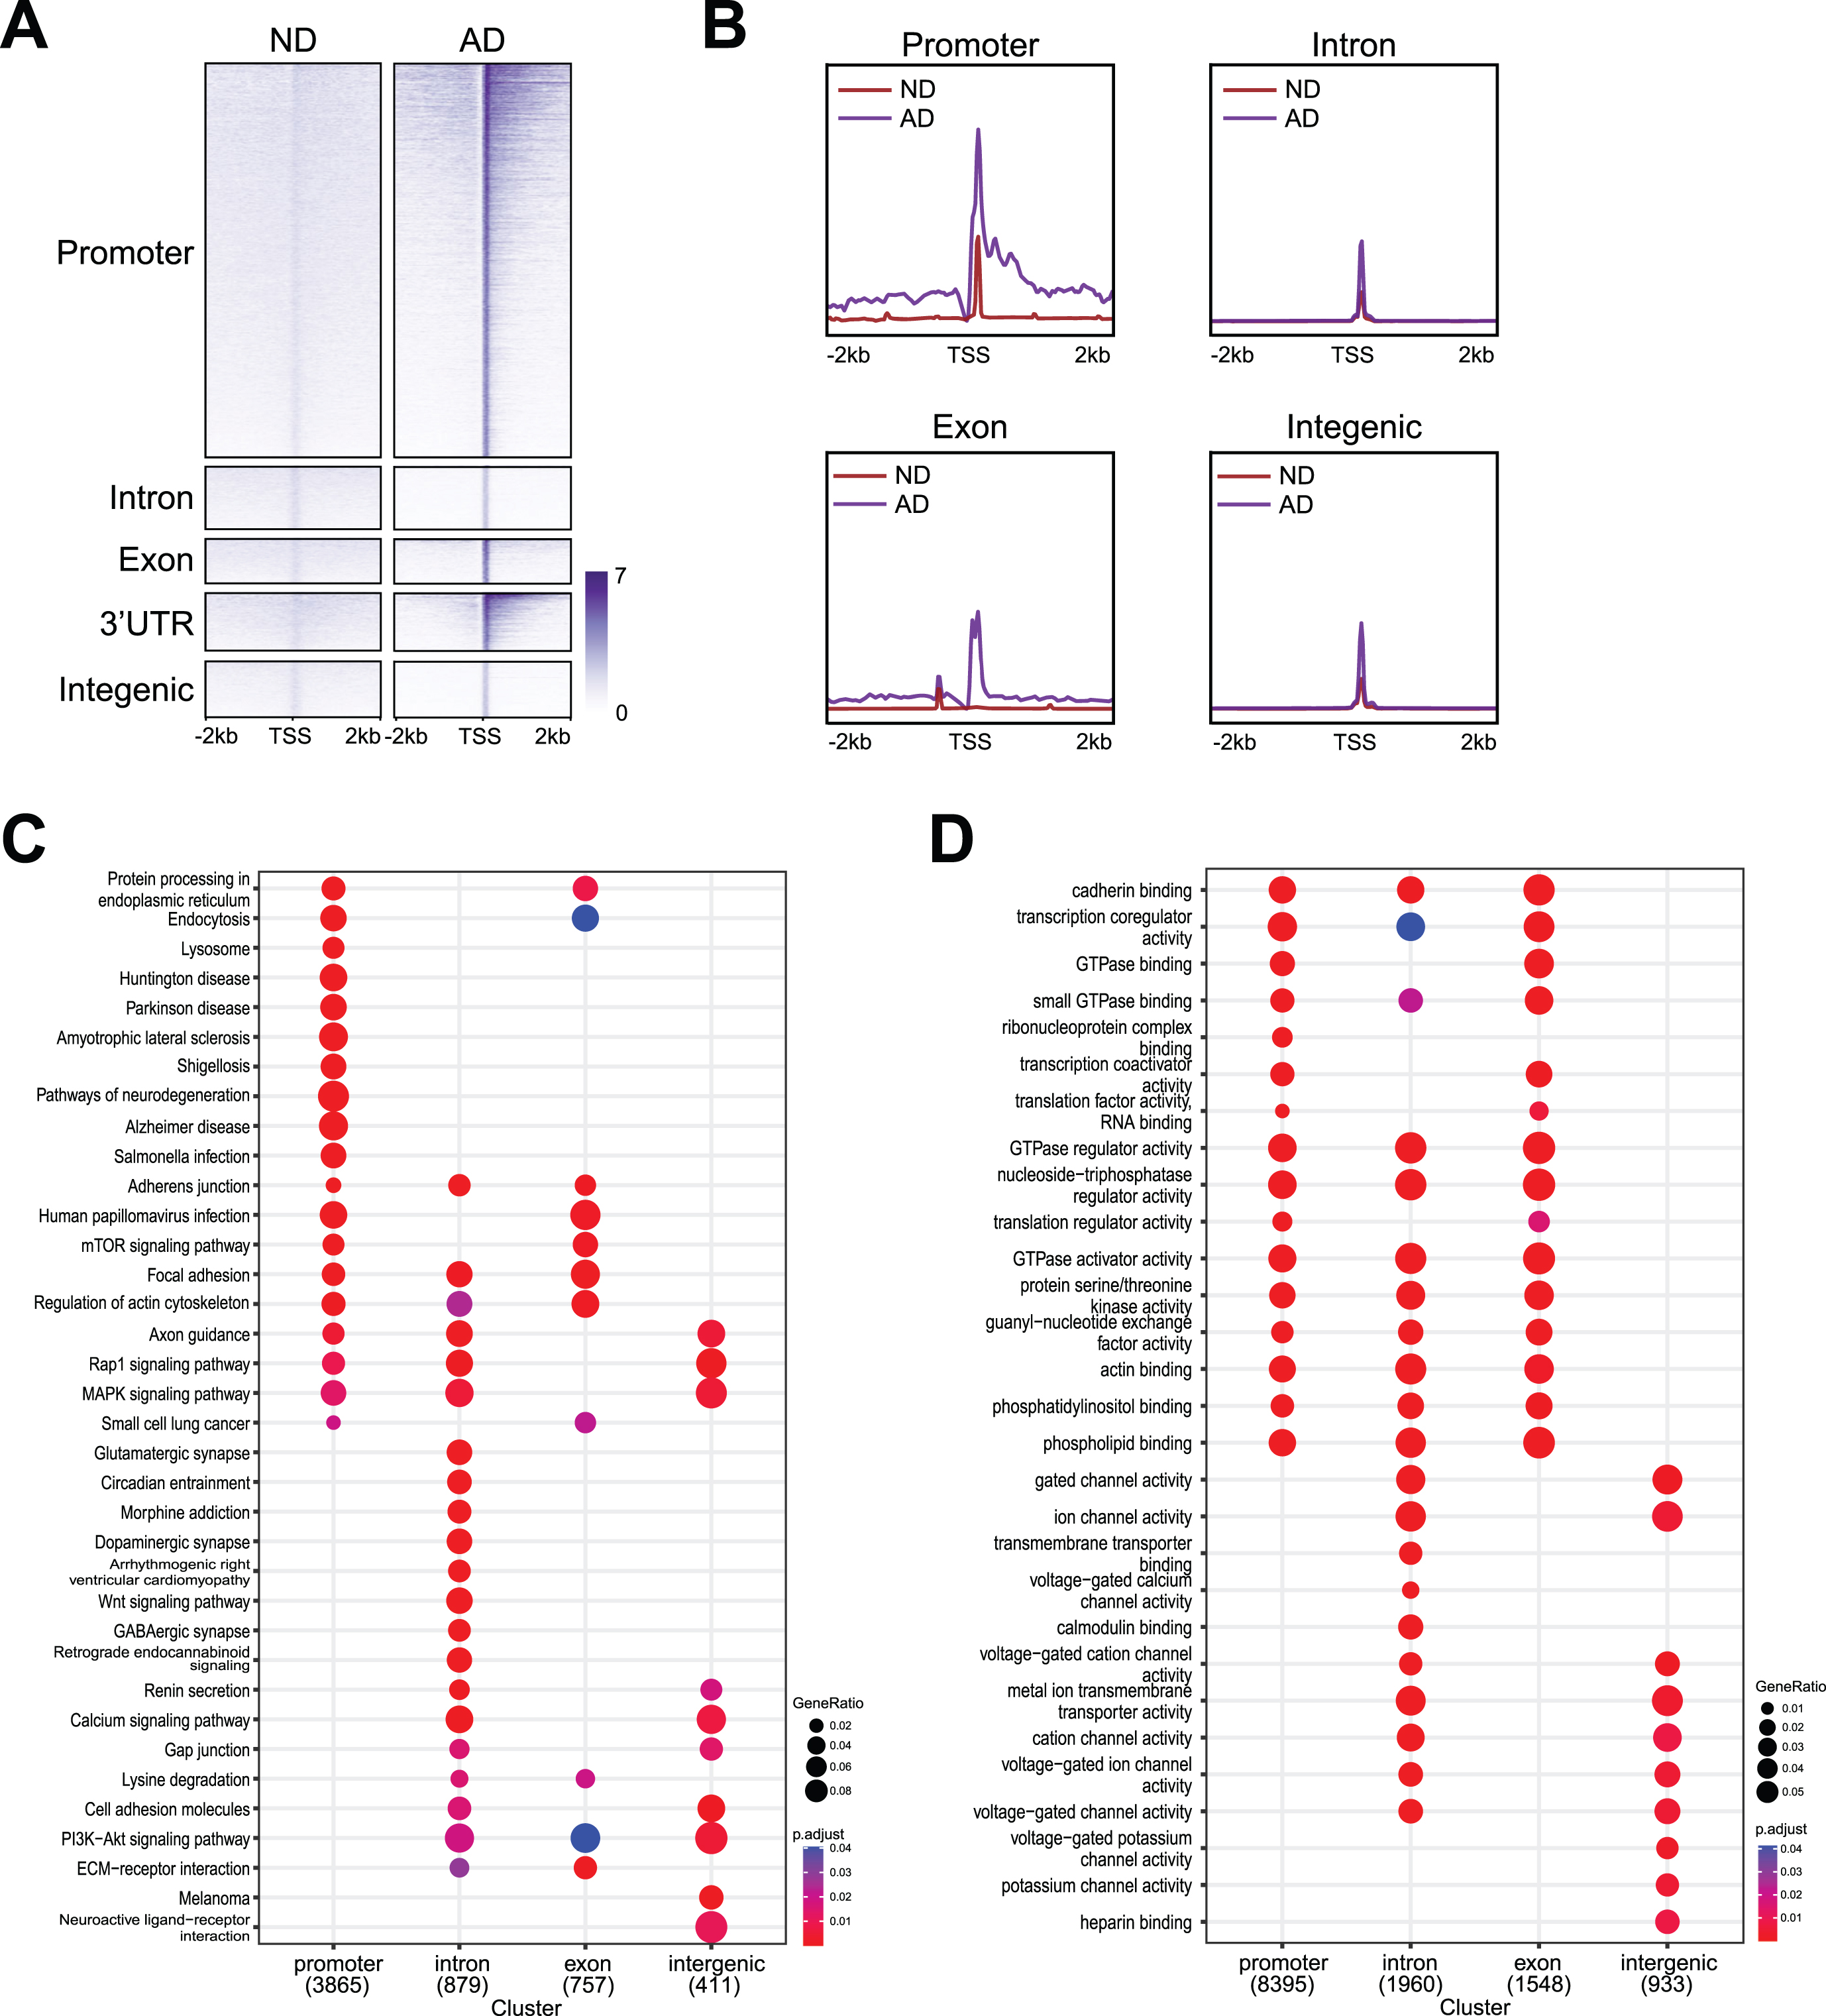
Genomic distribution of DSBs with functional analysis. A) Heatmaps showing distribution of DSBs binding at promoter, intron, exon, 3’UTR, and intergenic. B) Distribution of DSBs in a ±2 kb window of γH2AX binding sites at promoter, intron, exon, 3’UTR, and intergenic. C) Kyoto Encyclopedia of Genes and Genomes (KEGG) analysis for DSBs at promoter, intron, exon, 3’UTR, and intergenic. D) Gene ontology (GO) analysis for DSBs at promoter, intron, exon, 3’UTR, and intergenic.
Interestingly, our data showed that genes enriched for different functions were susceptible to DSBs at different genomic regions (Fig. 3C, D). For example, functional pathway identification analysis (Fig. 3C) demonstrated that genes that harbored DSBs at the promoters encode pathways related to neurodegeneration (e.g., BAD, ADRM1, VDAC2), Parkinson’s disease (e.g., SLC6A3, UBB, UBE2G2), and Alzheimer’s disease (e.g., APP, BACE2, APOE). Genes that harbored DSBs at introns encode pathways related to glutamatergic synapses (e.g., GRIN3A, GNG10, GLS), GABAergic synapses (e.g., LCL1, GNAI1, GABRA1), and morphine addiction (e.g., GRK5, ADCY5, GABRA6). Notably, genes that harbored DNA breaks at exons strongly encode pathways related to endocytosis (e.g., PRKCZ, SMAP2 and DNAJC6) and the PI3K-Akt signaling pathway (e.g., PRL, CCND2 and THBS4). In contrast, genes that harbored DSBs at intergenic regions are uniquely enriched for neuroactive ligand-receptor interactions (e.g., EDN2, CHRM3, and ADRB1). Moreover, functional term identification analysis (Fig. 3D) showed that genes harboring DNA breaks at promoters, introns, and exons encode cadherin binding (e.g., ENO1, EPHA2 and NUDC), GTPase binding (e.g., MICALL2, ROCK1 and MYO9B), and phosphatidylinositol binding (e.g., MYO10, OGT and NCF1C). DNA break sites at both introns and intergenic regions appeared to be enriched with functional terms related to gated channel activity (e.g., LRRC38, CLIC4 and KCNA2), voltage-gated cation channel activity (e.g., KCNA1, GRIN2B and KCNG2), and voltage-gated ion channel activity (e.g., PKD2, HCN1 and HTR1B), while DSBs at intergenic regions were uniquely enriched for heparin binding (e.g., NRP1, COL13A1 and ADAMTS15).
Differential peak analysis
To identify differential DSBs in AD and ND samples, we performed differential peak analysis, and the result is shown by a volcano plot (Fig. 4A). We analyzed the DNA sequences around DSB sites near the TSSs of these genes for sequences related to transcription factor-binding sites by using Homer. Interestingly, our analysis showed that the binding site for PRDM9 was enriched in genes that had increased γH2AX occupancy in AD samples (Fig. 4B). PRDM9 is a crucial transcription factor responsible for positioning meiotic DSBs and recombination hotspots by binding to a DNA sequence motif encoded in its zinc finger domain [28–30]. In addition, the binding sites for retinoic acid receptor (RAR), retinoid X receptor α (RXRA), and ZBTB7B were enriched in genes with upregulated γH2AX occupancy in AD samples (Fig. 4B).
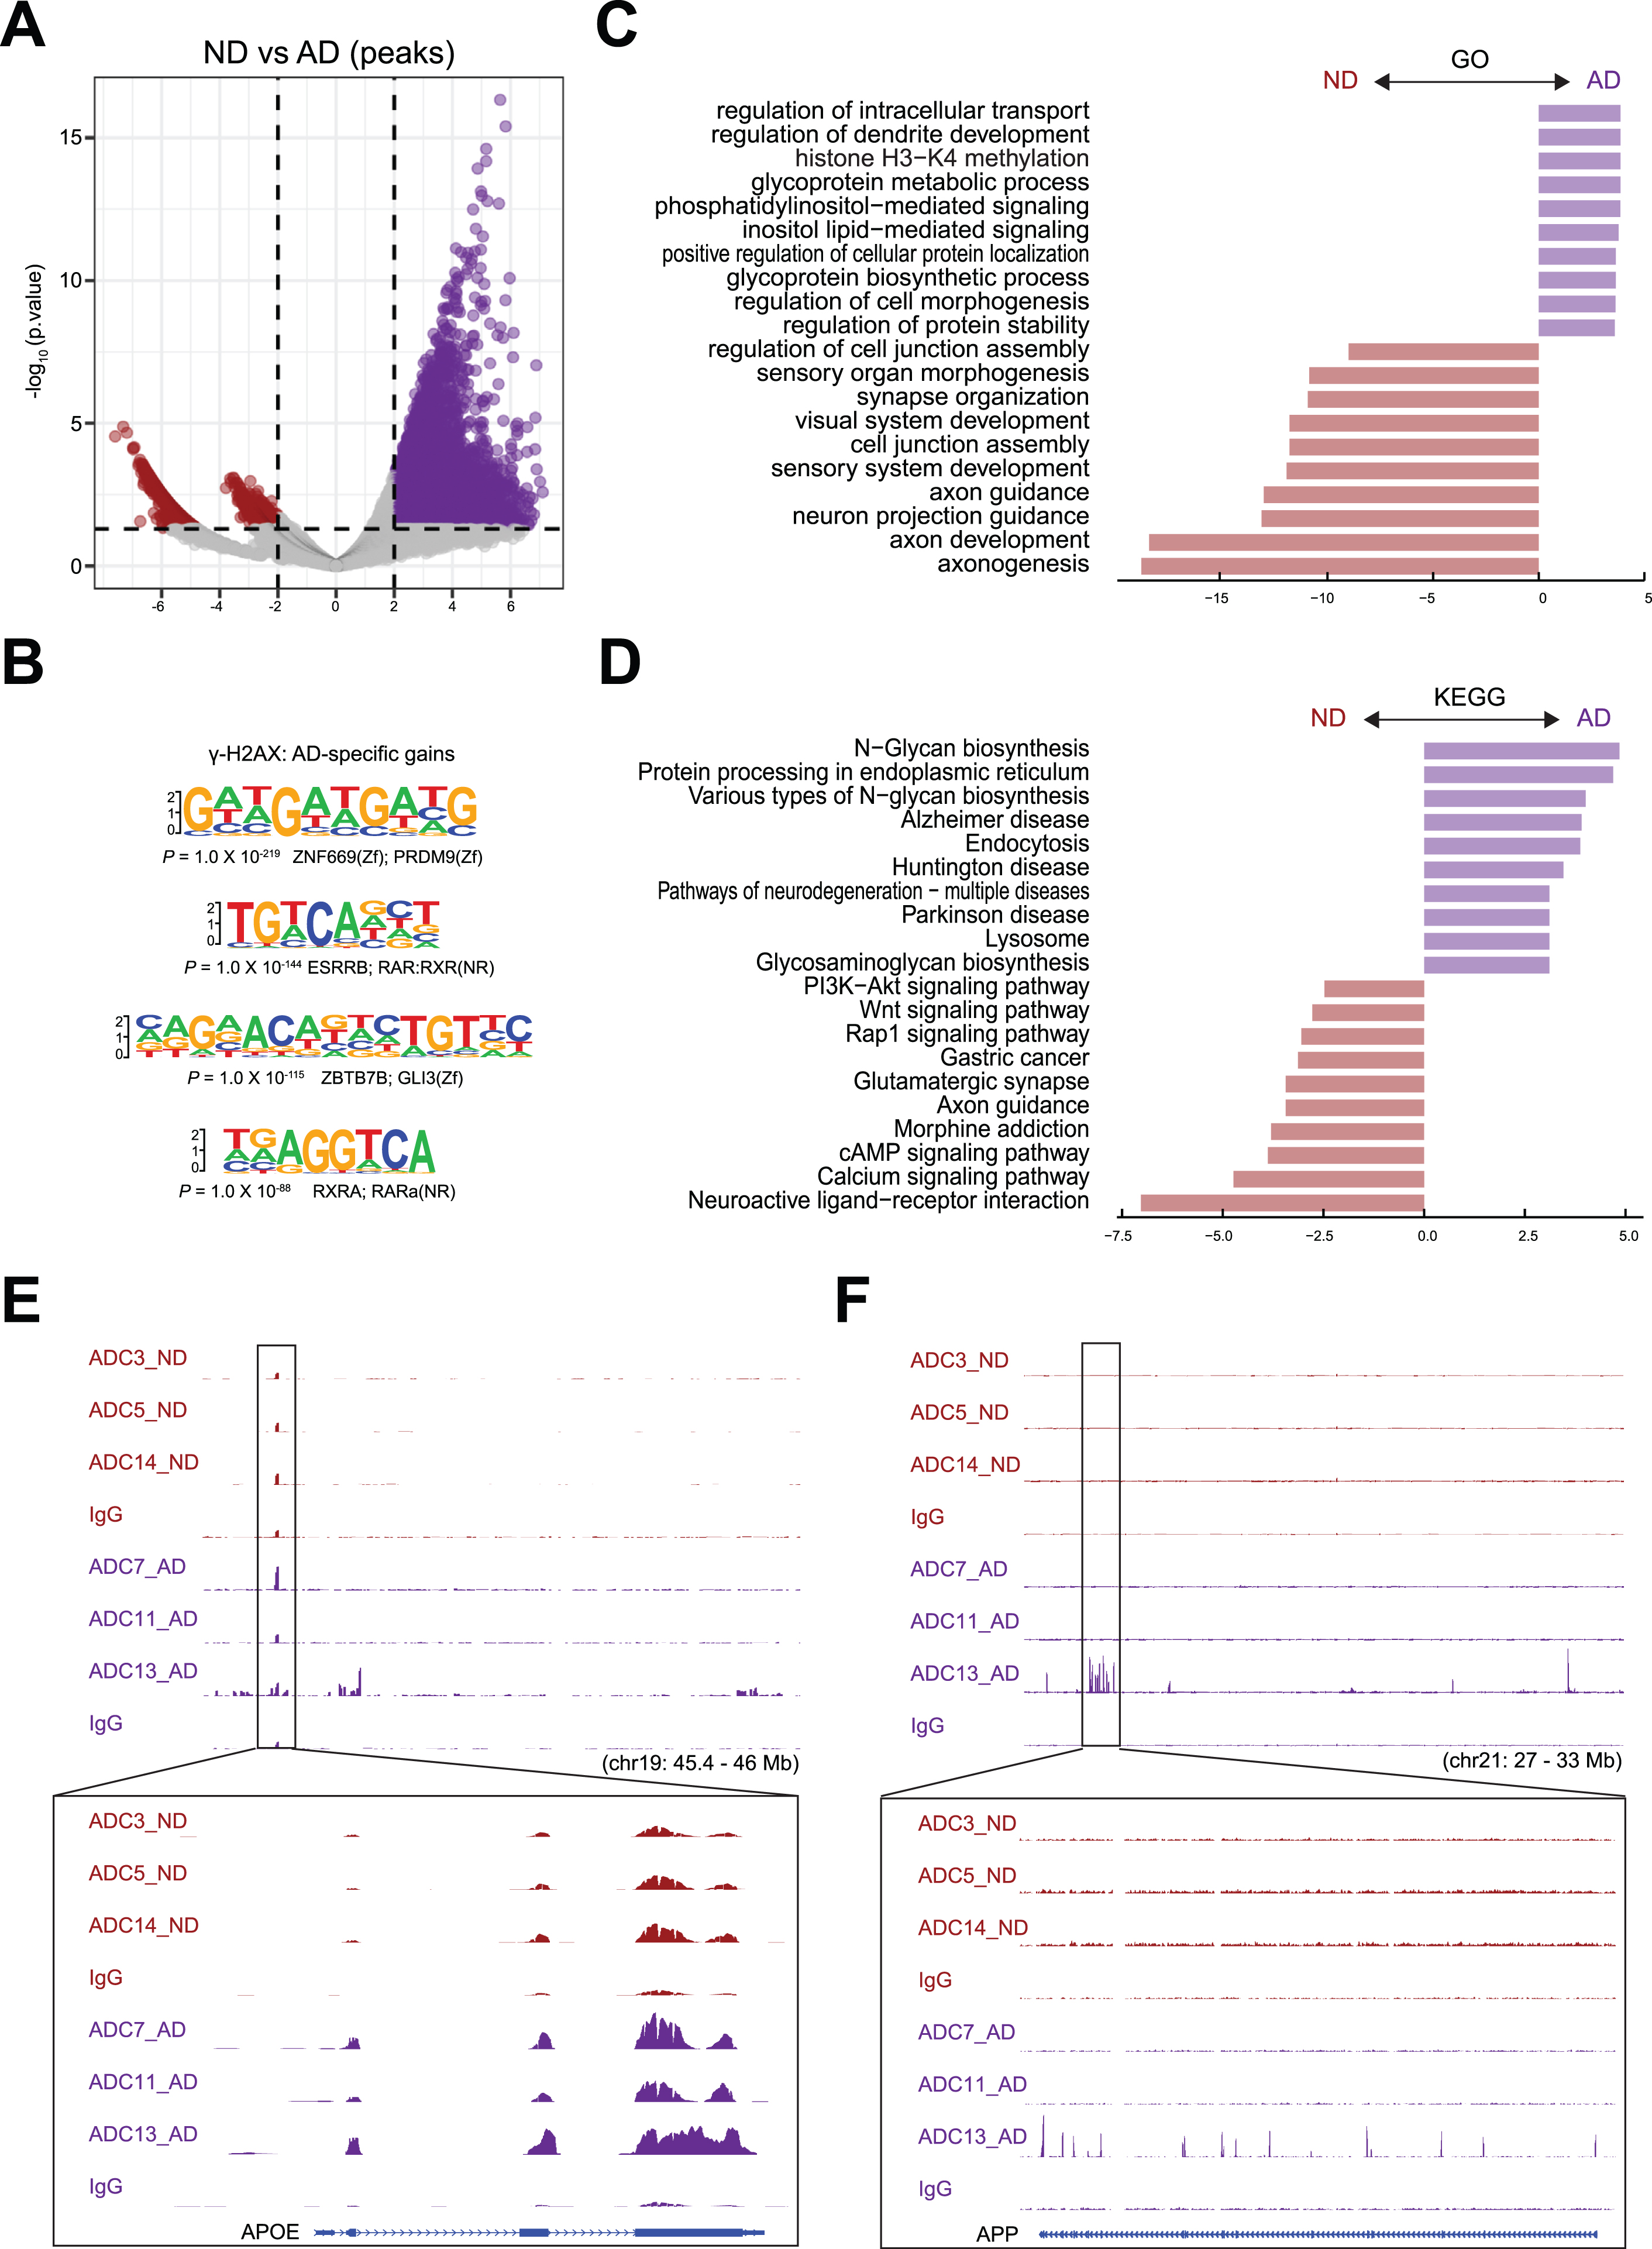
Differential peak analysis for DSBs. A) Differentially enriched γH2AX peaks between AD and ND. Number of differential peaks and peaks with >2-fold change is labeled. B) Sequences and significance of enrichment of DNA motifs at γH2AX binding sites in AD. C) GO analysis of biological processes for AD and ND enriched peaks. D) KEGG analysis for AD and ND enriched peaks. E) Representative image showing identified peaks binding in the APOE gene locus from AD and ND. F) Representative image showing identified peaks binding in the APP gene locus from AD and ND.
After annotating peaks to genes, we identified 12,345 genes with upregulated γH2AX occupancy and 722 genes with downregulated occupancy in AD samples, suggesting that these genes have increased and decreased numbers of DSBs in AD samples, respectively. After annotating peaks to genes using GREAT [31], we analyzed the genes using the Gene Ontology (GO) (Fig. 4C) and Kyoto Encyclopedia of Genes and Genomes (KEGG) databases (Fig. 4D). Our GO analysis data showed that the genes with upregulated γH2AX occupancy in AD samples were enriched for functions such as regulation of intracellular transport (e.g., DERL3, ATP13A2, and MAVS), regulation of dendrite development (e.g., OBSL1, RAB17, and PQBP1), histone H3-K4 methylation (e.g., RBBP5, OGT, and KMT2C), and glycoprotein metabolic process (e.g., POMT1, GOLPH3L, and COG3). Our GO analysis data showed that the genes with downregulated γH2AX occupancy in AD samples were enriched for functions such as axonogenesis (e.g., DAG1, MAP1S, and FEZ2), neuron projection guidance (e.g., EPS8L1, CDC42EP1, and F2RL1), synapse organization (e.g., GJA10, CTBP2, and GHSR), and cell junction assembly (e.g., CLDN2, GJD3, and MICALL2), which have been previously linked to normal brain development (Fig. 4C). Our KEGG analysis data showed that the genes with upregulated γH2AX occupancy were enriched for functions such as N-glycan biosynthesis (e.g., HS6ST1, XYLT1, and HS3ST3A1), protein processing in the endoplasmic reticulum (e.g., DERL3, UBE2G2, and BCAP31), Alzheimer’s disease (e.g., BAD, ADRM1, and VDAC2), and Parkinson’s disease (e.g., ADRM1, VDAC2, and SLC6A3). Among the KEGG pathways for genes with downregulated γH2AX occupancy in AD samples, there were categories related to neuroactive ligand-receptor interaction (e.g., CHRM4, GRIN3A, and CALCRL), the calcium signaling pathway (e.g., ATP2A2, AGTR1, and FGF20/), and the cAMP signaling pathway (e.g., GNG10, PDE7B, and PDE4D) (Fig. 4D).
Representative peaks at the known functional AD genes APOE and APP provided clear examples of upregulated γH2AX occupancy around the gene bodies in AD samples (Fig. 4E, F). APOE has three polymorphic forms, APOE2, APOE3, and APOE4. APOE4 encodes the apoE4 protein, which harbors amino acid changes from cysteine to arginine at positions 112 and 158. APOE4 increases an individual’s risk for developing late-onset AD, which is associated with an earlier onset of memory loss and other symptoms compared to those in individuals without this form [32, 33]. All 3 AD samples exhibited upregulated γH2AX occupancy in APOE (Fig. 4E). However, comparison of the individual samples showed variable levels of γH2AX occupancy around the TSS and the gene body of APP in the AD samples (Fig. 4F), suggesting that different individuals have various levels of DSBs.
Correlation of DSBs with upregulated gene expression in the AD brain
To test whether genes with increased numbers of DSBs exhibit dysregulated expression in AD, we analyzed their expression using a published RNA-seq dataset that contains data for 10 individual ND samples and 12 individual AD samples [34]. To identify the potential impact of DSBs on genes enriched for specific biological functions, we examined the expression of the genes according to the top 10 functional signatures with increased DSBs in AD samples (Fig. 4C). We found that the expression of genes in these functional signatures was upregulated in AD samples (Fig. 5A, upper panel). Conversely, genes in the top 10 functional signatures that lost γH2AX occupancy in AD samples exhibited downregulated expression in AD samples (Fig. 5A, lower panel). Thus, these results suggest that AD-related gain and loss of DSBs are correlated with aberrant up- and downregulated gene expression, respectively (Fig. 5A).
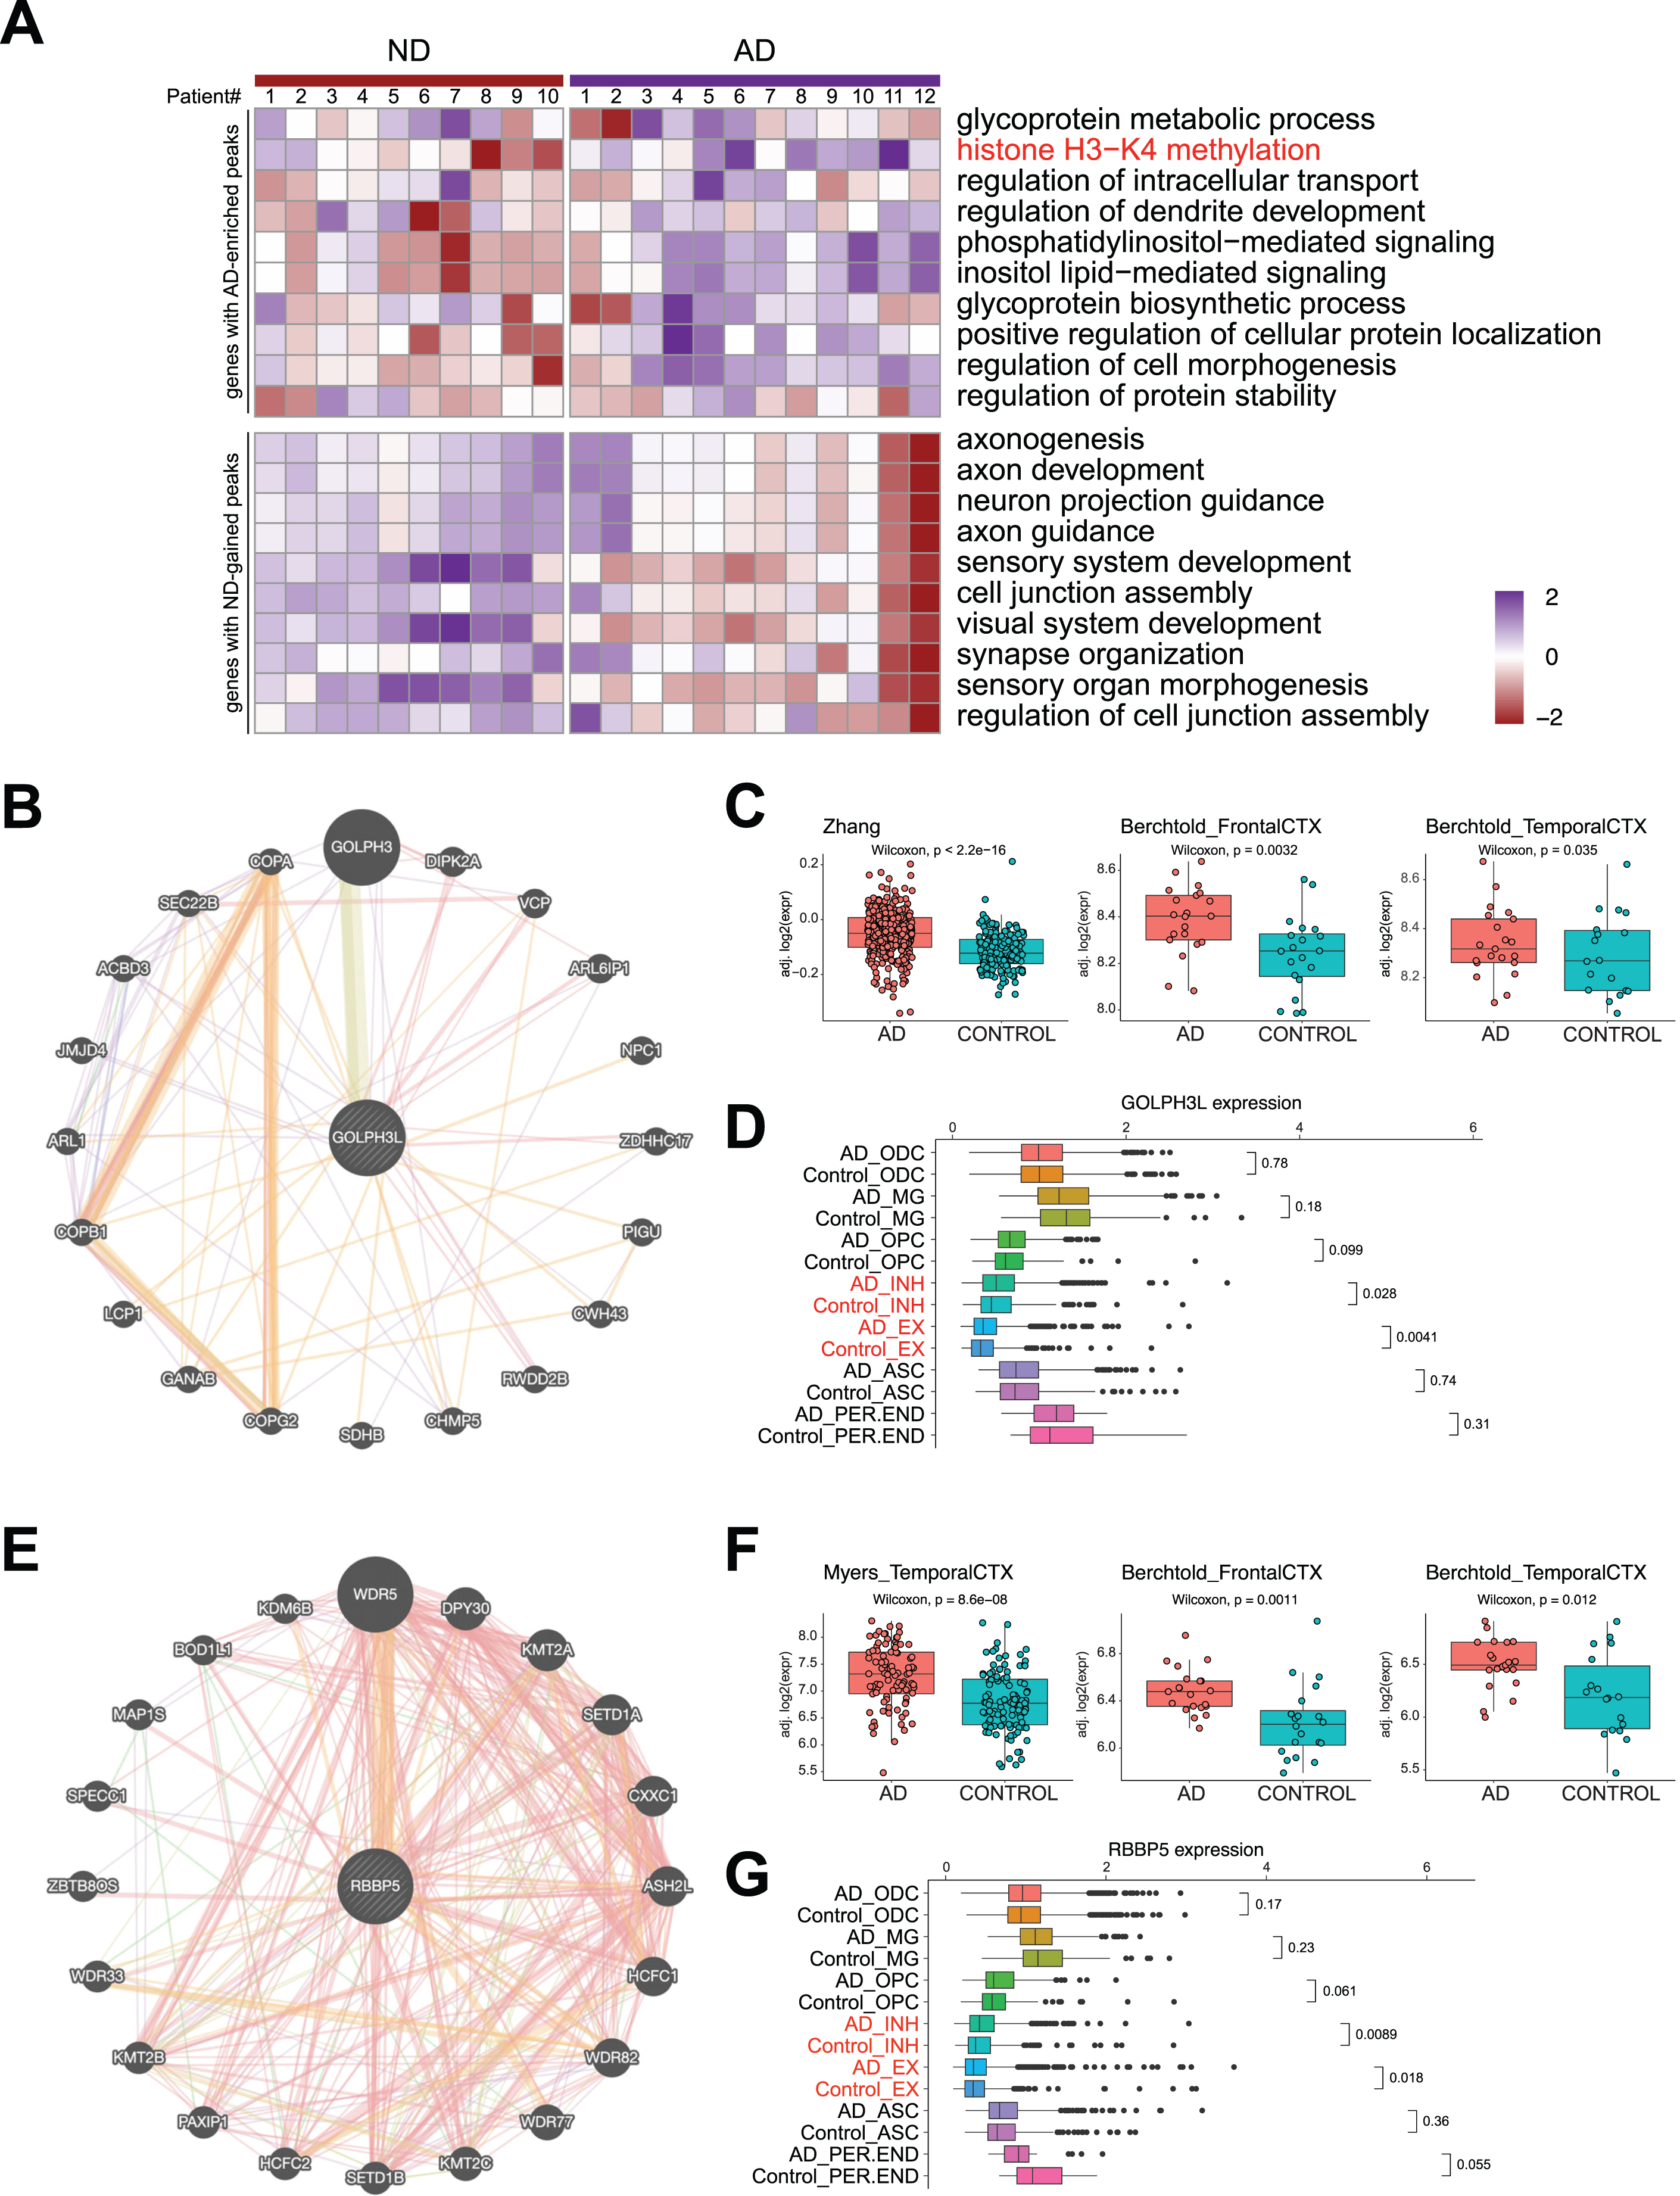
DSBs correlate with aberrant gene expression in AD. A) Heatmap showing AD and ND-associated signature level in AD and ND. B) STRING analysis of glycoprotein metabolic process-related genes revealing a protein interaction network with GOLPH3L. C) Boxplots showing GOLPH3L expression in three published RNA-seq datasets of AD and ND. D) Boxplots showing GOLPH3L expression in single cell RNA-seq datasets of AD and ND. E) STRING analysis of histone H3– K4 methylation-related genes revealing a protein interaction network with RBBP5. F) Boxplots showing RBBP5 expression in three published RNA-seq datasets of AD and ND. G) Boxplots showing RBBP5 expression in single cell RNA-seq datasets of AD and ND.
Next, we used STRING analysis [35] to identify the “hub” protein for the top GO functions, “glycoprotein metabolic process” and “histone H3-K4 methylation”. Analysis of the proteins encoded by genes in the “glycoprotein metabolic process” function revealed an interaction network of 20 proteins, of which GOLPH3L was located at the center (Fig. 5B). GOLPH3L is localized at the Golgi stack and may have a regulatory role in Golgi trafficking [36]. We examined GOLPH3L expression in three published large-scale RNA-seq studies using ND and AD samples [37–39], which revealed significant upregulation of GOLPH3L expression in AD samples (Fig. 5C). By investigating a single-cell RNA sequencing (scRNA-seq) dataset [40], we found that upregulation of GOLPH3L expression occurred in inhibitory (INH) and excitatory (EX) neurons in the AD brain (Fig. 5D). Additionally, increased chromatin accessibility is usually associated with activated gene expression [41, 42]. We thus compared the chromatin accessibility profiles in the GOLPH3L gene locus in AD and ND cells at the single-cell level using a single-nucleus assay for transposase-accessible chromatin with sequencing (snATAC-seq) dataset [40]. The chromatin accessibility of the GOLPH3L locus was significantly increased in astrocytes (ASCs), excitatory neurons (EXs), oligodendrocytes (ODCs), oligodendrocyte progenitor cells (OPCs), and microglia (MG) in AD patients (Fig. 6A). Strikingly, the regions where chromatin accessibility was increased in the GOLPH3L gene were located at the DSB sites we detected in AD samples (Fig. 6B). To further understand AD genetic risk signals, we examined GOLPH3L locus single-nucleotide polymorphisms (SNPs) using GWAS summary statistics in AD. We overlaid chromatin accessibility signals, DSB sites and GWAS statistics along the genomic axis, and our data suggested that genetic variants of GOLPH3L can result in aberrant DSB formation(Fig. 7C).
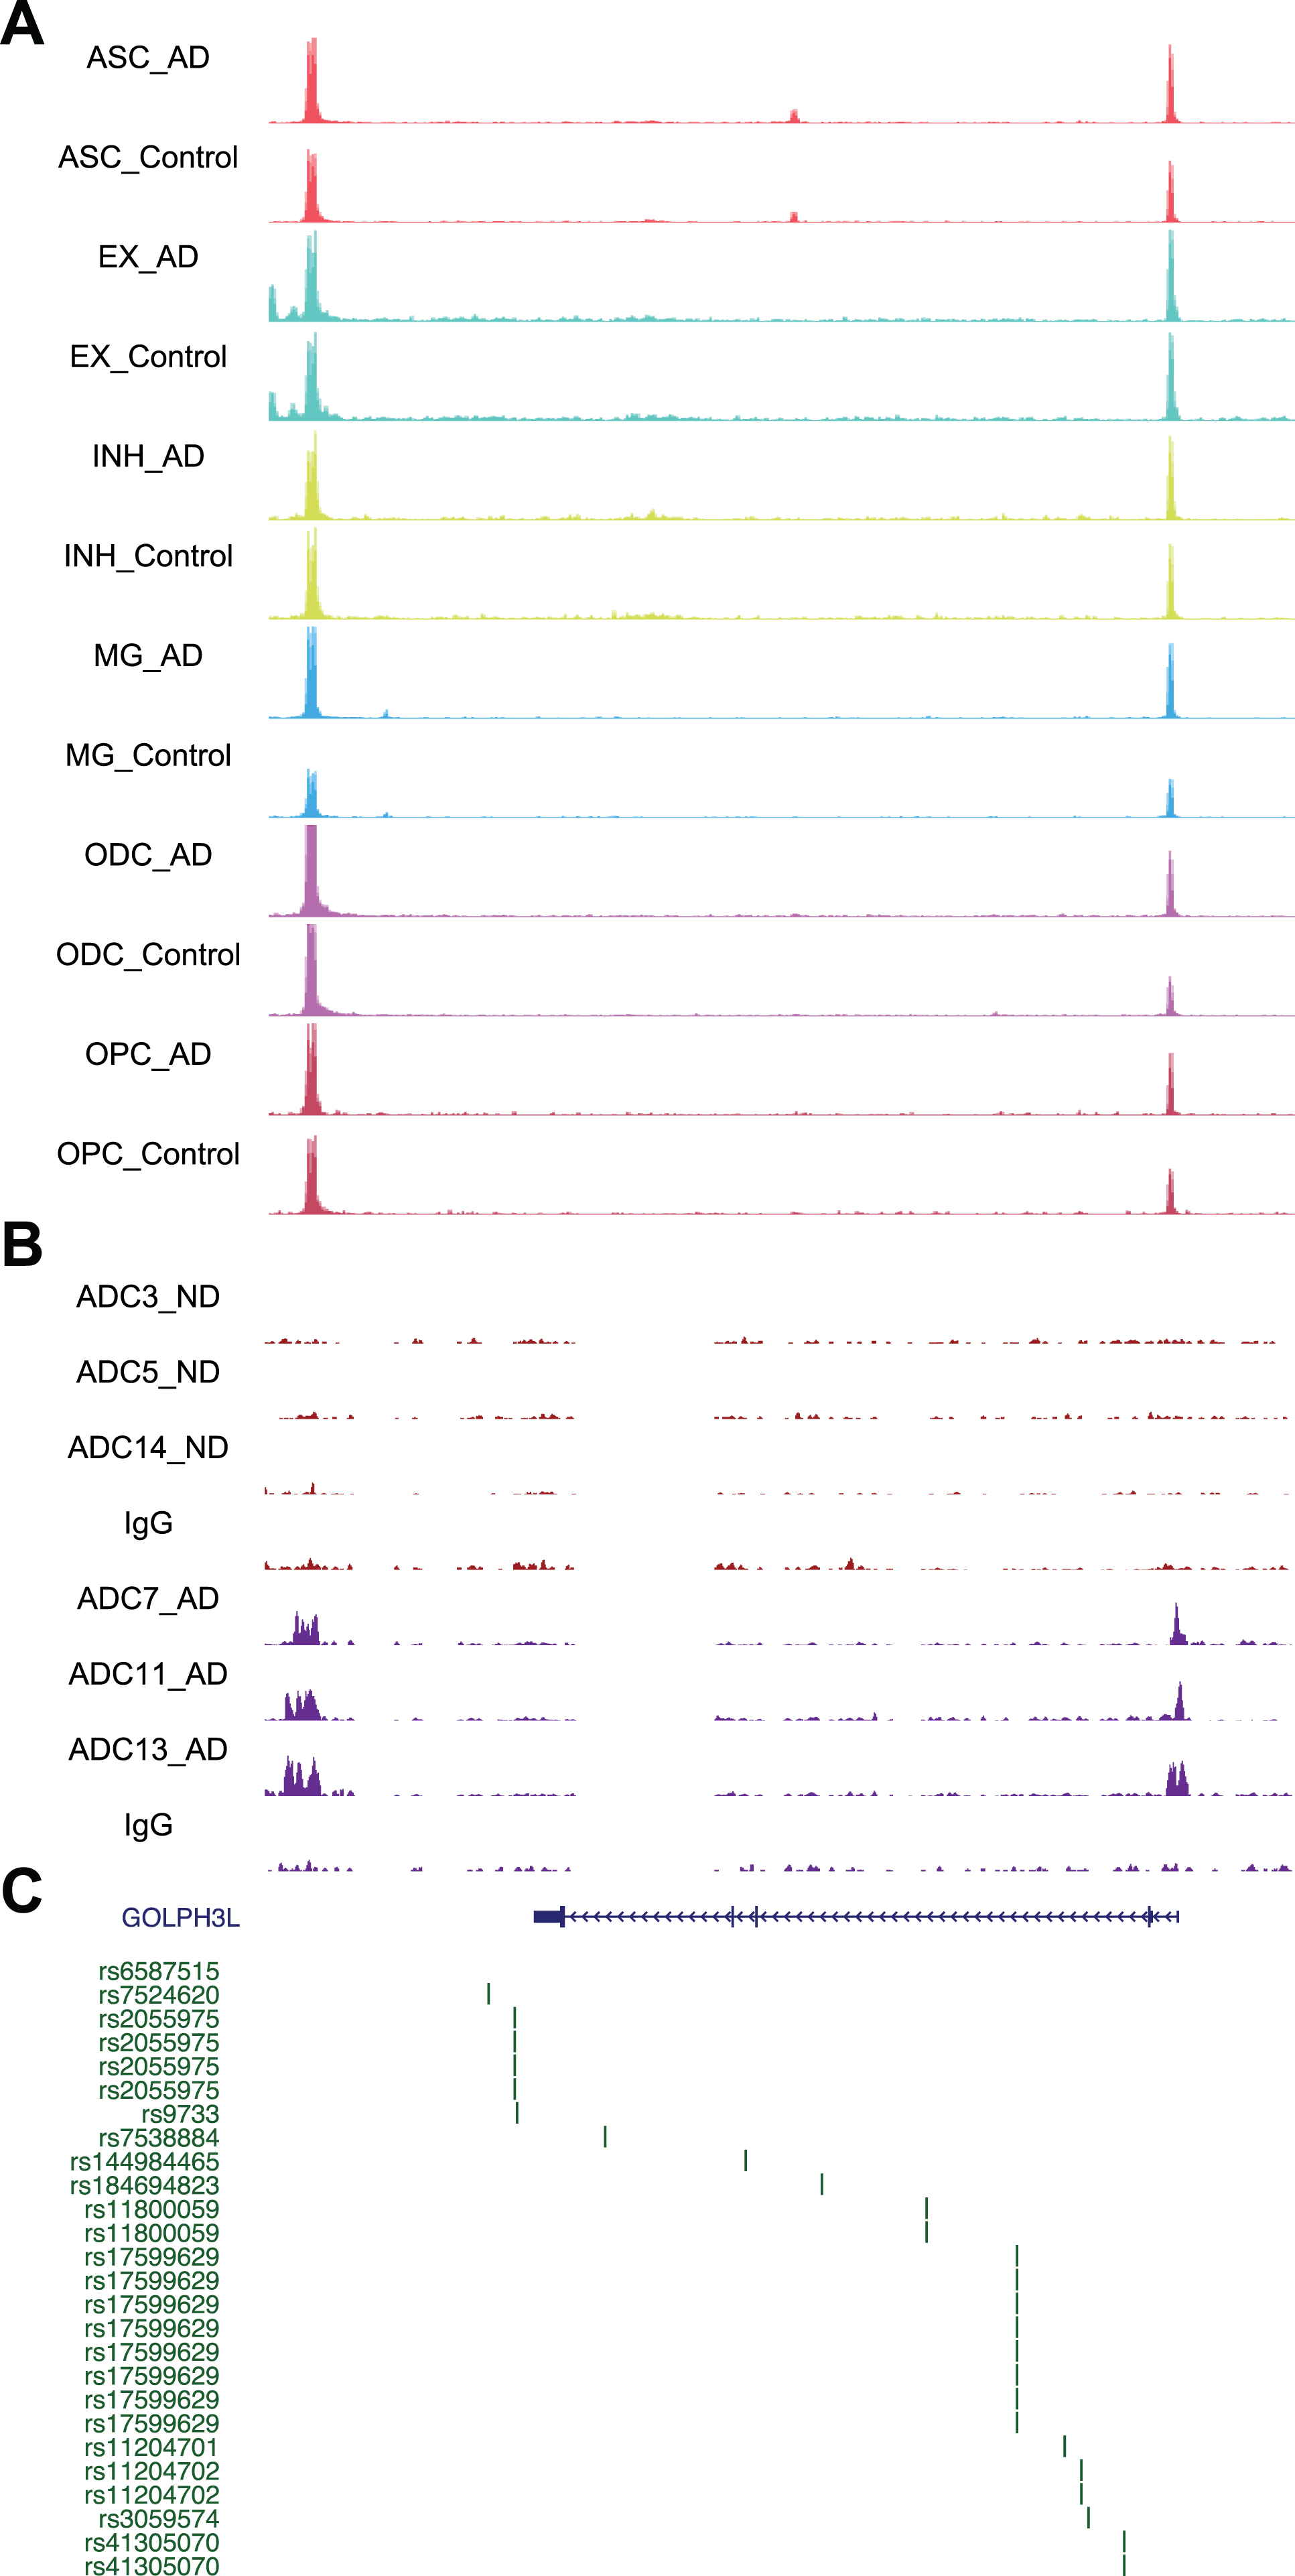
Chromatin accessibility, DSB sites, and GWAS for GOLPH3L. A) Representative image showing chromosome accessibility from single nuclei ATAC-seq datasets in the GOLPH3L gene locus. B) Representative image showing identified peaks binding in the GOLPH3L gene locus from AD and ND. C) AD GWAS statistics from Jansen et al. for SNPs at GOLPH3L locus are shown.
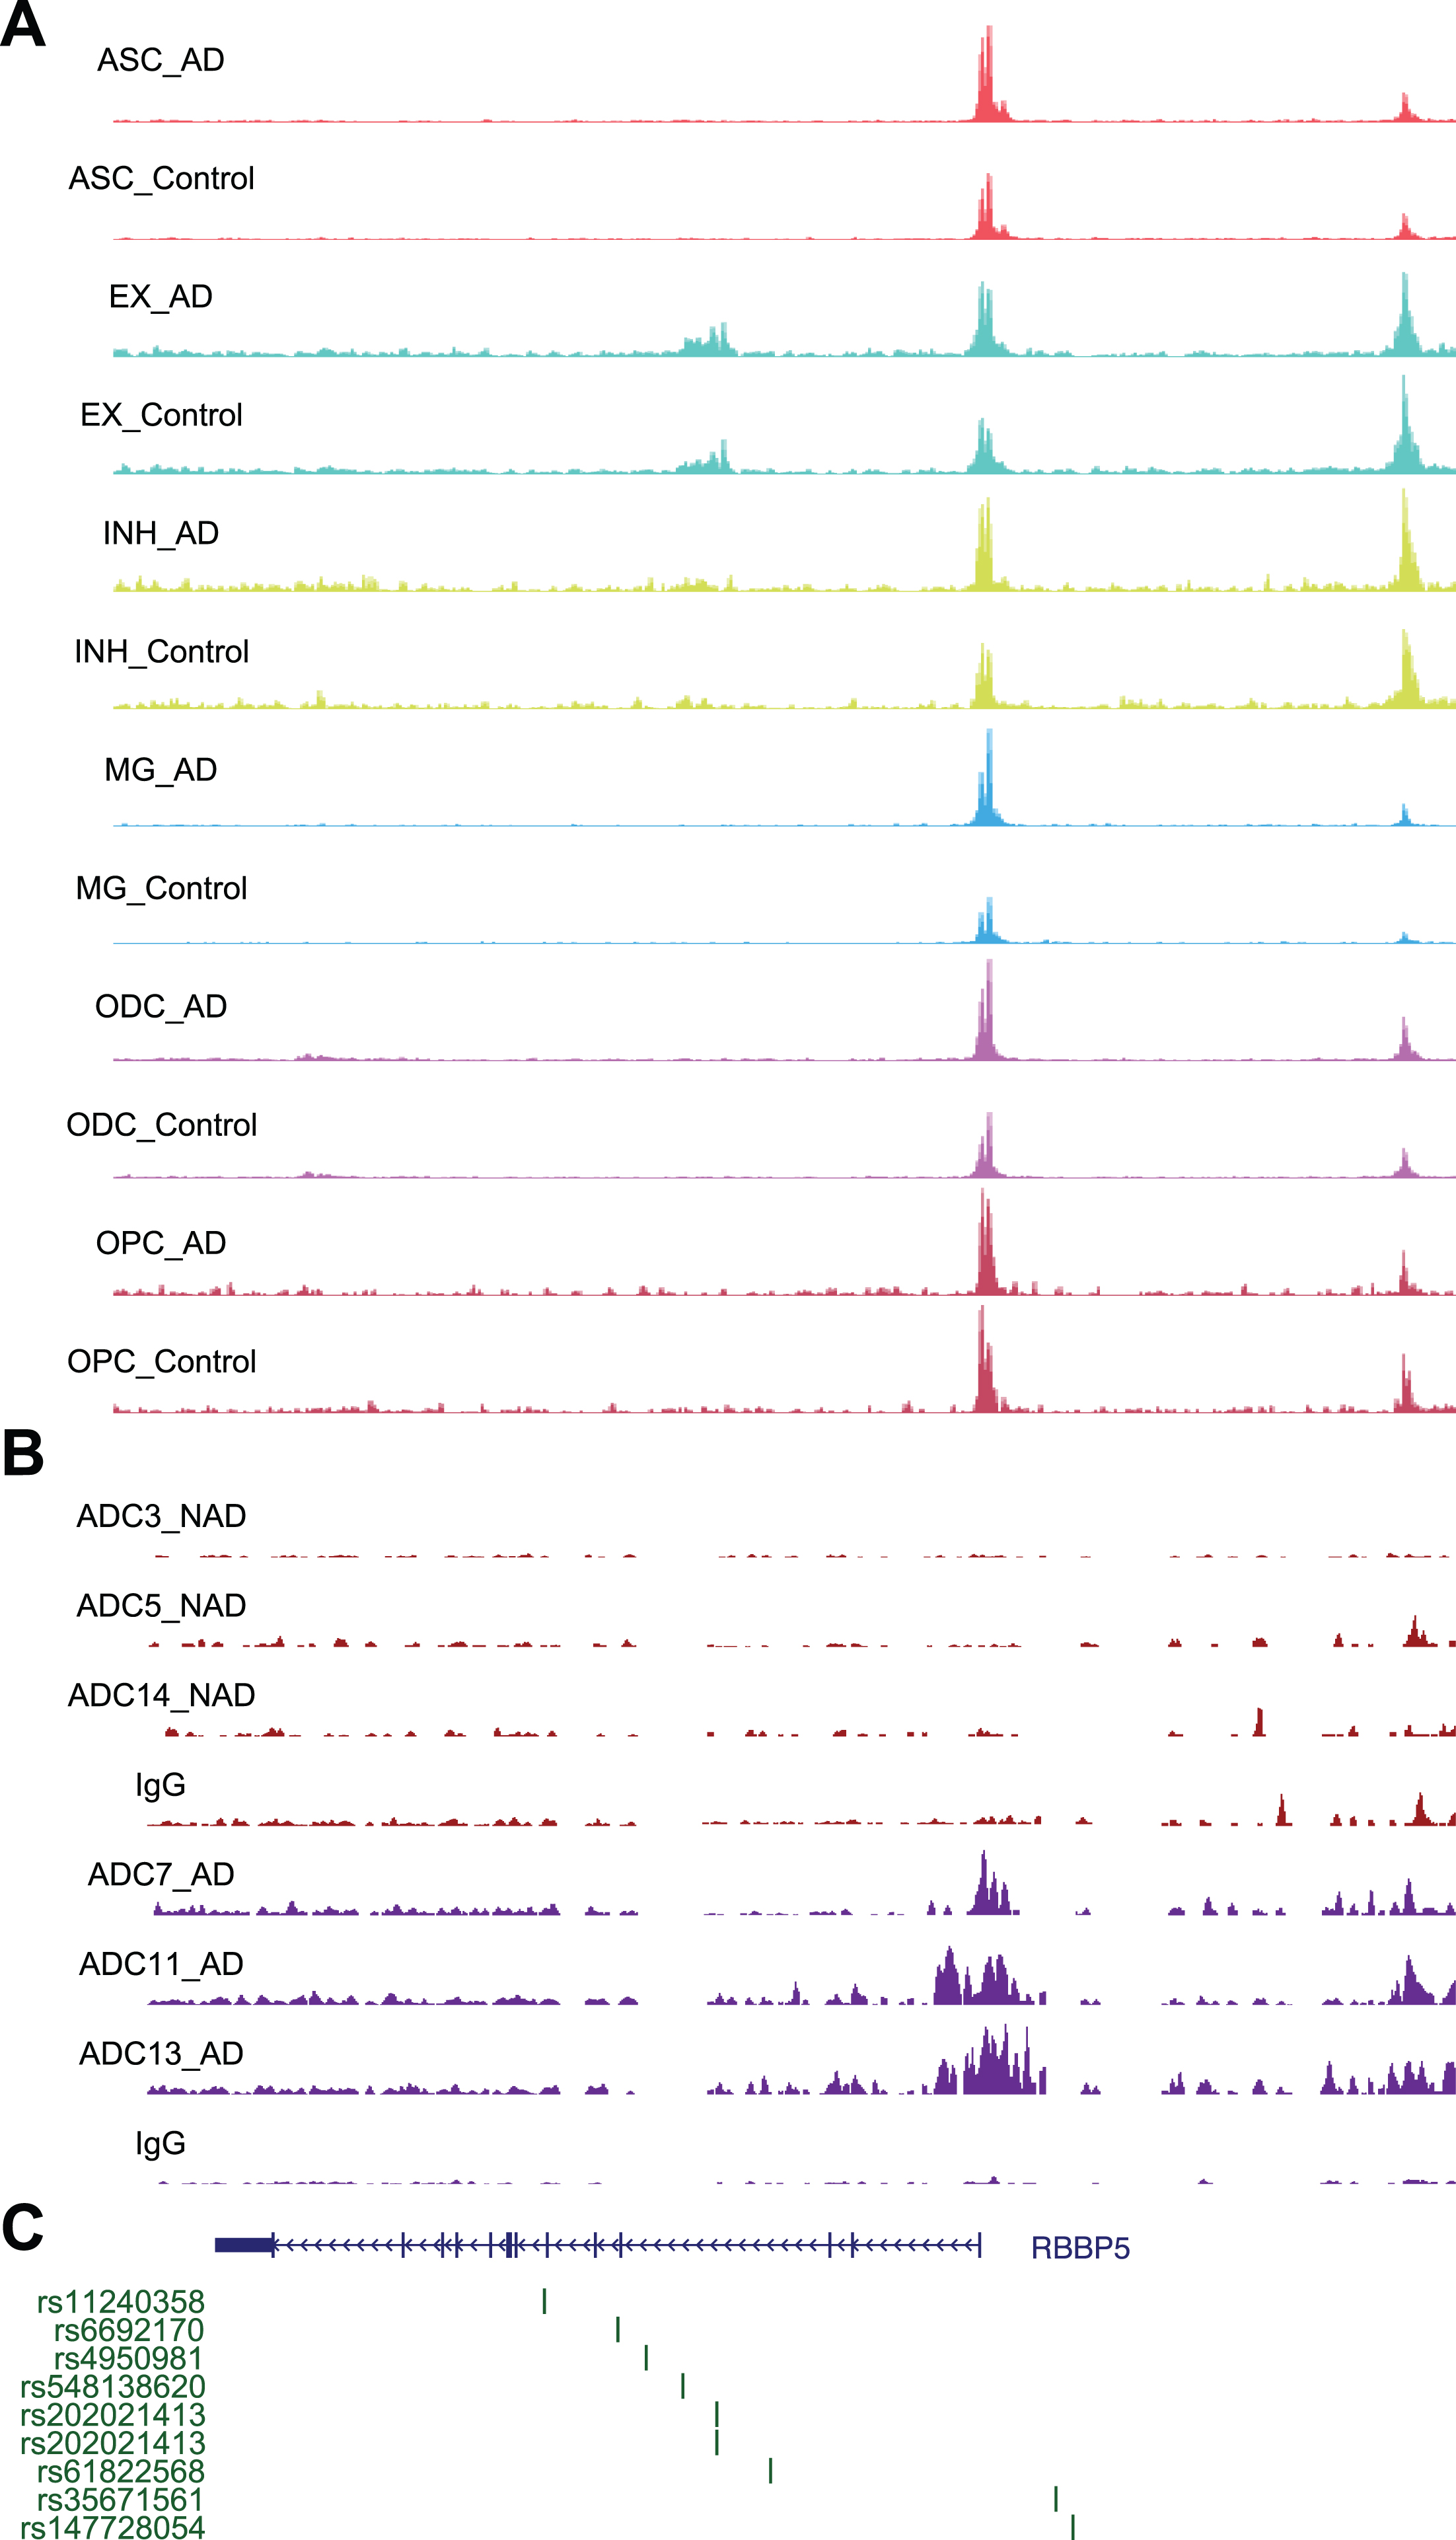
Chromatin accessibility, DSB sites, and GWAS for RBBP5. A) Representative image showing chromosome accessibility from single nuclei ATAC-seq datasets in the RBBP5 gene locus. B) Representative image showing identified peaks binding in the RBBP5 gene locus from AD and ND. C) AD GWAS statistics from Jansen et al. for SNPs at RBBP5 locus are shown.
Using a similar approach, we performed STRING analysis of proteins encoded by genes with the “histone H3-K4 methylation” function and revealed an interaction network of 20 proteins, with RBBP5 located at the center of the network (Fig. 5E). RBBP5 encodes a retinoblastoma protein-binding protein that regulates cell proliferation and is related to genes involved in transcription cis-regulatory region binding and histone H3K4 methyltransferase activity [43]. Comparison of RBBP5 gene expression across the AD and ND datasets revealed significant upregulation in the AD datasets [37–39] (Fig. 5F). At single-cell resolution, our results also revealed increased expression of RBBP5 in inhibitory (INH) and excitatory (EX) neurons in human AD patients (Fig. 5G). The chromatin accessibility of the RBBP5 locus was significantly increased in astrocytes, inhibitory neurons, excitatory neurons, oligodendrocytes, and microglial cells in AD patients (Fig. 7A), which correlated with the finding of the DSB site near the TSS of the RBBP5 gene (Fig. 7B). We overlaid chromatin accessibility signals, DSB sites and GWAS statistics along the genomic axis, and our data suggested that genetic variants of RBBP5 can result in aberrant DSB formation (Fig. 7C).
DISCUSSION
To our knowledge, this is the first report of an AD brain DSB landscape. Our data show that AD brains contain 18 times more DSBs than control brains and that the AD brain pattern of DSBs differs from the control brain pattern. In conjunction with published genome, epigenome, and transcriptome analyses, our data reveal that aberrant DSB formation correlates with AD-associated single-nucleotide polymorphisms (SNPs), increased chromatin accessibility, and upregulated gene expression. Thus, our data suggest that in AD, accumulation of DSBs at ectopic genomic loci contributes to aberrant upregulation of gene expression. The limitations of this study include a small sample size (3 ND and 3 AD) and a lack of female brain tissues. Thus, sex-specific differences in aberrant AD DSB formation were not addressed. In addition, gH2AX often spread across the region flanking DSBs for several hundred kilobases, particularly in euchromatin (spread less efficiently in heterochromatin), which prevent the precise and unbiased mapping of DSBsby gH2AX.
It is still not clear whether AD pathology itself causes DNA damage or whether accumulation of DNA damage contributes to the development of AD pathology. Studies have shown that several factors associated with AD pathology, such as Aβ and tau protein, can induce DNA damage in neurons [12, 45]. Aβ has been shown to damage DNA by generating free radicals and causing oxidative stress [46], while tau protein can indirectly contribute to DNA damage by disrupting the transport of molecules within neurons and by impairing DSB repair machinery [12, 47]. Additionally, inflammation, which is a hallmark of AD pathology [48], and mitochondrial dysfunction can also contribute to DNA damage by generating reactive oxygen species (ROS) [5, 49]. On the other hand, it is plausible that the accumulation of DNA damage occurs before the onset of AD. In this case, aging itself is a factor for the accumulation of DNA breaks [4, 50], and aging is known to be the most important risk factor for AD. Thus, the relationship between AD pathology and DNA damage is likely to be complex andreciprocal.
Our data show that genes bearing DSBs in AD exhibit increased chromatin accessibility. While DSBs are typically thought of as a form of DNA damage that jeopardizes genome integrity, our study shows that a consequence of ectopic DSBs in the AD brain is upregulated gene expression. This observation adds to the body of evidence that DSBs activate gene expression [51]. When a DSB occurs in the vicinity of a gene, it can trigger a cascade of molecular events that leads to the recruitment of repair proteins in the DDR pathway to the site of the break. These proteins can also recruit other proteins, such as histone modifiers and chromatin-remodeling factors, that can modify the structure of chromatin, resulting in opening of the chromatin structure and making the gene more accessible to transcription factors and RNA polymerase. This can ultimately lead to activation of the gene and to an increase in the expression of its encoded protein. In particular, in brain cells, this process is mediated by TOP2B to promote early response gene expression during physiological processes, including learning and memory, via triggering of the release of CTCF from cohesins and tethering of enhancer and promoter regions, which thereby activates RNA polymerase II activity [20]. Whether a similar mechanism underlies DSB-correlated upregulation of gene expression is not known and is worth furtherinvestigation.
The accumulation of DSBs likely results from both increased de novo DSB formation and impaired DSB repair. Regarding the latter possibility, mutations in the genes that encode proteins in the DDR pathway have been linked to neurodegenerative diseases, including AD [13–16], suggesting that a lack of DNA repair is involved. Aside from cellular stresses, such as ROS overload and mitochondrial dysfunction, the mechanism that promotes de novo DSB formation by endonucleases is still poorly understood. DNA topoisomerases may be involved in this process. For example, as mentioned above, TOP2B is involved in generating DSBs in neuronal cells [20], but it is unclear whether its activity is dysregulated in AD pathology. In addition, SPO11, a relative of archaeal topoisomerase VI involved in producing meiosis-specific DSBs for homologous recombination [52], appears to be expressed in the brain[17].
Our data showed that the binding site for PRDM9 was enriched in genes that had increased γH2AX occupancy in AD samples. PRDM9 plays a crucial role in the meiotic homologous recombination process by initiating recombination and determining the subset of sites within the genome— called recombination hotspots— that recombine. PRDM9 does this by binding DNA, placing epigenetic marks, mostly H3K4me3, at hotspots. After that, SPO11 is recruited to catalyze a DSB at a subset of these PRDM9-activated hotspots. Interestingly, H3K4me3 levels are significantly elevated in human AD as well as in AD mouse models [53]. Additionally, inhibiting H3K4-specific methyltransferase ameliorates glutamatergic synaptic function and improves memory-related behavior in AD mouse models [53, 54]. Although PRDM9 is relatively specific to germ cells and is not prominently expressed in the brain based on in situ hybridization information from https://portal.brain-map.org, these data together implicate a potentially similar pathway involving H3K4me3 in AD pathogenesis and present H3K4me3 as an appealing therapeutic target.
Footnotes
ACKNOWLEDGMENTS
We thank Cynthia Shaddy-Gouvion at KUMC Histopathology Core for preparing frozen autopsied tissues and FFPE sections.
FUNDING
This study was supported by R01-HD103888, 3R01-HD103888-03S1, KU ADRC P30 AG072973, the KU School of Medicine, and the Landon Center on Aging (N.W.). This project was supported by an Institutional Development Award (IDeA) from the National Institute of General Medical Sciences of the National Institutes of Health under grant number P20 GM103418 (X.Z.). The content is solely the responsibility of the authors and does not necessarily represent the official views of these funders. Kansas Intellectual and Developmental Disabilities Research Center (NIH U54 HD 090216), the Molecular Regulation of Cell Development and Differentiation – COBRE (P30 GM122731-03) - the NIH S10 High-End Instrumentation Grant (NIH S10OD021743) and the Frontiers CTSA grant (UL1TR002366) at the University of Kansas Medical Center, Kansas City, KS, USA.
CONFLICT OF INTEREST
Russell Swerdlow is an Editorial Board Member of this journal but was not involved in the peer-review process nor had access to any information regarding its peer-review.
The authors have no conflict of interest to report.
DATA AVAILABILITY
The dataset used in the current study has been uploaded and will be made publicly available at NCBI (GSE231568).