
Abstract
Background:
Numerous mouse models of Alzheimer’s disease (AD) are available, but all suffer from certain limitations, thus prompting further attempts. To date, no one model exists with amyloidopathy in a BALB/c strain.
Objective:
To generate and characterize the C.B6/J-APP swe mouse, a model of AD with a mutated human gene for the amyloid-β protein precursor (AβPP) inserted in a BALB/c background.
Methods:
We analyzed five groups at different ages (3, 6, 9, 12, and 16–18 months) of C.B6/J-APP swe and wild-type mice (50% males and 50% females) for the main hallmarks of AD by western blotting, amyloid-β (Aβ) ELISA, immunocytochemistry, electrophysiology, and behavioral tests.
Results:
The C.B6/J-APP swe mouse displays early AβPP and Aβ production, late amyloid plaques formation, high level of Tau phosphorylation, synaptic deficits (reduced density and functional impairment due to a reduced post-synaptic responsiveness), neurodegeneration caused by apoptosis and necroptosis/necrosis, microgliosis, astrocytic abnormalities, and sex-related differences in explorative behavior, anxiety-like behavior, and spatial long-term and working memories. Social housing is feasible despite the intra-cage aggressiveness of male animals.
Conclusion:
C.B6/J-APP swe mice develop most of the distinctive features of AD and is a suitable model for the study of brain atrophy mechanisms and of the differences between males and females in the onset of cognitive/non-cognitive deficits.
Keywords
INTRODUCTION
Alzheimer’s disease (AD) is the most common neurodegenerative disorder of the elderly [1] and no effective therapeutic strategy is available yet for the treatment of this pathology [2]. AD research suffers from severe limitations hampering human studies, such as diagnostic uncertainty, lack of control over interfering variables, and difficulty in collecting well-preserved cerebral samples. Numerous animal models have been created to overcome these problems [3, 4], and their value depends on their capability to develop AD main characteristics and provide information that can be generalized to humans.
We developed a new congenic mouse (C.B6/J-APP swe ) by introducing the human gene carrying the Swedish mutation of the amyloid-β protein precursor (AβPPswe) into the BALB/c genetic background, thus generating the first model of β-amyloidopathy with this genetic milieu [5]. The reasons for choosing BALB/c mice included good breeding performance and long reproductive lifespan, high brain weight and hippocampal volume (to minimize the need for tissue pooling), and some AD-like features such as low brain acetylcholinesterase activity and high plasma cholesterol [6–8]. Moreover, although BALB/c mice are considered moderately to highly aggressive depending on the laboratory [9], in our colonies they proved a lower intra-littermate violent behavior than other strains commonly used to create AD models (e.g., C57BL/6). This feature may ensure prolonged survival of a higher number of non-isolated animals. Hence, the C.B6/J-APP swe model, minimizing single housing, could prevent social deprivation that significantly biases data strength.
The present study aimed to characterize the morphological, functional, and cognitive phenotype of C.B6/J-APP swe mice and to establish whether they develop the distinctive pathological features of the disease.
MATERIALS AND METHODS
Animals
The C.B6/J-APP swe congenic mouse was generated by introducing the human AβPPswe gene into the BALB/c genetic background by backcrossing animals from a mixed C57BL/6 and SJL milieu (Tg2576 mouse, Taconic Biosciences, USA) for ten generations (Fig. 1), according to a Research Crossbreeding Agreement with Taconic Biosciences (formerly Taconic Farms, Inc., item no. 8902). We named the new model following the “Guidelines for Nomenclature of Mouse and Rat Strains” [10].
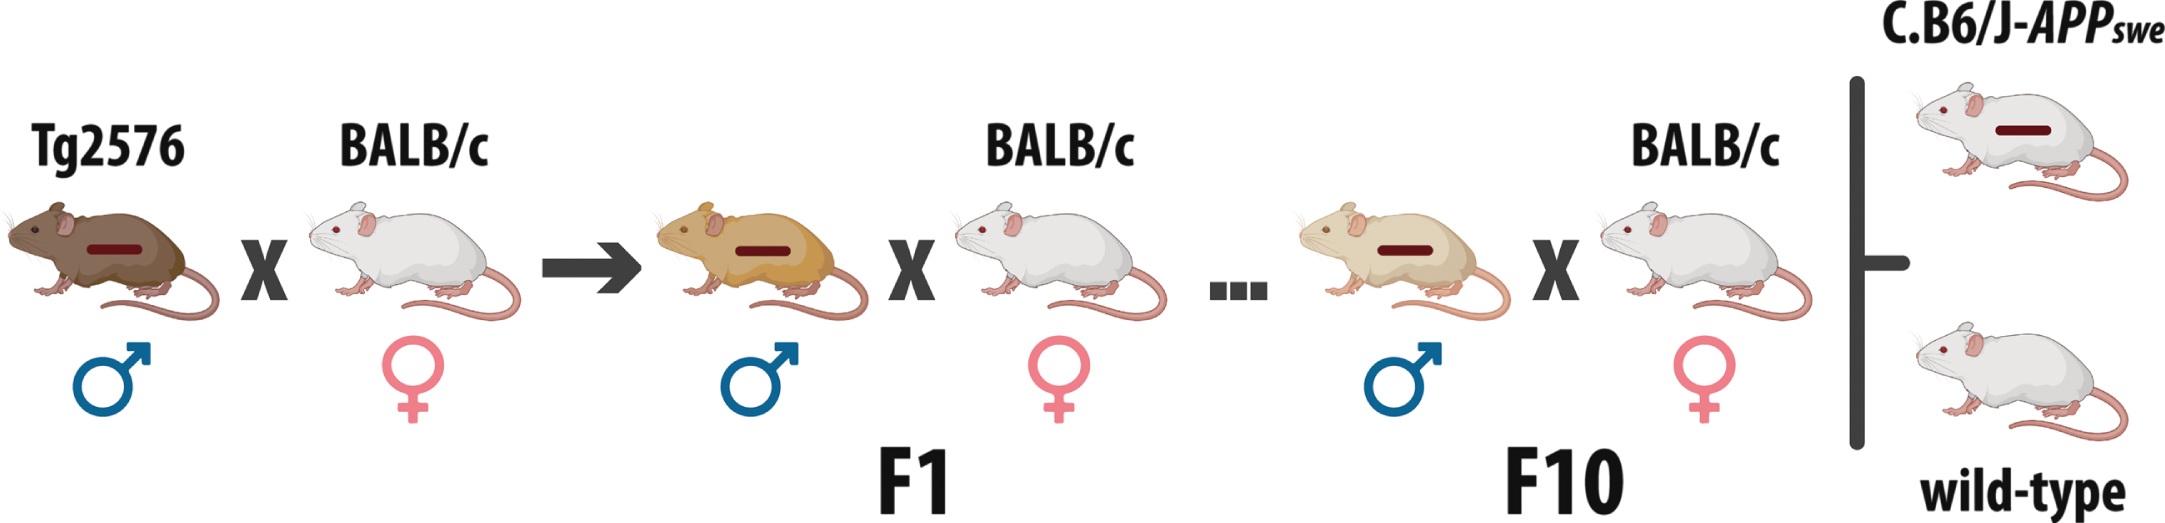
Generation of the C.B6/J-APP swe congenic mouse. The first mating was between Tg2576 males and BALB/c females. Then, from F1 to F10, BALB/c females were mated with male animals of each new generation carrying the transgene. To breed the congenic colony, female studs are obtained mating wild-type mice, while male studs are chosen from the broods used for the experiments. The horizontal bar superimposed on mice represents the transgene.
Animals were housed 4/6 per cage in a specific pathogen free facility under controlled environmental conditions (room temperature, 20–22°C; relative humidity, 50–55%; 12-h artificial light-dark cycle with the light phase starting at 6 a.m.) with ad libitum access to food and tap water. Enrichment objects such as cardboard tunnels, plastic shelters, paper nesting material and wooden gnawing sticks were provided. Animals were also monitored in accordance with the “Working document on genetically altered animals” [11]. All procedures were conducted in line with the European Union legislation (Directive 2010/63/EU) and approved by the Italian Ministry of Health (168/2016-PR).
Survival and growth curves
Sixty wild-type and sixty C.B6/J-APP swe mice (50% females and 50% males each) were followed from the 8th week of life until their natural death. The body weight of each animal was measuredweekly.
Western blotting
Twelve wild-type and twelve C.B6/J-APP swe mice (50% females and 50% males each) aged 3, 6, 9, 12, and 16–18 months were sacrificed by cervical dislocation. The hippocampi and cortices were removed and homogenized in lysis buffer (2% SDS, 0.2% PMSF, 1% aprotinin and 0.2% leupeptin; 5% tissue weight/buffer volume), sonicated (8μm of amplitude for 30 s) and centrifuged at 100,000× g for 1 h at 10°C [12]. The supernatants, containing the soluble fractions of AβPP, were collected and kept at –80°C until use. Protein concentration was determined by the Lowry method [13], and 30μg of protein were used based on the linearity assay results. Samples were boiled for 3 min, separated on 4–20% precast polyacrylamide gels (Bio-Rad Laboratories, USA) and electrotransferred to nitrocellulose membranes, which were soaked overnight in 5% non-fat dry milk in phosphate buffered saline (PBS) plus 10% Tween 20 (blocking buffer) at 4°C. Membranes were subsequently incubated for 2 h at room temperature in the following primary antibodies: mouse 6E10 (1:1,000, BioLegend, USA) that recognizes transgenic amyloid-β (Aβ) oligomers and AβPP (amino acid residues 1–16); mouse M3.2 (1:1,000, BioLegend, USA) that recognizes residues 10–15 of murine Aβ peptides and the same sequence in AβPP full length; mouse 22C11 (1:1,000, Merck Millipore, USA) that recognizes both transgenic and murine AβPP and specifically reacts with amino acids 66–81 of the extracellular N-terminus, identifying all three protein isoforms (immature, secreted, and mature); mouse anti-Actin, clone C4 (1:10,000, Merck Millipore, USA). After washes in PBST, membranes were incubated in secondary antibody conjugated to horseradish peroxidase (ImmunoReagents, USA) diluted 1:8,000 in blocking buffer and visualized using an enhanced chemiluminescence detection kit (Amersham Biosciences, UK). Samples were tested in duplicate. Optical density was measured using the KS300 Image Analysis Software (Carl Zeiss AG, Germany) and Actin was used as the loading control for signal normalization.
Aβ ELISA assay
C.B6/J-APP swe mice aged 3, 6, 9, 12, and 16–18 months (5 females and 5 males per age group) were sacrificed by cervical dislocation. The hippocampi and cortices were removed, weighed, and frozen in liquid nitrogen until use. The concentrations of transgenic soluble and insoluble Aβ40 and Aβ42 peptides were determined using commercial ELISA kits (EZBRAIN40 and EZBRAIN42, Merck, USA) according to the manufacturer’s instructions. Aβ40 and Aβ42 peptides were diluted 1:16 and 1:2 respectively, to obtain absorbance values within the range of the standard curve. Samples were tested in duplicate, and results were expressed as pg/mg braintissue.
Immunocytochemistry
Eight wild-type and eight C.B6/J-APP swe mice (50% females and 50% males each) aged 3, 6, 9, 12, and 16–18 months were deeply anesthetized with an intraperitoneal injection of 2,2,2-tribromoethanol (200 mg/kg body weight) and transcardially perfused with 4% paraformaldehyde in phosphate buffer. Brains were removed and post-fixed in 4% paraformaldehyde for 24 h at 4°C. Each hemisphere was cut with a vibratome into 40μm thick transverse sections from 1,340 to 2,460μm caudal to the bregma. One section every 120μm was used for neuron count. Sections were washed in PBS, treated with 70% formic acid (6E10 and 4G8 antibodies), permeabilized with 0.1% Triton-X and blocked in 10% normal horse serum (NHS) plus 0.1% Triton-X. The primary antibodies (mouse 6E10 (1:1,000) and mouse 4G8 (1:1,000), both from BioLegend, USA; mouse anti-pTau [phosphorylation at Ser202 and Thr205] (1:20, Thermo Fisher Scientific, USA); mouse anti-synaptophysin (SYP) (1:250), mouse anti-NeuN (1:1,000) and mouse anti-GFAP (1:1,000), all from Merck Millipore, USA; rabbit anti-Iba1 (1:1,000, Wako, Japan); rabbit anti-cleaved Caspase-3 (cleaved-CASP3) (1:400); and rabbit anti-RIP3 (1:400), both from Cell Signaling Technology, USA) were diluted in PBS containing 1% NHS plus 0.1% Triton-X. Sections were incubated overnight at 4°C. The secondary biotinylated antibody (Vector Laboratories, USA) was diluted 1:200 in PBS containing 1.5% NHS; sections were soaked for 2 h at room temperature. After treatment with 3% H2O2, sections were incubated with avidin-biotin peroxidase complex (1:50) for 1 h (Vector Laboratories, USA). They were subsequently treated with fresh 3% 3,3-diaminobenzidine tetrahydrochloride solution and, after several washes, mounted on glass slides, dehydrated in a graded ethanol series, delipidated in xylene and coverslipped. Experimental controls were prepared by omitting the primary antibody. Hippocampal CA1 and CA3 pyramidal neurons, granule cells of the dentate gyrus (DG) and all the layers of the parietal cortex (PCtx) were examined. Levels of pTau and synaptic density were evaluated in the CA1 and CA3 stratum radiatum, the molecular layer of DG and all PCtx laminae. Quantitative immunocytochemistry was performed by means of the KS300 Image Analysis Software.
Histochemistry
To assess the morphological changes due to aging and/or AβPPswe gene expression, sections cut for immunocytochemistry, randomly selected from wild-type and congenic mice of all age groups and both sexes, were stained with thionine (5% thionine, 1 M sodium acetate, and 1 M glacial acetic acid in distilled water) for 20 min. Neurofibrillary tangles in C.B6/J-APP swe mice were demonstrated with Bielschowsky silver stain, according to the manufacturer’s recommendations (Bielschowsky Silver Stain Kit, Abcam, UK).
Electrophysiology
Six wild-type and seven C.B6/J-APP swe mice of both sexes aged 9–10 months were used. Local field potentials (LFPs) recordings were performed in vitro as previously described [14]. Briefly, mice were deeply anesthetized with isoflurane and decapitated. Brains were removed and 300μm thick transverse slices of the dorsal hippocampus were prepared using a vibratome (VT1200S Leica Microsystems, Germany (RRID:SCR_016495)) in oxygenated (95% O2/5% CO2) ice-cold slicing solution containing: 87 mM NaCl, 2.5 mM KCl, 25 mM NaHCO3, 0.5 mM CaCl2, 7 mM MgCl2, 1.25 mM NaH2PO4, 25 mM d-glucose, and 75 mM sucrose. For recovery, slices were incubated in a holding chamber with oxygenated normal artificial cerebrospinal fluid (ACSF) containing: 126 mM NaCl, 2.5 mM KCl, 2.5 mM CaCl2, 1.5 mM MgCl2, 1.25 mM NaH2PO4, 26 mM NaHCO3, and 10 mM glucose at pH 7.4 for 30 min at 32°C, and at room temperature for at least further 45 min. Slices were then placed in the recording chamber and perfused with oxygenated ACSF at a 1.5 ml/min flow rate. LFPs were recorded in CA1 stratum radiatum using glass microelectrodes (1-2 MΩ) filled with ACSF in response to Schaffer collateral (SC) stimulation elicited with a monopolar ACSF filled glass microelectrode (1 MΩ). LFPs consisted of fiber volley (FV) and a delayed field excitatory post-synaptic potential (fEPSP). The initial linear slope of fEPSPs was used to measure the post-synaptic response, while FV amplitude was assessed as a measure of the strength of the pre-synaptic activation (Fig. 2).
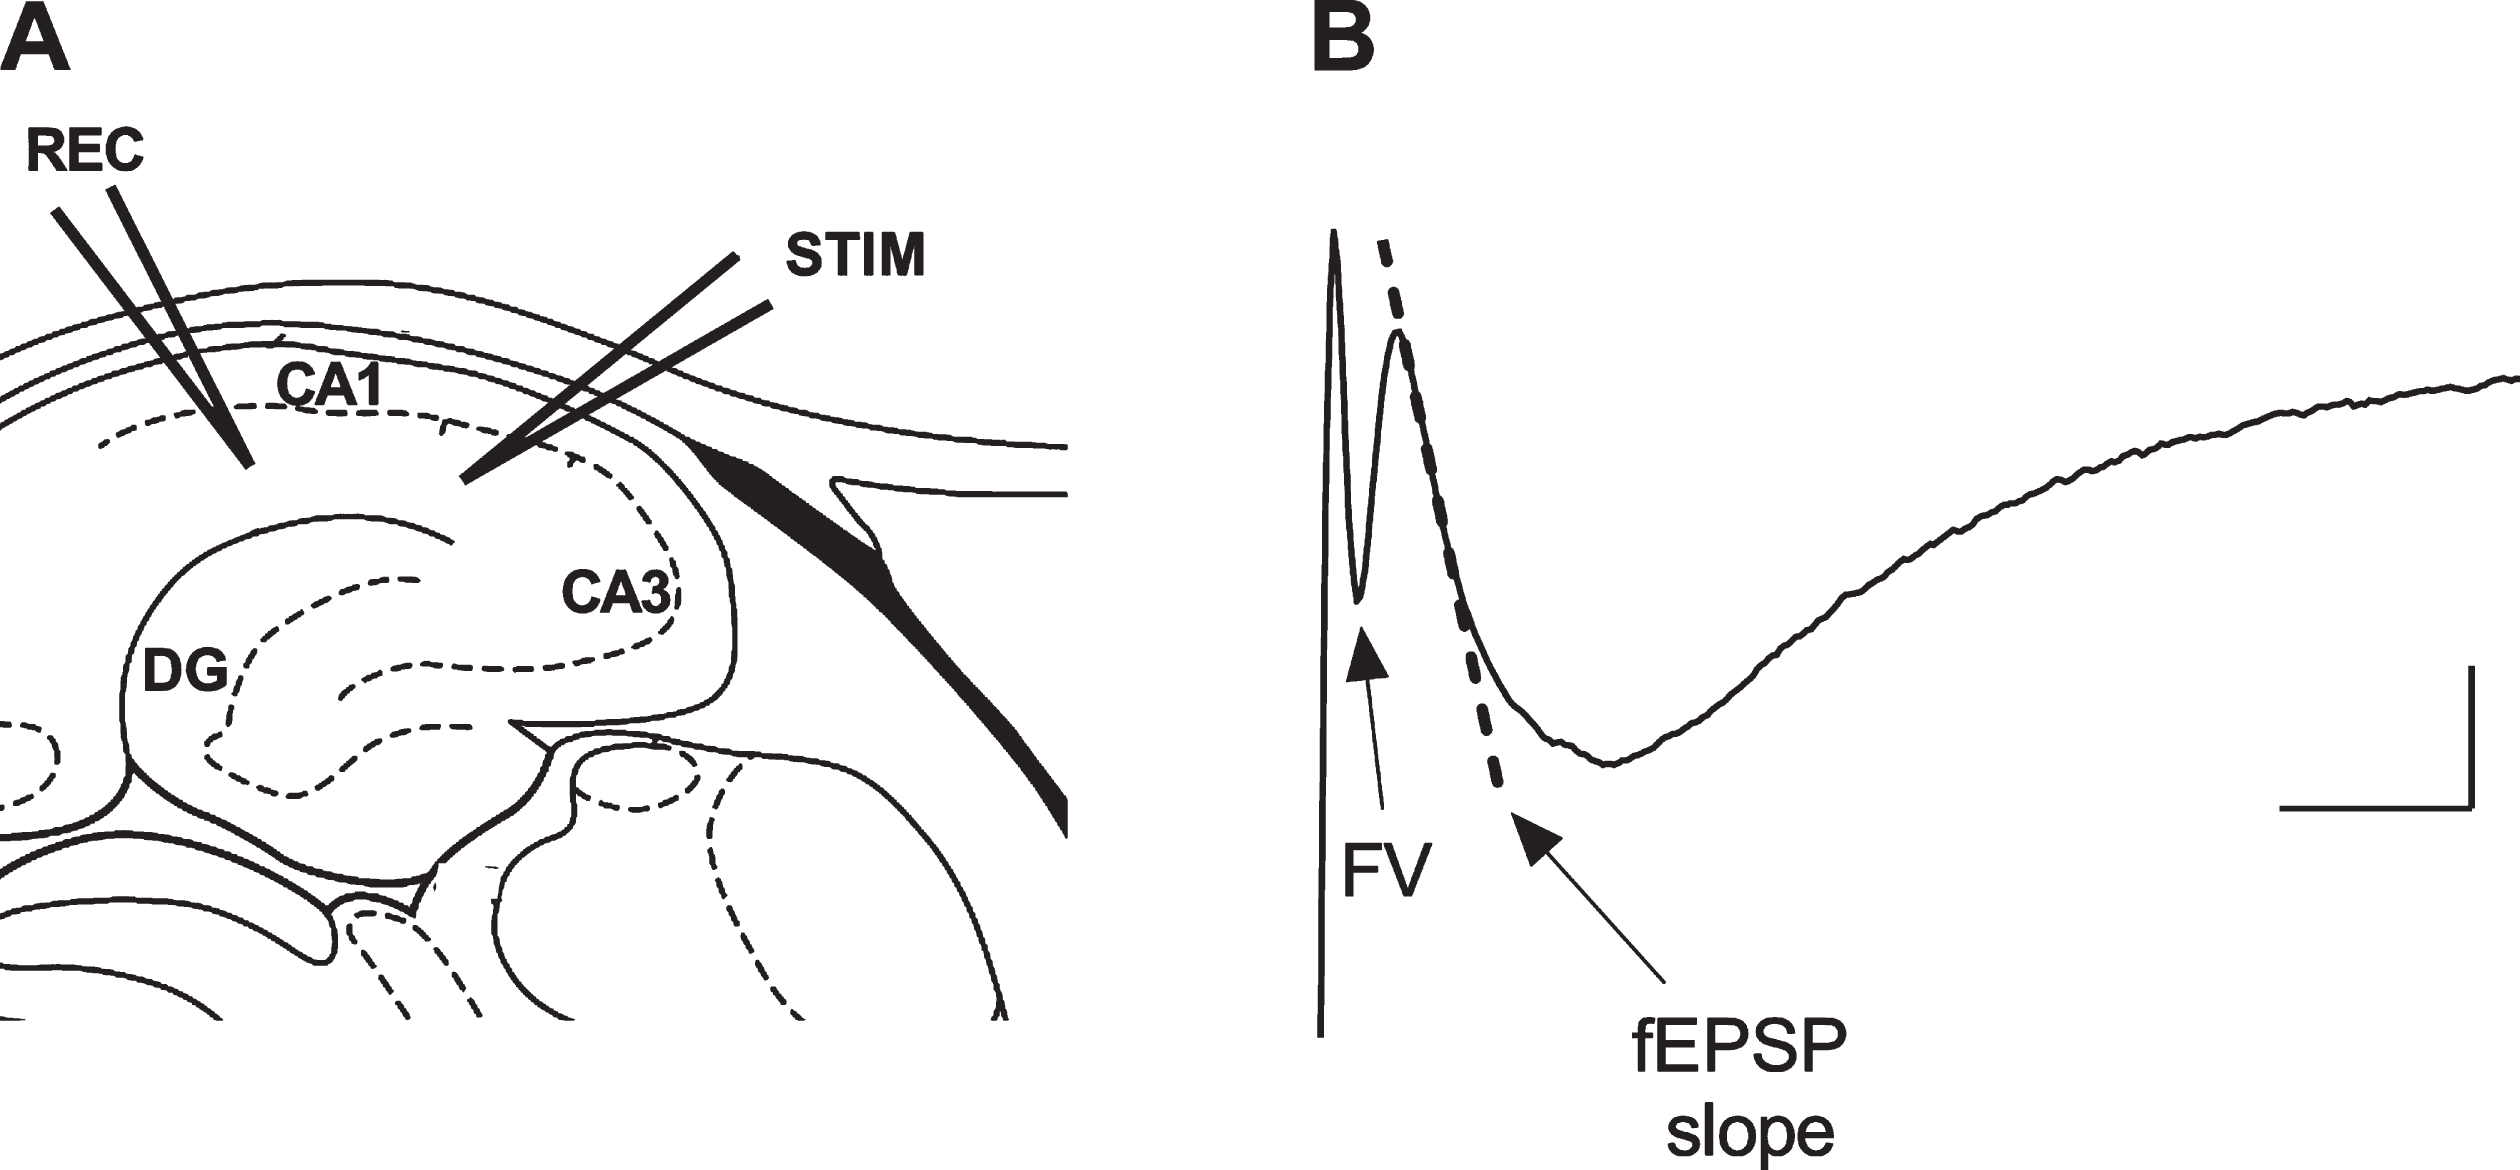
Depiction of the experimental electrophysiological protocol. A) The hippocampal sites of the recording (REC) and stimulating (STIM) electrodes. B) The evoked local field potential signal consisting of fiber volley (FV) and delayed field excitatory post-synaptic potential (fEPSP) components; the dotted line represents the slope of the initial part of the fEPSP used as a measure of synaptic activity in the hippocampal CA1 region. Scale bar: 0.2 mV, 5 ms.
Basal synaptic transmission was evaluated by constructing an input-output relationship in which the fEPSP slope measures were plotted against either stimulus intensity (ranging from 5 to 50 V) or FV amplitude. Three responses of each different pulse intensity were averaged leaving a 15 sec gap between each stimulation. To test short-term plasticity, paired stimulations were elicited with different interpulse intervals (IPI) (20, 25, 40, 50, 100, and 200 ms) to compute the paired-pulse facilitation (PPF) index. PPF was measured as the percentage of the synaptic response of the second against the first delivered stimulus. For each IPI, 8 stimuli were recorded and averaged leaving a 15-s gap between each paired stimulation. To induce long-term potentiation (LTP), theta-burst stimulation (TBS) was delivered to the SC. TBS consisted of 3 trains of 10 bursts (4 pulses at 100 Hz) with an interburst interval of 200 ms, with a 20-s gap between trains. Responses were recorded for 1 h after TBS and measured as change in fEPSP slope expressed as the percentage with respect to the 15-min pre-TBS baseline period. Stimulus intensities used for LTP and PPF experiments were adjusted to produce 40% of maximal fEPSP slope as determined by the input-output functions. Signals were collected via an Axopatch 200A amplifier (Molecular Devices, USA) and digitized with a Digidata 1440 interface. The pCLAMP 9 software (Molecular Devices, USA) was used for data acquisition. The signals were filtered at 1 kHz and digitized at 10 kHz.
Behavior
Sixteen wild-type and sixteen C.B6/J-APP swe mice (50% females and 50% males each) aged 3, 6, 9, 12, and 16–18 months were handled 5 min/day for 5 consecutive days, during which they were habituated to the test room for other 10 min/day. The test room was dimly and diffusely illuminated from the bottom up by light sources located in the room’s corners. EthoVision XT10 software (Noldus, The Netherlands) was used to record performances.
Open field test
Each mouse was placed in the middle of a square arena (60 cm wide, 60 cm long, and 30 cm high) digitally divided into 16 areas (15×15 cm) and allowed to explore it for 5 min. Total distance moved, number of rearings, number of line crossings, and percent time spent in the center of the arena were recorded. To reduce odor cues, the arena was cleaned with 70% ethyl alcohol between each animal.
Novel object recognition test
The task was performed in a square arena (35 cm wide, 35 cm long, and 30 cm high). The objects were chosen following Leger and colleagues [15] and differed in shape (cylinder versus parallelepiped), color (multicolor versus brown), and material (glass versus plastic) to allow the use of vision, whisking, and sense of smell. On the first day, mice were allowed to explore the arena in the absence of the objects for 5 min (habituation); the next day, mice were placed in the arena for 10 min in the presence of two identical objects (training); 24 h later, mice were released in the arena, where a familiar object was replaced with a novel object, for a 10-min session (test). During the test, the location of the objects was such that half of the animals of each group saw the novel object on the left side of the arena and the other half saw it on the right side [16]. Object exploration was defined as directing the nose to the object at a distance <2 cm. Mice that did not explore for at least 40 sec and/or showed a side preference during training were excluded. The exploration activity was calculated based on the following index: (Time spent on the novel object / (Time spent on the familiar object + Time spent on the novel object))×100. An index >55% indicated a preserved memory, whereas an index between 45% and 55% indicated an impaired memory. An index <45% caused the exclusion of the animal due to problems in task resolution (i.e., preference for an object irrespective of its novelty/familiarity). The arena was cleaned with 70% ethyl alcohol between each animal to reduce odor cues.
Elevated plus maze test
The apparatus consisted of two open arms (5 cm wide, 30 cm long, and 2 cm high) and two enclosed arms (5 cm wide, 30 cm long, and 15 cm high) extending from a common central platform (5×5 cm) raised 60 cm above the ground. Each mouse was placed on the central platform facing an open arm and was allowed to explore for 5 min with the experimenter out of view. The percent time spent in the open arms, the number of entries into the open arms and the number of head dipping were recorded. To reduce odor cues, the arena was cleaned with 70% ethyl alcohol between each animal.
Morris water maze test
The apparatus consisted of a circular pool (110 cm wide and 25 cm high) digitally divided into 4 quadrants (North, West, South, East), filled with opaque water (22°C±5°C) and containing a transparent platform (10 cm wide) submerged 1.5 cm below the water level. During the training phase (5 days), mice were released facing the wall from 4 different start sites once in the morning and once in the afternoon, for a total of 8 releases/day. The start sites, whose sequence was changed daily, were chosen semi-randomly to prevent the development of search strategies with specific right or left turns and to balance the shorter and longer paths to the goal [17]. The position of the platform was fixed. Mice were allowed to swim for 60 s or until they reached the platform. Animals that failed to find the platform within 60 s were guided to it. In either case, they were left on the platform for 15 s. Latency (the interval between start time and finding the platform) was measured to evaluate the learning process. On the 6th day (probe phase), 24 h after the last release of the training period, the platform was removed, and mice were released from a new position and allowed to swim for 60 s. Performance was measured as proximity (mean distance from the platform) [18, 19]. As a control procedure to exclude that cognitive performance could be biased by visual deficits, the day after the probe phase, mice were set a cued task where a flag was placed on the platform. The task involved 4 releases, each with a different release point and goal, so that mice were unable to use distal cues to solve the problem. Latency and mean velocity were measured. Animals that did not swim were excluded.
Radial arm water maze test
A circular pool (110 cm wide and 25 cm high) with six arms (25 cm wide and 35 cm long) radiating out (angle, 60°) from an open central area (40 cm in diameter) was used. A 2-day protocol was applied [20]. On the first day, mice were trained to localize the platform, which was alternately visible and hidden in the first 12 trials (6 trials in series 1, 6 trials in series 2), whereas was hidden in the last 3 trials (series 3). The second day consisted of 15 trials (3 series, 5 trials/series) with the platform hidden. The goal arm was constant, whereas the start arm was changed throughout the releases. A different goal arm was used for each mouse to reduce odor cues. Mice were gently placed into the pool near the wall perimeter, facing the center, and allowed to swim for 60 s or until they reached the platform. Mice that failed to find the platform in 60 s were guided to it. In either case, mice were left on the platform for 15 s. Errors, i.e., entries into an incorrect arm and failure to select an arm within 15 s, were counted in each trial; an entry was considered to occur when the mouse was in an alley with all four legs. The average error was calculated per block (3 trials each), keeping the 2 days separate. Animals adopting a chaining strategy, i.e., sequential entrance in adjacent arms for 3 or more times to find the platform, and those that did not swim were excluded.
Statistical analysis
Male and female animals were considered as different cohorts when they showed significant differences (i.e., survival and growth curves and behavior); otherwise, they were grouped (i.e., western blotting, Aβ ELISA, immunocytochemistry, and electrophysiology). Results were expressed as mean±standard deviation, where not differently indicated. The survival curves were analyzed by Log-rank (Mantel-Cox) test while body weights were compared using Student’s t test. Linear regression was used for the analysis of the input-output curve relationship. The other variables were analyzed by one-way ANOVA, one-way ANOVA for repeated measures, two-way ANOVA (genotype and age or genotype and stim strength as interacting factors), or two-way ANOVA for repeated measures (genotype and time as interacting factors). The Tukey’s test or Holm-Sidak test were applied for post hoc comparisons, where not differently specified. Significance was set at p < 0.05. Supplementary Table 1 reports detailed information regarding ANOVA outcomes (i.e., F values and the significant effect of the interacting factors).
RESULTS
Compared to wild-type animals, C.B6/J-APPswe mice were similar in overall appearance (e.g., no skeletal deformity), fur and skin condition, general behavior, such as huddling, contact, sniffing, grooming, digging, climbing, and clinical signs (absence of nose or eye problems, no increased vocalization during handling, no tremors, no neurological/musculoskeletal abnormalities). Moreover, no anomalies concerning skin color, wriggling or the milk spot were observed in neonatal pups.
C.B6/J-APP swe mice are good breeders (no significant phenomenon of aggression towards the offspring) and do not require specific precautions for reproduction, birth, and lactating. The average litter size is 6/7 animals, and the coat color is white.
C.B6/J-APPswe mice live less and are underweight in comparison to wild-type animals
Survival curves of wild-type and C.B6/J-APP swe mice were significantly different (p < 0.0001) and so remained when the survival data were divided by sex (females, p = 0.0002; males, p < 0.0001) (Fig. 3A). Female C.B6/J-APP swe mice showed a significantly constant lower body weight than female wild-type mice, whereas male C.B6/J-APP swe animals progressively reduced the gap despite a significant difference (Fig. 3B).
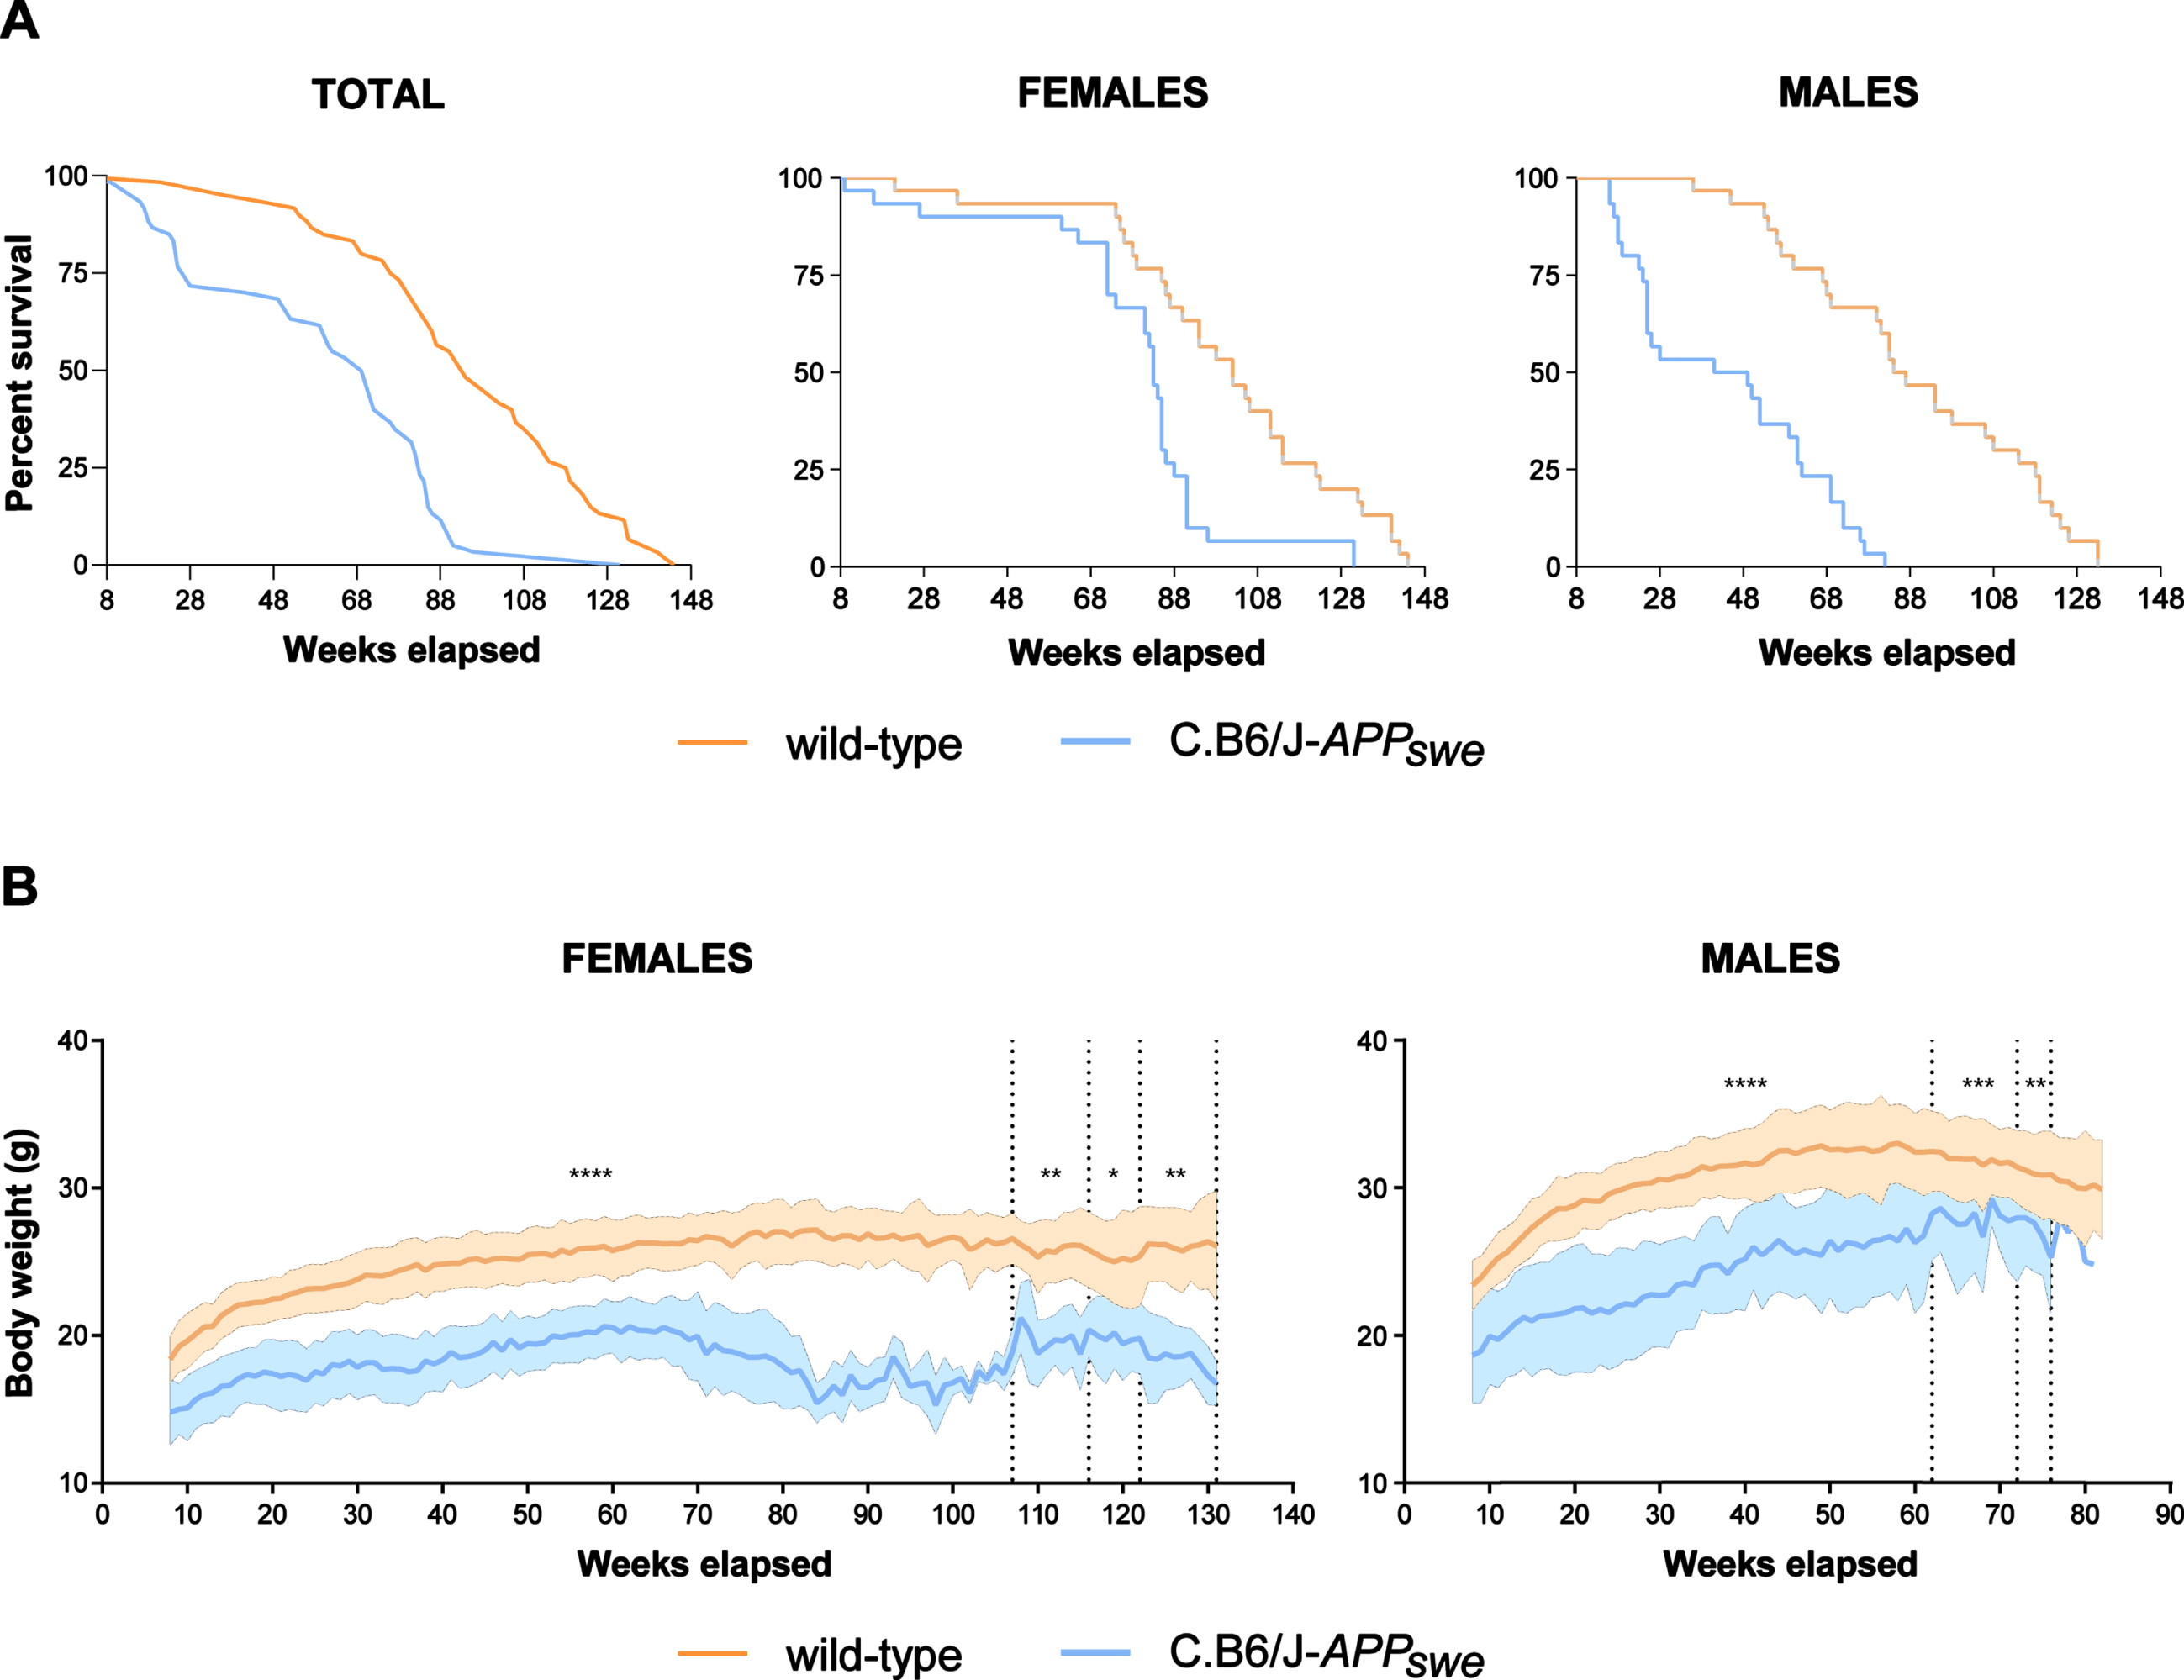
C.B6/J-APP swe mice live less, especially male animals, and have a lower body weight than wild-type mice. A) Congenic mice (30 males and 30 females) had a significantly shorter lifespan than wild-type mice (30 males and 30 females). Survival curve showed sex-related differences: in wild-type and congenic females it was similar until the 60th week, whereas in wild-type and congenic males it diverged from the 24th week. This implies that while no females remained without cage-mates at any experimental time point, a varying proportion of male animals remained alone, i.e., 0% at 3 months, 4% at 6 months, 25% at 9 months, 20% at 12 months and 100% at 16–18 months. B) The congenic mice (30 males and 30 females) had a significantly lower body weight than wild-type mice (30 males and 30 females); in females the difference was stable, whereas in males it tended to decrease over time. Student’s t test: *p < 0.05, **p < 0.01, ***p < 0.001, ****p < 0.0001.
C.B6/J-APPswe mice early synthesize transgenic AβPP and show no impairments in murine AβPP metabolism
To evaluate the synthesis of the different forms of AβPP in C.B6/J-APP swe and wild-type mice, we measured the protein levels detected by 6E10, 22C11, and M3.2 antibodies in the hippocampus and cortex by western blotting (Fig. 4A, B). The densitometric signal of transgenic AβPP (6E10 antibody) was significantly lower in C.B6/J-APP swe animals aged 3 months than in those aged 6, 9, 12, and 16–18 months both in the hippocampus and cortex (Fig. 4C); wild-type mice evidenced no signal (data not shown). As the 22C11 antibody reacts with an epitope present both in transgenic and murine AβPP, the signal was significantly higher in congenic (detection of both transgenic and murine AβPP) than in wild-type (detection only of murine AβPP) mice at all ages both in the hippocampus and cortex; moreover, the signal was significantly lower in congenic mice aged 3 months than in all the older congenic animals (Fig. 4D). Murine AβPP amount (M3.2 antibody) of wild-type and congenic mice of all ages showed no significant differences in the hippocampus or cortex (Fig. 4E).
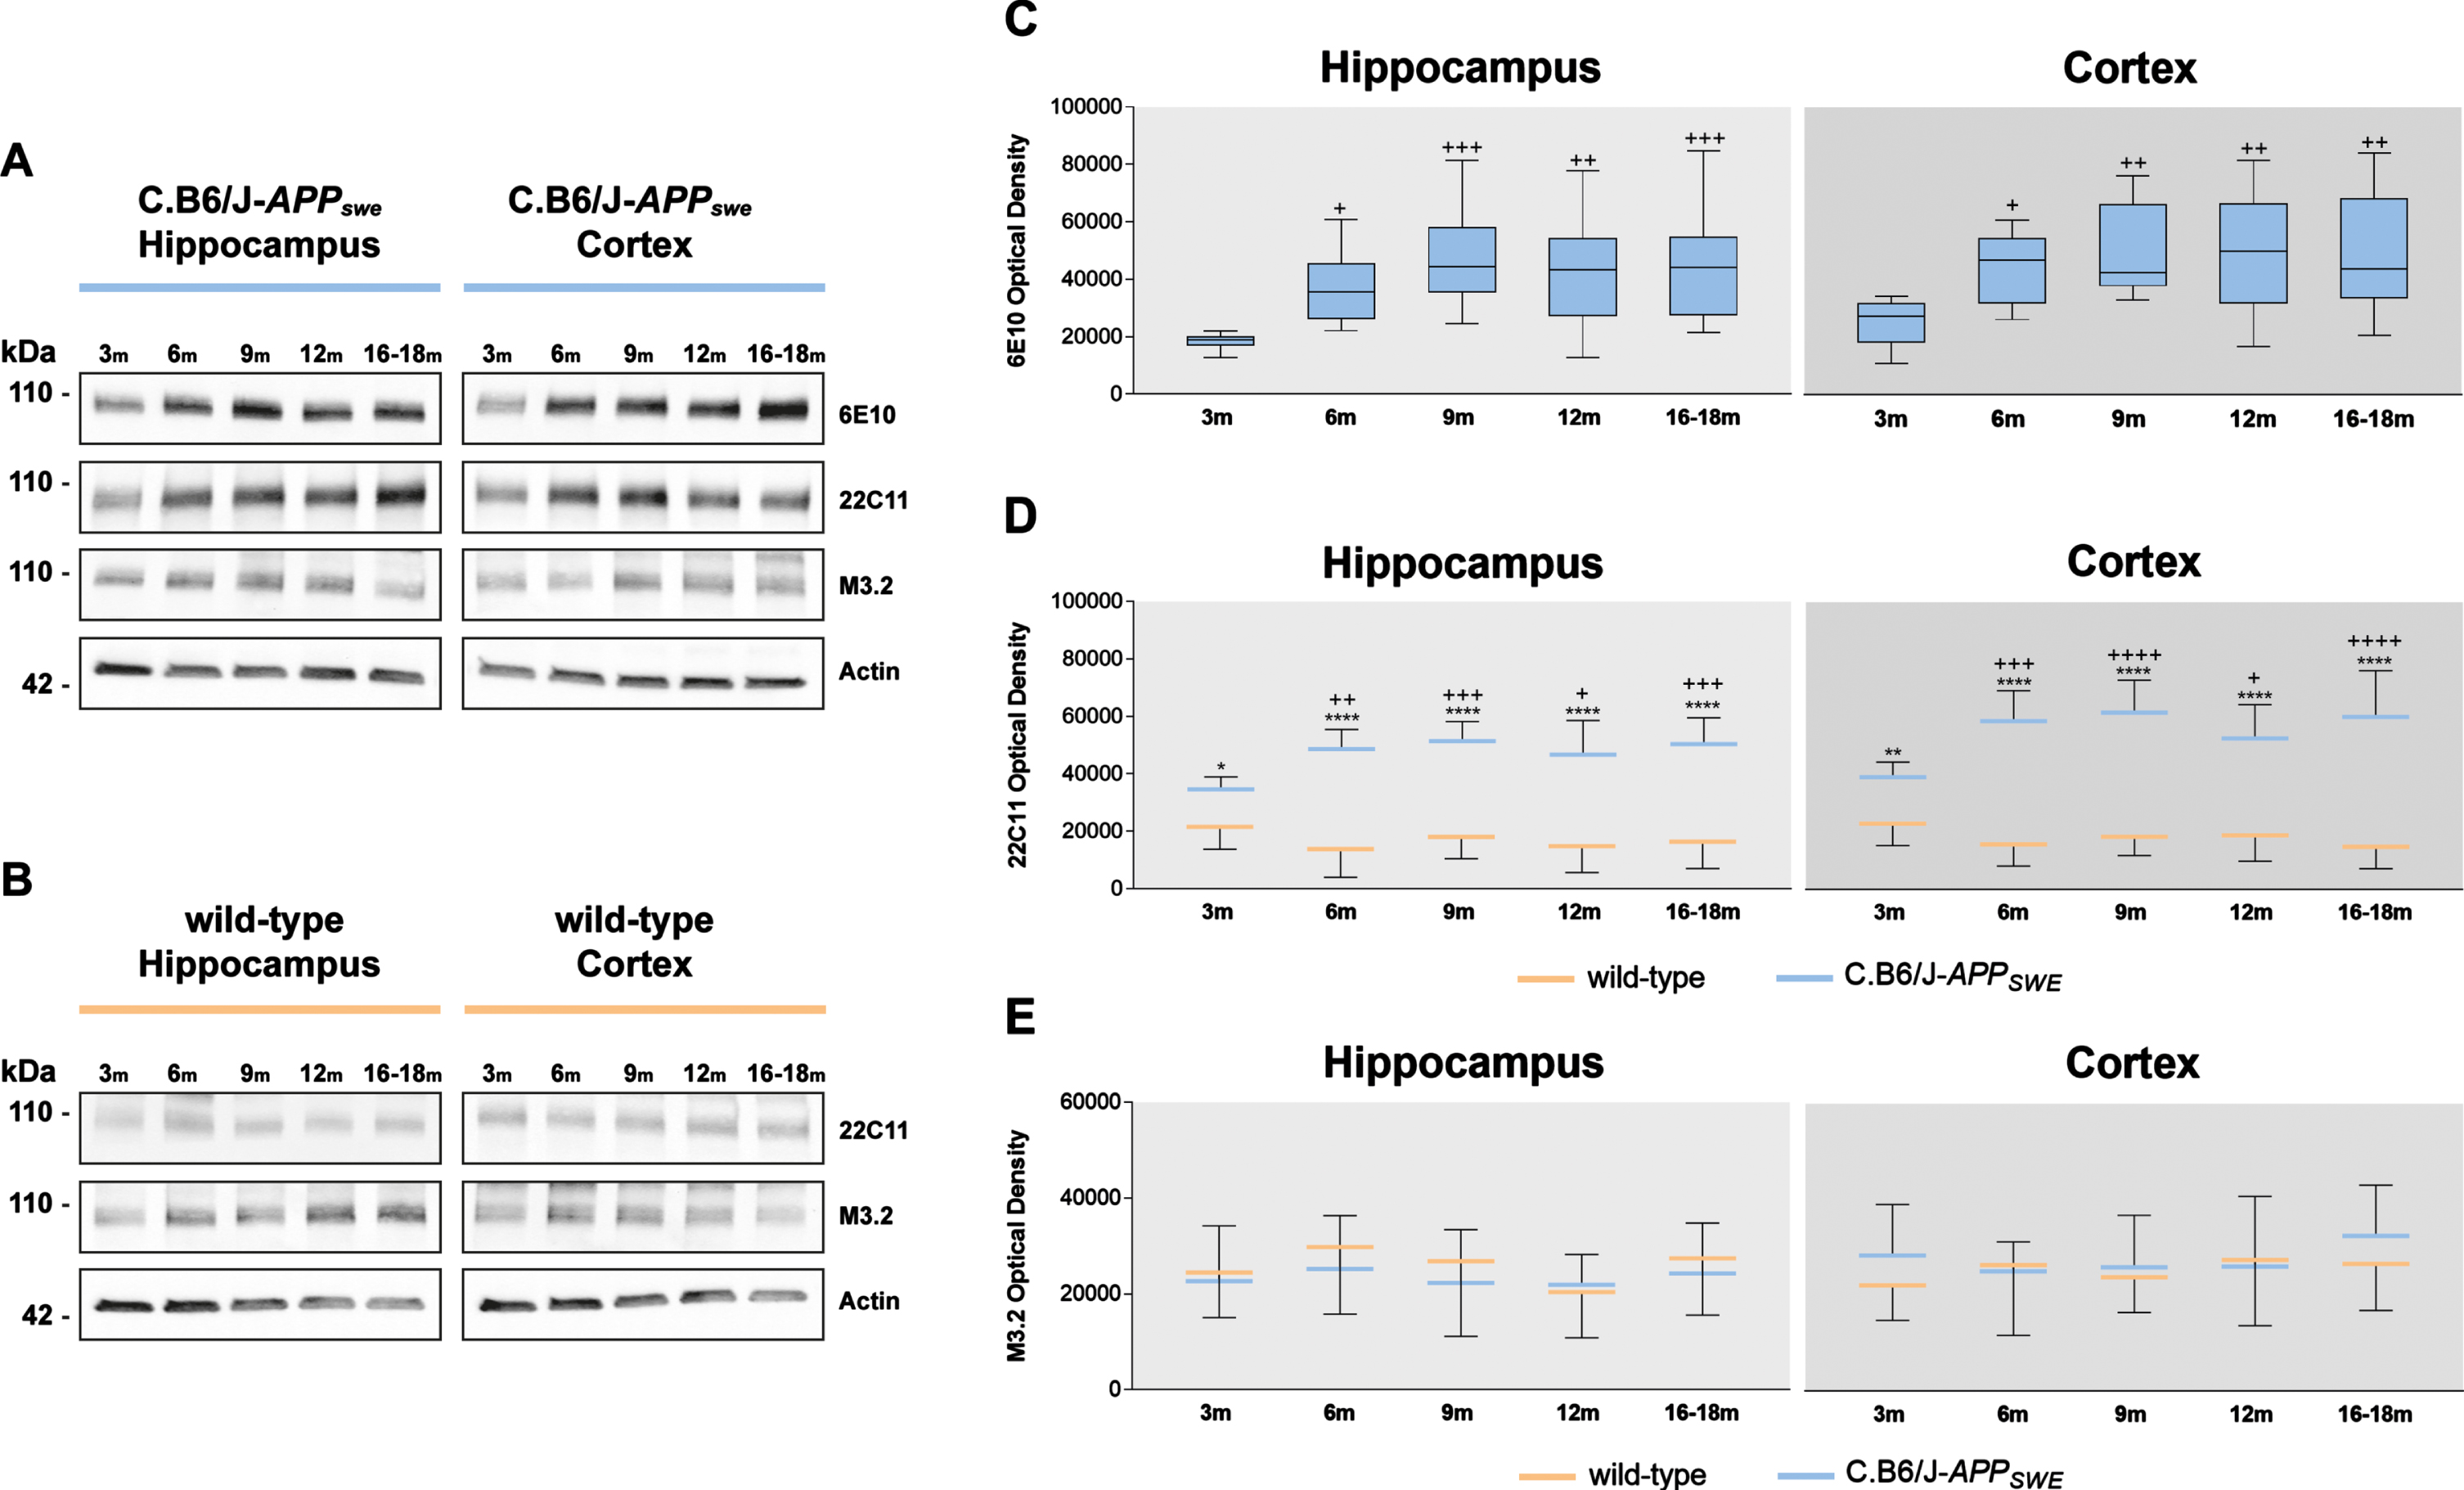
C.B6/J-APP swe mice synthesize transgenic AβPP as early as 3 months and increase its production from 6 months onwards without interfering with the metabolism of the murine protein. A, B) Representative western blotting images showing the specific bands detected by 6E10, 22C11, 3M.2, and anti-Actin antibodies in the hippocampus and cortex of C.B6/J-APP swe and wild-type mice. C) The transgenic protein (6E10 antibody), already detectable at 3 months, significantly increased up to 6 months and then remained stable until 16–18 months in the hippocampus and cortex of congenic animals. D) The signal detected by 22C11 antibody was significantly higher in congenic versus age-matched wild-type animals at all ages due to the presence in the first group of both murine and transgenic AβPP. Moreover, in C.B6/J-APP swe mice, the protein level increased from 3 to 6 months to plateau till 16–18 months, while in controls, it had a steady-state pattern from 3 to 16–18 months. E) The synthesis of the murine AβPP (3M.2 antibody) remained stable from 3 to 16–18 months both in wild-type and congenic animals with no significant differences between the genotypes. Data of male (n = 6) and female (n = 6) animals of each genotype were pooled as no difference was found between sexes. C) One-way ANOVA and Tukey’s test; D) and E) Two-way ANOVA and Tukey’s test. +p < 0.05, ++p < 0.01, +++p < 0.001, ++++p < 0.0001 [C.B6/J-APP swe mice versus C.B6/J-APP swe mice aged 3 months]; *p < 0.05, **p < 0.01, ****p < 0.0001 [C.B6/J-APP swe mice versus age-matched wild-type mice].
In C.B6/J-APPswe mice, transgenic AβPP is pathologically metabolized with the production of both Aβ40 and Aβ42 peptides
Soluble and insoluble Aβ40 and Aβ42 were already synthesized at 3 months of age in both the hippocampus and cortex. Soluble Aβ40 remained stable until 16–18 months, but soluble Aβ42 had a significant reduction at this age compared to younger ages both in the hippocampus and cortex (Fig. 5A). Insoluble Aβ40, after a constant pattern from 3 to 12 months, significantly decreased at 16–18 months, while insoluble Aβ42 significantly increased at 12 and 16–18 months compared to younger ages, showing the same trend in the two areas analyzed (Fig. 5B). These data prove that transgenic AβPP underwent the amyloidogenic pathway, showed a progressive shift from soluble to insoluble Aβ42 peptide production from 12 months onwards, and suggest the deposition of Aβ42, the more aggregation-prone peptide, in the amyloid plaques at late ages with a lower contribution from Aβ40.
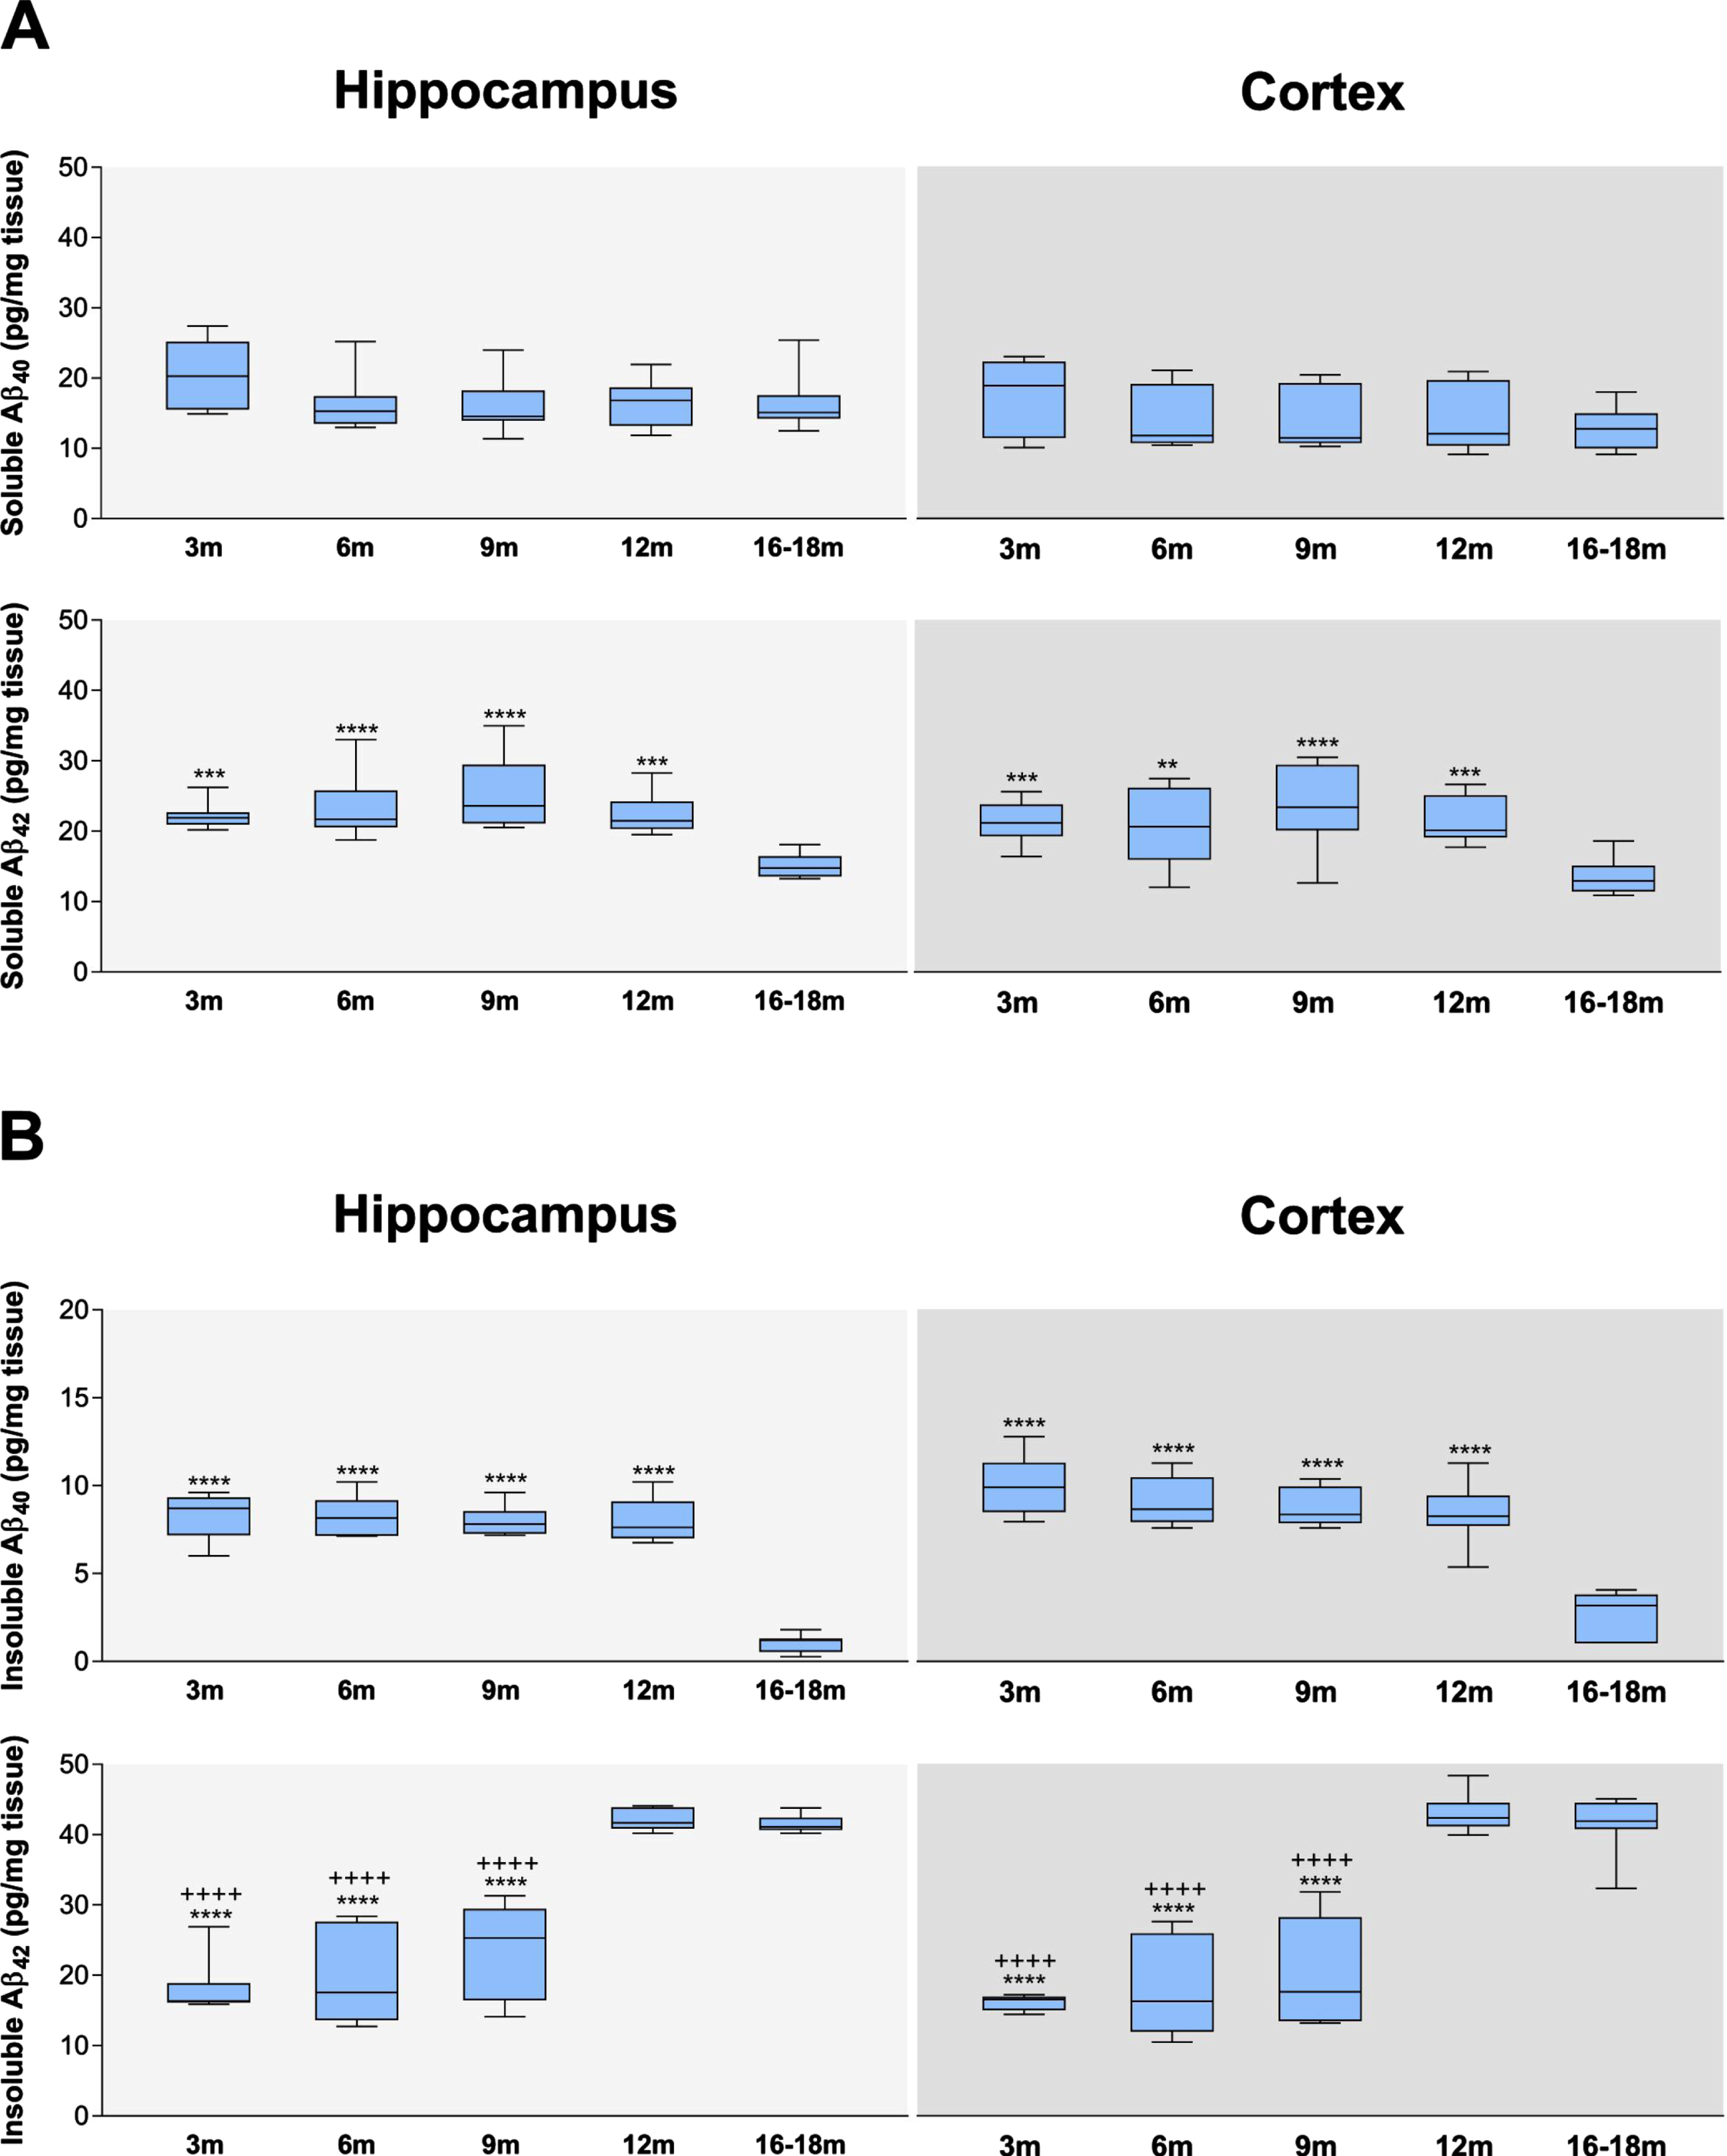
Aβ40 and Aβ42 are already produced at 3 months of age and their hippocampal and cortical concentrations change at later ages in C.B6/J-APP swe mice. A) Hippocampal and cortical levels of soluble Aβ40 were similar at all ages, while those of soluble Aβ42, after a steady-state trend from 3 to 12 months, significantly decreased in comparison to all the other age groups. B) C.B6/J-APP swe mice had a significantly lower level of hippocampal and cortical insoluble Aβ40 at 16–18 months than the other age groups; on the contrary, C.B6/J-APP swe mice had significantly higher levels of hippocampal and cortical insoluble Aβ42 at 12 and 16–18 months in comparison to the other age groups. Data of male (n = 5) and female (n = 5) animals were pooled as no difference was found between sexes. One-way ANOVA and Tukey’s test. **p < 0.01, ***p < 0.001, ****p < 0.0001 [versus 16-18-month-old mice]; ++++p < 0.0001 [versus 12-month-old mice].
C.B6/J-APPswe mice assemble amyloid plaques late and have high levels of Tau phosphorylation
Both 6E10 (reactive to residues 1–16 of transgenic Aβ) and 4G8 antibodies (reactive to residues 17–21 of transgenic Aβ) localize AβPP and Aβ peptides. However, since 4G8 binds the β-sheet structure of amyloid fibrils, it is more suitable than 6E10 antibody to identify amyloid plaques [21]. Immunoreactivity was stronger in CA1 and CA3 pyramidal cells than in DG granular cells of the hippocampus (Fig. 6A). PCtx signal was comparable to that of DG (not shown). In CA1, CA3, DG, and PCtx, C.B6/J-APP swe mice aged 3 months showed a significantly lower 6E10 and 4G8 antibody immunoreactivity (i.e., AβPP and its fragments non-aggregated in amyloid plaques) than those aged 6, 9, 12 and 16–18 months (Fig. 6D). Wild-type mice displayed signal comparable to the experimental controls (data not shown). At 12 months, few plaques were found in the hippocampus and PCtx with a significant increase in number and area at 16–18 months (Fig. 6A, B).
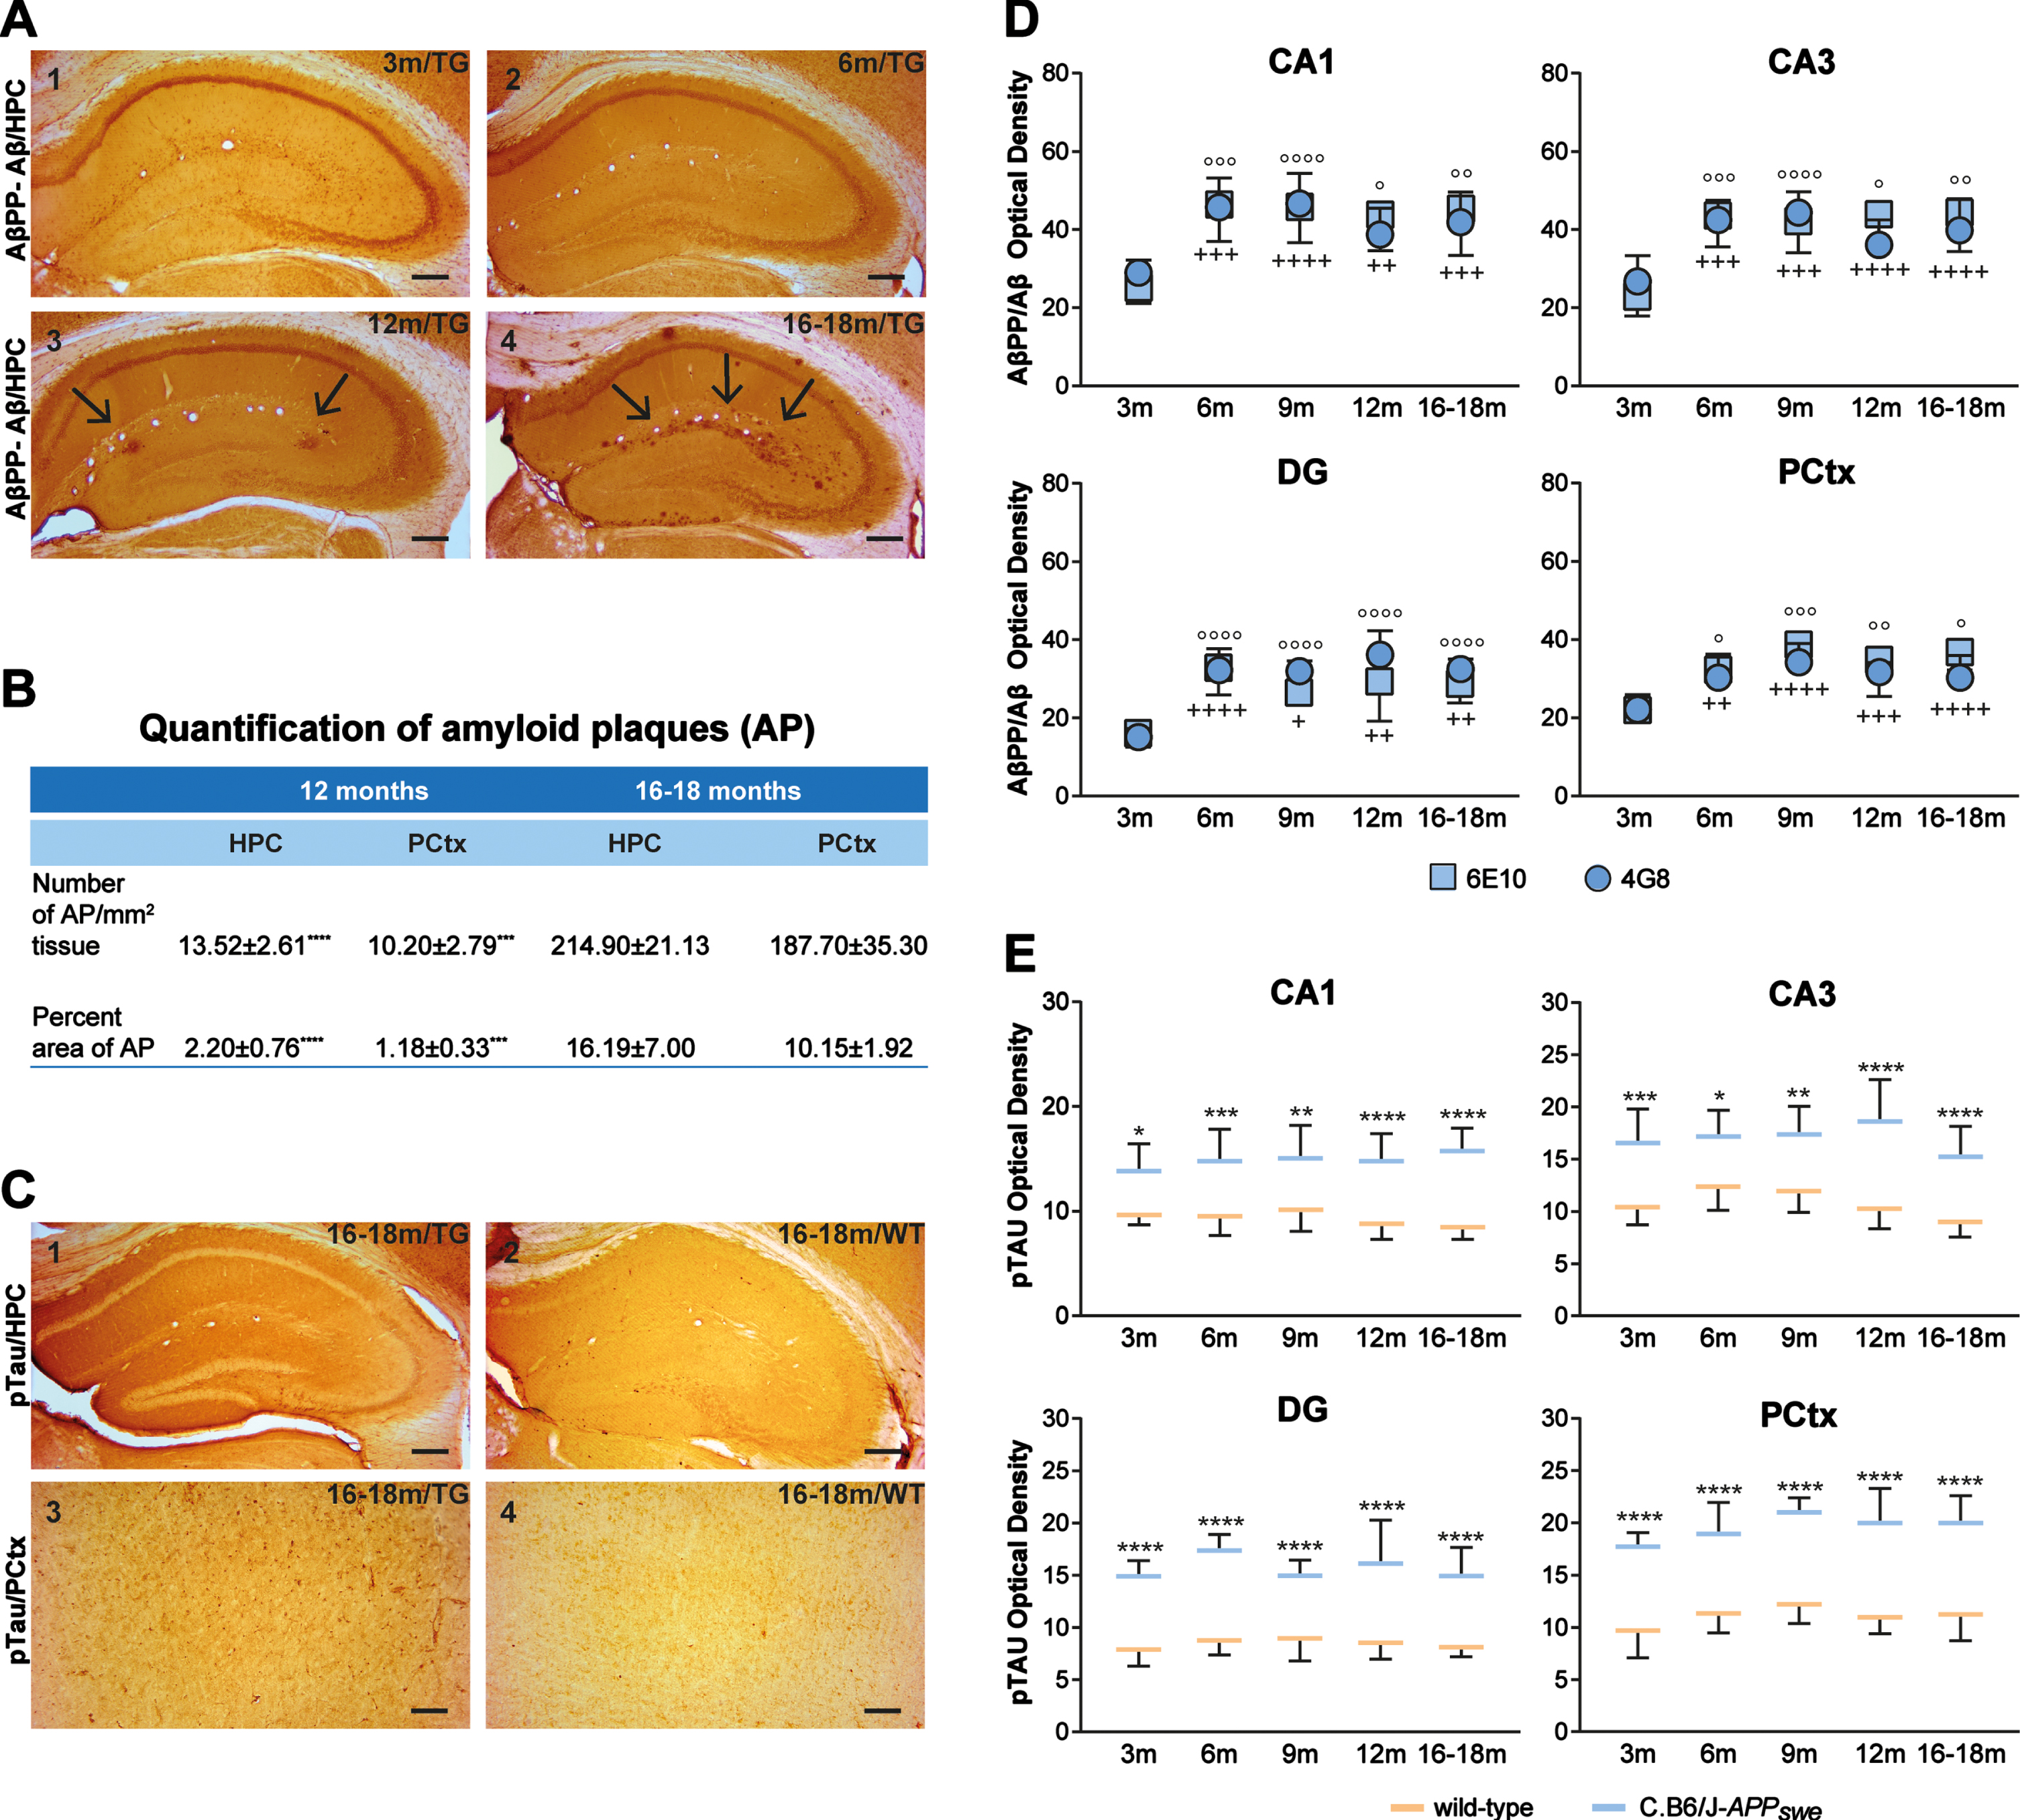
C.B6/J-APP swe mice show transgenic AβPP and Aβ immunostaining starting at 3 months, develop amyloid plaques at 12 months with an increased presence at 16–18 months, and have high levels of Tau phosphorylation at all ages. A) Representative photographs of tissues processed with 4G8 antibody show i) evident presence of signal inside cells in the hippocampus of a 3-month-old (1) and a 6-month-old C.B6/J-APP swe (2) mice, ii) first extracellular amyloid plaques (arrows) in hippocampal regions of a 12-month-old congenic mouse (3) and iii) several amyloid plaques (arrows) in the hippocampus of a 16-18-month-old C.B6/J-APP swe mouse (4). B) Quantification of amyloid plaques (AP) in the hippocampus and PCtx of C.B6/J-APP swe mice of 12 and 16–18 months of age. As differences between male (n = 4) and female (n = 4) animals in each age group were not significant, data were pooled. Student’s t test. ***p < 0.001, ****p < 0.0001 [animals of 12 months of age in comparison to animals of 16–18 months of age]. C) Photographs of tissues processed with anti-pTau antibody show that C.B6/J-APP swe mice of 16–18 months have a significantly higher immunostaining in comparison to age-matched wild-type animals both in the hippocampus (1 versus 2) and PCtx (3 versus 4). D) Optical density of 6E10 and 4G8 signals. In all the brain areas analyzed, AβPP and its fragments (non-aggregated in amyloid plaques) were clearly detected at 3 months, significantly rose until 6 months, and remained stable until 16–18 months. Data of male (n = 4) and female (n = 4) animals were pooled as no difference was found between sexes. E) pTau antibody immunoreactivity quantification. In all the brain areas analyzed, pTau concentration was significantly higher in congenic than in wild-type mice at all ages. Data of male (n = 4) and female (n = 4) animals were pooled as no difference was found between sexes. D) One-way ANOVA and Tukey’s test; E) Two-way ANOVA and Tukey’s test. +p < 0.05, ++p < 0.01, +++p < 0.001, ++++p < 0.0001 [versus 3-month-old mice, 6E10 antibody]; °p < 0.05, °°p < 0.01, °°°p < 0.001, °°°°p < 0.0001 [versus 3-month-old mice, 4G8 antibody]; *p < 0.05, **p < 0.01, ***p < 0.001, ****p < 0.0001 [C.B6/J-APP swe versus age-matched wild-type mice]. HPC, hippocampus; TG, C.B6/J-APP swe mice; WT, wild-type mice; A1-A4 and C1-C2, bars = 250μm; C3-C4, bars = 150μm.
Anti-pTau antibody evidenced the neuropil layers, while cell bodies were not stained in both the hippocampus and PCtx (Fig. 6C). Congenic mice of all ages had significantly higher pTau levels than age-matched wild-type in all brain areas (Fig. 6E).
C.B6/J-APPswe mice have a significantly lower synaptic density than wild-type animals and develop late neurodegeneration due to apoptosis and necroptosis/necrosis
SYP, a protein of the membrane of synaptic vesicles, is present in a punctate pattern in synaptic regions of the brain (Fig. 7A). In CA1, CA3, and PCtx, synaptic density was significantly higher in wild-type mice of all ages than in age-matched C.B6/J-APP swe animals, whereas in DG, not significant difference was found regardless genotype or age (Fig. 7C). The NeuN antibody identifies a neuron-specific nuclear protein (Fig. 7B). In CA1, the neuron count was significantly lower in congenic animals aged 16–18 months compared to age-matched controls and congenic animals aged 3, 6, 9, and 12 months. In CA3 and DG, the differences between genotypes and among age groups were not significant. In PCtx, the neuron count was significantly lower in C.B6/J-APP swe mice aged 12 and 16–18 months than age-matched controls and congenic mice aged 3, 6 and 9 months (Fig. 7D). To further elucidate the potential cause of lower neuron number, levels of apoptosis and necroptosis/necrosis were measured in CA1 and PCtx starting from 9 months of age. In CA1, cleaved-CASP3 immunoreactivity was significantly higher in 12- and 16-18-month-old C.B6/J-APP swe mice compared to age-matched controls and 9-month-old congenic animals. In PCtx, cleaved-CASP3 immunoreactivity was significantly higher in congenic versus wild-type mice at all ages and in congenic mice of 16–18 months of age versus younger C.B6/J-APP swe animals (Fig. 7E). RIP3 immunoreactivity was significantly higher in C.B6/J-APPswe than in wild-type mice at all ages in all areas (Fig. 7E).
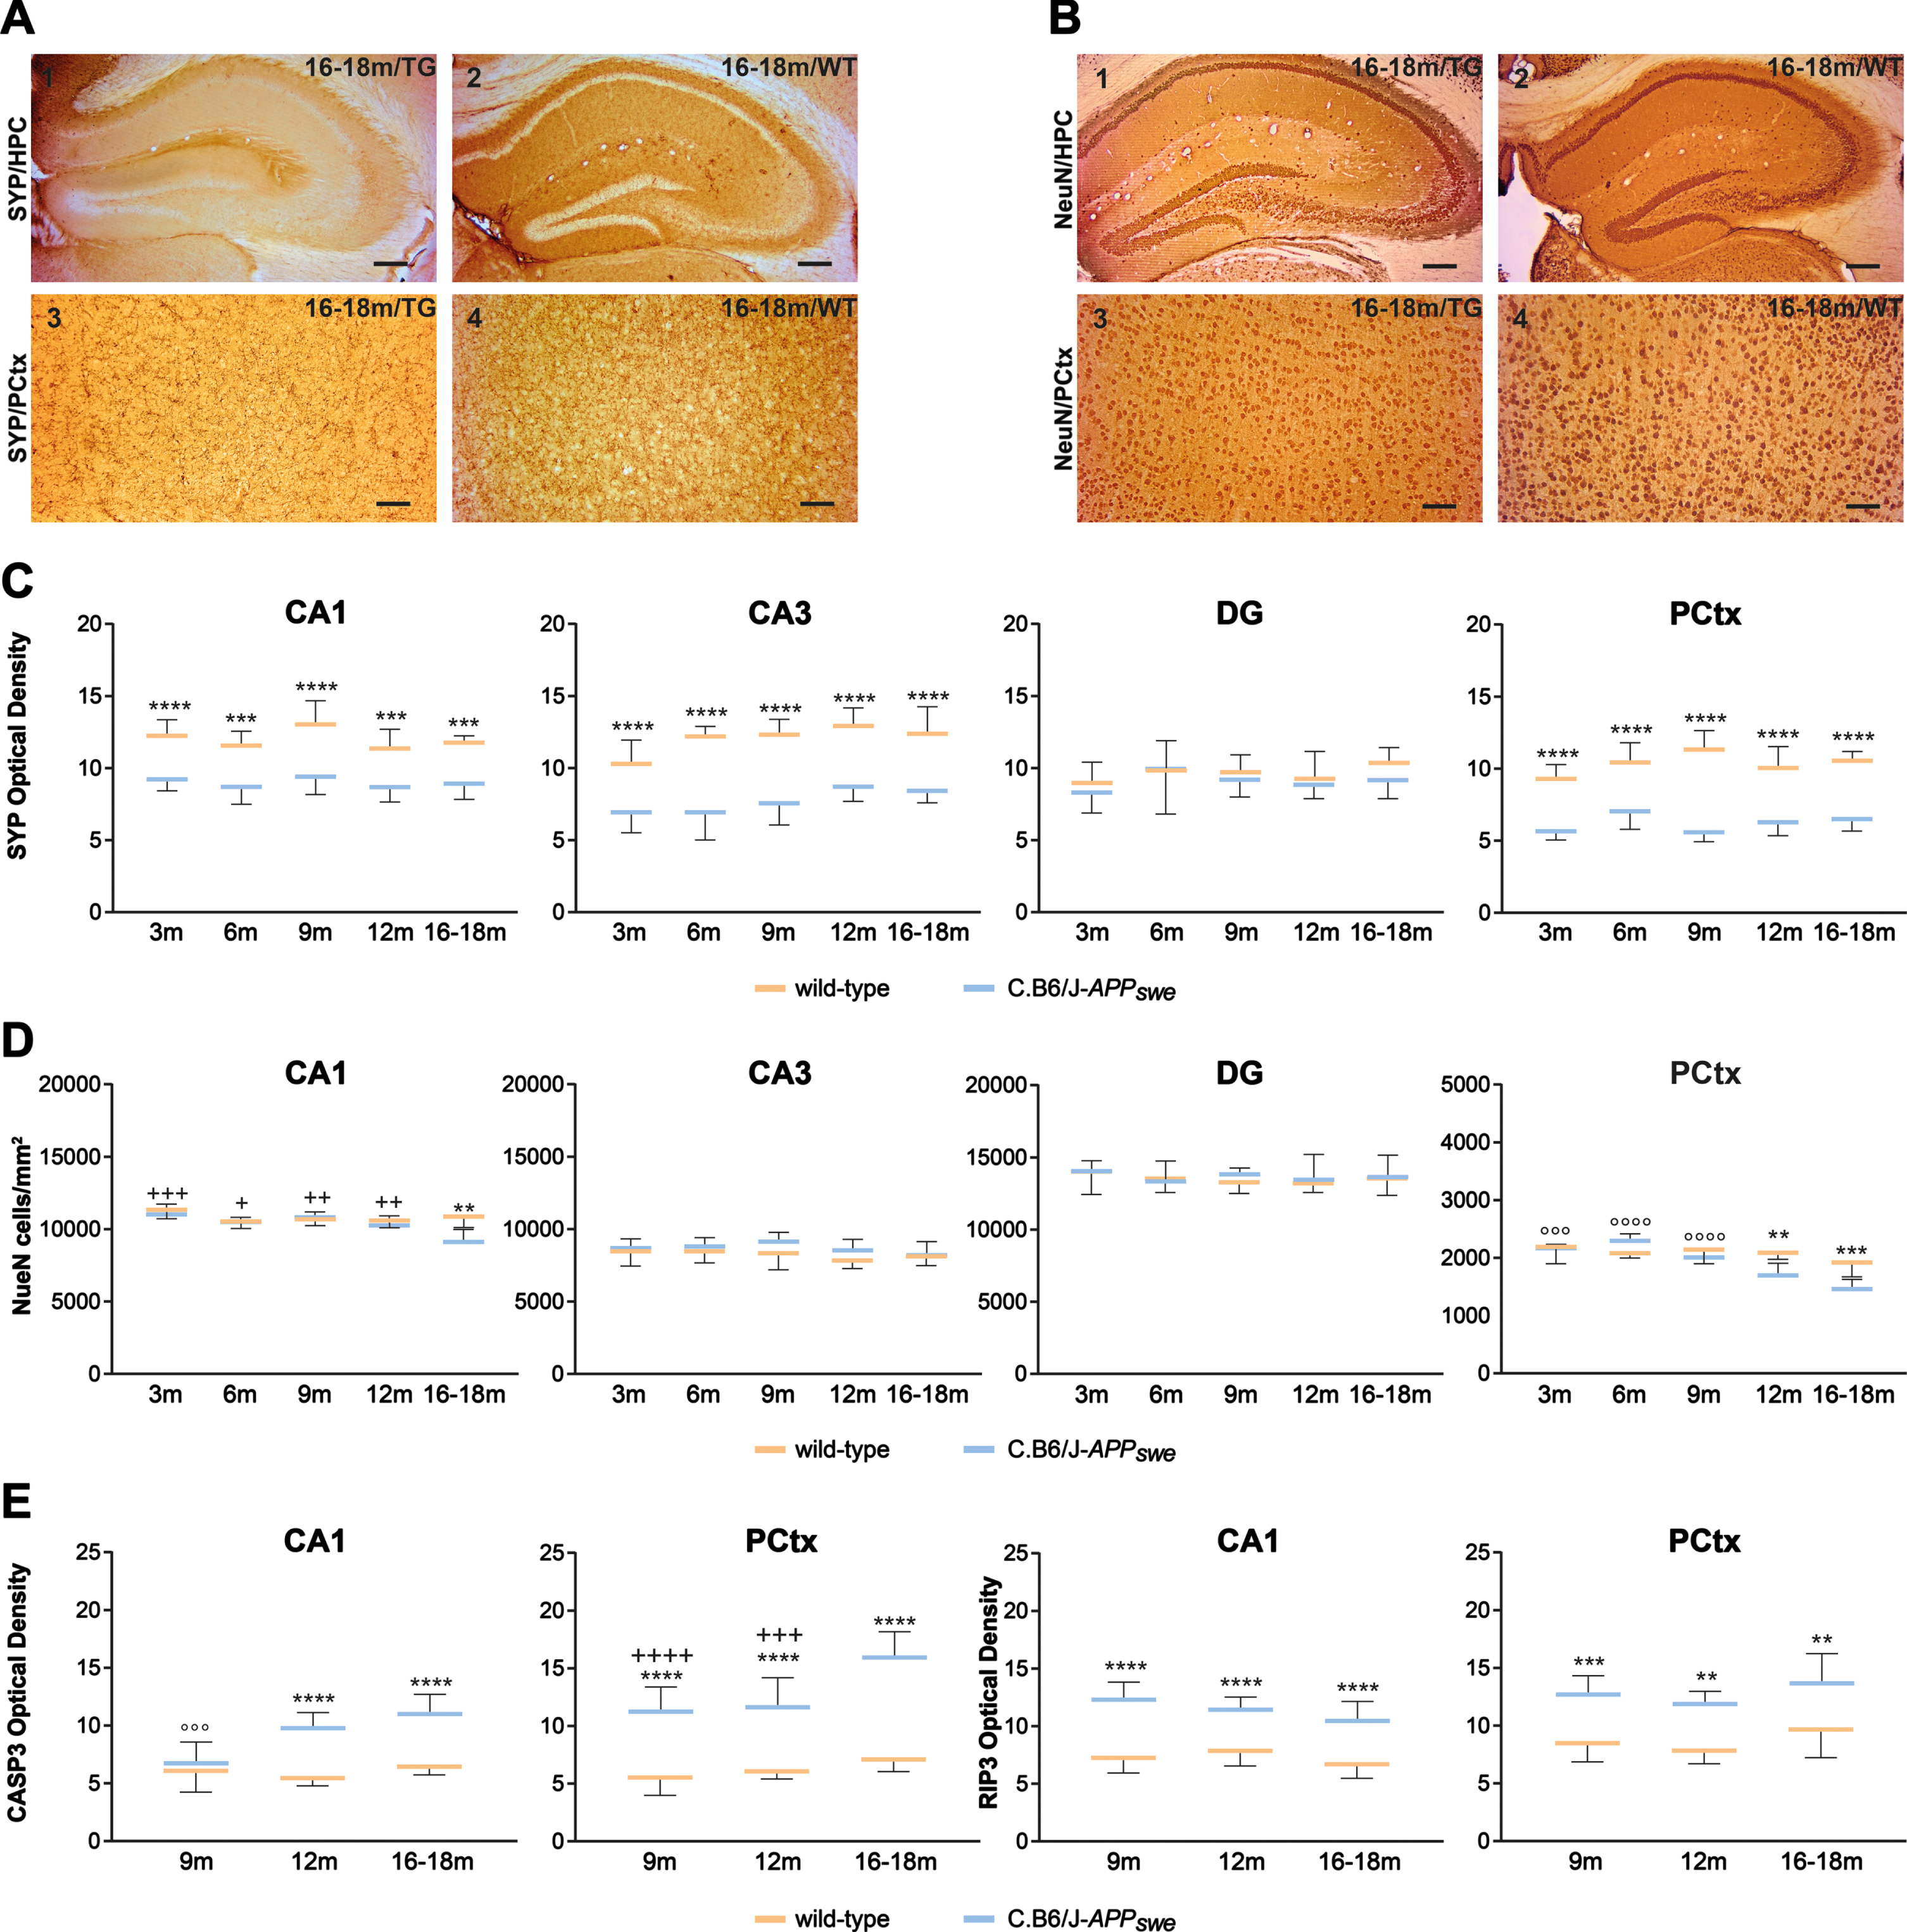
In C.B6/J-APP swe mice synaptic density is lower as compared to controls, and neuron number decreases at later ages because of apoptosis and necroptosis/necrosis mechanisms. A) Photographs of tissues processed with anti-synaptophysin (SYP) antibody show how the immunoreactivity of 16-18-month-old congenic mice is significantly less marked in comparison to age-matched controls both in the hippocampus (1 versus 2) and PCtx (3 versus 4). B) Photographs of tissues processed with anti-NeuN antibody evidence a patchy reduction of cell density in 16-18-month-old congenic mice compared to age-matched wild-type animals in hippocampal CA1 (1 versus 2) and PCtx (3 versus 4). C) A significantly lower synaptic density was detected in congenic versus age-matched wild-type animals at all ages in CA1, CA3 and PCtx. D) CA1 nervous cell number was significantly lower in 16-18-month-old congenic animals than age-matched controls and younger congenic mice; PCtx neuron number was significantly reduced in congenic animals aged 12 and 16–18 months compared to age-matched controls and younger congenic mice. E) Apoptosis (CASP3) was significantly higher in congenic versus wild-type animals starting from 12 months in CA1 and from 9 months in PCtx, which showed a further significant increase at 16–18 months. Necroptosis/necrosis (RIP3) was significantly higher in congenic versus wild-type mice starting from 9 months in both cerebral areas. Male (n = 4) and female (n = 4) data of each genotype were pooled as no difference between sexes was found. Two-way ANOVA and Tukey’s test. **p < 0.01, ***p < 0.001, ****p < 0.0001 [C.B6/J-APP swe mice versus age-matched wild-type mice]; +p < 0.05, ++p < 0.01, +++p < 0.001, ++++p < 0.0001 [C.B6/J-APP swe mice versus C.B6/J-APP swe mice aged 16–18 months]; °°°p < 0.001, °°°°p < 0.0001 [C.B6/J-APP swe mice versus C.B6/J-APP swe mice aged 12 and 16–18 months]. A1-A2 and B1-B2, bars = 250μm; A3-A4 and B3-B4, bars = 150μm.
C.B6/J-APPswe mice develop astrocyte abnormalities and microgliosis
GFAP staining allows the visualization of reactive astrocytes with their characteristic star-shaped morphology (Fig. 8A). In CA1, the density of GFAP positive astrocytes was significantly lower in C.B6/J-APP swe animals aged 12 and 16–18 months compared to age-matched wild-type animals and in C.B6/J-APP swe animals aged 16–18 months compared to younger congenic mice. In DG and PCtx, the density was significantly higher in congenic mice than in age-matched controls at all ages, whereas in CA3 differences were not significant. Furthermore, in PCtx, the density was significantly lower in 3-month-old congenic animals than in congenic animals aged 6, 9, and 12 months; the same was true for those aged 16–18 months with respect to all younger animals of the same genotype (Fig. 8C). Anti-Iba1 antibody is used to stain microglia and Iba1 levels increase with microglia activation (Fig. 8B). In CA1 and CA3, microglia was significantly more abundant in C.B6/J-APP swe animals aged 9, 12, and 16–18 months compared to age-matched controls and congenic mice aged 3 and 6 months; in DG, microglia density was significantly lower in congenic mice of 3, 12, and 16–18 months of age than in those aged 6 and 9 months; in PCtx differences between genotypes and among age groups were not significant (Fig. 8D).
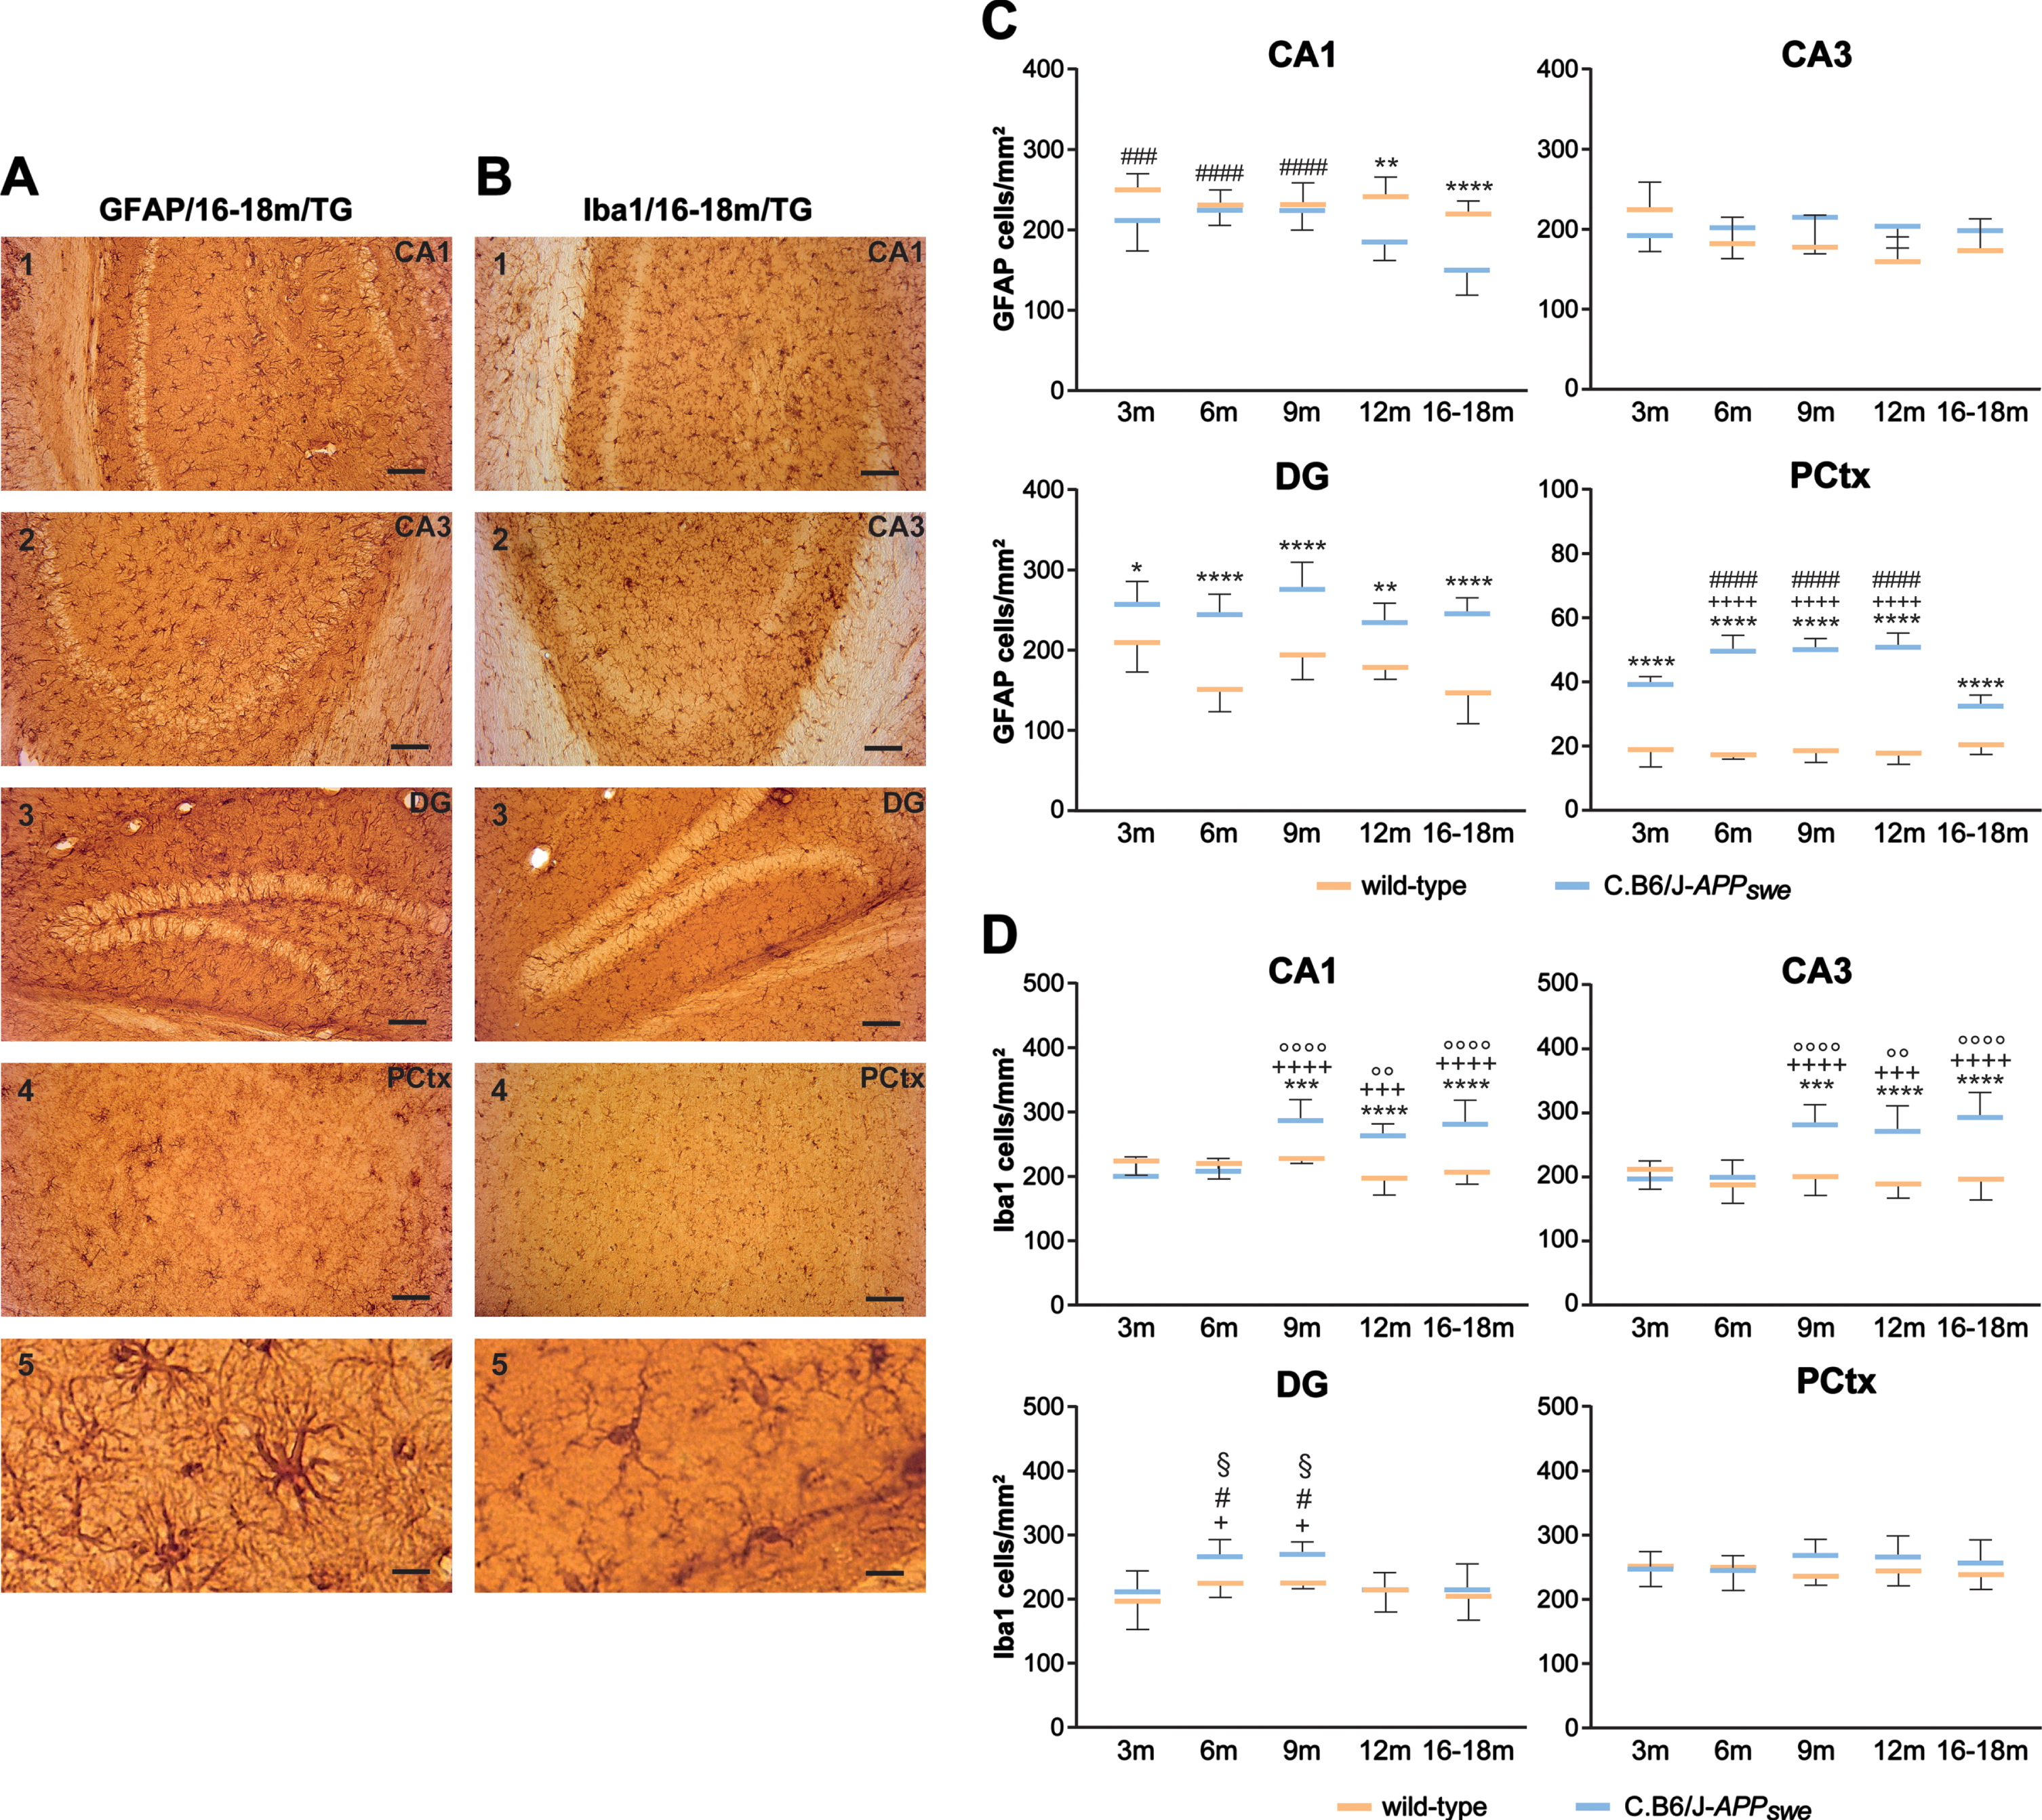
C.B6/J-APP swe mice show astrocyte abnormalities and microgliosis compared to wild-type mice in a region-specific mode. A) Photographs of tissues processed with anti-GFAP antibody of CA1, CA3, DG, and PCtx of congenic mice aged 16–18 months. CA1 (1) and PCtx (4) have a lower density of astrocytes, while DG (3) displays a higher presence in comparison to CA3 (2). The highly magnified image (5) shows the detailed astrocyte morphology. B) Photographs of tissues processed with anti-Iba1 antibody of CA1, CA3, DG and PCtx of congenic mice aged 16–18 months show how CA1 and CA3 (1-2) have a marked higher concentration of microglia than DG and PCtx (3-4). The last image (5) shows three microglial cells at high magnification. C) In CA1, astrocytes were significantly less numerous in congenic animals aged 12 and 16–18 months than age-matched controls and in congenic animals aged 16–18 months compared to congenic mice aged 3, 6 and 9 months. In DG and PCtx, astrocyte density was significantly higher in congenic animals than in age-matched controls at all ages, although in PCtx of C.B6/J-APP swe mice aged 3 and 16–18 months, it was significantly lower than in the other age groups of the same genotype. D) In CA1 and CA3, congenic animals aged 9, 12 and 16–18 months showed significantly higher microglia density than age-matched controls and younger congenic animals. In DG, microglia density was significantly higher in congenic mice aged 6 and 9 months than in those aged 3, 12 and 16–18 months. Male (n = 4) and female (n = 4) animals of each genotype were grouped because no difference between sexes was found. Two-way ANOVA and Tukey’s test. *p < 0.05, **p < 0.01, ***p < 0.001, ****p < 0.0001 [C.B6/J-APP swe versus age-matched wild-type mice]; +p < 0.05, +++p < 0.001, ++++p < 0.0001 [C.B6/J-APP swe mice versus C.B6/J-APP swe mice aged 3 months]; °°p < 0.01, °°°°p < 0.0001 [C.B6/J-APP swe mice versus C.B6/J-APP swe mice aged 6 months]; # # #p < 0.001, # # # #p < 0.0001 [C.B6/J-APP swe mice versus C.B6/J-APP swe mice aged 16–18 months]; §p < 0.05 [C.B6/J-APP swe mice versus C.B6/J-APP swe mice aged 12 months]. A1-A4 and B1-B4, bars = 80μm; A5 and B5, bars = 5μm.
C.B6/J-APPswe mice do not form neurofibrillary tangles
Thionine staining evidenced that the overall morphology was preserved in congenic mice at all ages, except for a patchy reduction of cell density in CA1 and PCtx at 16–18 months of age (not shown). No neurofibrillary tangles were found.
C.B6/J-APPswe mice display aberrant basal excitatory synaptic transmission in the Schaffer collateral-CA1 pathway
We evaluated the strength of the SC-CA1 synapses in hippocampal slices of 9-10-month-old C.B6/J-APP swe mice compared to age-matched wild-type animals by recording LFPs in response to SC stimulations at different current intensities (Fig. 9A). To assess the efficacy of basal synaptic transmission, we plotted the fEPSP slope versus FV amplitudes to compute an input-output relationship (Fig. 9B). The slope of C.B6/J-APP swe mice (0.33±0.01) was significantly lower (F1,326 = 8.90 and p = 0.003) than the slope of the wild-type mice (0.48±0.04), thus providing evidence of an impaired basal excitatory synaptic transmission in C.B6/J-APP swe animals. Interestingly, when LFPs responses were plotted against each stimulus strength, fEPSP slopes, but not FV amplitudes, were significantly reduced in C.B6/J-APP swe mice. Indeed, the relationships between fEPSP slope and stimulation strength (Fig. 9C) revealed a significant reduction of fEPSP slopes in C.B6/J-APP swe mice compared to wild-type controls, while the input-output relationship based on the FV amplitude versus stimulus intensity did not show a significant difference between genotypes (Fig. 9D). These data provide evidence that the aberrant synaptic transmission at the SC-CA1 synapses of C.B6/J-APP swe mice is not attributable to changes in the number of pre-synaptic axons recruited and their excitability, but likely occurs because of altered synaptic integrity. The reduced synaptic transmission could be due to a reduced post-synaptic responsiveness or to a decreased probability of neurotransmitter release. We ruled out the latter possibility because PPF, which is well known to inversely correlate with the pre-synaptic activity, was not statistically different between wild-type and C.B6/J-APP swe mice (Fig. 9E, F). This finding strongly indicates that the reduced synaptic transmission evident in C.B6/J-APP swe animals occurs because of a decrease in the number of functional synapses rather than an impairment in the capability of neurotransmitter release. We next tested whether these functional synapses may still undergo synaptic plasticity. Therefore, we measured LTP at the SC-CA1 synapses (Fig. 9G) and found no impairment since, 60 min after TBS, responses were 154±9% and 146±6% of baseline for wild-type and C.B6/J-APP swe mice, respectively (Fig. 9H).
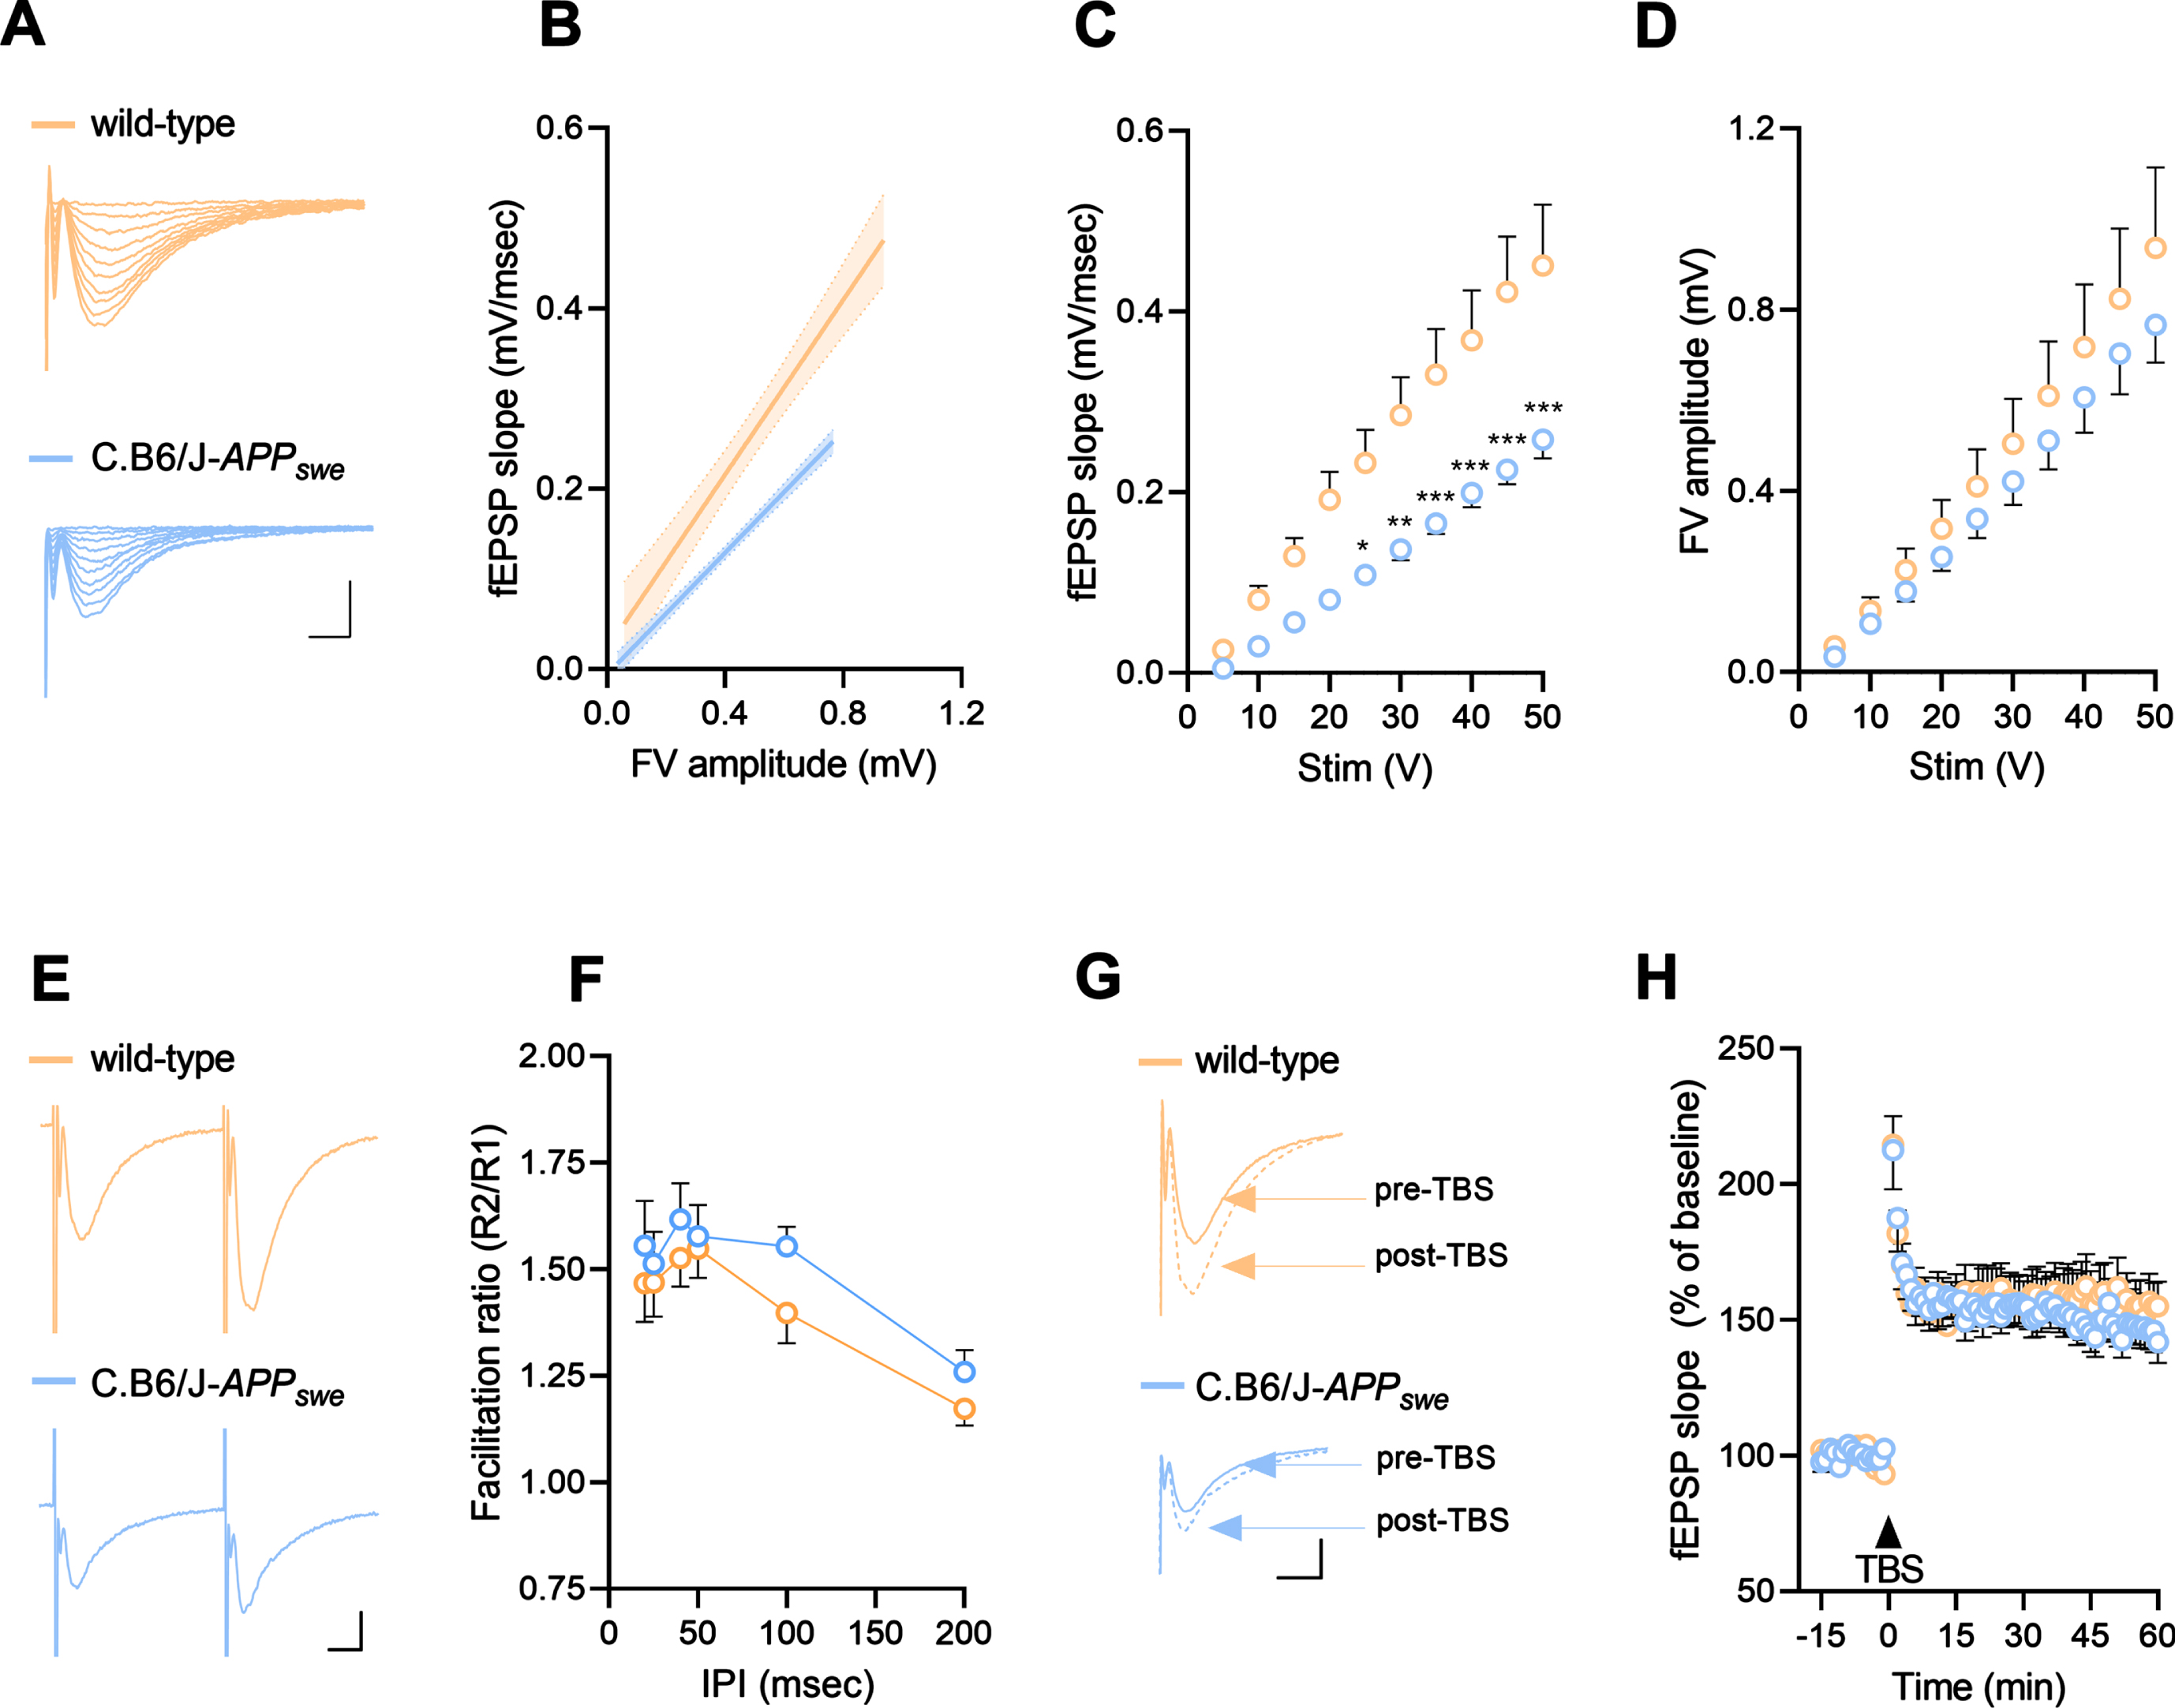
C.B6/J-APP swe mice show impaired synaptic transmission but preserved synaptic plasticity. A) Representative CA1 local field potentials responses obtained with stimulation intensities ranging from 5 through 50 V recorded in wild-type and C.B6/J-APP swe mice. Scale bars = 0.5 mV, 5 ms. B) Linear regression of the input-output curves of wild-type and C.B6/J-APP swe mice obtained plotting field excitatory post-synaptic potential (fEPSP) slope versus fiber volley (FV) amplitude for each stimulus strength. C.B6/J-APP swe mice (18 slices/7 mice) had a significantly lower slope than wild-type animals (15 slices/6 mice). C, D) Relationship between stimulus intensity and fEPSP slope (C) or FV amplitude (D) of wild-type and C.B6/J-APP swe mice. When plotted against stimulus strengths, fEPSP slopes are significantly lower in congenic (18 slices/7 mice) versus wild-type (15 slices/6 mice) mice, while the FV amplitudes showed no significant differences between the two genotypes. E) Representative traces after paired stimulations 50 ms apart in wild-type and C.B6/J-APP swe mice. Scale bars = 0.4 mV, 10 ms. F) Mean ratios of fEPSP slopes at each interpulse interval (IPI) of wild-type and C.B6/J-APP swe mice. No significant differences were found comparing congenic (19 slices/7 mice) and control (15 slices/6 mice) mice. G) Representative fEPSPs recorded during baseline (pre-theta-burst stimulation (TBS)) and 50–60 min after TBS (post-TBS) of wild-type and C.B6/J-APP swe mice. Scale bars = 0.4 mV, 10 ms. H) Time course changes of the average normalized (against baseline) fEPSP slope before and after TBS-induced Long-Term Potentiation in wild-type and C.B6/J-APP swe mice. TBS protocol was delivered at the time indicated by the arrow. No significant differences were found comparing congenic (19 slices/7 mice) and control (14 slices/6 mice) mice. Male (n = 4) and female (n = 3) C.B6/J-APP swe animals as well as male (n = 3) and female (n = 3) wild-type animals were grouped as no differences were found between sexes. Data are expressed as mean±SEM. Two-way ANOVA and Bonferroni’s test: *p < 0.05, **p < 0.01, ***p < 0.001 [versus wild-type mice].
In the Open Field test, C.B6/J-APPswe mice show increased explorative behavior
Female C.B6/J-APP swe animals of 12 and 16–18 months of age had significantly higher total distance moved, number of rearings, number of line crossings, and time spent in the arena center compared to age-matched controls and younger congenic mice. Male C.B6/J-APP swe animals had significantly higher total distance moved, number of rearings, number of line crossings, and time spent in the arena center compared to age-matched controls at all ages except for animals of 3 months of age (Fig. 10A).
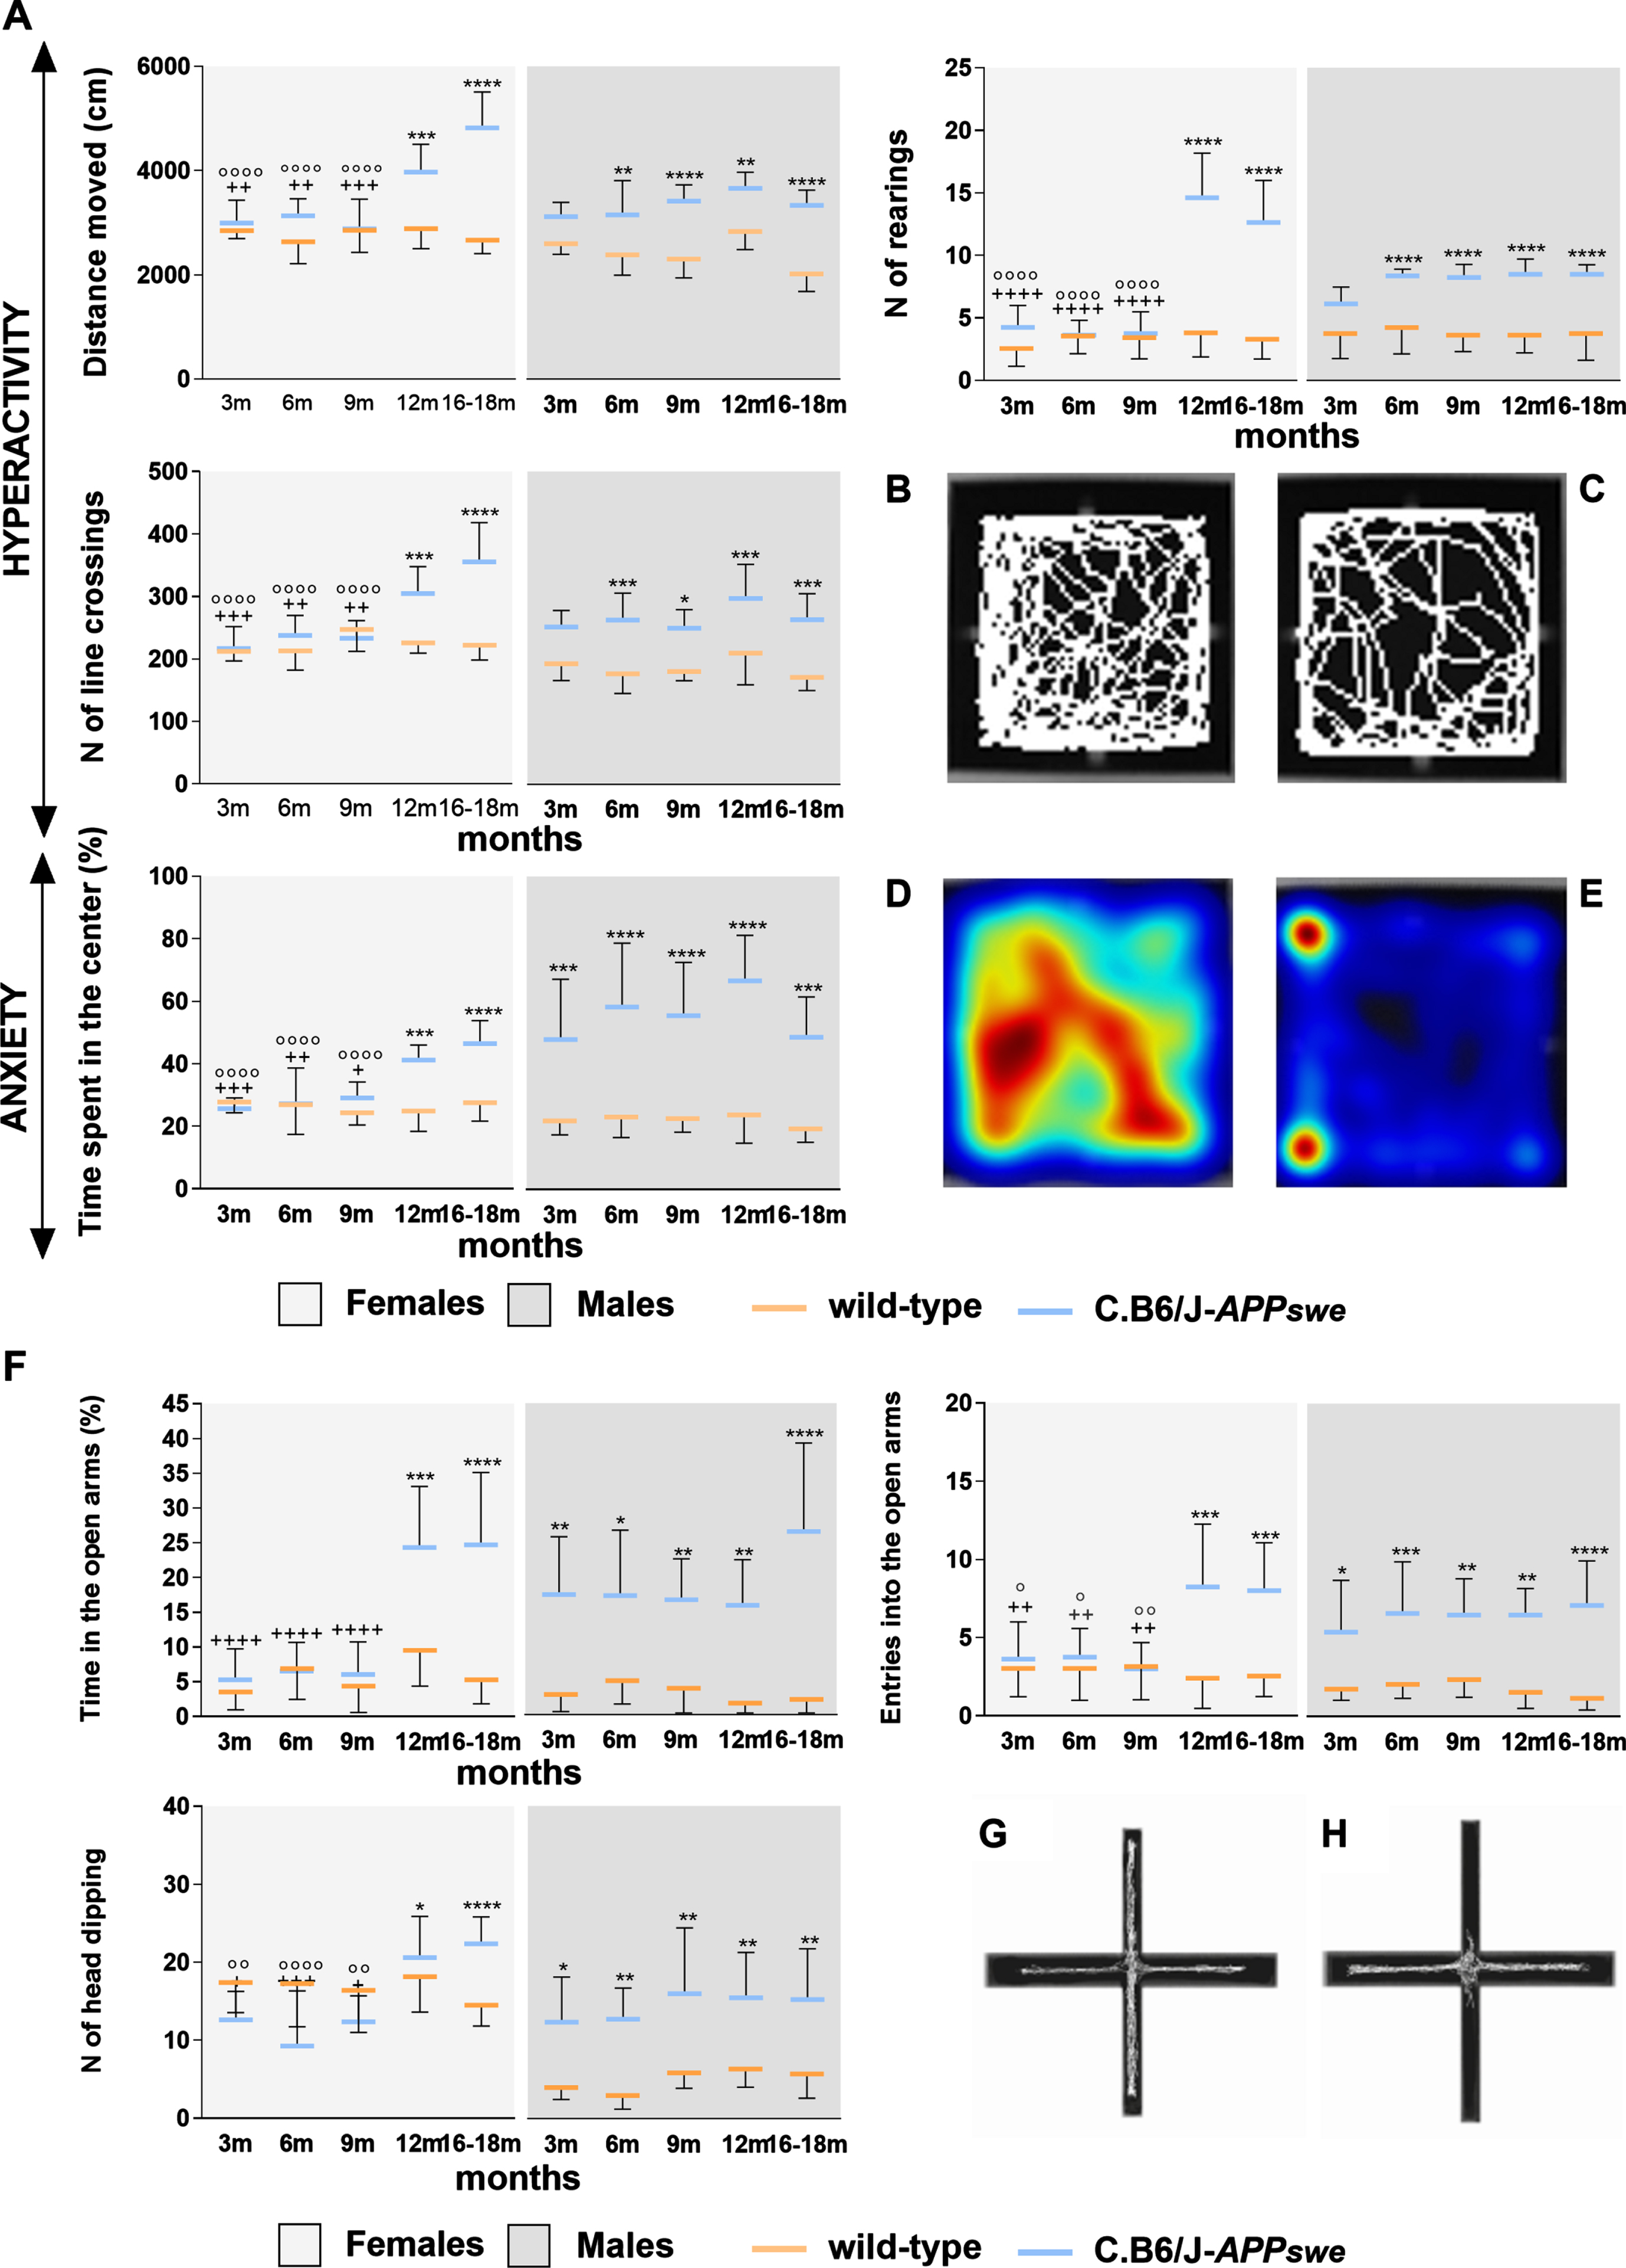
C.B6/J-APPswe mice have a hyper explorative behavior and a low anxiety-like behavior, early in males and late in females. A) In the Open Field test, congenic females of 12 and 16–18 months showed significantly higher exploration and lower anxiety-like behavior than age-matched wild-type and younger C.B6/J-APP swe animals. Congenic males showed the same behavior versus age-matched controls starting at 3 months for the time spent in the arena center and at 6 months for all the other parameters. B, C) The automatic tracking of congenic (B) and wild-type (C) male mice of 12 months of age: the C.B6/J-APPswe animal showed a hyper explorative behavior compared to the control. D, E) The heatmaps (colors go from blue to red due to the increase of the time spent in a zone) of congenic (D) and wild-type (E) male mice of 16–18 months of age. The control animal had a higher anxiety-like behavior -prolonged permanence in the arena corners- while the C.B6/J-APPswe animal also explored the arena center. F) In the Elevated Plus Maze test, C.B6/J-APP swe females aged 12 and 16–18 months showed a significantly lower anxiety-like behavior than the younger mice of the same genotype and their age-matched controls. All C.B6/J-APP swe males showed the same than age-matched wild-type mice. G-H) The automatic tracking of congenic (G) and wild-type (H) female mice of 16–18 months. The C.B6/J-APPswe animal spent a considerable percent time in the open arms (vertical) of the arena, while the control animal remained the entire time in the closed arms (horizontal). Eight male and eight female animals of each genotype were analyzed per age point. Two-way ANOVA and Tukey’s test. *p < 0.05, **p < 0.01, ***p < 0.001, ****p < 0.0001 [C.B6/J-APPswe versus age-matched wild-type mice]; +p < 0.05, ++p < 0.01, +++p < 0.001, ++++p < 0.0001 [C.B6/J-APPswe mice versus C.B6/J-APPswe mice aged 12 months]; °p < 0.05, °°p < 0.01, °°°°p < 0.0001 [C.B6/J-APPswe mice versus C.B6/J-APPswe mice aged 16–18 months].
C.B6/J-APPswe mice show a lower level of anxiety-like behavior in comparison to wild-type controls in the Elevated Plus Maze test
Female congenic animals aged 12 and 16–18 months had significantly higher percent time spent in the open arms, number of entries into the open arms, and number of head dipping compared to those aged 3, 6, and 9 months and to their age-matched controls. C.B6/J-APP swe males at all ages tested spent significantly more time in the open arms, had a significantly higher number of entries into the open arms, and a significantly higher number of head dipping than age-matched wild-type animals (Fig. 10F).
The total distance moved by each mouse during the test was measured to rule out that this behavior reflected the anxiety-like behavior and was not merely a consequence of the higher explorative behavior of C.B6/J-APP swe animals evidenced by the OF test. The data showed no significant differences between congenic and wild-type mice at any age, either in females or males, proving that the anxiogenic setting of the task reduced the hyper explorative behavior and that the higher exploration of the open arms is due to the lower anxiety-like behavior of C.B6/J-APP swe animals (Supplementary Figure 1).
Wild-type and C.B6/J-APPswe mice have similar performances in the Novel Object Recognition test
The percent time spent exploring the novel object was not significantly different among wild-type and C.B6/J-APPswe animals of both sexes and all age groups (Supplementary Figure 2).
The Morris Water Maze test reveals impairments in long-term spatial memory in C.B6/J-APPswe mice
During the training phase, the latency to find the platform decreased significantly from the 1st to the 5th day in all groups (Fig. 11A). In the probe phase, proximity was significantly higher in congenic than in age-matched wild-type females aged 6, 9, 12, and 16–18 months and in congenic than in age-matched wild-type males aged 9, 12, and 16–18 months. Furthermore, it was significantly lower in 3-month-old C.B6/J-APP swe mice of both sexes than in older mice of the same genotype (Fig. 11B). Differences in the cued control procedure between age-matched congenic and control mice were not significant (data not shown).
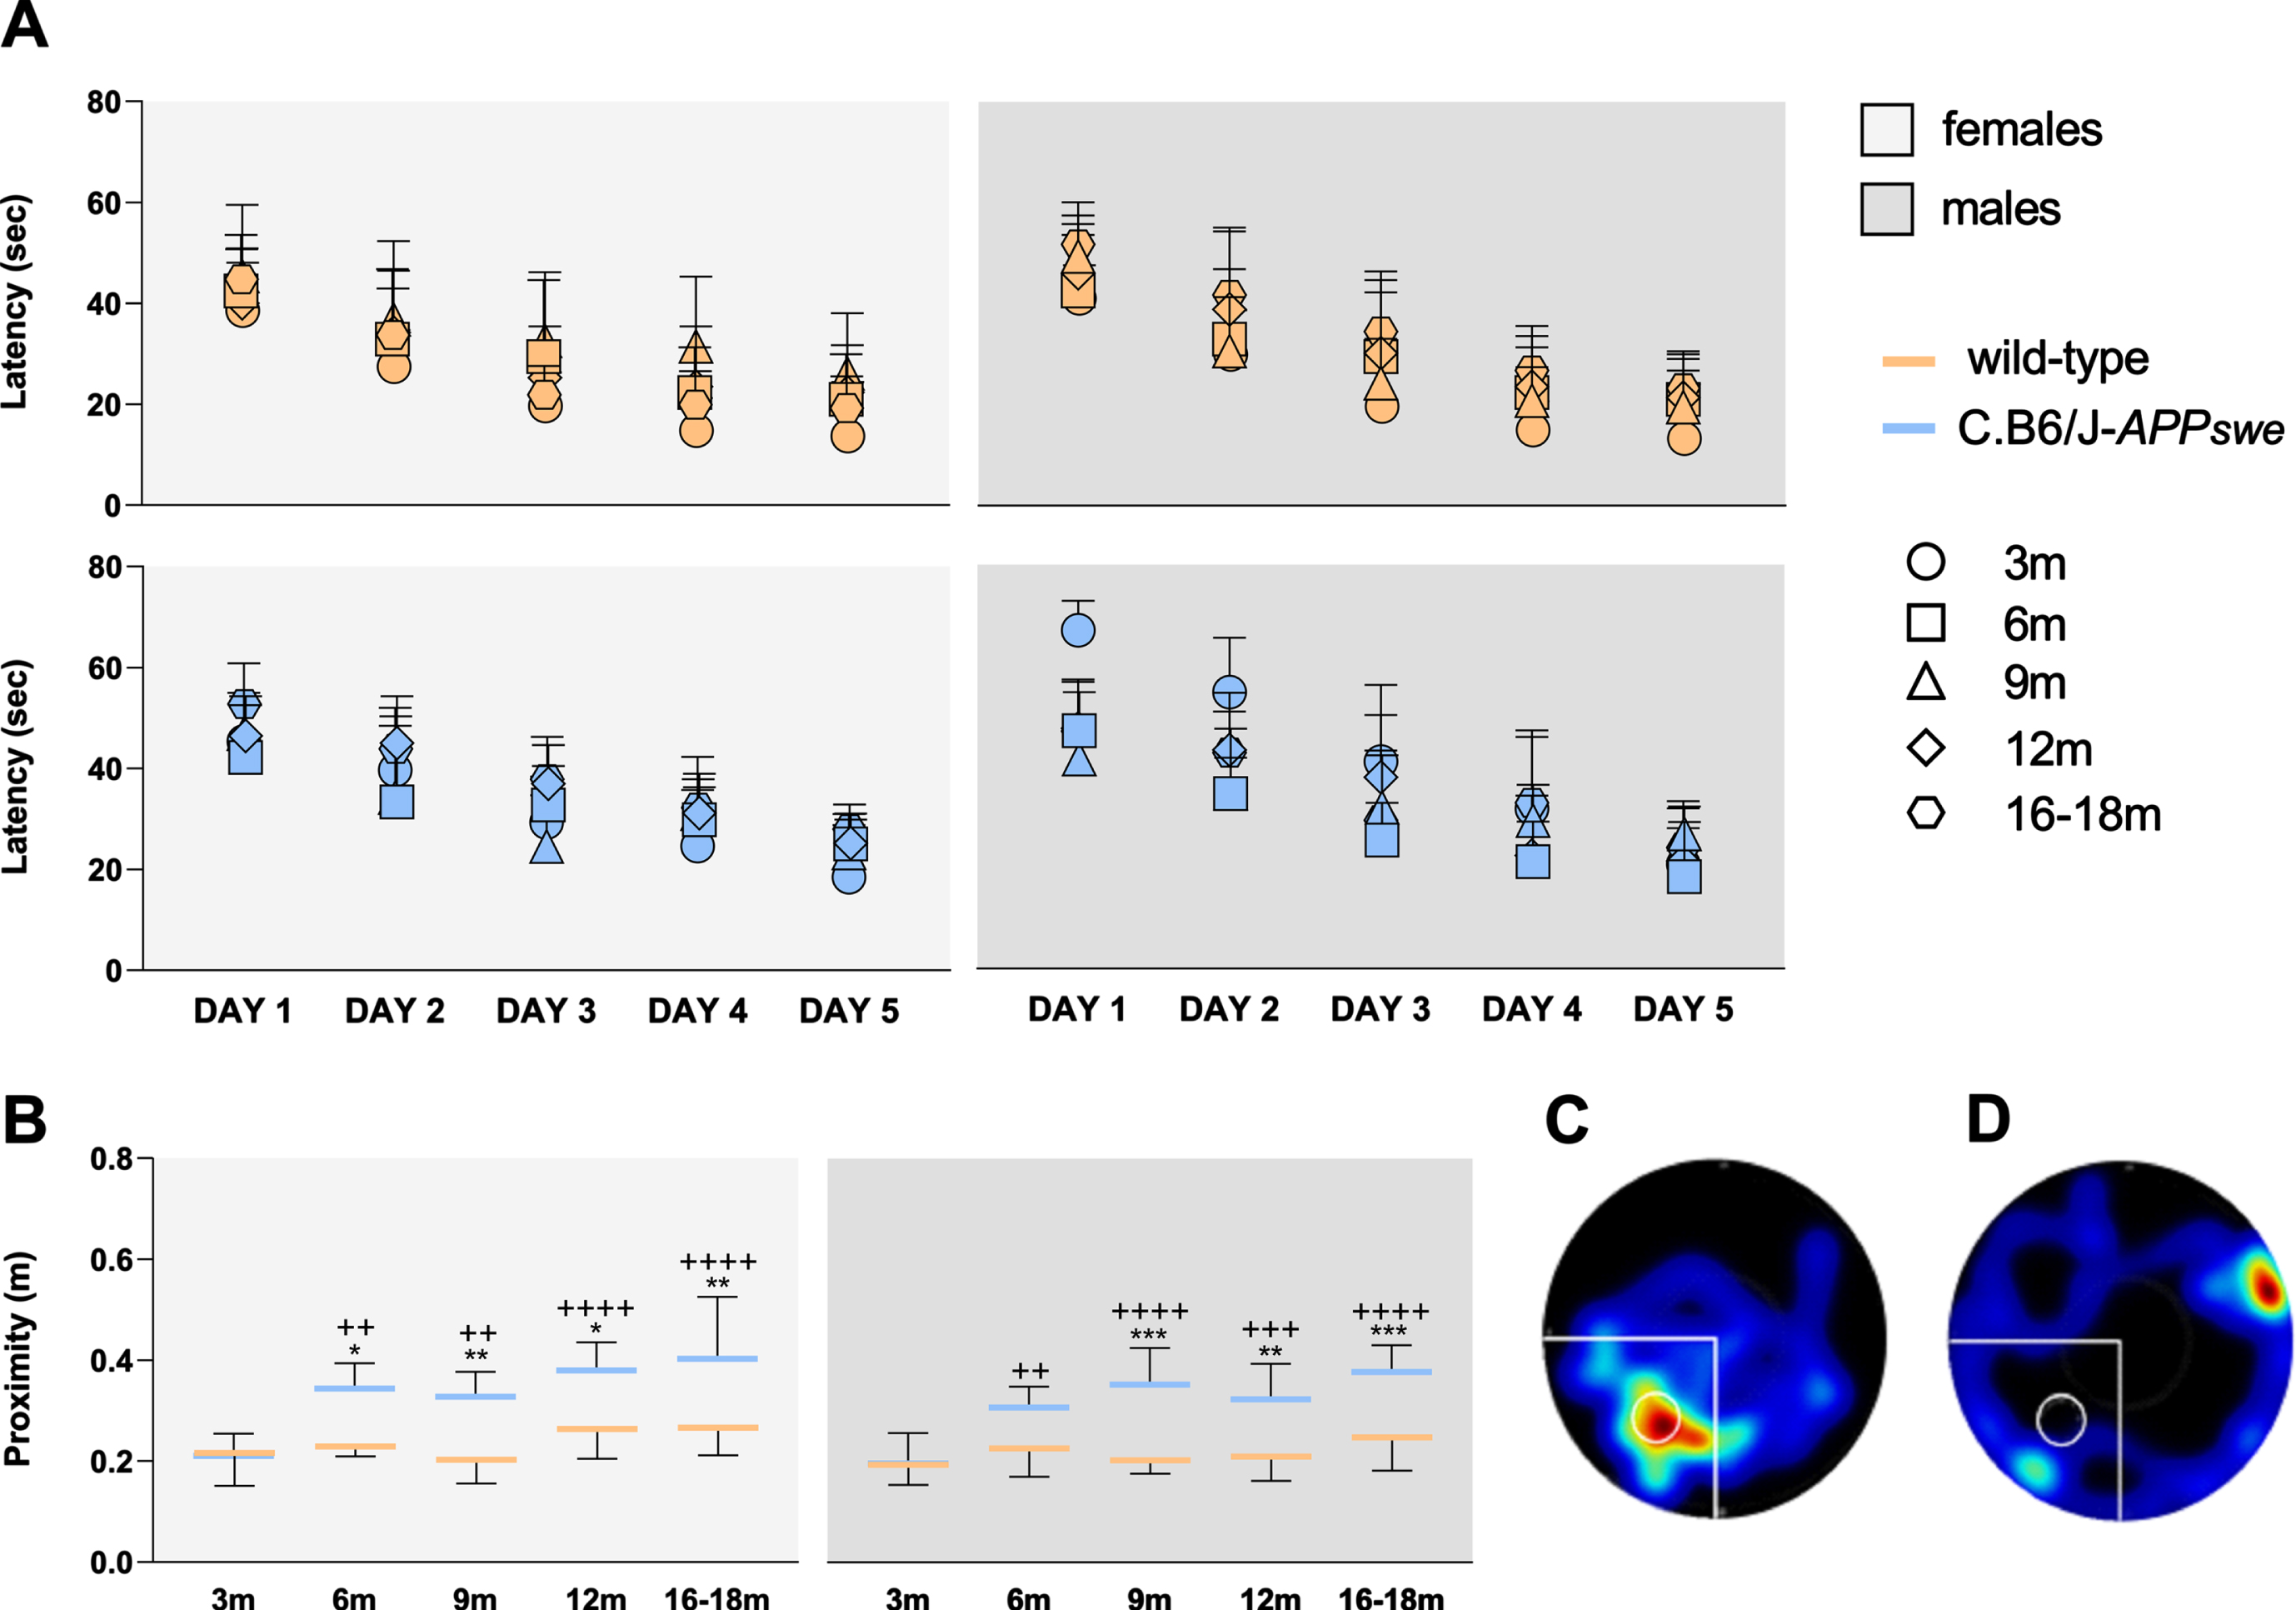
Animals of both genotypes and sexes show no deficits in spatial learning at all ages, while the long-term spatial memory is impaired in C.B6/J-APP swe mice, earlier in females than in males. A) All animals learned the task (i.e., significant reduction from day 1 to day 5 of the time spent to reach the platform). B) Congenic females aged 6, 9, 12 and 16–18 months had significantly higher proximity than age-matched wild-type females, as had congenic males aged 9, 12 and 16–18 months compared to age-matched controls. C, D) Images reported the heatmaps (colors range from blue to red tones due to the progressive increase in time spent in a zone) representing a good performer (C) and a bad performer (D) during the probe phase. The first animal swam almost all its time around the previous position of the platform (white circle), while the latter animal swam mainly outside the target quadrant (white lines). Eight male and eight female animals of each genotype were analyzed per age point. A) Two-way ANOVA for repeated measures and Holm-Sidak test; B) Two-way ANOVA and Tukey’s test. *p < 0.05, **p < 0.01, ***p < 0.001 [C.B6/J-APPswe versus age-matched wild-type mice]; ++p < 0.01, +++p < 0.001, ++++p < 0.0001 [C.B6/J-APPswe mice versus C.B6/J-APPswe mice aged 3 months].
C.B6/J-APPswe mice have impairments in working spatial memory, as evaluated by the Radial Arm Water Maze test
Female congenic mice performed as female wild-type mice at 3 and 6 months of age, started to make a significantly higher number of errors at 9 months of age, and had the worst performance at 16–18 months of age. Male C.B6/J-APP swe animals showed few deficits already at 3 months of age, then worsened progressively to 16–18 months of age (Fig. 12A).
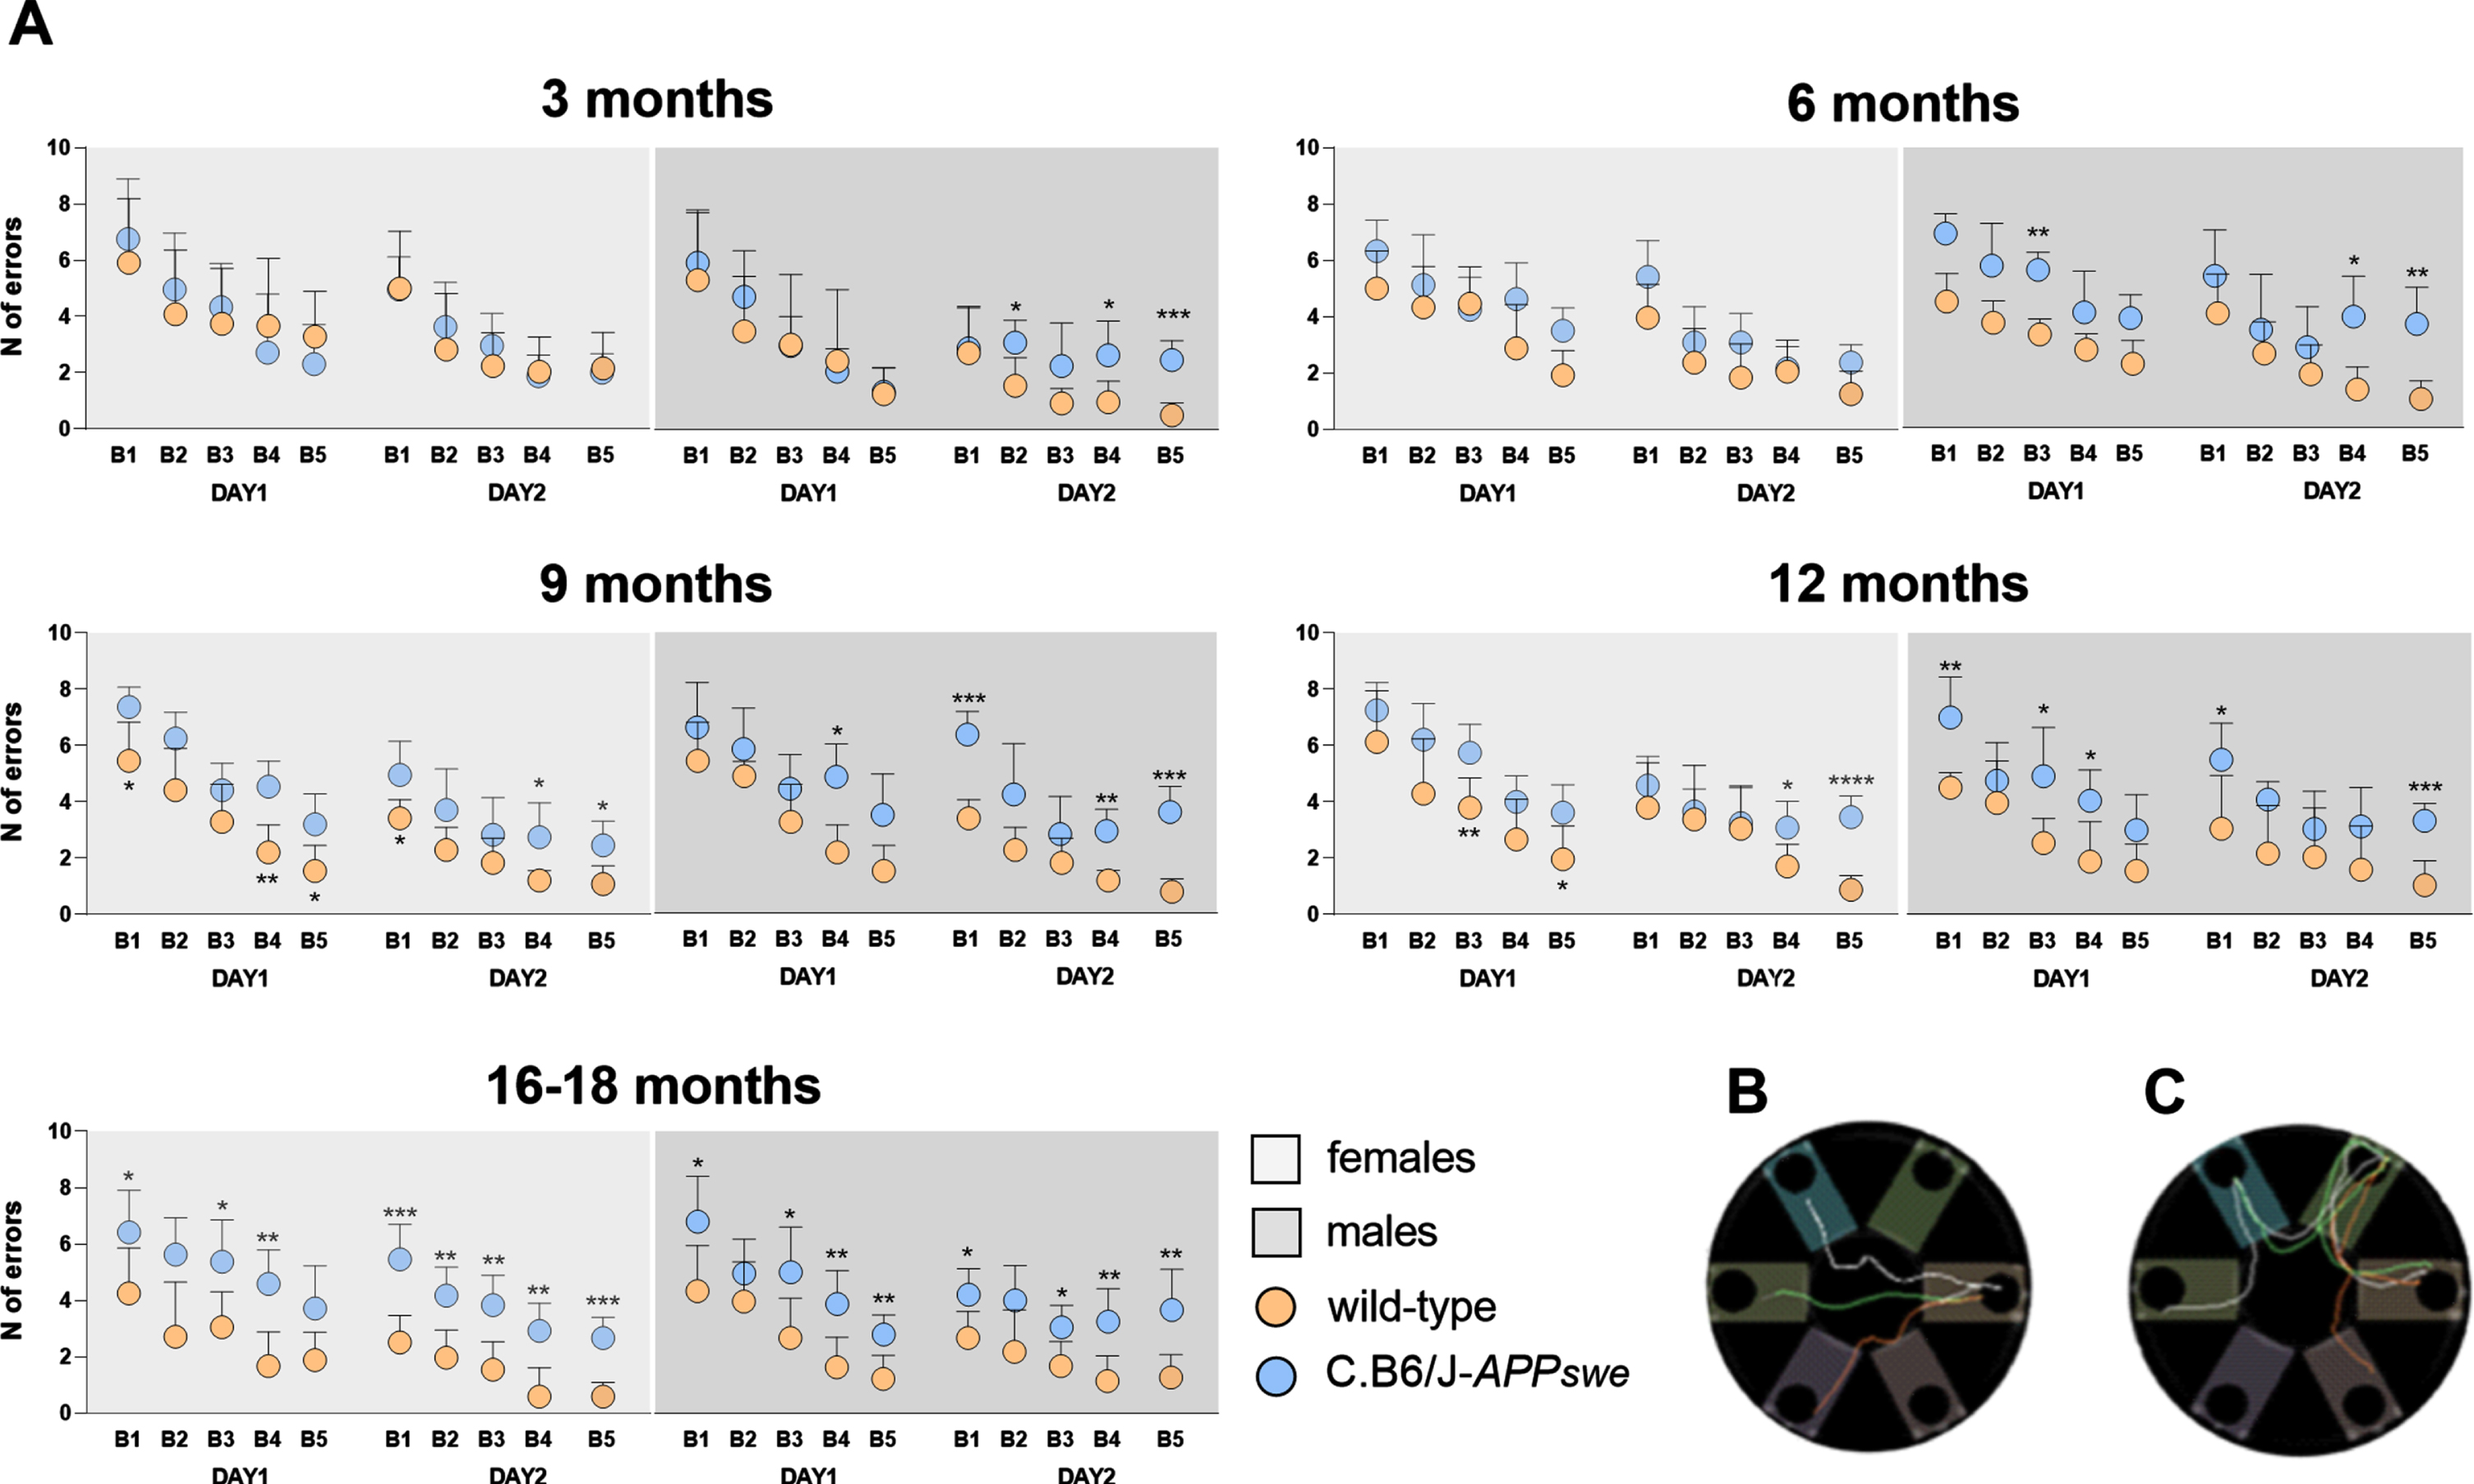
C.B6/J-APP swe mice have spatial working memory deficits, whose onset is earlier in males than females and worse during aging. A) Comparing the performances in the Radial Arm Water Maze test of wild-type and C.B6/J-APPswe females, no differences were found at 3 and 6 months of age, but then congenic mice started to make a significantly higher number of errors, worsening to 16–18 months when the significance was reached almost in every block of both days. C.B6/J-APPswe males compared to age-matched wild-type males made a significantly higher number of errors in few blocks already at 3 months of age, then worsening the performance till 16–18 months when the significance was reached almost in every block of both days. B, C) Images reported the tracking profiles during the last three releases of the task. In B is a good performer who made no errors to find the platform; in C is a bad performer who tried to enter several arms before finding the goal one. Eight male and eight female animals of each genotype were analyzed per age point. Two-way ANOVA for repeated measures and Tukey’s test. *p < 0.05, **p < 0.01, ***p < 0.001 [C.B6/J-APPswe versus age-matched wild-type mice]. B1, block 1; B2, block 2; B3, block 3; B4, block 4; B5, block 5.
DISCUSSION
The present study demonstrates, through the analysis of five age groups, that the C.B6/J-APP swe mice develop several features of human AD (Table 1).
Comparison of the key features and their timeline of appearance among the Tg2576 model, C.B6/J-APP swe mice and wild-type animals
In C.B6/J-APP swe animals, transgenic AβPP is synthesized early, is metabolized pathologically, and its presence does not interfere with the metabolism of the endogenous protein. C.B6/J-APP swe mice are a “late-plaque model”, and this feature helps evaluating the influence of age on disease progression [27]. Congenic mice have high level of pTau that might contribute to synaptic deficits, despite no neurofibrillary tangles are assembled. Indeed, evidence exists that Aβ and pTau act synergistically to trigger synapse dysfunction [28]. Accordingly, synaptic density is reduced in congenic mice in all areas analyzed, except for DG. In the DG, the lack of altered synaptic density could depend on the higher resistance of these cells to harmful stimuli of Aβ with respect to the other hippocampal neurons [29]. At the functional level, we found an altered synaptic efficacy in C.B6/J-APP swe mice in CA1, in line with other AD mouse models [30–33]. Conversely, we found that both PPF and LTP were not significantly different between the two groups. Thus, although the number of functional synapses is significantly reduced, it appears that the functional synapses display intact pre-synaptic efficacy and preserve the capability to undergo plastic changes following TBS at the age tested. This latter finding is not surprising since aberrant synaptic efficacy, but concomitant preserved synaptic plasticity, has been reported in other murine models of AD [30, 34–36].
In AD patients, a significant neuron loss occurs in specific brain areas closely involved in learning and memory [37] and both cleaved-CASP3 [38–40] and RIP3 [36] are implicated. In our congenic mouse model, neurodegeneration was found at late ages at CA1 and PCtx, and both apoptotic and necroptotic/necrotic phenomena were detected. The glia analysis sketched a complex picture. In DG and PCtx, C.B6/J-APP swe mice showed astrogliosis at all ages tested as compared to wild-type animals. Yet, in PCtx and CA1 of congenic mice, the density of GFAP-positive cells significantly decreased during last phases of the disease. In human AD, astrocytes hyperreactivity seems to be protective, while astrocytes atrophy seems to reflect a decreased structural and functional interaction with neurons [42, 43]. Accordingly, in our mouse model a link between neurodegeneration and reduction of GFAP-positive astrocytes, which may suggest cellular atrophy, is conceivable in the two areas where the phenomena are both present, namely CA1 and PCtx. Astrocytic atrophy may impact on cognitive abilities because it is involved in the alteration of the chemical environment needed for proper synaptic signaling [44]. One possible consequence of this homeostatic imbalance could be the leakage of neurotransmitters in extrasynaptic areas. In the case of glutamate leakage, extrasynaptic NMDA receptors, containing the NR2B subunit, may be activated, thus inducing long-term depression. So, a decreased astrocyte synaptic support may impair synaptic plasticity, shifting it towards depression, which can negatively affect memory. Astrocytic reduced function may also affect potassium clearance in the synaptic cleft, in this case causing an increase in the excitability of the synaptic network, excitotoxicity, and neuronal death [45]. However, it is important to note that, even if GFAP is present in most CNS astrocytes and it is considered a marker of reactive gliosis [46, 47], recent evidence shows that it has different functions in different astrocyte subtypes, and its expression is affected by external perturbation, such neuronal activity and hormones that elicit the activity of protein kinase and other signaling molecules [46, 49]. Thus, further investigations are needed to clarify the mechanisms underlying the reduction of GFAP staining in CA1 and PCtx. Indeed, tissue milieu modifications might be the cause rather than the consequence of the GFAP signal reduction. Microglial cells have been shown to counteract amyloid toxicity, but, if their activation is not appropriately regulated, they produce overblown inflammatory molecules, participate in complement-mediated synapse loss, and may promote the cell-to-cell spread of tau pathology [50, 51]. In CA1 and CA3, significant microgliosis was detected in congenic mice, in DG it was slight, and it was absent in PCtx. The possible protective or harmful role in each area will need further investigation. Several studies demonstrated the existence of differences between human AD and mouse models of AD. In patients, there is a limited activation of microglia and the presence of dystrophic or senescent microglial cells; in mouse models, microglial cells have a cytotoxic and active proinflammatory state [52, 53]. This observation has been recently confirmed by transcriptional analyses showing different profiles of mRNA expression in microglia from AD brains and mouse models of neurodegeneration [54, 55]. However, both microglial senescence and chronic low-grade neuroinflammation could be detrimental as they can weaken the brain’s immune response, negatively affecting the neuronalfunction.
Functional and structural brain abnormalities were paralleled by behavioral and cognitive alterations in the C.B6/J-APP swe mice, with sex-related differences (earlier onset of hyperactivity, low anxiety-like behavior and impaired spatial working memory in males, and earlier onset of deficits in spatial long-term memory in females). Some studies reported that BALB/c mice displayed scarce locomotor activity in the OF test, high level of anxiety-like behavior in the EPM test, poor learning ability in the MWM test, and good performances on the NOR test [56–58]. These features did not influence the cognitive/behavioral profile of our model, except for the well-established recognition memory typical of the genetic background. Restlessness and agitation are typical of the human disease, while most patients showed increased rather than reduced anxiety [59]. As far as animal models are concerned, the literature reports both higher [60–62] and lower [63–67] anxiety in comparison to controls. Considering the recent finding that an anxiety-like behavior appears to be due to an excitatory/inhibitory imbalance in the ventral hippocampus [68], the C.B6/J-APP swe mouse could help to understand possible, if any, resistance mechanisms present in this specific area.
Systematic studies to establish the life expectancy of AD mouse models are scanty and provide extremely variable data not only on the basis of genetic mutation and genotype but also of sex and environment [69, 70]. Thus, we decided to evaluate the breeding characteristics of the new strain instead of focusing on absolute median and maximum lifespan values. Females showed no in-cage aggression; conversely, aggressive behavior was detected among males (e.g., chasing and fighting), but it rarely led to death as long as only littermates were housed together after weaning. Thus, the resort to single housing is not necessary unlike other strains [71–74]. This is a crucial feature that pinpoints our model as a suitable mouse model for the study of AD. Indeed, social isolation/deprivation profoundly affects the onset and progression of the cognitive, behavioral, histological, and molecular changes of AD thus potentially leading to biased results [75–78].
AD, obesity, type II diabetes, and metabolic syndrome are closely related [79–82], thus the observation that our congenic model is underweight may seem a contradiction. However, other AD models fed a normal diet have low body weight [80]. Moreover, the marked underweight of C.B6/J-APP swe mice, especially in females, could provide insight into the so-called “obesity paradox” [83]: in humans, late-life weight loss and low body mass index increase the risk of developing dementia [84]. General agreement exists about the role played by the morphological and functional alterations of cerebral regions involved in feeding behavior [85, 86]. On the contrary, while some studies suggested that hypermetabolic state does not contribute to weight loss [87], others showed alteration of leptin signaling in the hypothalamus due to Aβ accumulation [88, 89]. Lower body weight might also be related to lean tissue mass decreasing, triggered, or at least mediated, by the increased production of myostatin [90]. Therefore, it is conceivable that several mechanisms act synergically, and C.B6/J-APP swe mice may prove useful in clarifying their interactions.
In conclusion, the main strengths of our model are 1) the presence of neurodegeneration and its possible link with astrocyte atrophy in specific brain regions, 2) the sex-related differences in the onset of cognitive/behavioral deficits, 3) the possibility to carry out social housing, even for male mice, and 4) the good breeding performance, like in the original BALB/c strain. The main limitations are the absence of neurofibrillary tangles, and the need of a high number of new-born animals, especially males, in studies addressing late-life issues, due to the high mortality. We suggest that C.B6/J-APP swe mice could have useful applications in the analysis of the relationship between neurodegeneration and glia alterations, and in the study of the mechanisms responsible for the differences in cognitive/non-cognitive symptoms between male and female AD patients.
Footnotes
ACKNOWLEDGMENTS
The authors are grateful to Dr Daniela Puzzo for her scientific and methodological suggestions, Remo Mariani for his help in building the arenas, Fiorenza Orlando for veterinary assistance, Giovanni Bernardini and Beatrice Bartozzi for their help in animal care, Elisa Principi and Marzio Marcellini for their help with figures.
FUNDING
This work was supported by IRCCS INRCA (“Current Research” fund of the Italian Ministry of Health and revenues of the “5 per Mille”), Fondazione Giorgini and UNIVPM (PSA 2017) (to FC).
CONFLICT OF INTEREST
The authors have no conflict of interest to report.
DATA AVAILABILITY
The raw data that support the findings of this study are available from the corresponding author upon reasonable request.