
Abstract
Background:
We explored the gene expression levels in the brain of 3xTg-AD model mice to elucidate the molecular pathological changes from the early to end stages of Alzheimer’s disease (AD).
Objective:
We re-analyzed our previously published microarray data obtained from the hippocampus of 3xTg-AD model mice at 12 and 52 weeks of age.
Methods:
Functional annotation and network analyses of the up- and downregulated differentially expressed genes (DEGs) in mice aged 12 to 52 weeks were performed. Validation tests for gamma-aminobutyric acid (GABA)-related genes were also performed by quantitative polymerase chain reaction (qPCR).
Results:
In total, 644 DEGs were upregulated and 624 DEGs were downregulated in the hippocampus of both the 12- and 52-week-old 3xTg-AD mice. In the functional analysis of the upregulated DEGs, 330 gene ontology biological process terms, including immune response, were found, and they interacted with each other in the network analysis. In the functional analysis of the downregulated DEGs, 90 biological process terms, including several terms related to membrane potential and synapse function, were found, and they also interacted with each other in the network analysis. In the qPCR validation test, significant downregulation was seen for Gabrg3 at the ages of 12 (p = 0.02) and 36 (p = 0.005) weeks, Gabbr1 at the age of 52 weeks (p = 0.001), and Gabrr2 at the age of 36 weeks (p = 0.02).
Conclusion:
Changes in immune response and GABAergic neurotransmission may occur in the brain of 3xTg mice from the early to end stages of AD.
INTRODUCTION
Alzheimer’s disease (AD) is a neurodegenerative disorder with recent memory impairment as the core symptom, but it often presents with psychiatric symptoms, such as anxiety and depression [1, 2]. There is currently no cure, and all treatments are palliative and have limited effects on the disease progression and pathogeneses. The histopathological hallmarks in the AD brain are senile plaques and neurofibrillary tangles [3, 4]. Senile plaques are extracellular accumulations of amyloid-β beta (Aβ) produced from the amyloid-β protein precursor (AβPP) [5], which is encoded by the APP gene located at chromosome 21q21.3. Neurofibrillary tangles are abnormal intracellular accumulations of hyperphosphorylated protein tau, which are encoded by the microtubule-associated protein tau gene (MAPT) [6]. APP mutations are linked to familial AD and cerebral amyloid angiopathy [7]. MAPT mutations are associated with frontotemporal dementia with parkinsonism linked to chromosome 17 (FTDP-17), which causes abnormal tau aggregation [8]. Mutations in the presenilin 1 gene (PSEN1) encoding presenilin-1 at chromosome 14q24.2 enhance Aβ generation, and have been reported as the most common cause of familial AD [9]. Similarly, mutations in the presenilin 2 gene (PSEN2) at chromosome lq42.13 have been reported as the main cause of familial AD [9].
3xTg-AD model mice have three mutations (Swedish APP, PSEN1 M146V, and MAPT P301L) associated with familial AD, and exhibit both the plaque and tangle pathologies [10]. At as early as 3 to 4 months of age, intracellular Aβ immunoreactivity is detected in several brain regions [10]. Extracellular accumulation of Aβ in the frontal cortex appears within 6 months of age and becomes more widespread by 12 months of age [11]. Abnormal aggregates of hyperphosphorylated tau in the hippocampus appear within 12 to 15 months of age [10]. Synaptic dysfunction, including long-term potentiation impairments, occurs prior to the development of senile plaques and neurofibrillary tangles [10]. Cognitive impairment is observed by 4 months of age [12]. 3xTg-AD model mice are considered one of the most promising AD model mice [13].
The amyloid cascade hypothesis, which posits that the neurodegenerative pathology of AD is caused by the accumulation of Aβ plaques, has widely been accepted [14, 15]. However, many drugs designed to eliminate the extracellular accumulation of Aβ have failed to improve the symptoms of AD [16–18]. Recent studies have suggested that the intracellular accumulation of soluble Aβ is more neurotoxic and plays a more important role in AD pathology than the extracellular accumulation of insoluble Aβ fibers [19–21]. Thus, this study was designed to evaluate the genetic changes in the brain of 3xTg mice at 12 weeks when only intracellular accumulation of soluble Aβ was observed [10].
In addition, it has been suggested that aberrant gamma-aminobutyric acid (GABA) neurotransmission may be present in AD model mice and AD patients [22, 23], but the details remain unknown. Therefore, we focused and investigated on GABA-related genes.
In this study, to elucidate the changes in gene expression over time from the early to end stages of AD, we performed 1) a microarray analysis using the hippocampus of 3xTg-AD model mice at 12 and 52 weeks of age, 2) functional annotation and network analyses of the up- and downregulated differentially expressed genes (DEGs) in mice aged 12 to 52 weeks, and 3) reverse transcription-quantitative polymerase chain reaction (qPCR) validation tests for GABA-related genes.
MATERIALS AND METHODS
Animal models
The male 3xTg-AD mice were purchased from Jackson Laboratory (MMRRC #34830; B6129SF1/J, JAX #101043). As the sham group, male B6129SF2 wild-type (WT) mice were purchased and age-matched with the 3xTg mice (n = 8 each at 12, 36, and 52 weeks of age). In the 3xTg mice, the ages of 12, 36, and 52 weeks were chosen to represent the early, middle, and late stages of AD [24, 25]. The sample size (n = 8 each) was the minimum number required for the experiment, and the number permitted by the Ethics Committee of Ehime University. The mice were housed in a pathogen-free environment with a 12-h light/12-h dark cycle at room temperature (22°C) with 50% humidity and climate control. The mice were given unlimited access to water and standard food (Oriental Yeast Co., Ltd.). At 12, 36, or 52 weeks of age, the mice were anesthetized and killed by decapitation. Each hippocampus was immediately excised and frozen at –80°C for RNA isolation. All of the animal experiments were approved by the Animal Experiment Committee of Ehime University (#28-25).
Microarray analysis
Microarray data from our previous study [26] using the hippocampus of 12- and 52-week-old mice were re-analyzed. The microarray data were deposited into the GEO database (accession number GSE144459). Total RNA was isolated from the frozen hippocampus using the RNeasy Mini Kit (QIAGEN, #74104). A NanoDrop1000 device (Thermo Fisher Scientific) was used to measure the concentrations of RNA. An Agilent 2100 Bioanalyzer (Agilent) was used to measure the RNA integrity number (RIN). All of the samples used for the microarray analysis satisfied the following criteria: A260/A280≥1.8, A260/A230≥2.0, and RIN≥7.0. The RIN of each sample is shown in Supplementary Table 1.
Analysis of microarray data
Probes showing no signal or an extremely low signal in all groups of mice were omitted as they indicated unreliable signals or low expression. Probe sets registered as mRNA sequences in the National Center for Biotechnology Information (NCBI) Reference Sequence Database (https://www.ncbi.nlm.nih.gov/refseq/) were analyzed. Probes that have been detected as transcript variants registered in the NCBI Reference Sequence Database were removed. When multiple probes were registered for one gene symbol, only the probe showing the highest expression level was selected. The average expression levels of the WT and 3xTg mice were compared by Student’s t-test using R software (R version 4.0.2) [27]. Statistical significance for DEGs was defined as a p-value < 0.05 and q-value < 0.05. The Ggplot2 R package was used to generate volcano plots. The Heatmap2 R package was used to generate heatmaps based on the DEGs that showed a significant change.
Pathway and process enrichment analyses
Gene ontology analysis of the biological processes (BPs) based on the up- or downregulated DEGs in the 12- and 52-week-old groups was performed using Metascape (https://metascape.org/) [28]. Using the cumulative hypergeometric distribution, p-values were computed. Terms with a p-value < 0.01 (-Log10 p-value < 2) and a minimum count of three genes were collected and grouped into clusters based on their similarities. For hierarchical clustering of the enriched terms, kappa scores were utilized as the similarity measure, and sub-trees with a similarity of > 0.3 were regarded as a cluster. The terms with the lowest p-values from each cluster were chosen as cluster labels. To visualize the links between terms, a graphical network of enriched terms was created by Metascape [28] and Cytoscape (https://www.cytoscape.org) [29]. Each node representing an enriched term was colored according to the p-value. Terms with a similarity > 0.3 were connected by edges. Only term labels with the lowest p-values from each cluster are shown, and only the network plots with more than three enriched terms are displayed.
qPCR
To measure the expression levels of mRNA, qPCR was performed using the StepOnePlus Real-Time PCR System (Applied Biosystems). The predesigned Prime-Time qPCR Assays (Integrated DNA Technologies, Inc.) were used as probes to evaluate the expression levels of each mRNAs and shown in Supplementary Table 2. Gapdh was used as the reference gene. The Prime-Time Gene Expression Master Mix (Integrated DNA Technologies, Inc.) was used in a final volume of 10μL. To eliminate errors between plates, the same calibrator sample was included on each plate. mRNA expression levels were measured in duplicate. The ΔΔCt method [30] was used to calculate the relative expression values.
Statistical analysis
SPSS 22.0 software (IBM Japan) was used for the statistical analysis of the qPCR results. The evaluation of data with a normal distribution was conducted using the Shapiro– Wilk test. Student’s t-test or the Mann-Whitney U test were used to compare the average mRNA expression levels between the WT and 3xTg mice. A 95% threshold of statistical significance (p = 0.05) was used.
RESULTS
Data of the microarray analysis
A total of 10,599 genes met the criteria. In the 12-week-old group, 923 upregulated (Supplementary Table 3) and 1,332 downregulated (Supplementary Table 4) DEGs were detected in the 3xTg mice when compared to the WT mice (p < 0.05 and q < 0.05). The heatmaps of the DEGs in the 12-week-old group are shown in Fig. 1A. In the 52-week-old group, 1,928 upregulated (Supplementary Table 5) and 1,728 downregulated (Supplementary Table 6) DEGs were detected in the 3xTg mice when compared to the WT mice (p < 0.05 and q < 0.05). The heatmaps of the DEGs in the 52-week-old group are shown in Fig. 1B. The DEGs with a high fold-change are shown in Table 1. The DEGs that overlapped in each group are shown in the Venn diagram in Fig. 1C. In total, 644 DEGs were upregulated and 624 DEGs were downregulated in both the 12- and 52-week-old groups. Lists of the genes that overlapped in each group are shown in Supplementary Table 7A-D.
Top five DEGs with the highest fold-change among the significantly up- and downregulated genes in the 12- and 52-week-old groups
DEGs, differentially expressed genes; WT, wild-type; 3xTg, 3xTg-AD model.
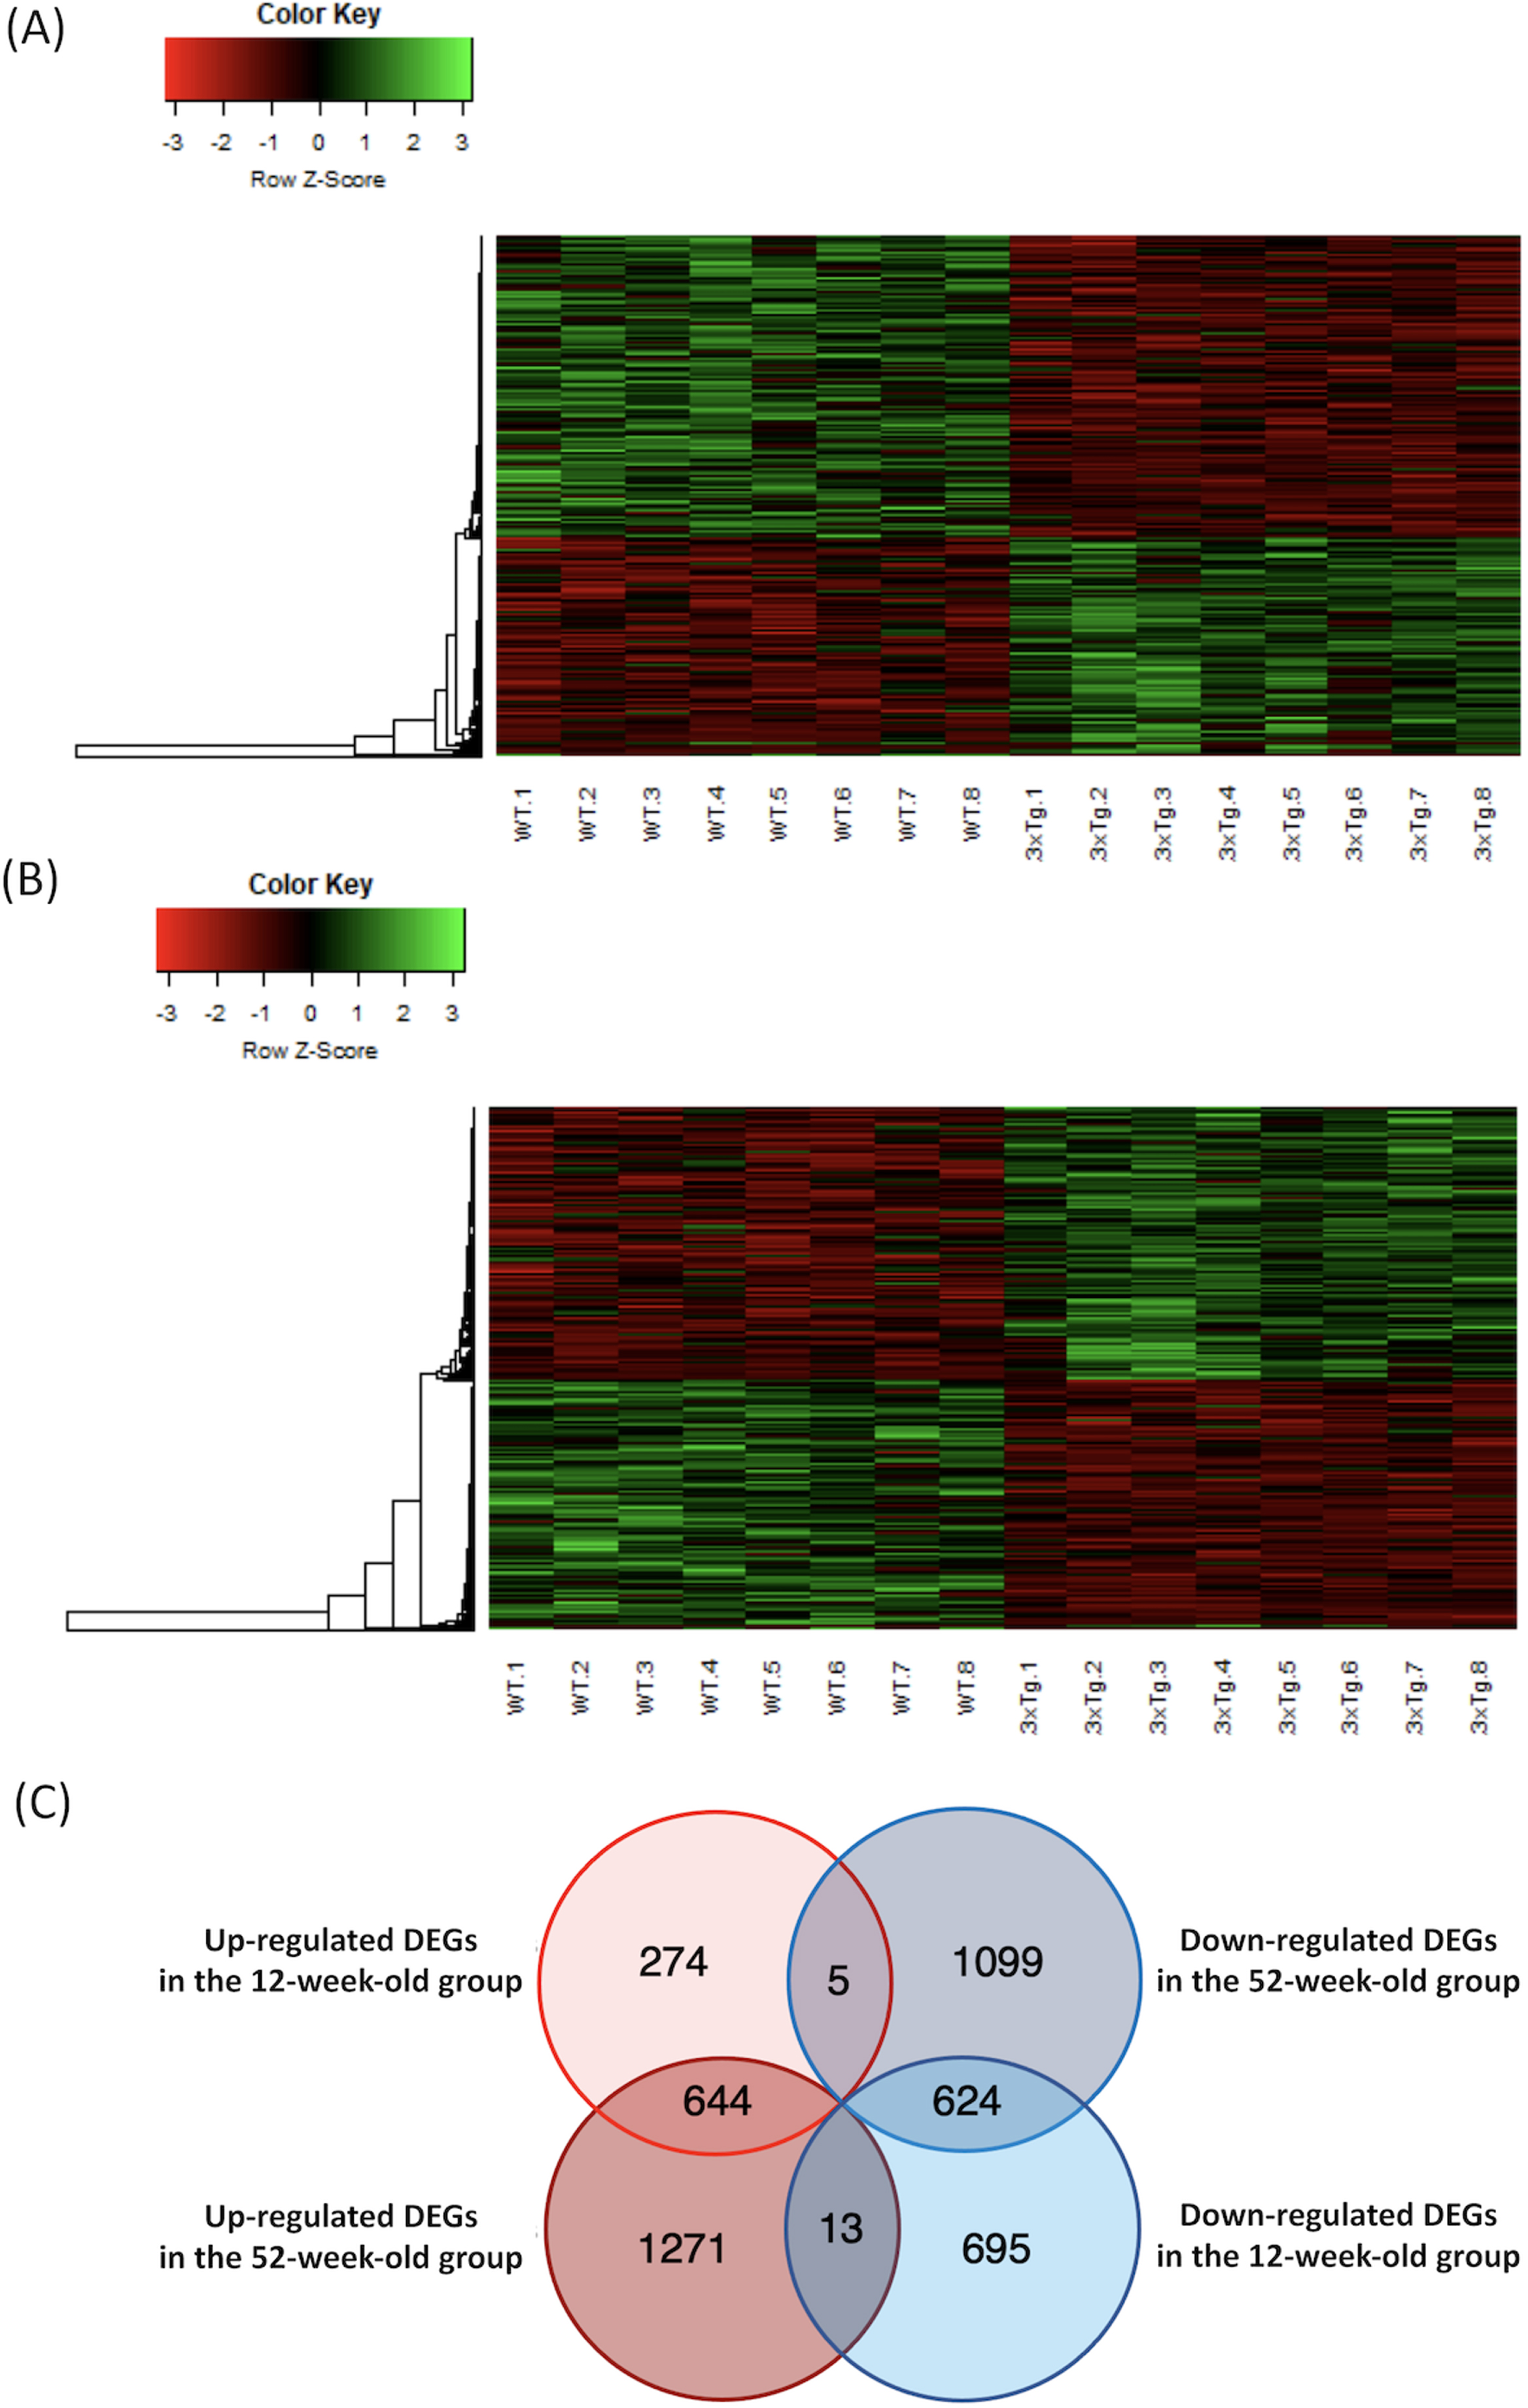
Heatmap of the microarray data, and Venn diagram of the overlapping DEGs in each group. A) The microarray data of DEGs in the 12-week-old group were plotted as a heatmap. High-expression DEGs are shown in red, and low-expression DEGs are shown in green. B) The microarray data of DEGs in the 52-week-old group were plotted as a heatmap. C) The number of DEGs that overlapped in each group are shown in the Venn diagram. DEGs, differentially expressed genes; WT, wild-type mice; 3xTg, 3xTg-AD model mice.
Functional annotation and network analysis
All of the 644 upregulated DEGs in both the 12- and 52-week-old groups were subjected to functional annotation analysis. There were 330 BP terms that reached a significant level (Supplementary Table 8). Hierarchical clustering of the enriched terms was performed, and the terms with the lowest p-values from each cluster were chosen as cluster labels. The top 20 cluster labels are shown in Fig. 2A. The network of the 330 significant BP terms is shown in Fig. 2B. Several terms related to immune response (response to interferon-gamma, defense response to virus, etc.) were found, and they interacted with each other. Response to interferon-gamma was the most significant term (p < 0.001; -log10 p value = 11.5).
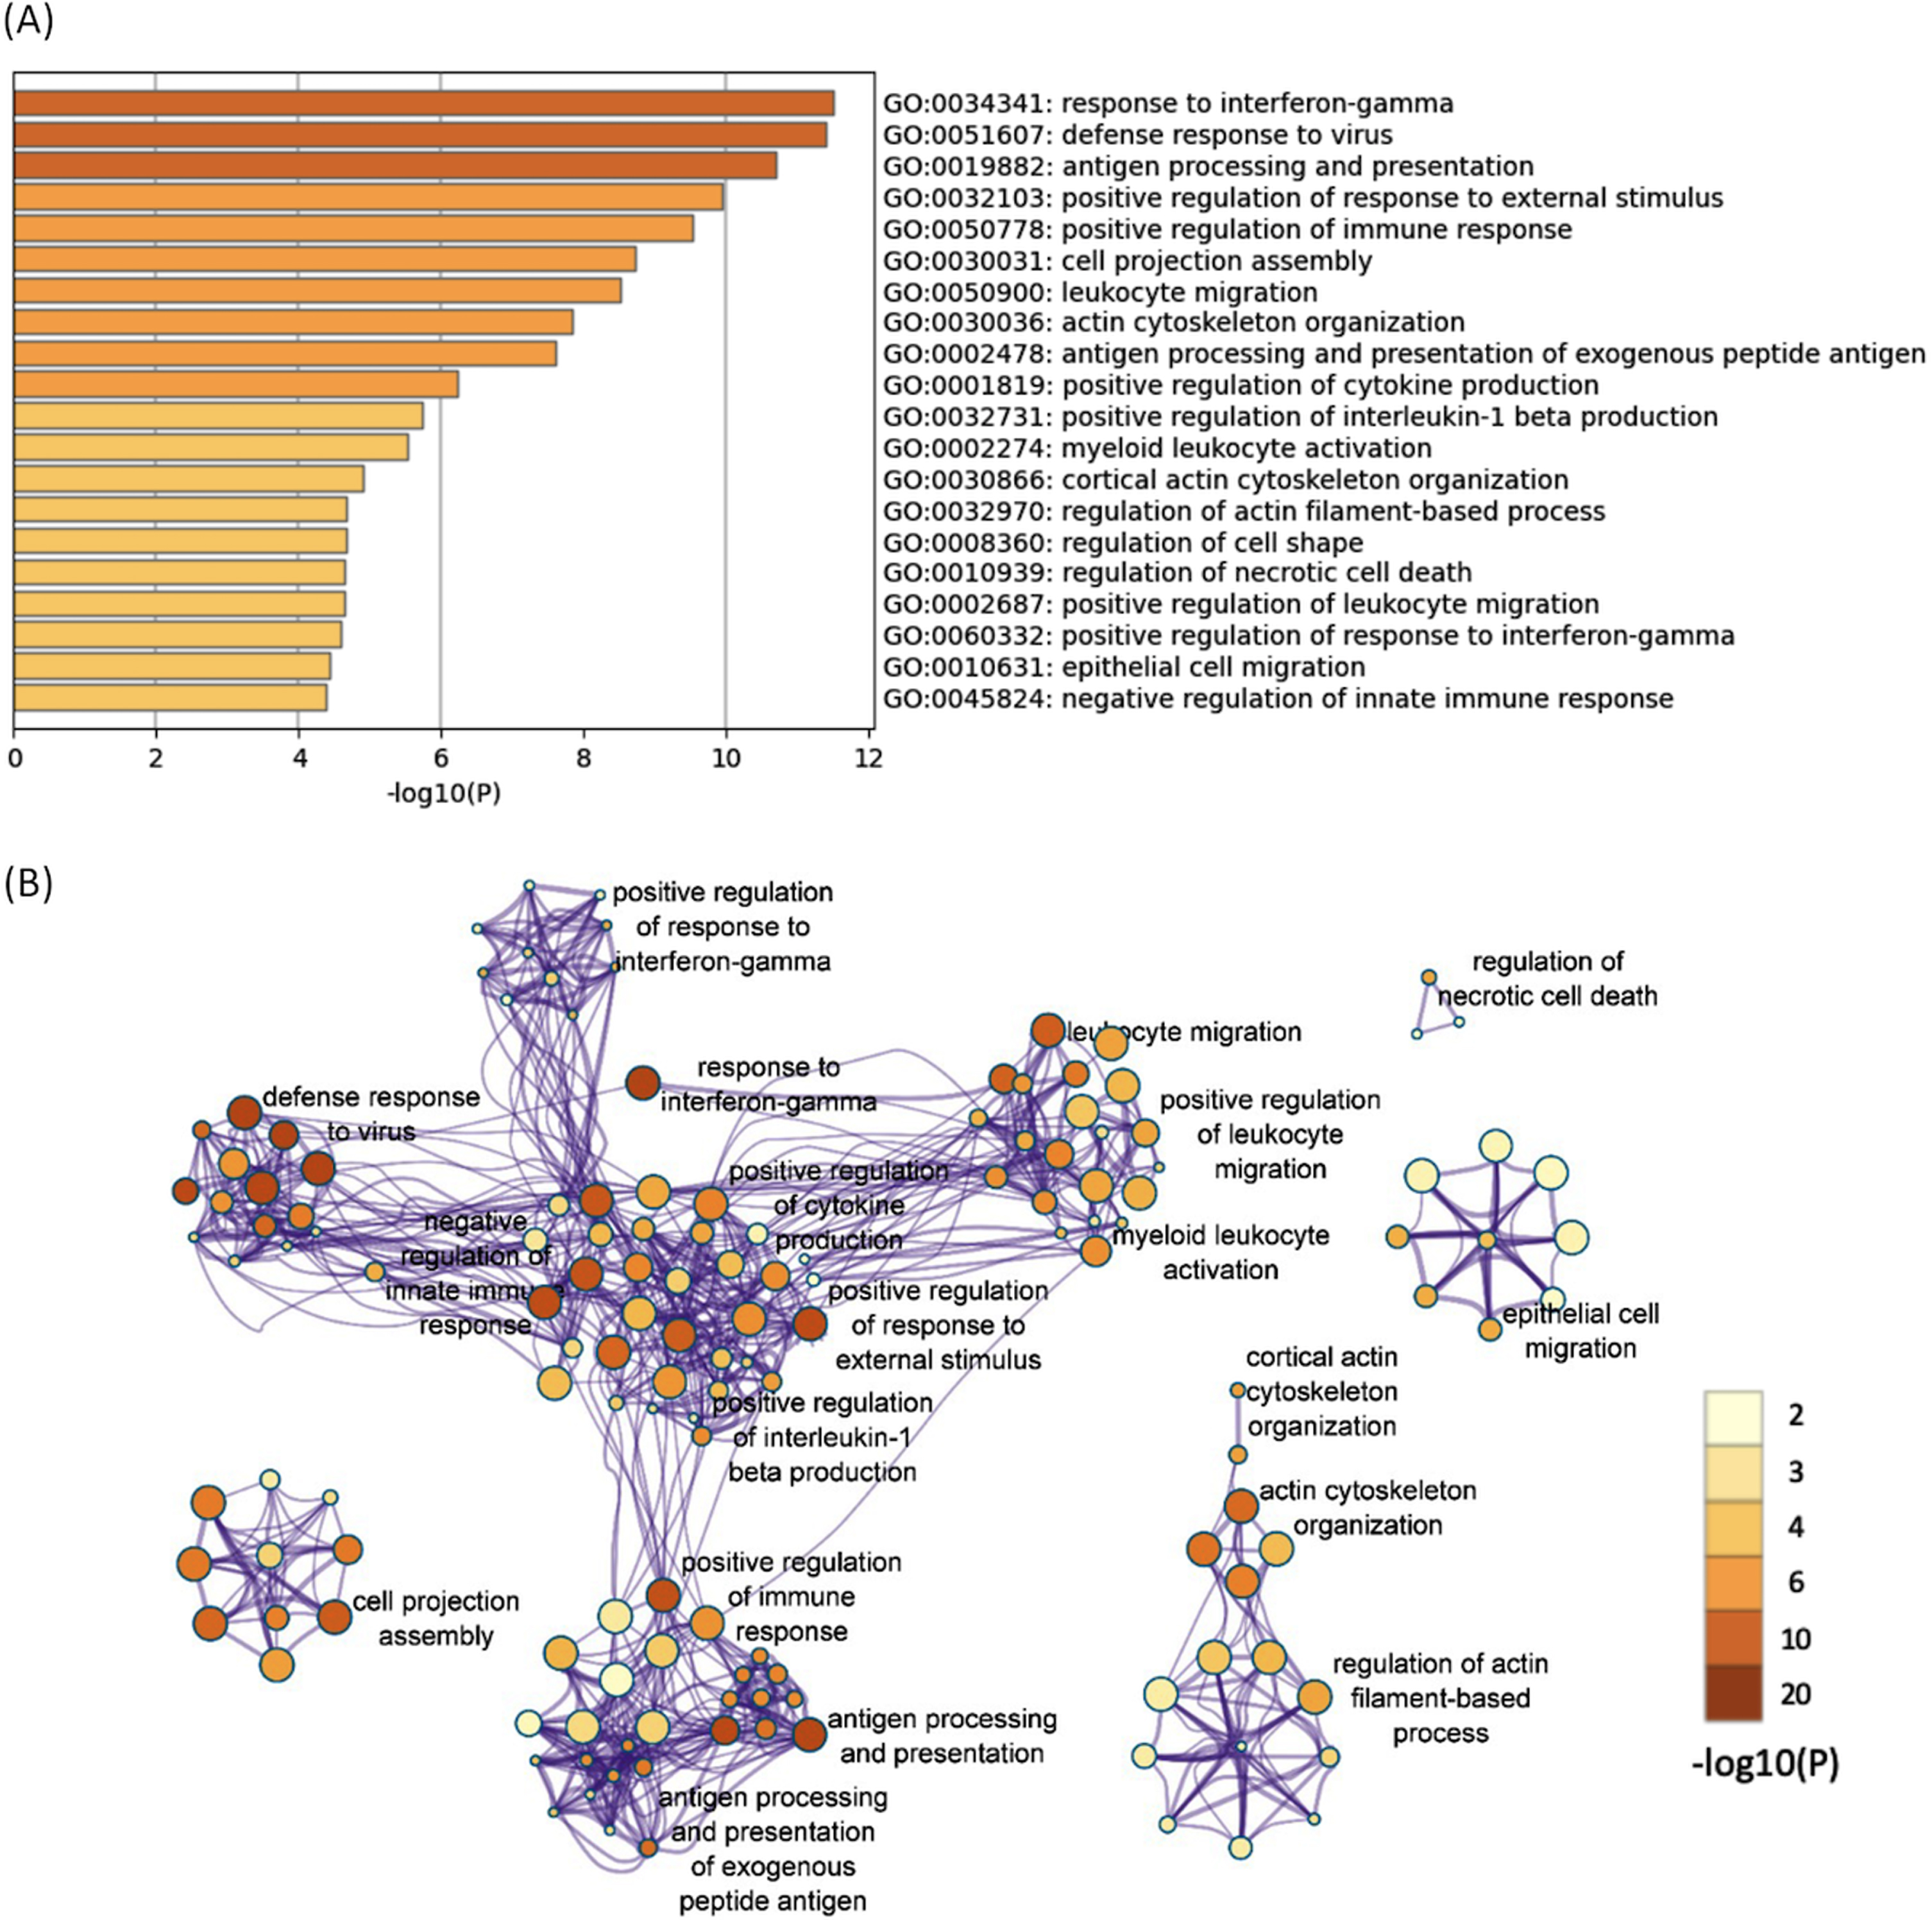
The enriched BP terms of the upregulated DEGs in both the 12- and 52-week-old groups. A) Bar graph of the top 20 enriched BP terms of the upregulated DEGs in both the 12- and 52-week-old groups colored according to the p-value. B) Network plots of the enriched BP terms. Each node represents an enriched term that is colored according to the p-value. Terms with a similarity > 0.3 are connected by edges. Hierarchical clustering of the enriched terms was performed, and only the annotations of the terms with the most significant p-values from each cluster are shown. Only the network plots with more than three enriched terms are displayed. DEGs, differentially expressed genes; BP, biological process.
All 624 downregulated DEGs in both the 12- and 52-week-old groups were also subjected to functional annotation analysis. Among the terms for the 624 downregulated DEGs, 90 BP terms were found as significant terms (Supplementary Table 9). Hierarchical clustering of the enriched terms was performed, and the terms with the lowest p-values from each cluster were chosen as cluster labels. The top 20 cluster labels are shown in Fig. 3A. The network of the 90 significant BP terms is shown in Fig. 3B. Some terms related to membrane potential were found, and they interacted with each other in the network analysis. In addition, some terms related to synapse function (long-term synaptic depression, gamma-aminobutyric acid signaling pathway, etc.) were found, and they interacted with each other. Regulation of sinoatrial node cell action potential was the most significant term (p < 0.001, -log10 p value = 4.8).
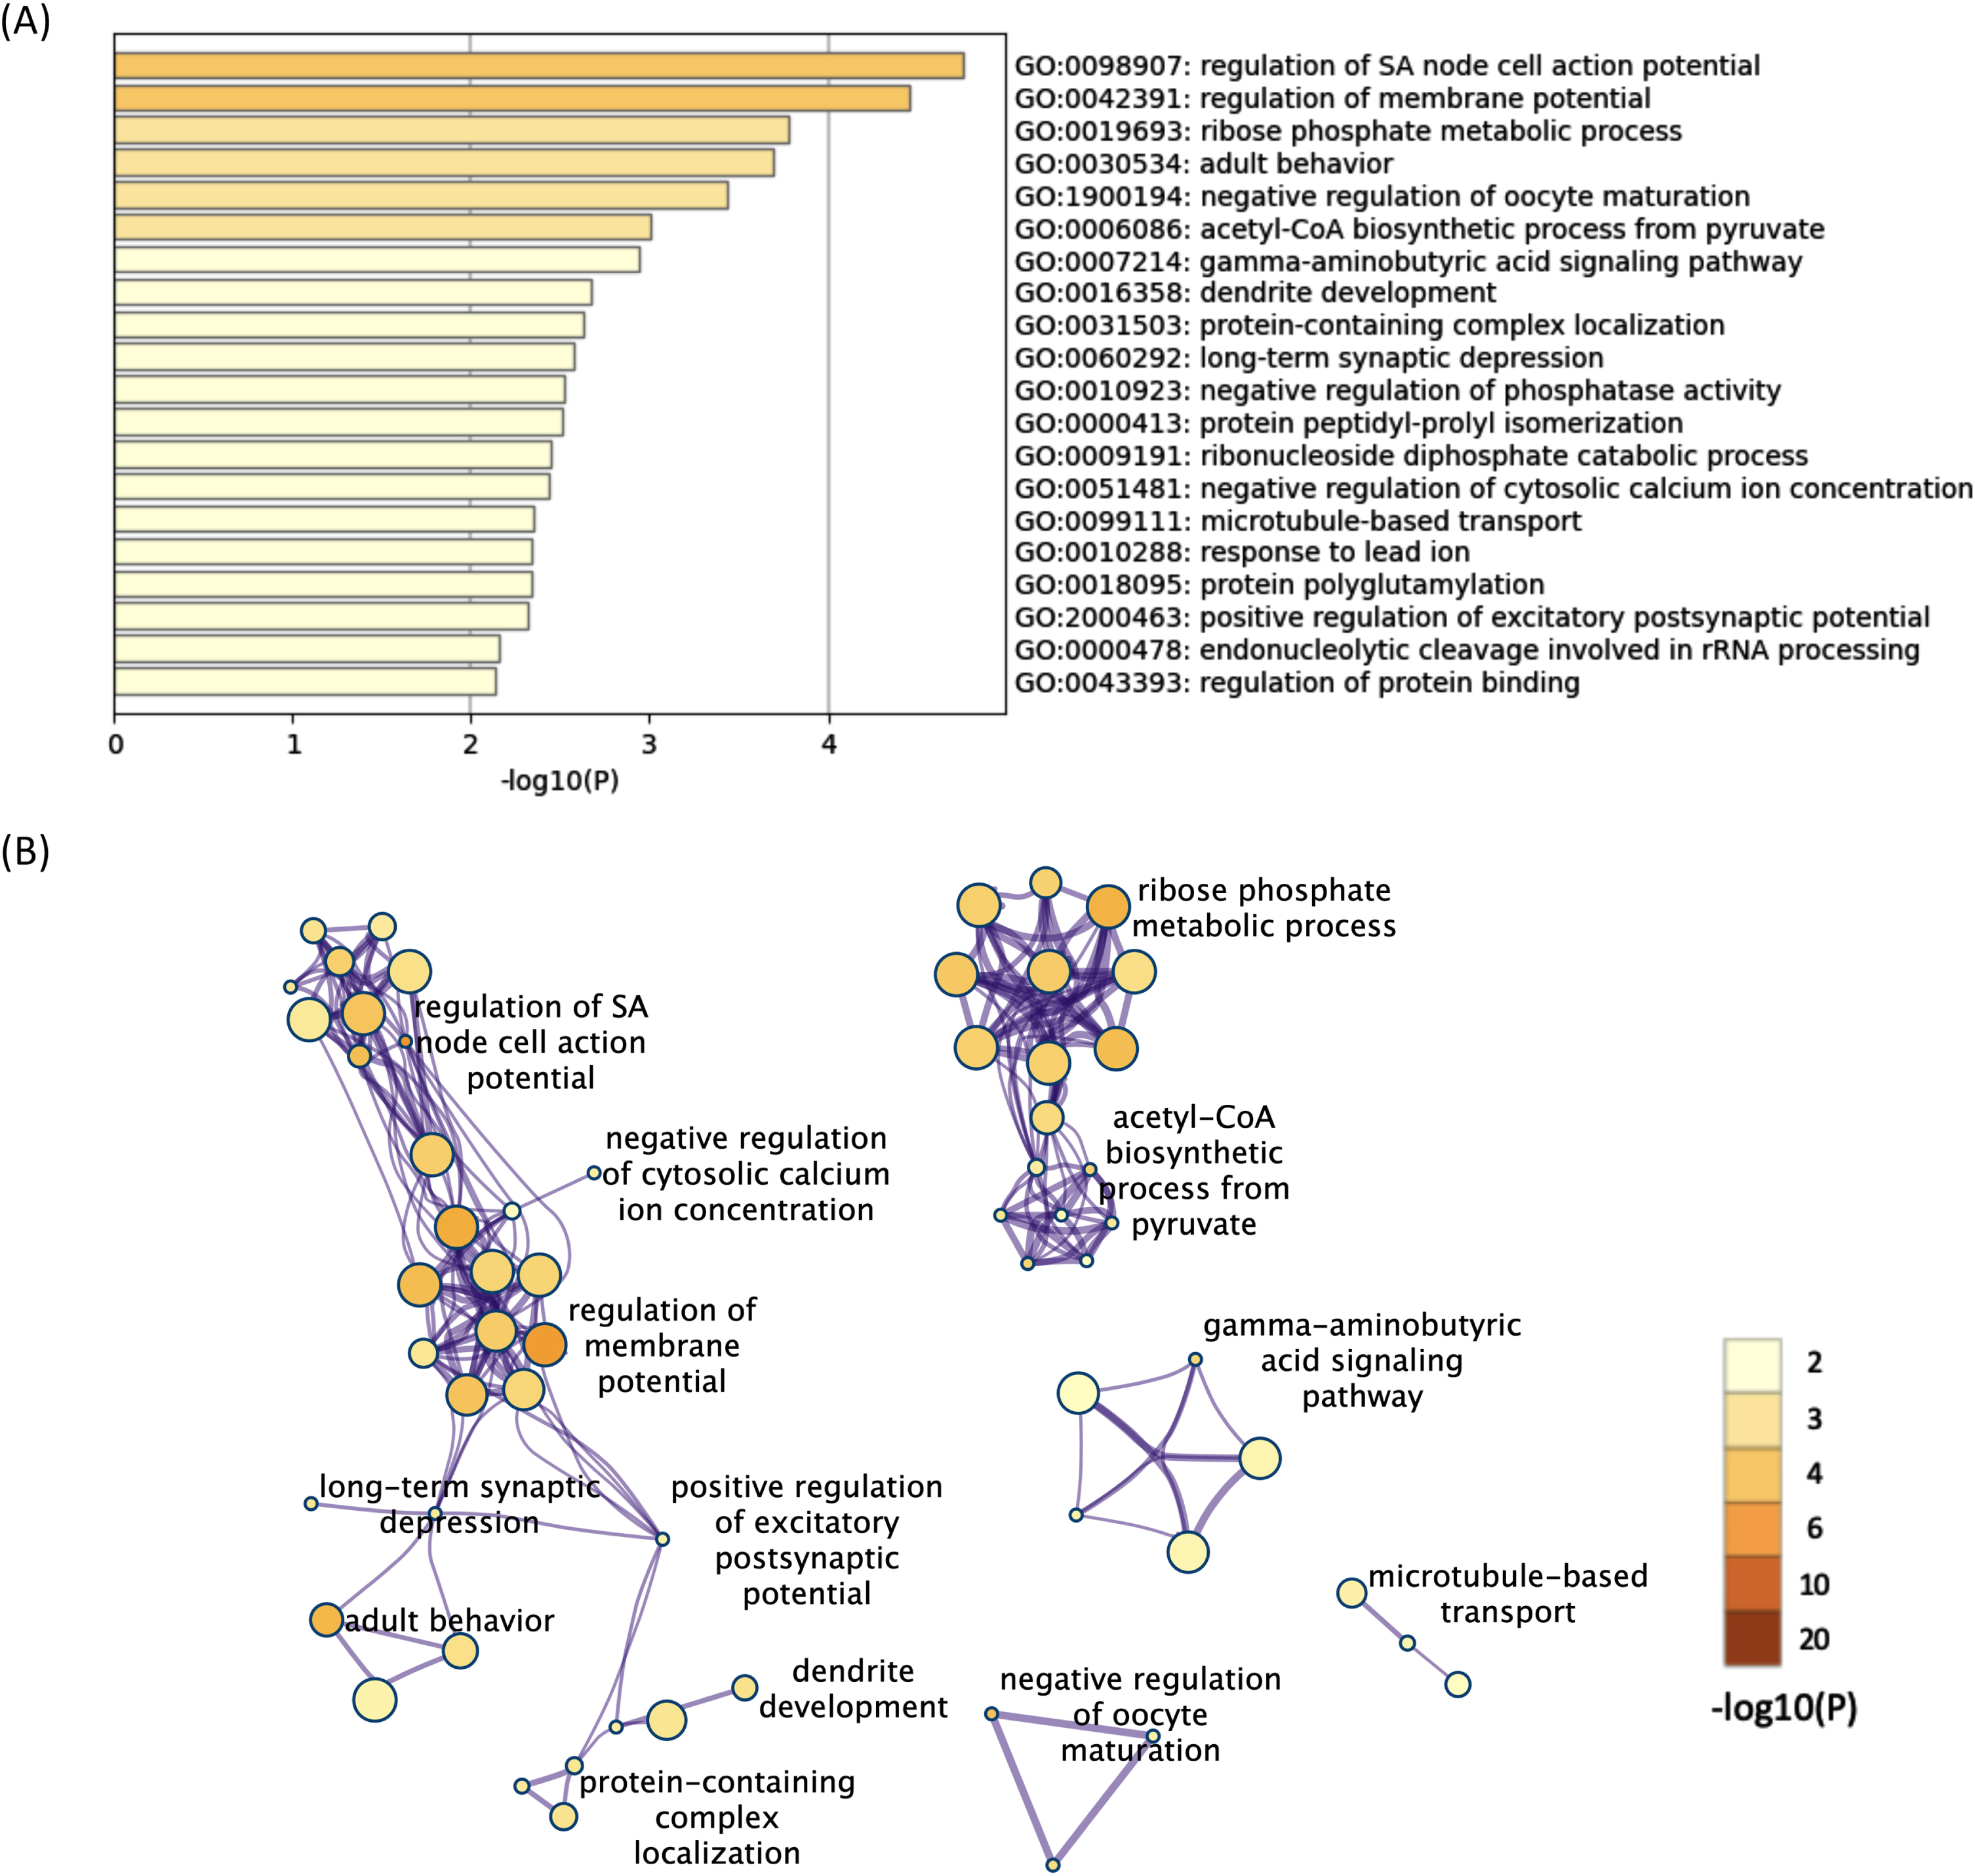
The enriched BP terms of the downregulated DEGs in both the 12- and 52-week-old groups. A) Bar graph of the top 20 enriched BP terms of the downregulated DEGs in both the 12- and 52-week-old groups colored according to the p-value. B) Network plots of the enriched BP terms in both the 12- and 52-week-old groups. Each node represents an enriched term that is colored according to the p-value. Terms with a similarity > 0.3 are connected by edges. Hierarchical clustering of the enriched terms was performed, and only term labels with the most significant p-values from each cluster are shown. Only the network plots with more than three enriched terms are displayed. DEGs, differentially expressed genes; BP, biological process.
qPCR validation for microarray data
The expression levels of mRNA in the hippocampus were compared between the WT and 3xTg mice (n = 8 each at 12, 36, and 52 weeks). For functional annotation of the 624 downregulated genes, we focused on the GABA signaling pathway, because aberrant GABA neurotransmission was previously reported in AD model mice and AD patients [22, 23]. Four genes associated with the GABA signaling pathway (Gabrg3, Gabrr2, Gabbr1, and Gabra1) were chosen from among the significantly downregulated DEGs in all groups. Significant changes were found in Gabrg3 in the 12- (p = 0.02) and 36- (p = 0.005) week-old groups, Gabbr1 in the 52-week-old group (p = 0.001), and Gabrr2 in the 36-week-old group (p = 0.02) (Table 2, Fig. 4). In Gabrr1 in the 52-week-old group, there was a significant difference between the two groups even when the potential outlier was removed (p = 0.001). These qPCR validation results were consistent with the microarray data. On the other hand, no significant changes were observed for Gabrg3 in the 52-week-old group (p = 0.08), Gabbr1 in the 12- (p = 0.12) and 36- (p = 0.09) week-old groups, Gabrr2 in the 12- (p = 0.73) and 52- (p = 0.53) week-old groups, and Gabra1 in the 12- (p = 0.87), 36- (p = 0.11), and 52- (p = 0.31) week-old groups (Table 2, Fig. 4).
The expression levels of GABA-related genes in each group
Values are means±standard deviation. The expression levels of GABA-related genes in each group are shown divided by the average expression level in WT mice at 12-week-old. WT, wild-type; 3xTg, 3xTg-AD model.
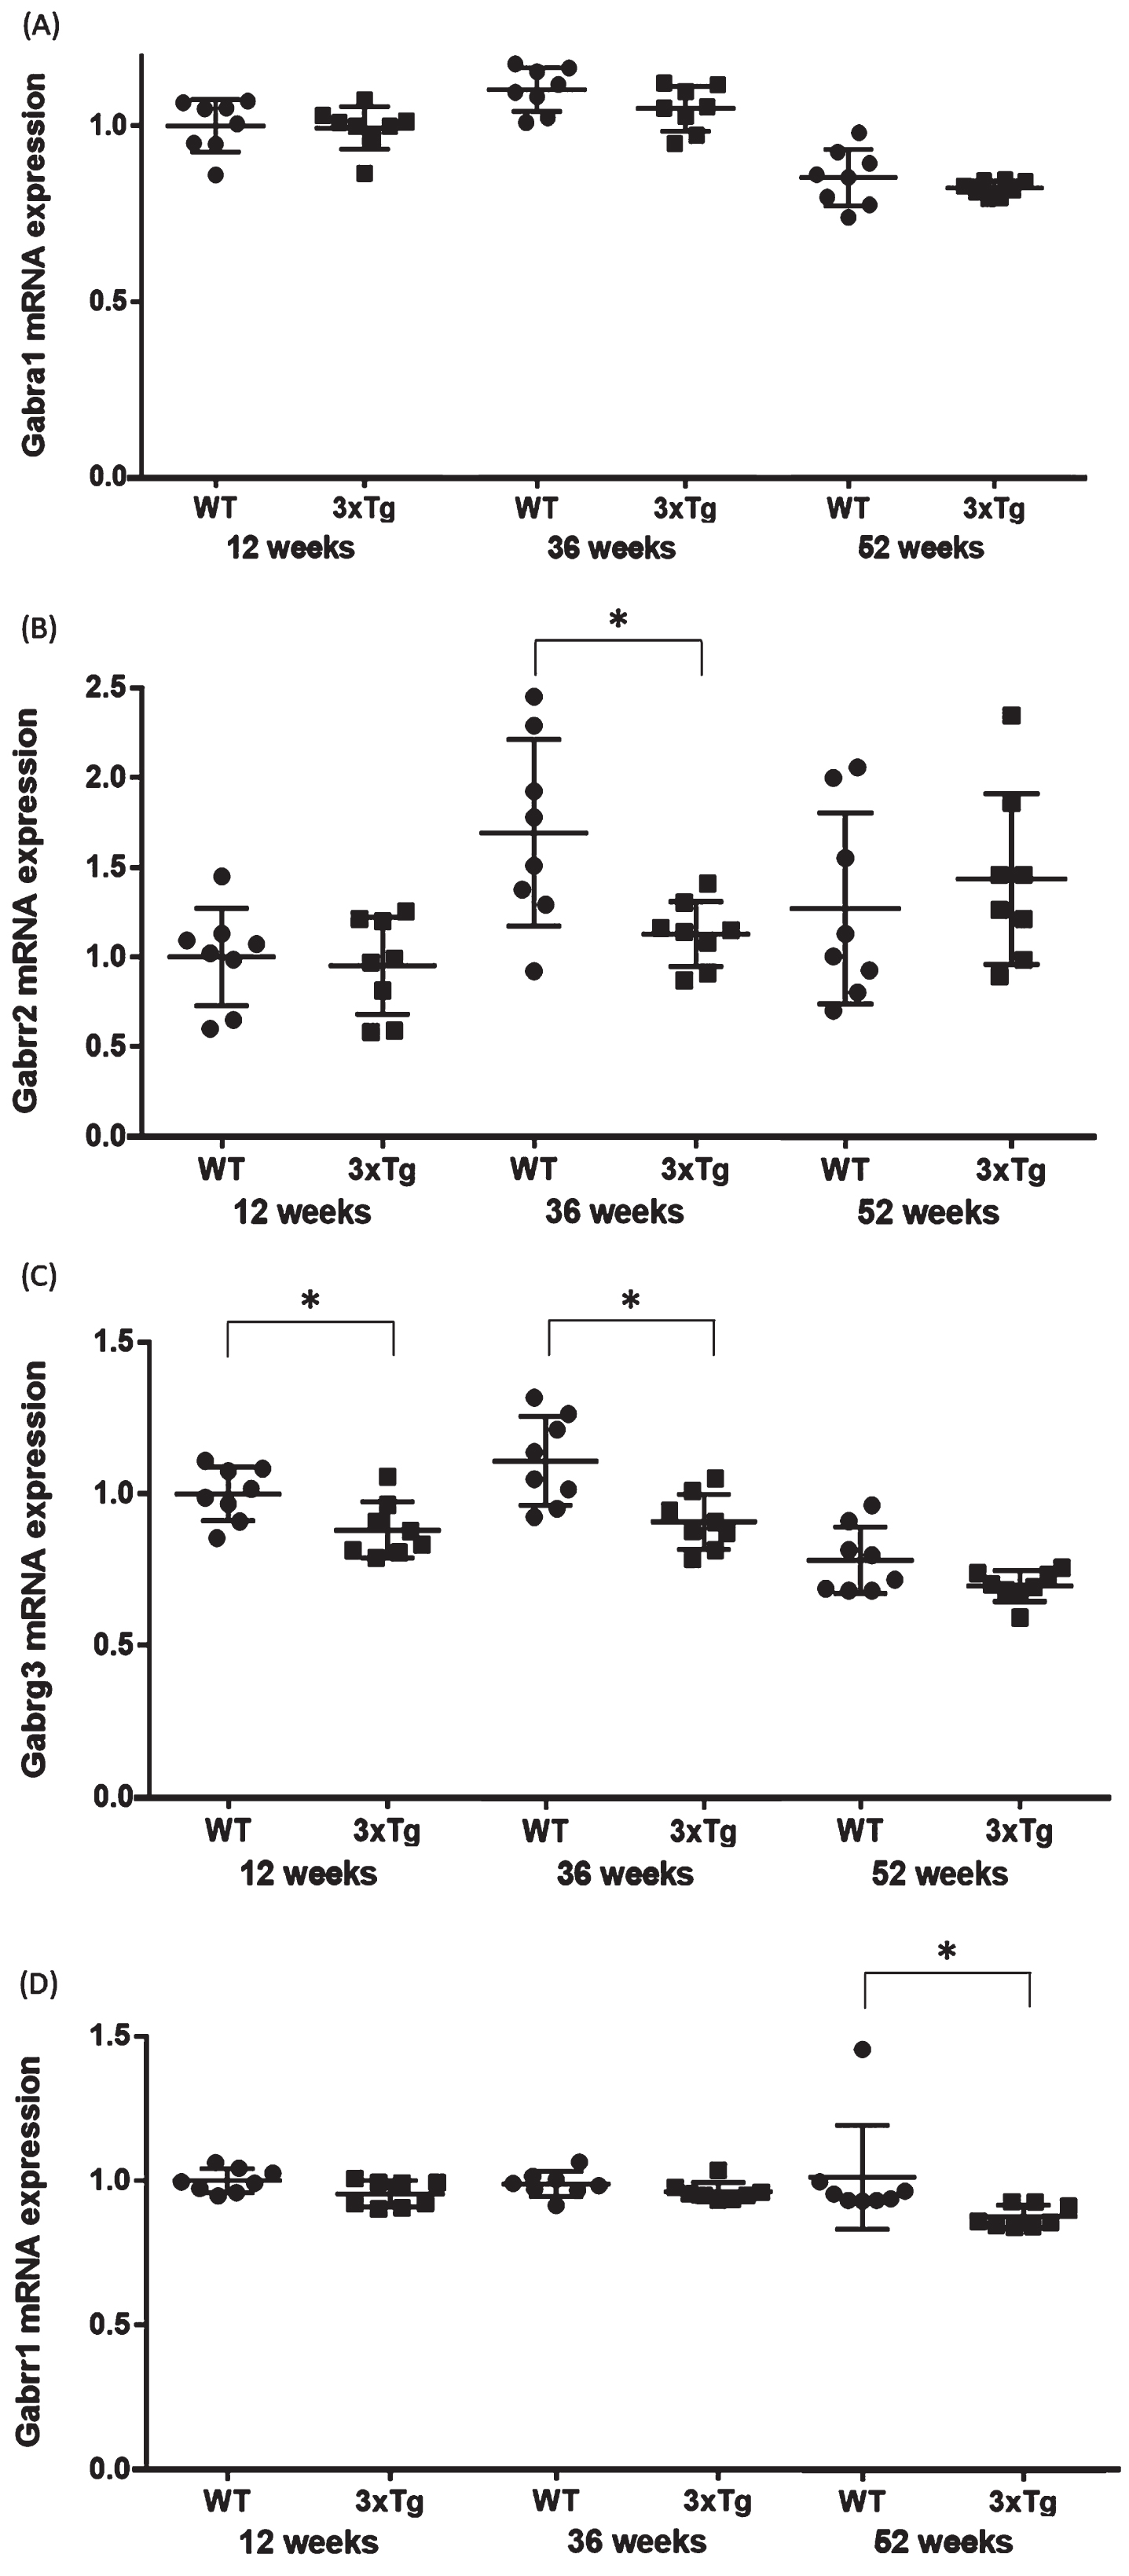
Validation qPCR of the four genes associated with the GABA signaling pathway. Comparison of the (A) Gabra1, (B) Gabrr2, (C) Gabrrg3, and (D) Gabrr1 mRNA expression levels between WT and 3xTg mice. The y axis represents the relative expression level (/WT mice at 12-week-old) from the qPCR results. Student’s t-test or the Mann-Whitney U test were used to compare the average mRNA expression levels between the WT and 3xTg mice. Statistical significance was defined at p = 0.05. The horizontal bars represent the means±standard error. *p < 0.05. WT, wild-type mice; 3xTg, 3xTg-AD model mice.
DISCUSSION
This is the first study to investigate the changes in the gene expression levels from the early stage (12 weeks of age) to the end stage (52 weeks of age) of AD in 3xTg-AD model mice. We previously used the same microarray data to explore blood biomarkers of AD [26]. The methods used in the present study differed from those of the previous study in that transcription variants were removed and the statistical significance level was tightened, allowing us to detect genes with higher certainty. We found 644 upregulated and 624 downregulated genes that showed changes in the expression levels over time. We then focused on GABA-related genes from the functional annotation results of the 624 downregulated genes and found from the qPCR validation tests that the expression levels of several GABA-related genes were significantly decreased.
In the functional and network analyses of the upregulated DEGs, several terms related to immune response were found. Several studies have previously reported neuroinflammation in the AD brain [31, 32]. Microglia are involved in neuroinflammation in the AD brain by releasing inflammatory mediators [33]. As soon as Aβ plaques form in the brain, microglia establish intimate contact with the plaques and become reactive [34, 35]. A vicious cycle of inflammation is thus formed between Aβ accumulation, activated microglia, and microglial inflammatory mediators, further enhancing Aβ deposition and neuroinflammation [33]. Previous studies have suggested that the use of non-steroidal anti-inflammatory drugs (NSAIDs) may protect against AD [36]. The results of the present study suggest that abnormal neuroimmune responses may occur even at the early stage of AD.
The downregulated DEGs were found to be related to membrane potential and synapse function, including the GABA signaling pathway. GABAergic inhibitory neurotransmission plays a central role in regulating, synchronizing, and preventing excessive neuronal signaling in the hippocampus [37, 38], which is important for episodic memory [39–41]. In both AD patients and mice, abnormal Aβ production and aggregation decrease the number and activity of GABAergic inhibitory interneurons [42–45]. In several postmortem studies, reduced GABA levels have been found in the brain of AD patients [46–49]. Several studies have reported a decreased concentration or expression level of GABAA receptor subunits in the hippocampus of AD patients [50–52]. Furthermore, hippocampal neural hyperactivity due to the loss of GABAergic interneurons has been confirmed in AD model mice and AD patients [53–56], and may predict atrophy and reduced episodic memory in individuals at risk for AD [57]. In addition, some studies have reported that seizures in AD patients may be a product of neural hyperactivity due to GABAergic signaling dysfunction [58]. Furthermore, levetiracetam, an antiepileptic drug that enhances GABA function and inhibits hippocampal hyperexcitability [59], has been reported to improve cognitive function in AD-model mice [60, 61], AD patients [62], and mild cognitive impairment patients [63, 64]. Based on several lines of evidence, GABAergic signaling dysfunction might play an important role in the pathogenesis of AD. In the present study, the downregulated expression of Gabrg3, which encodes the GABAA receptor γ subunit, was confirmed in 12-week-old 3xTg mice. The early abnormalities in the GABA neurotransmitters observed in this study may be involved in the progression of the AD pathology. In qPCR results at 52 weeks, the expression levels of most GABA-related genes did not differ significantly between the 3xTg model mice and the WT mice. This suggests that the expression of GABA-related genes may be associated with the effects of aging even in WT mice.
In the brain of 3xTg mice at 12 weeks of age, only intracellular accumulation of soluble Aβ is detected as a major histopathological change [10]. Our present study results indicated that irreversible changes may occur in the brain of 3xTg mice at the early stage of AD when only intracellular accumulation of soluble Aβ is observed. This suggests the need for therapeutics targeting soluble Aβ at the early stage of AD. Currently, various antibody drugs against Aβ are being developed. Aducanumab, which targets insoluble Aβ [65], has failed in clinical trials [15]. In contrast, clinical trials of lecanemab targeting soluble Aβ [65] have achieved success [66]. The results of our present study support the validity of lecanemab.
The present study has several limitations. First, the sample size was small in the microarray analysis, and a type II error may thus be present. Second, there was no replication cohort of 3xTg mice, because no samples remained. Forth, we have no neuropathological data in this study. Therefore, the age at which amyloid and tau pathologies first appear is predicted from preceding studies. Finally, the expression level of each gene was evaluated only from the mRNA expression; the protein levels should be analyzed in future studies.
Conclusions
Our results indicate that changes in the expression levels of genes related to immune responses and GABAergic neurotransmission may occur in the brain of 3xTg mice from the early stage of AD. This suggests the need for therapeutic intervention as early as possible in AD.
Footnotes
ACKNOWLEDGMENTS
We would like to thank Ms. Chiemi Onishi for technical assistance.
FUNDING
This study was supported by a Health and Labour Science Research Grant from the Japanese Ministry of Health, Labour and Welfare, and a Grant-in-Aid for Scientific Research from the Japanese Ministry of Education, Culture, Sports, Science and Technology (JSPS KAKENHI Grant Numbers 20K07971, 22K07597, 22K07562, 22K15765, and 22K15752). This study was supported by the Division of Laboratory Animal Research and the Division of Analytical Bio-Medicine at the Advanced Research Support Center (ADRES), Ehime University.
CONFLICT OF INTEREST
The authors declare that they have no conflict of interest. Jun-ichi Iga is an Editorial Board Member of this journal, but was not involved in the peer-review process, nor had access to any information regarding its peer-review.
DATA AVAILABILITY
All microarray data have been deposited into the GEO database (accession number GSE144459).