
Abstract
Background:
Familial Alzheimer’s disease (FAD) is caused by mutations in one or more of 3 genes known as AβPP, PSEN1, and PSEN2. There are currently no effective therapies for FAD. Hence, novel therapeutics are needed.
Objective:
To analyze the effect of treatment with a combination of epigallocatechin-3-gallate (EGCG) and Melatonin (N-acetyl-5-methoxytryptamine, aMT) in a cerebral spheroid (CS) 3D in vitro model of PSEN 1 E280A FAD.
Methods:
We developed a CS in vitro model based on menstrual stromal cells derived from wild-type (WT) and mutant PSEN1 E280A menstrual blood cultured in Fast-N-Spheres V2 medium.
Results:
Beta-tubulin III, choline acetyltransferase, and GFAP in both WT and mutant CSs spontaneously expressed neuronal and astroglia markers when grown in Fast-N-Spheres V2 medium for 4 or 11 days. Mutant PSEN1 CSs had significantly increased levels of intracellular AβPP fragment peptides and concomitant appearance of oxidized DJ-1 as early as 4 days, and phosphorylated tau, decreased ΔΨm, and increased caspase-3 activity were observed on Day 11. Moreover, mutant CSs were unresponsive to acetylcholine. Treatment with a combination of EGCG and aMT decreased the levels of all typical pathological markers of FAD more efficiently than did EGCG or aMT alone, but aMT failed to restore Ca2+ influx in mutant CSs and decreased the beneficial effect of EGCG on Ca2+ influx in mutant CSs.
Conclusion:
Treatment with a combination of EGCG and aMT can be of high therapeutic value due to the high antioxidant capacity and anti-amyloidogenic effect of both compounds.
Keywords
INTRODUCTION
Familial Alzheimer’s disease (FAD) is caused by mutations in one or more of at least three genes known as amyloid-β protein precursor (AβPP), presenilin 1 (PSEN1), and presenilin 2 (PSEN2) (https://www.alzforum.org/mutations). AβPP, a transmembrane protein, is cleaved to form amyloidogenic Aβ peptides (mostly Aβ42), and presenilin, a subunit of γ-secretase, is the aspartyl protease responsible for Aβ42 generation [1]. To date, 350 different PSEN1 mutations have been reported to cause FAD (https://www.alzforum.org/mutations/psen-1). A missense mutation at position 73664808 on chromosome 14, A>C (codon change: GAA to GCA, exon 8), results in a change in PSEN1 Glu280Ala (p. E280A) [2]. This mutation has been shown to cause familial early onset Alzheimer’s disease (EOAD) in a large family in Colombia [3]. The PSEN1 E280A mutation results in the production of extracellular plaques consisting of Aβ42 [4, 5], loss of hippocampal neurons [6], and accumulation and hyperphosphorylation of tau protein (p-tau) [7, 8] and also induces cerebellar Aβ plaque deposition [9]. Of note, the “paisa” E280A mutation provokes accumulation of Aβ plaque in cognitively unaffected carriers of the PSEN1 E280A mutation ten years before autosomal dominant FAD is clinically detectable [10]. Unfortunately, although clinical trials of investigational disease-modifying drugs that target Aβ have been conducted (ClinicalTrials.gov, NCT01998841) [11], no effective therapies against FAD have become available. Hence, innovative therapeutic approaches are currently needed.
Mesenchymal stromal cells (MSCs) are multipotent cells that have the potential to differentiate into mesodermal, endodermal, or ectodermal cell lineages [12, 13]. Therefore, MSCs are not only important for modeling FAD [14] but are also useful in the assessment of potential therapeutic methodologies (e.g., [15]). Given that MSCs can be obtained from menstrual blood (MensB) without bioethical constraints and/or increasing the likelihood of tumor formation [16], these cells have surfaced as a source for 3D in vitro modeling [17, 18] and a potential source for AD treatment [19]. Accordingly, we used menstrual stromal cells (MenSCs) from MensB to obtain cerebral spheroids (CSs), i.e., free-floating spherical conglomerates, within 4 days [20] by growth of the cells in Fast-N-Spheres medium [21]. However, there is no further information at present regarding whether MenSCs that carry the PSEN1 E280A mutation can generate CSs or regarding whether they are able to reproduce the classical neuropathological features of FAD, i.e., accumulation of intracellular AβPP fragments (iAβPPf), oxidative stress (OS), and tau phosphorylation (p-tau), as has been demonstrated in a 2D in vitro model [22].
We recently showed that epigallocatechin-3-gallate (EGCG) represses the accumulation of iAPPβf, blocks tau phosphorylation, enhances mitochondrial membrane potential (ΔΨm), decreases oxidation of the stress sensor protein DJ-1 (oxDJ-1), and inhibits the expression of cell death markers (e.g., c-JUN, TP53, PUMA, and CASP3) in PSEN1 E280A cholinergic-like neurons (ChLNs) compared to wild-type (WT) cells in 2D in vitro. Although EGCG did not significantly reduce extracellular (e)Aβ42 (although it decreased aggregation of eAβ42), it significantly inhibited Ca2+ influx impairment in response to acetylcholine (ACh) in PSEN1 E280A ChLNs [23]. Melatonin (N-acetyl-5-methoxytryptamine, aMT), a hormone that possesses antioxidant activity [24], has been found to alleviate OS [25], Aβ accumulation [26, 27], tau pathology [28], and decreased mitochondrial dysfunction [29] by acting as a neuroprotectant [30]. However, it is unknown whether aMT protects PSEN1 E280A CSs from endogenously generated iAPPβf, tau phosphorylation, OS, apoptosis, or Ca2+ influx dysfunctionality. We hypothesize that single or combined treatment with EGCG and confers neuroprotection against Aβ-induced pathology in a 3D in vitro model of FAD.
Here, we wanted to examine whether PSEN1 E280A MenSCs differentiate into CSs when cultured in Fast-N-Spheres V2 medium, a novel medium that was originally developed and named in our laboratory, and to determine whether treatment with EGCG and/or aMT alone or in combination decreases the levels of pathological markers in PSEN1 E280A CSs. Similar to 2D cultured cells, mutant MenSCs can be converted into PSEN1 E280A CSs by growth in Fast-N-Spheres V2 medium for 4 or 11 days. The PSEN1 E280A CSs, but not WT PSEN1 CSs, showed signs of increased accumulation of iAβPPf (detected using antibody E610) and increased phosphorylation of tau at Ser202/Thr205 (detected using antibody AT8). Mutant CSs, but not WT CSs, molecularly mimic FAD. PSEN1 E280A CSs displayed signs of OS as early as 4 days, as demonstrated by the appearance of DJ-1Cys106-SO3 and of apoptotic markers such as caspase 3 (CASP3), and concomitant loss of ΔΨm; however, CSs contained p-tau at Day 11. Mutant CSs also showed Ca2+ flux dysregulation compared to control (WT) CSs. Interestingly, exposure of the cells to EGCG and aMT alone or in combination decreased OS and the expression of apoptotic markers, increased ΔΨm, and blocked p-tau in PSEN1 E280A CSs. However, EGCG was much more efficient at reversing Ca2+ influx dysregulation in PSEN1 E280A CSs than was aMT alone or the combination of EGCG/aMT. Our findings demonstrate that EGCG is by far the most efficient neuroprotective agent against endogenously generated pathological iAβPPf, OS, and p-tau in PSEN1-derived CSs. Combined treatment with EGCG and aMT can be of high therapeutic value in alleviating endogenously generated oxidative stress elicited by iAβPPf in mutant neurons.
MATERIALS AND METHODS
Isolation and characterization of MenSCs derived from human MensB
The MensB samples were collected from one healthy female and one female carrier of the mutation PSEN1 E280A aged 30 years (Tissue Bank Code, TBC # 69308) and 25 years (TBC # 04335), respectively. Donors signed an informed consent accepted by the Ethics Committee of the Sede de Investigación Universitaria -SIU-, University of Antioquia, Medellín, Colombia. The specimens (MensB) were collected, purified, and maintained as previously described in [20]. The isolated MenSCs were used for the generation of cerebral spheroids [20].
Ethical Approval Menstrual specimen donors provided a signed informed consent approved by the ethics committee of the Sede de Investigación Universitaria (SIU), University of Antioquia, Medellín, Colombia (Act 2020-10854).
Generation of cerebral spheroids derived from MensB-MenSCs and induced to cholinergic-like neuronal cell lineage
CSs were obtained by differentiation of WT or PSEN1 E280A MenSCs as previously described in [20]. Briefly, WT and mutant MenSCs were cultured in a brand-new medium called Fast-N-Spheres V2 composed of serum-free culture medium containing reagents as described in [20] plus Matrigel® and 1% fetal bovine serum. Cultures were constantly shacked for 4 and 11 days. The MenSCs-derived CSs were examined for the expression of neuronal and astrocyte markers according to [20].
Immunofluorescence and fluorescence microscopy analysis
The WT or PSEN1 E280A CSs cultured with Fast-N-Spheres V2 medium for 4 and 11 days without or with EGCG (25μM) and/or melatonin (50μM) were stained with primary antibodies against the glial fibrillary acidic protein (GFAP, cat. no. sc6170, Santa Cruz), β-tubulin III (β-TUB III cat. no. G712A, Promega), choline acetyltransferase (ChAT, cat. no. AB144P, Millipore) primary antibodies (1:500); primary antibodies against APP751 and/or protein amyloid β1–42 (1:500; clone 6E10 cat# 803014, Biolegend), oxidized DJ-1 (1:500; ox(Cys106)DJ-1; spanning residue Cys106 of human PARK7/DJ1; oxidized to produce cysteine sulfonic (SO3) acid; cat # ab169520, Abcam), and total tau (1:500; t-Tau; cat# T6402, Sigma), and phospho-tau (p-tau, 1:500, Ser202/Thr205, cat# MN1020 (AT8), Thermo Fisher Scientific) antibodies. Incubation with secondary fluorescent antibodies and nuclei staining were performed according to [20]. Fluorescent Thioflavin-T derivative BTA-1 staining was performed by incubating CSs slides with a BTA-1 (Sigma) solution (500 nM) for 30 min. Nuclei were identified by incubating CSs with propidium iodide (1μM). Postmortem temporal cortical slices from an Alzheimer’s disease patient (case #3396) and a healthy individual (case #3648) were used as a positive and negative control, respectively [31]. Imaging processing data was performed according to an online guidance program (https://imagej.nih.gov/ij/).
Live fluorescence analysis
The WT or PSEN1 E280A CSs cultured with Fast-N-Spheres V2 medium for 11 days without or with EGCG (25μM) and/or melatonin (50μM) were incubated with (20 nM) MitoTrackertrademark Red FM (cat. no. M22425, Invitrogen) and 1X Vybrant TM FLICA (Thermo Fisher Scientific, cat: V35118) according to [20]. Fluorescence microscopy photographs were taken using a Zeiss Axiostart 50 Fluorescence Microscope equipped with a Zeiss AxioCam Cm1 (Zeiss Wöhlk-Contact-Linsfluoreen, Gmb Schcönkirchen, Germany), and imaging processing data was performed according to an online guidance program (http://imagej.nih.gov/ij/).
Flow cytometry analysis
Flow cytometry analysis was performed according to [32] with minor modifications. Briefly, the WT or PSEN1 E280A CSs cultured with Fast-N-Spheres V2 medium for 11 days without or with EGCG (25μM) and/or melatonin (50μM) were detached with Accutase Cell Detachment Solution (Beckton Dickinson) and washed in PBS. Cells (10×105) were resuspended in PBS and fixated with cold ethanol overnight and used for further flow cytometry analysis. Cell markers were analyzed by incubating cells with primary antibodies against caspase-3 (1:250; cat # AB3623, Millipore), APP751 and/or protein amyloid-β1-42 (1:500; clone 6E10 cat# 803014, Biolegend), oxidized DJ-1 (1:500; ox(Cys106)DJ-1; spanning residue Cys106 of human PARK7/DJ1; oxidized to produce cysteine sulfonic (SO3) acid; cat # ab169520, Abcam), and total tau (1:500; t-Tau; cat# T6402, Sigma), and phospho-tau (p-tau, 1:500, Ser202/Thr205, cat# MN1020 (AT8), Thermo Fisher Scientific) antibodies, followed incubation with secondary fluorescent antibodies according to [23]. Resuspended cells were analyzed using BD LSR Fortessa II flow cytometer (BD Biosciences). Ten thousand events were acquired, and the acquisition analysis was performed using FlowJo 7.6.2 Data Analysis Software.
Cytochemical detection of DNA fragmentation
DNA fragmentation was determined in fixed untreated or treated CSs to polylysine coated slides by the terminal deoxynucleotidyl transferase dUTP nick end labeling (TUNEL) technique according to the manufacturer’s protocol (Promega catalog #G7130). Briefly, CSs samples were treated for 10 min with 25μg/ml protease K and fixed in 4% methanol in PBS for 5 min. CSs slides were pre-incubated with equilibration buffer (EB) (50μl, 200 mM potassium cacodylate, pH 6.5; 25 mM Tris-HCl pH 6.6; 0.2 mM DTT; 0.25 mg/ml BSA; 2.5 mM cobalt chloride) for 15 min. Then, slides were incubated at 37°C for 60 min with 25μl TdT incubation buffer (23μl EB; 2μl nucleotide mix; 0.5μl TdT enzyme). After the appropriate incubation time, tailing reaction was terminated by immersing the slides in 2X SSC for 15 min and rinsing twice with PBS. Then after, slides were incubated with streptavidin HRP (diluted 1:500 in PBS) for 30 min at room temperature. Finally, slides were incubated with DAB solution (prepared immediately prior to use by adding 100μl DAB 10X Chromogen to 900μl DAB Substrate 1X Buffer). Slides were stained with safranine for 10 s at room temperature and washed twice in deionized water. Immediately, slides were coverslipped using aqueous mounting media.
Oxygen radical absorbance capacity (ORAC) assay
The hydrophilic ORAC assay was performed as described in [33]. The AAPH (2,2’-Azobis(2-amidinopropane) dihydrochloride) was used as a peroxyl radical generator, Trolox was used as a standard, and fluorescein was used as the fluorescent probe. Briefly, fluorescein, AAPH, and the samples were prepared in a phosphate buffer (75 mM, pH 7.4). First, 25μL of sample solution or Trolox standard was mixed with 150μL of fluorescein (1 mM) and pre-incubated at 37°C for 30 min before the addition of 25μL of AAPH solution (200 mM). The fluorescence at an excitation wavelength of 485 nm and an emission wavelength of 520 nm was measured every 2 min for 120 min using a Synergy HT Multi-Mode Microplate Reader (BioTek Instruments, Inc.; Winooski, USA). The relative ORAC values were calculated using the differences of areas under the decay curves and were expressed as μmol Trolox equivalents (TE)/g of solution.
Intracellular calcium imaging
The cytoplasmic Ca2+ concentration ([Ca2+]i) was measured according to Pap et al. [34]. Fluorescence microscopy photographs were taken using a Zeiss Axiostart 50 Fluorescence Microscope equipped with a Zeiss AxioCam Cm1 (Zeiss Wöhlk-Contact-Linsfluoreen, Gmb Schcönkirchen, Germany), and imaging processing data was performed according to online guidance program (http://imagej.nih.gov/ij/) [35].
Data analysis
This experimental design was performed as previously reported in [20] and based on the statistics considerations described in [36]. Provided that the experimental unit (i.e., the well) data fulfill the independence of observations, the dependent variable is normally distributed in each treatment group (Shapiro-Wilk test), and variances are homogeneous (Levene’s test), the statistical significance was determined by Student’s t-test, one-way, or two-way ANOVA followed by Bonferroni’s or Tukey’s post hoc comparison calculated with GraphPad Prism 5.0 software. Differences between groups were only deemed significant when a p-value of <0.05 (*), <0.001 (**), and <0.001 (***). All data are illustrated as the mean±S.D.
RESULTS
PSEN1 E280A CSs spontaneously express cholinergic and astrocytic markers
Previous work has shown that WT CSs derived from MensB spontaneously express neuronal markers such as β-TUB III and ChAT, as well as the astrocyte marker GFAP, when cultured in Fast-N-Spheres medium for 3 days [20]. Likewise, WT and PSEN1 E280A CSs showed similar expression of neuronal (β-TUB III, Fig. 1A–D), cholinergic (ChAT, Fig. 1E–H), and astrocytic (GFAP, Fig. 1I–L) lineage cell markers when grown in Fast-N-Spheres V2 medium for 4 (Fig. 1M) or 11 days (Fig. 1N).
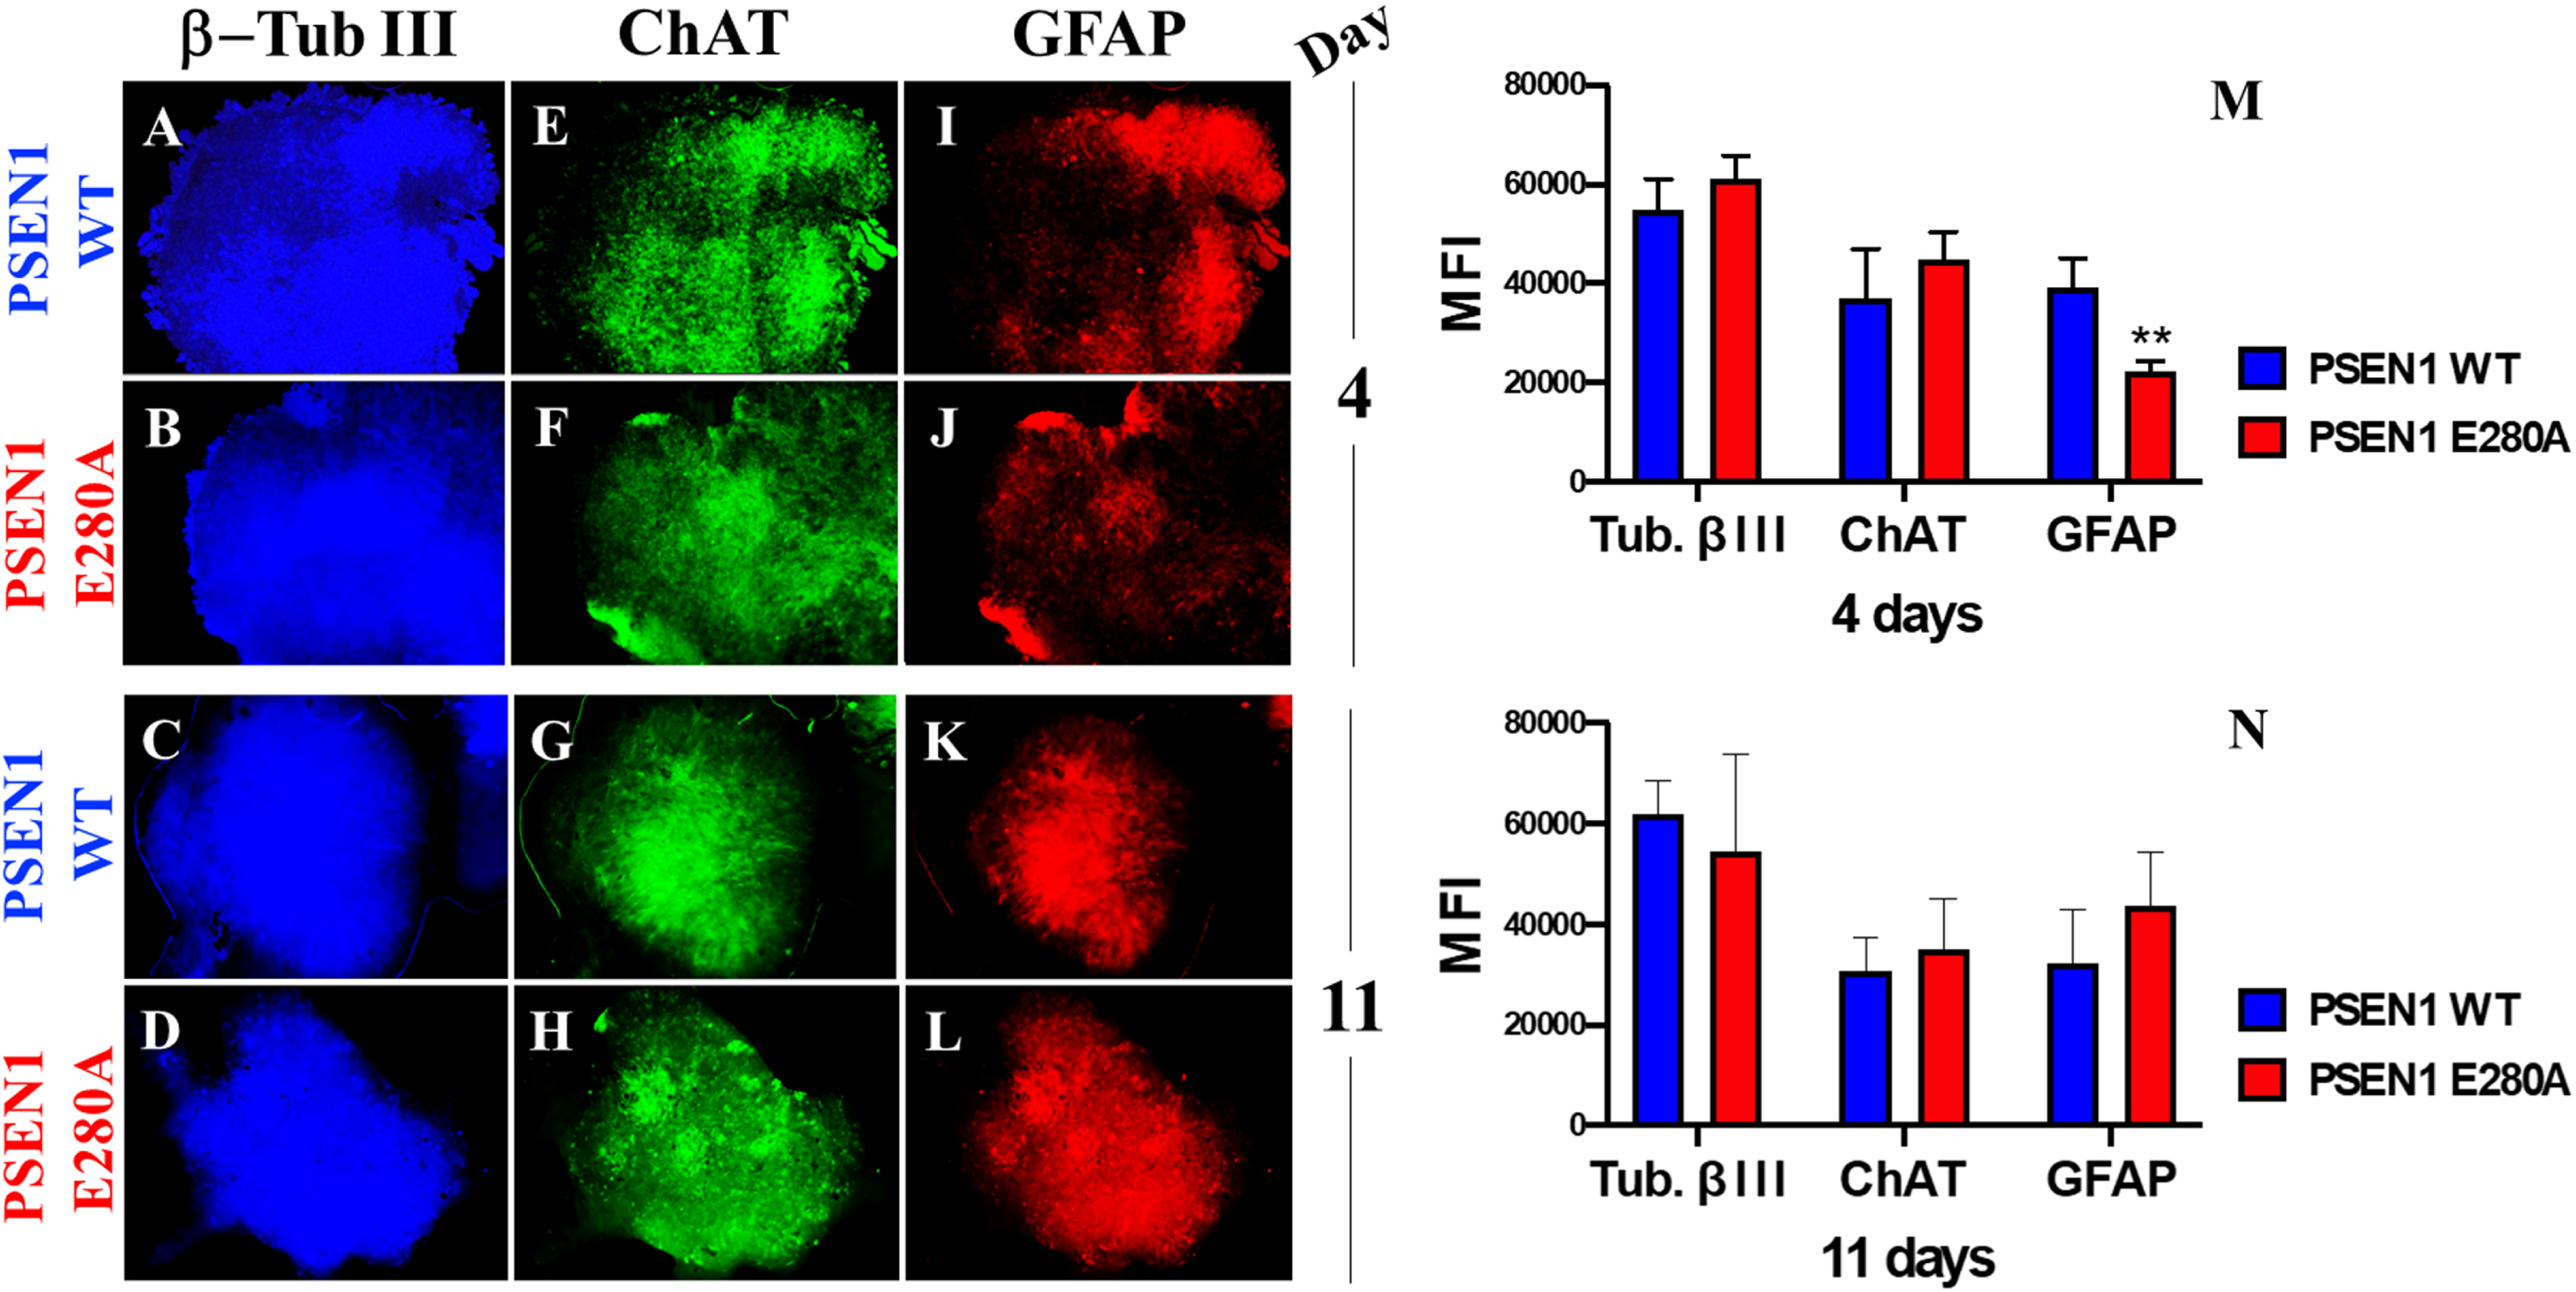
MenSCs-derived CSs show cholinergic and astrocytic marker. After 4 and 11 days, WT PSEN1 and PSEN1 E280A CSs were triple-stained as indicated in the figure with primary antibodies against β-TUB III (blue; A–D), ChAT (green; E–H), and GFAP (red; I–L). M) Mean fluorescence intensity (MFI) quantification of images obtained by immunofluorescence analysis on day 4. N) MFI quantification of images obtained by immunofluorescence analysis on day 11. Images represent one out of three independent experiments. Statistical significance was determined by one-way ANOVA with a Tukey post hoc test; **p < 0.01. Image magnification 10x.
PSEN1 E280A CSs show an early increase in iAβPPf and OS
Next, we wanted to determine whether CSs express the typical neuropathological features of AD, such as Aβ and OS. Figure 2 shows that WT NS displayed neither iAβPPf accumulation (Fig. 2A, C) nor OS markers (Fig. 2E, G), as reflected by the absence of iAβPPf (Fig. 2M, N), oxidized protein DJ-1 (Fig. 2M, N) and nuclear-positive cells (Fig. 2I–L). In contrast, PSEN1 E280A CSs displayed enhanced iAβPPf (Fig. 2B, D, M, N) and oxidation of protein DJ-1 (Fig. 2F, H, M, N) as early as 4 days in culture (Fig. 2M, N).
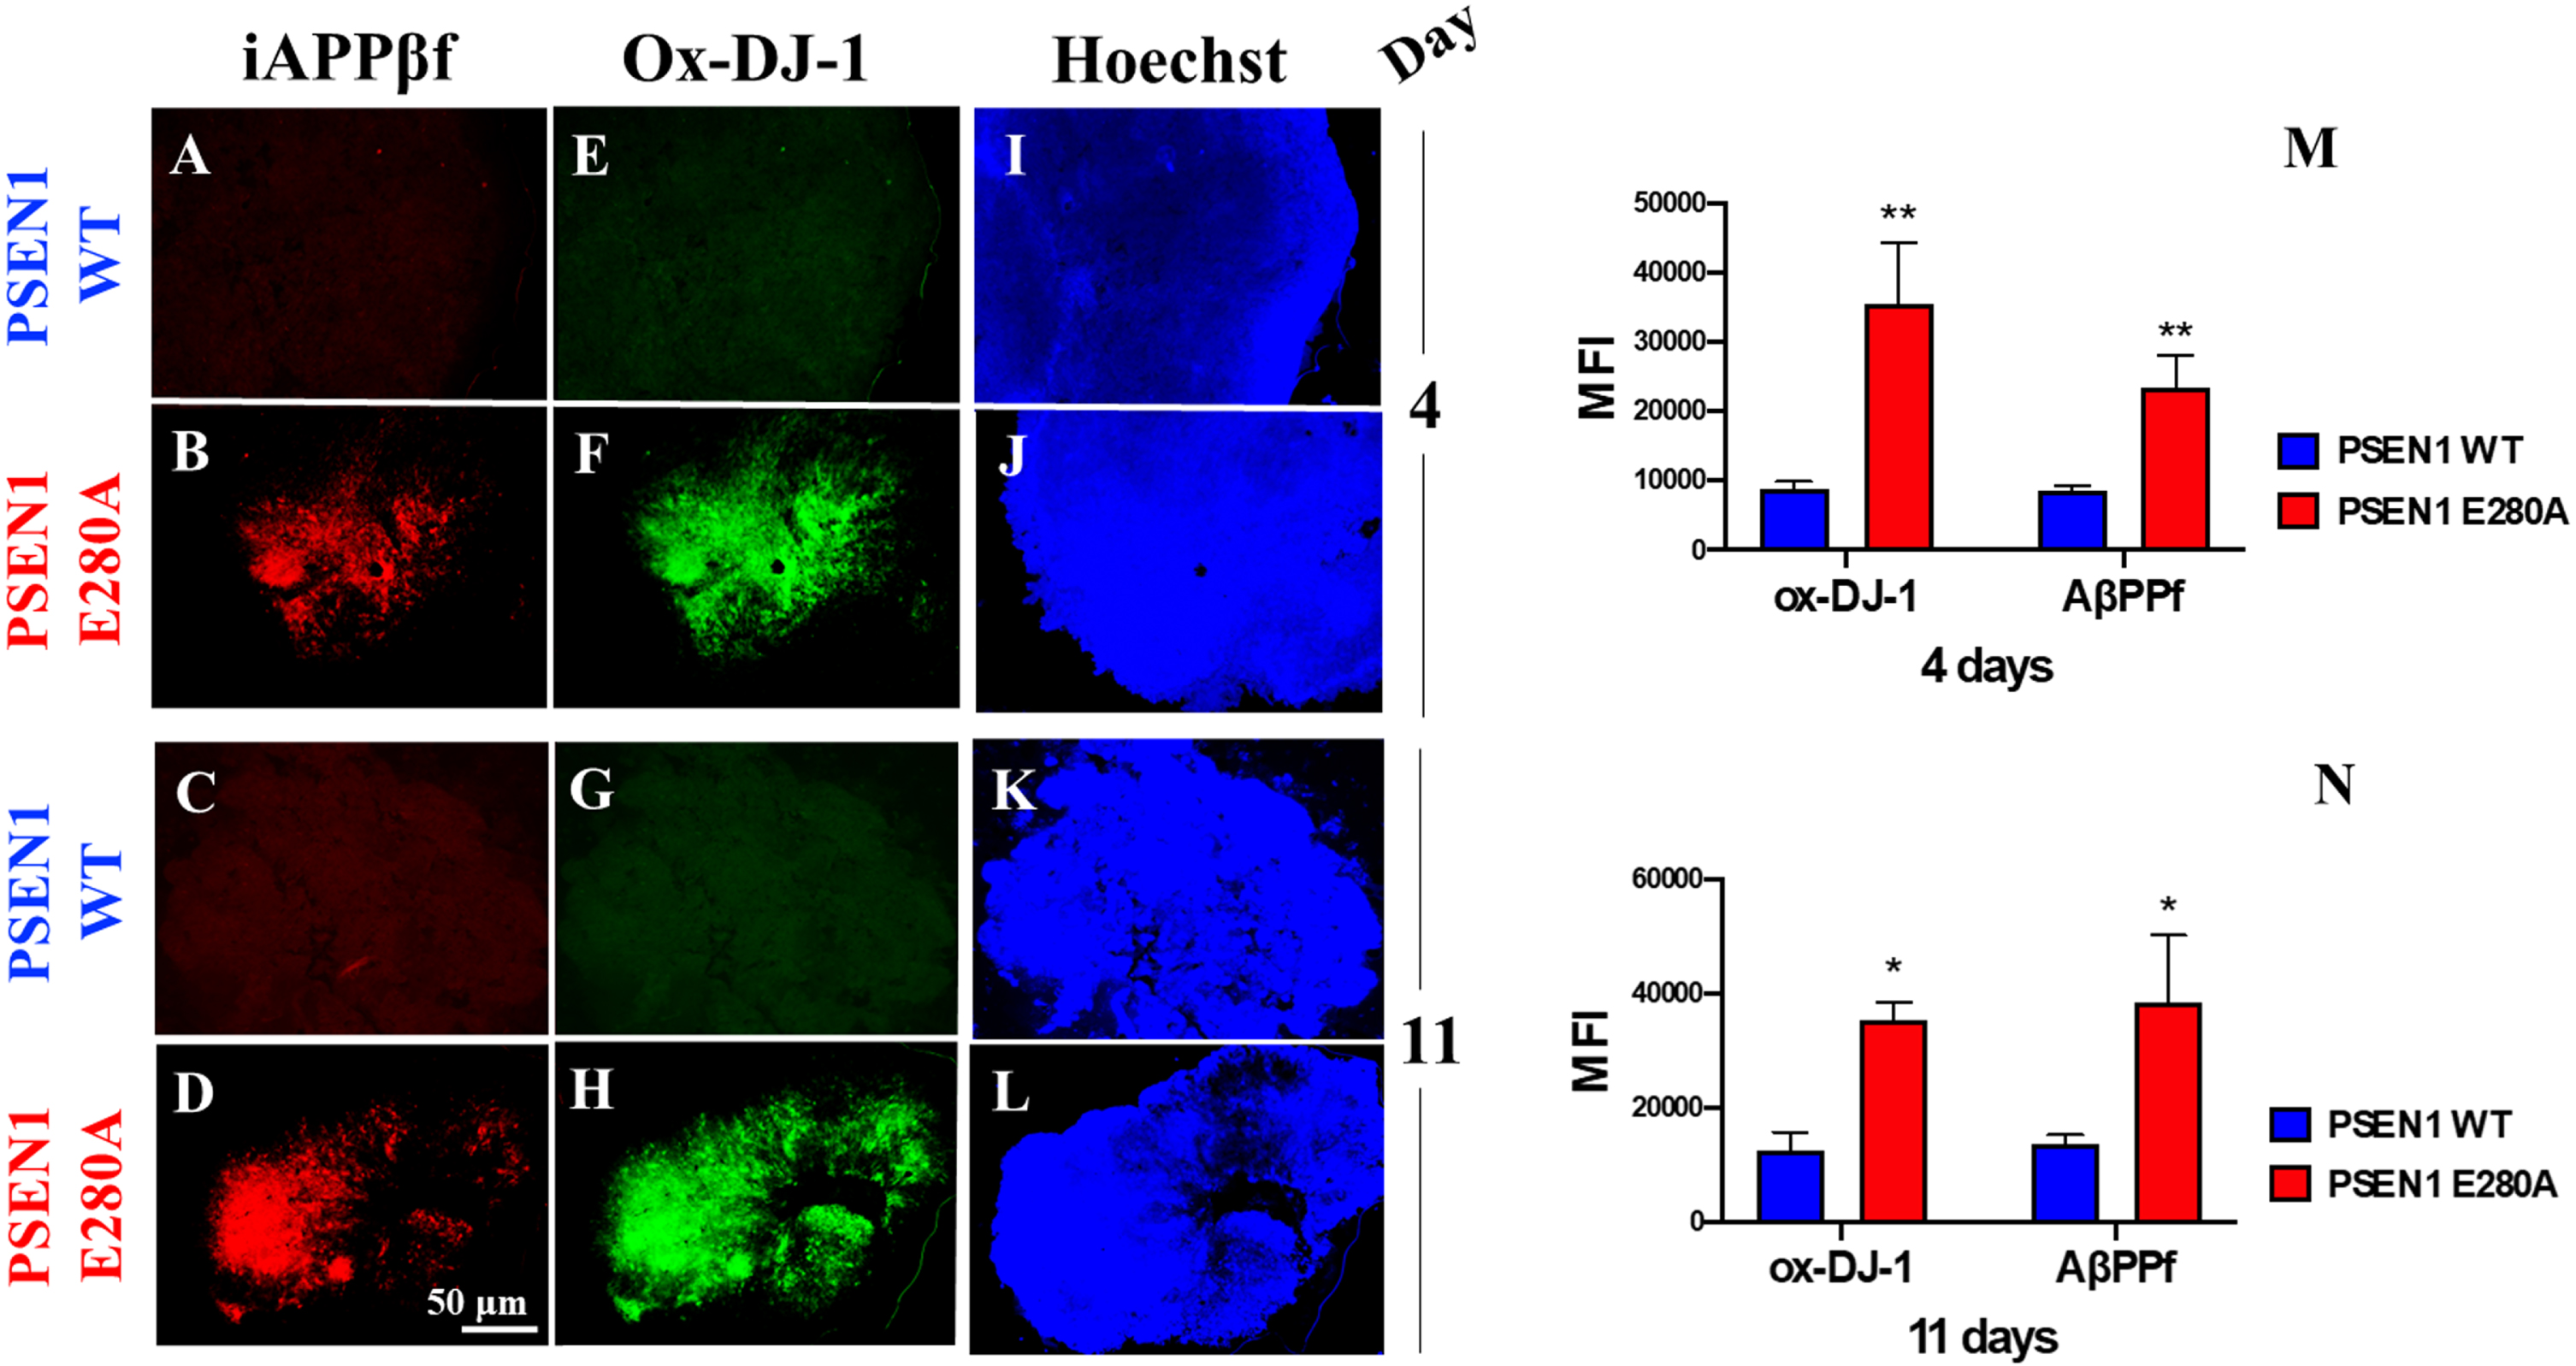
PSEN 1 E280A cerebral spheroids (CSs) accumulate intracellular AβPP fragments (iAβPPf) and oxidized (Cys106) DJ-1 protein (Ox-DJ-1). After 4 and 11 days, WT PSEN1 and PSEN1 E280A CSs were double-stained as indicated in the figure with primary antibodies against (i)AβPPf (red; A–D) and Ox-DJ-1 (green; E–H). Nuclei were stained with Hoechst (blue; I–L). M) Mean fluorescence intensity (MFI) quantification of images obtained by immunofluorescence analysis on day 4. N) MFI quantification of images obtained by immunofluorescence analysis on day 11. Images represent one out of three independent experiments. Statistical significance was determined by one-way ANOVA with a Tukey post hoc test; *p < 0.05; **p < 0.01. Image magnification 10x.
PSEN1 E280A CSs present hyperphosphorylation of tau protein
It is well established that phosphorylation of tau occurs downstream of Aβ pathology in AD [37, 38]. Therefore, we assessed whether tau is phosphorylated in a time-dependent manner in mutant CSs. As shown in Fig. 3, no p-tau was observed in WT CSs (Fig. 3A, C) on Days 4 or 11, whereas p-tau was detected in PSEN1 E280A CSs only on Day 11 (Fig. 3B versus Fig. 3D and 3M versus 3N). Total tau was measured and used for protein normalization (Fig. 3E–H), and Hoechst staining was used to analyze the organoid cellularity (Fig. 3I–L).
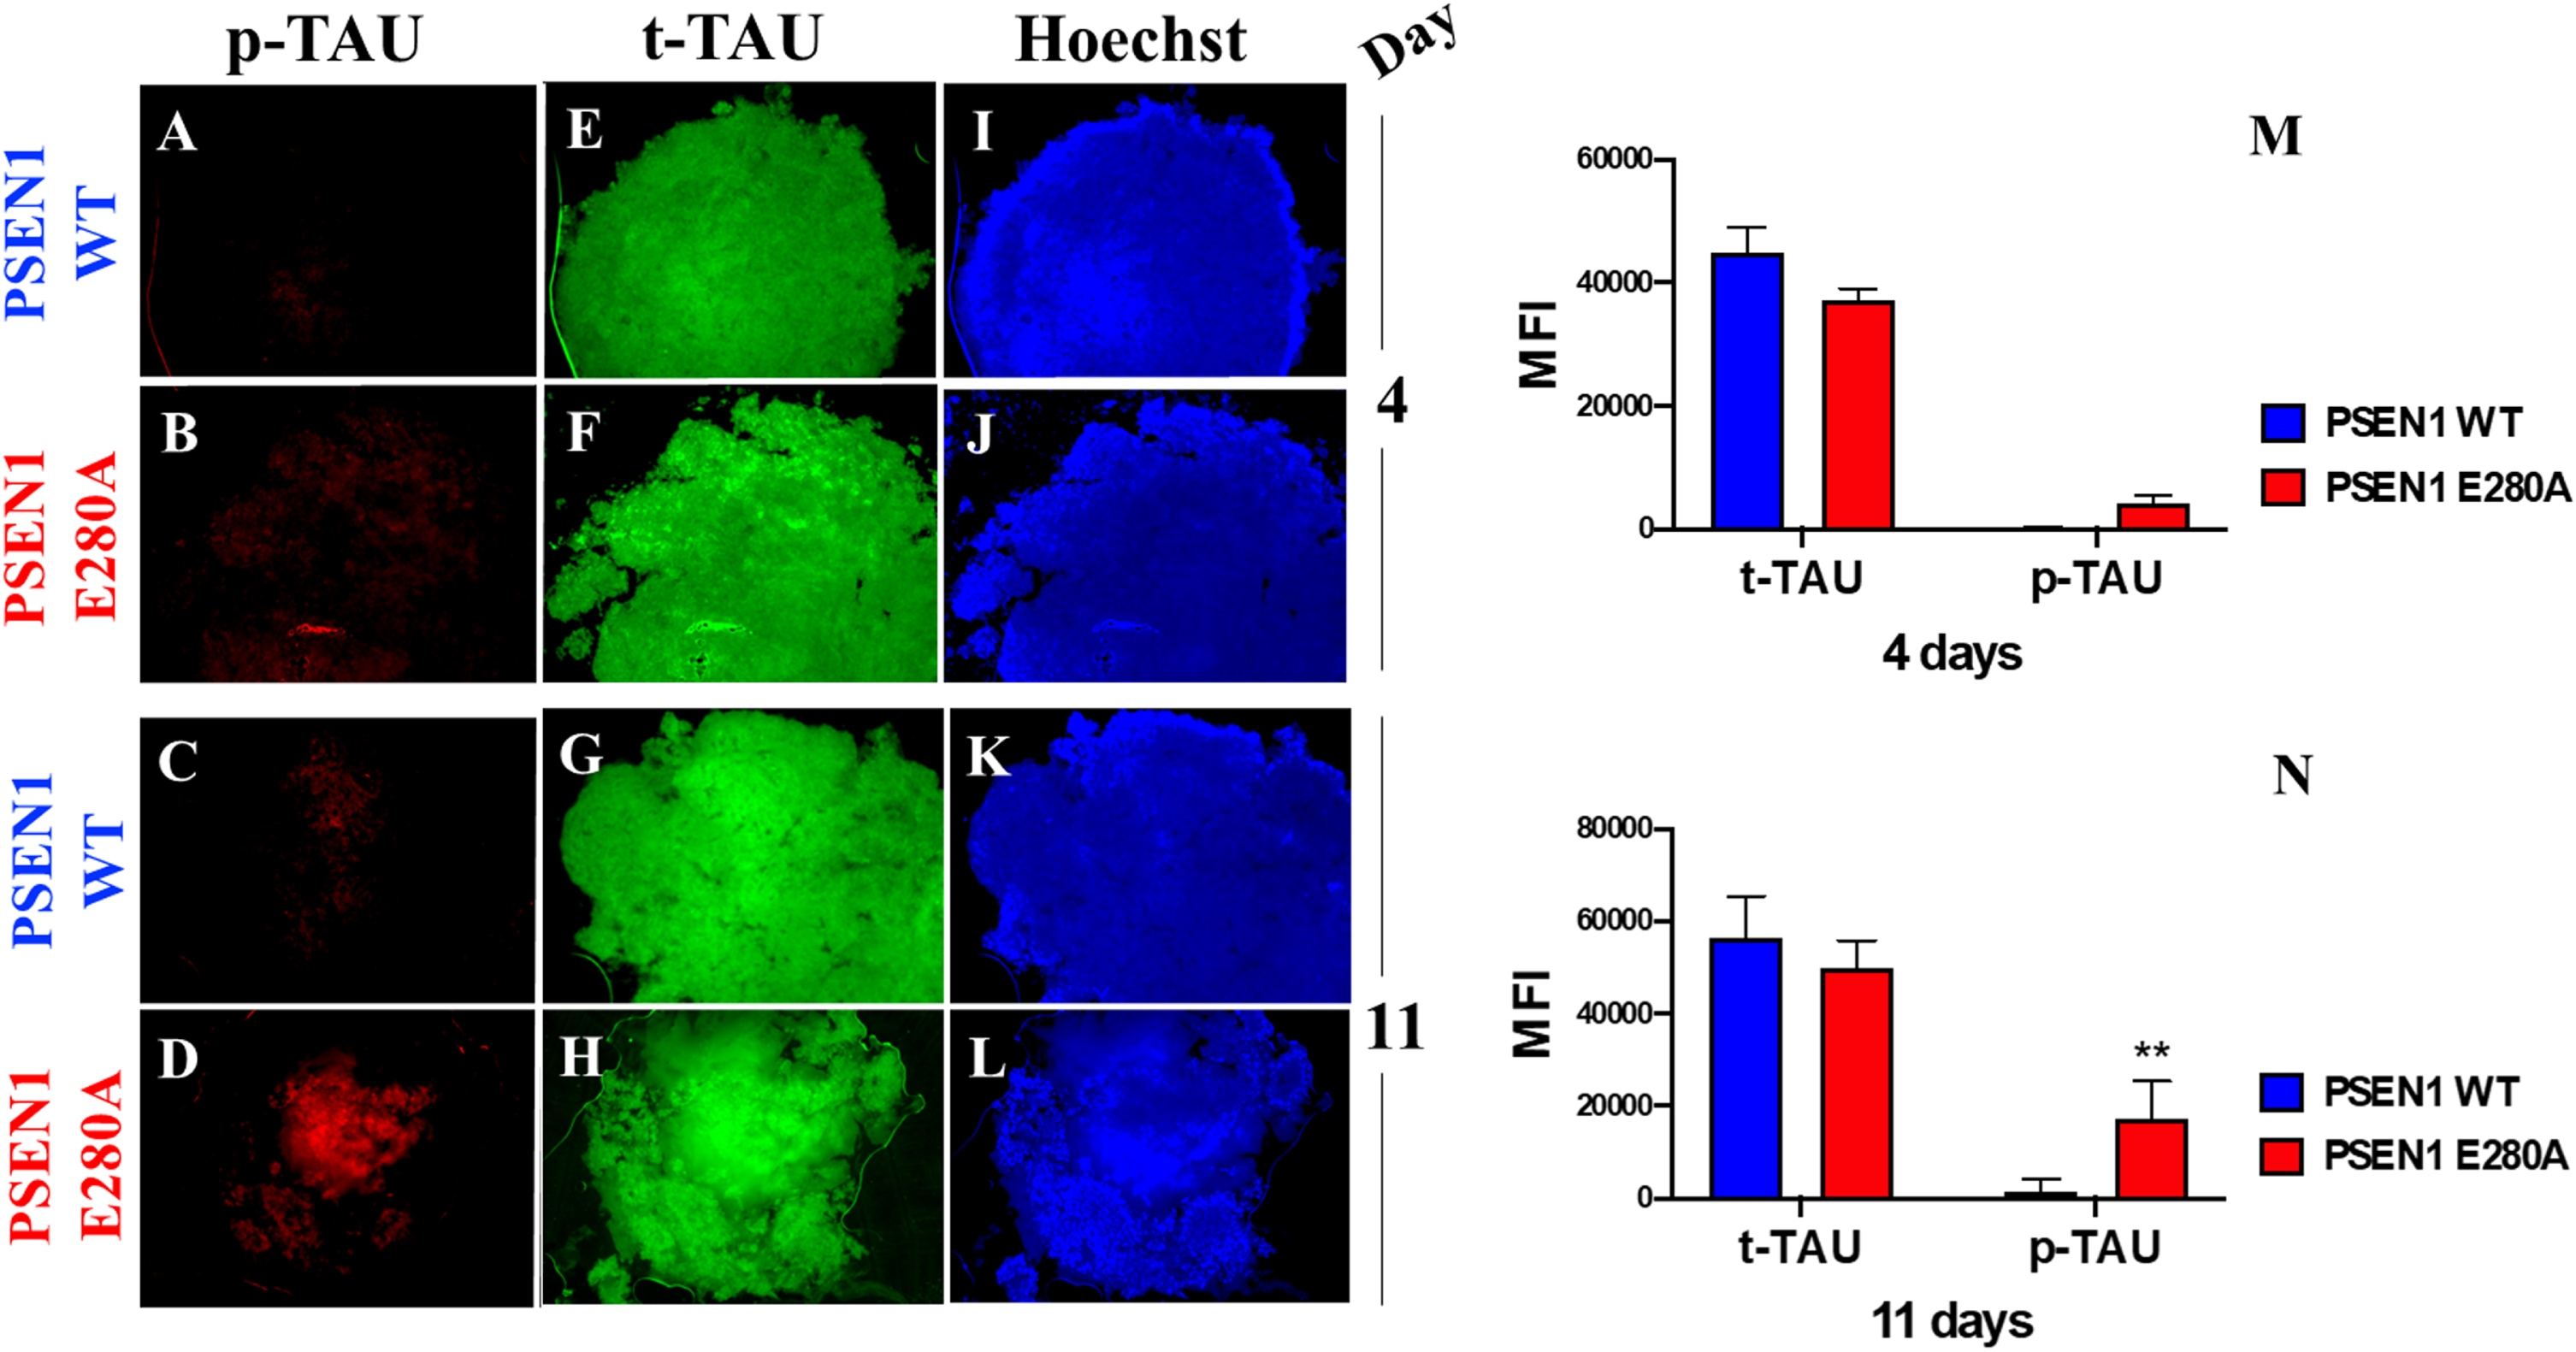
PSEN1 E280A cerebral spheroids (CSs) show hyperphosphorylation of protein tau. After 4 and 11 days, WT PSEN1 and PSEN1 E280A CSs were double-stained as indicated in the figure with primary antibodies against phosphorylated (Ser202/Thr205) Tau (p-Tau) (red; A–D) and total Tau (t-Tau) (green; E–H). Nuclei were stained with Hoechst (blue; I–L). M) Mean fluorescence intensity (MFI) quantification of images obtained by immunofluorescence analysis on day 4. N) MFI quantification of images obtained by immunofluorescence analysis on day 11. Images represent one out of three independent experiments. Statistical significance was determined by one-way ANOVA with a Tukey post hoc test; **p < 0.01. Image magnification 10x.
PSEN1 E280A CSs show diminished ΔΨm, caspase 3 activity, and fragmented nuclei
We then wondered whether PSEN 1 E280A CSs show endogenous alterations in ΔΨm, active CASP-3 and nuclear fragmentation similar to those demonstrated in 2D PSEN 1 E280A human umbilical cord Wharton Jelly mesenchymal stromal cell-derived ChLNs [22]. Figure 4 shows that WT CSs displayed high ΔΨm, inactive CASP3 and intact nuclei (Fig. 4A, E). However, PSEN1 E280A CSs displayed typical features of apoptotic cells, including failure of ΔΨm, CASP3-positive signals, and broken nuclei (Fig. 4F, J). Similar observations were obtained by flow cytometry (Fig. 4K, L) and the TUNEL technique (Fig. 4M, Q, R, W).
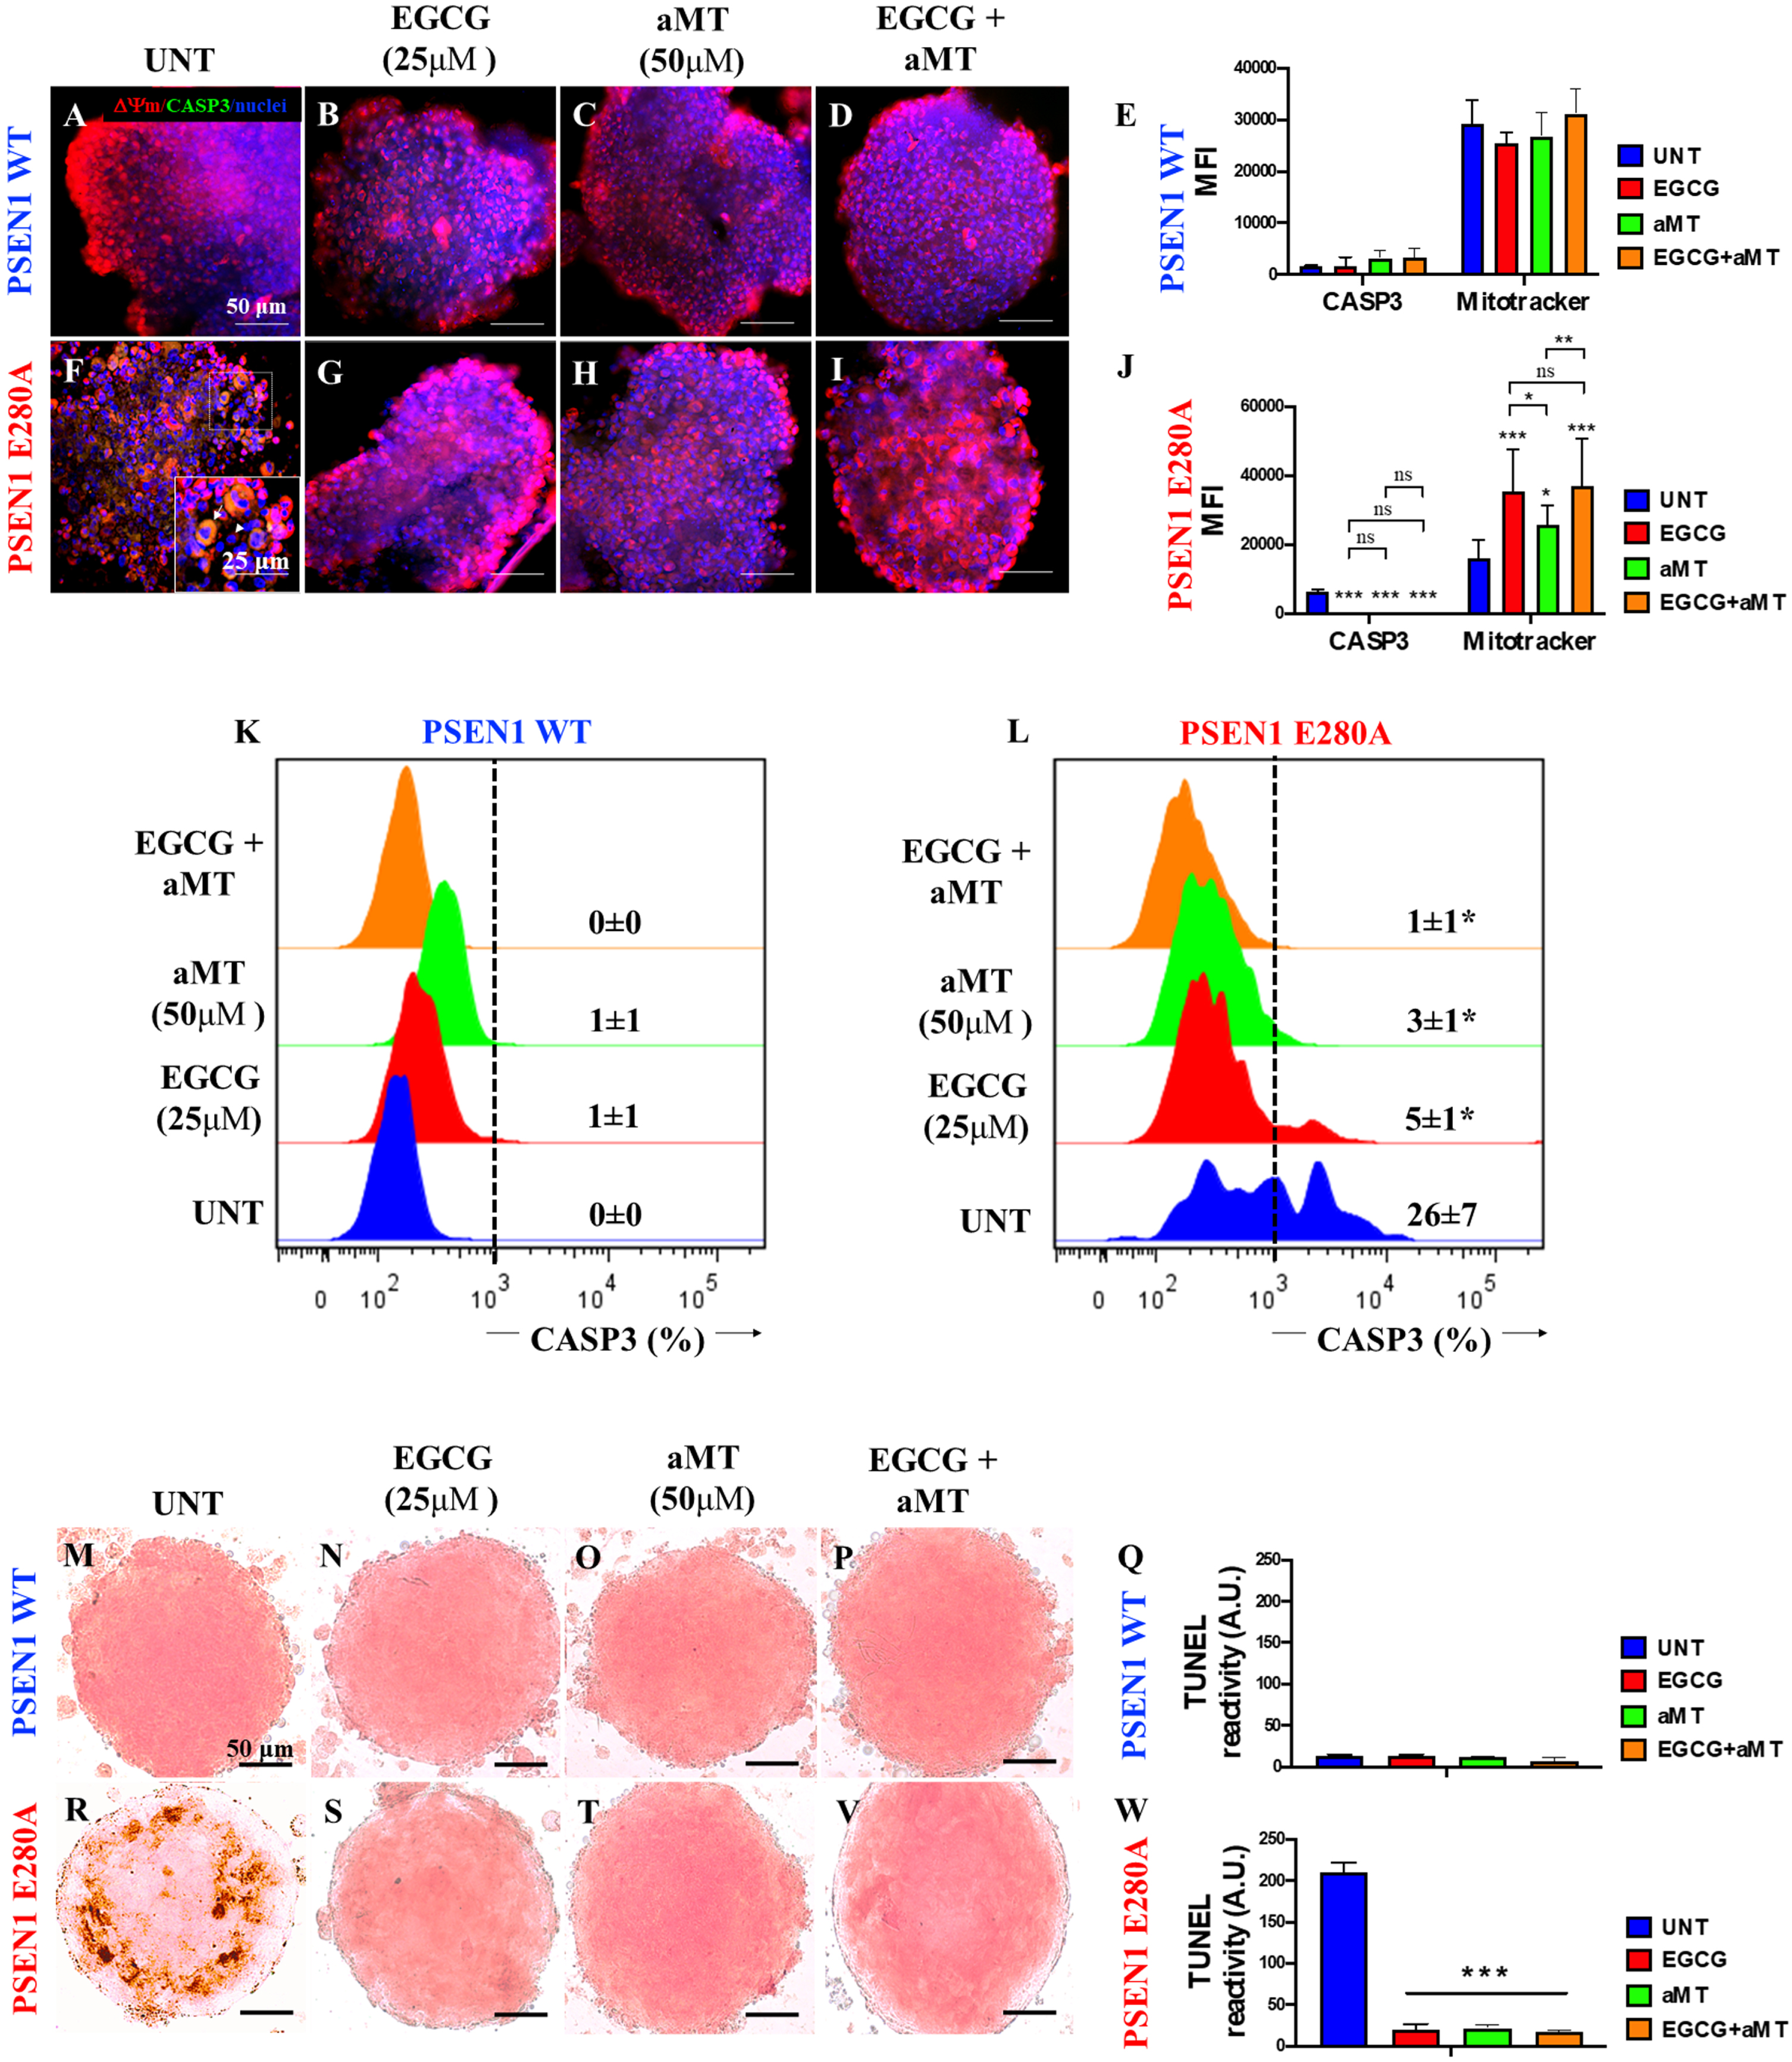
Combined treatment with EGCG and aMT reestablish mitochondria membrane potential (ΔΨm), inactivate CASPASE-3 activation, and block nuclei fragmentation in PSEN1 E280A (CSs). The WT PSEN1 and PSEN1 E280A CSs were left without (UNT; A, F) or treated with 25μM EGCG (B, G) and 50μM aMT (C, H) alone or in combination (D, I) until day 11. CSs were triple stained as indicated in the figure with MitoTrackertrademark Red FM (red), 1X Vybrant TM FLICA (green), and Hoechst (blue). E) Mean fluorescence intensity (MFI) quantification of images obtained by immunofluorescence analysis of PSEN1 WT CSs. J) MFI quantification of images obtained by immunofluorescence analysis of PSEN1 E280A CSs. K, L) representative histograms of WT PSEN1 (K) and PSEN1 E280A CSs (L) treated with none (UNT) or with EGCG, aMT, and EGCG/aMT. M-P, R-V) The WT PSEN1 and PSEN1 E280A CSs were left without (UNT; M, R) or treated with EGCG (N, S), aMT (O, T), or in combination (P, V) for 11 days. Then, untreated or treated CS were TUNEL stained. Only untreated PSEN1 E280A CSs (R) show TUNEL-positive cells. Q, W) TUNEL reactivity quantification of images obtained by TUNEL technique analysis after 11 days. Histograms and images represent one out of three independent experiments. Statistical significance was determined by one-way ANOVA with a Tukey post hoc test; *p < 0.05; ***p < 0.001. Image magnification 10x.
Combined treatment with EGCG and aMT increases ΔΨm and drastically reduces caspase 3 activation in PSEN1 E280A CSs
Previous work has shown that EGCG diminishes amyloid-induced cytotoxic effects on 2D PSEN1 E280A ChLNs derived from hUC-WJ MSCs [22] and that the hormone aMT acts as a neuroprotectant [30, 39]. Therefore, we determined the effect of polyphenols and hormones on mitochondrial functionality in CSs. As shown in Fig. 4, EGCG only (Fig. 4B), aMT only (Fig. 4C), or a combination of the two (Fig. 4D) induced neither alteration in the ΔΨm nor activation of the executer protein CASP3 in WT CSs (Fig. 4E) compared to untreated CSs (Fig. 4A, E). Remarkably, treatment with EGCG only (Fig. 4G), aMT only (Fig. 4H), or a combination of the two (Fig. 4I) significantly increased ΔΨ compared to untreated PSEN1 E280A CSs (Fig. 4F), and these treatments were equally efficient in reducing CASP3 activation in mutant CSs (Fig. 4E versus 4J). Similar results were obtained by flow cytometry (Fig. 4K, L) and the TUNEL technique (Fig. 4N–Q, S–W).
Combined treatment with EGCG and aMT dramatically diminishes iAβPPf and OS levels in PSEN1 E280A CSs
Based on the above observations, we were prompted to assess whether EGCG and aMT alone or in combination can reverse the neuropathologic features of FAD in mutant CSs. To determine this, WT CSs and PSEN1 E280A CSs were left untreated (used as control) or incubated with EGCG at 25μM, a pharmacological concentration of aMT (50μM) or a combination of EGCG and aMT. As illustrated in Fig. 5, EGCG, aMT, and EGCG/aMT were innocuous to WT CSs (Fig. 5A versus Fig. 5B–E). However, aMT (Fig. 5H, J) was significantly more effective than ECGC alone in preventing the accumulation of iAβPPf in PSEN1 E280A CSs (Fig. 5G, J), and treatment with a combination of the two reduced the level of iAβPPf in mutant CSs (Fig. 5I, J) to nearly control values, i.e., those found in WT CSs. In contrast, EGCG was much more effective than aMT in reducing the oxidation of the sensor protein DJ-1 (Fig. 5F versus Fig. 5G and 5J). The combination of the two drugs was even more effective than EGCG alone in reducing OS in mutant CSs (Fig. 5F versus Fig. 5I and J). Flow cytometry analysis yielded comparable results (Fig. 5K–T).
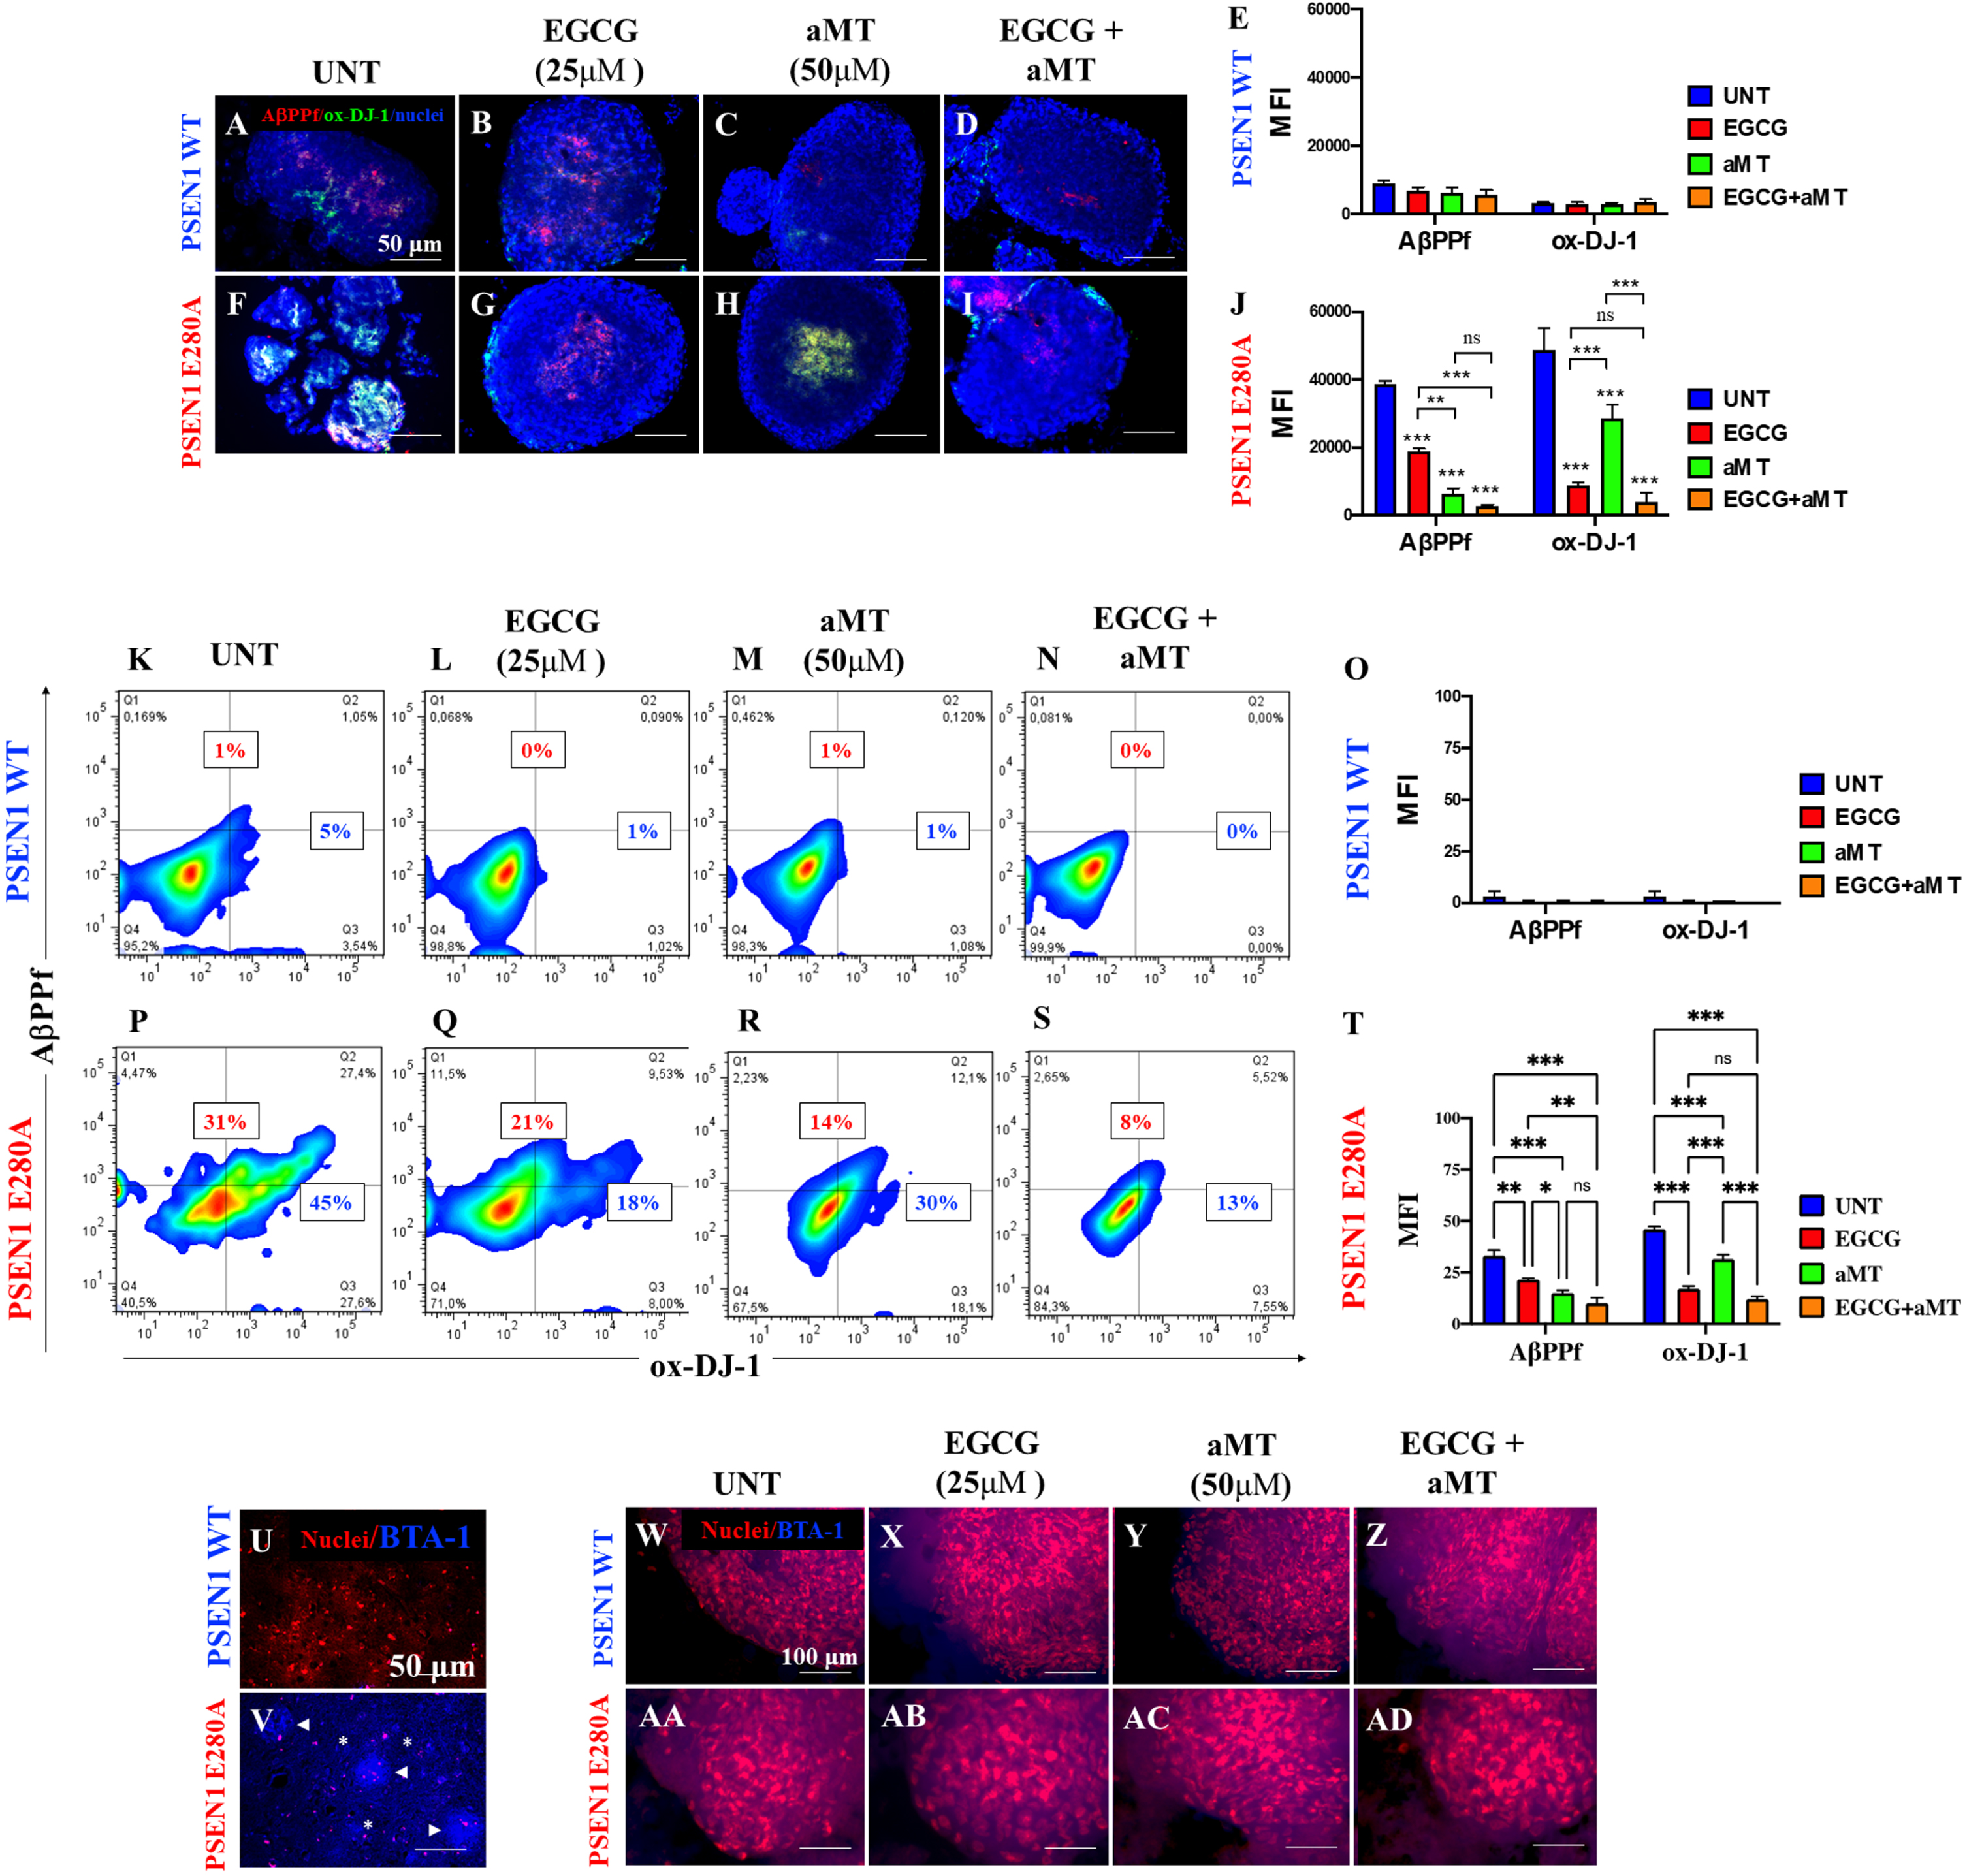
Combined treatment with EGCG and aMT reduce iAβPPf and OS in PSEN1 E280A CSs. The WT PSEN1 and PSEN1 E280A CSs were left without (UNT; A, F) or treated with 25μM EGCG (B, G) and 50μM aMT (C, H) alone or in combination (D, I) for 11 days. CSs were double-stained as indicated in the figure with antibodies against sAβPPf (red) and Ox-DJ-1 (green), and nuclei were stained with Hoechst (blue). E) Mean fluorescence intensity (MFI) quantification of images obtained by immunofluorescence analysis of PSEN1 WT CSs. J) MFI quantification of images obtained by immunofluorescence analysis of PSEN1 E280A CSs. K-N, P-S) Representative 2D density plot showing iAβPPf (y-axis) and ox-DJ-1 (x-axis) flow cytometry double analysis performed on untreated WT (K) and mutant CSs (P), or treated with EGCG only (L, Q), aMT only (M, R), and EGCG/ aMT (N, S). O, T) represent the quantitative analysis of the data from quadrant Q1 + Q2 for iAβPPf and Q2 + Q4 for ox-DJ-1. U-V) represent BTA-1 negative staining of a temporal cortex sample from a healthy individual (case #3648) and BTA-1 positive staining of a temporal cortex sample from a PSEN1 E280A individual (case #3396). Arrowheads show Aβ plaques, and asterisks show Aβ fibrils. W-AD) The WT PSEN1 and PSEN1 E280A CSs were left without (UNT; W, AA) or treated with EGCG (X, AB) and aMT (Y, AC) alone or in combination (Z, AD) for 11 days. Then, CSs were double stained with BTA-1 and propidium iodide as indicated in the figure. BTA-1 negative staining was observed in untreated or treated CSs. Except for Fig. 5U and 5V, 2D histograms and images represent one out of three independent experiments. Statistical significance was determined by one-way ANOVA with a Tukey post hoc test; ***p < 0.001. Image magnification 10x.
To further confirm that the thwarting effect of the molecules was specifically on iAβPP and not on extracellular Aβ aggregates, we stained WT and mutant CSs with thioflavin BTA-1, a specific fluorescent thioflavin-T derivative that has high affinity for amyloid deposits and specifically labels β-amyloid aggregates. BTA-1 displays 50-fold higher affinity for Aβ aggregates than does thioflavin-T, selectively stains Aβ fibrils in postmortem brain tissue obtained from AD patients and crosses the blood-brain barrier. We also stained postmortem temporal cortical samples obtained from individuals with normal and E280A mutant PSEN1 as internal negative and positive controls, respectively. As expected, the mutant E280A temporal postmortem sample displayed typical amyloid plaques (Fig. 5V, arrowheads) and Aβ fibrils (Fig. 5V, asterisks), but such plaques were completely absent from the WT temporal postmortem sample (Fig. 5U). Interestingly, untreated or treated WT or mutant CSs showed neither BTA-1-positive staining for amyloid plaques nor Aβ fibrils (Fig. 5W-AD).
Simultaneously, we wanted to determine whether the reduction in DJ-1 oxidation via H2O2 activation might be due to antioxidant activity of EGCG and aMT when incubated with CSs. The ORAC assay (also known as the hydrogen atom transfer (HAT)-based assay) showed that EGCG, aMT and combined EGCG/aMT displayed high antioxidant activity, yielding values of 37,870.75±671.43μmol Trolox equivalents (TE)/g, 55,822.86±585.18μmol TE/g, and 130,894.34±2,874.21μmol TE/g, respectively. The mixture showed 3.35-fold and 2.34-fold increases in ORAC values, respectively.
Combined treatment with EGCG and aMT completely blocks phosphorylation of tau protein
We further evaluated whether exposure of CSs to polyphenols, hormones, or a combination of the two is able to decrease p-tau. As shown in Fig. 6, compared to untreated CSs (Fig. 6A, E), no p-tau was observed in WT CSs treated with EGCG (Fig. 6B, E), aMT (Fig. 6C, E), or EGCG/aMT (Fig. 6D, E). When mutant CSs (Fig. 6F) were exposed to these agents, both EGCG alone (Fig. 6G, J) and aMT alone (Fig. 6H, J) significantly diminished p-tau compared to the level found in untreated mutant CSs (Fig. 6J). Interestingly, treatment with combined EGCG/aMT completely eliminated p-tau (Fig. 6I, J). Flow cytometry yielded similar results (Fig. 6K–T).
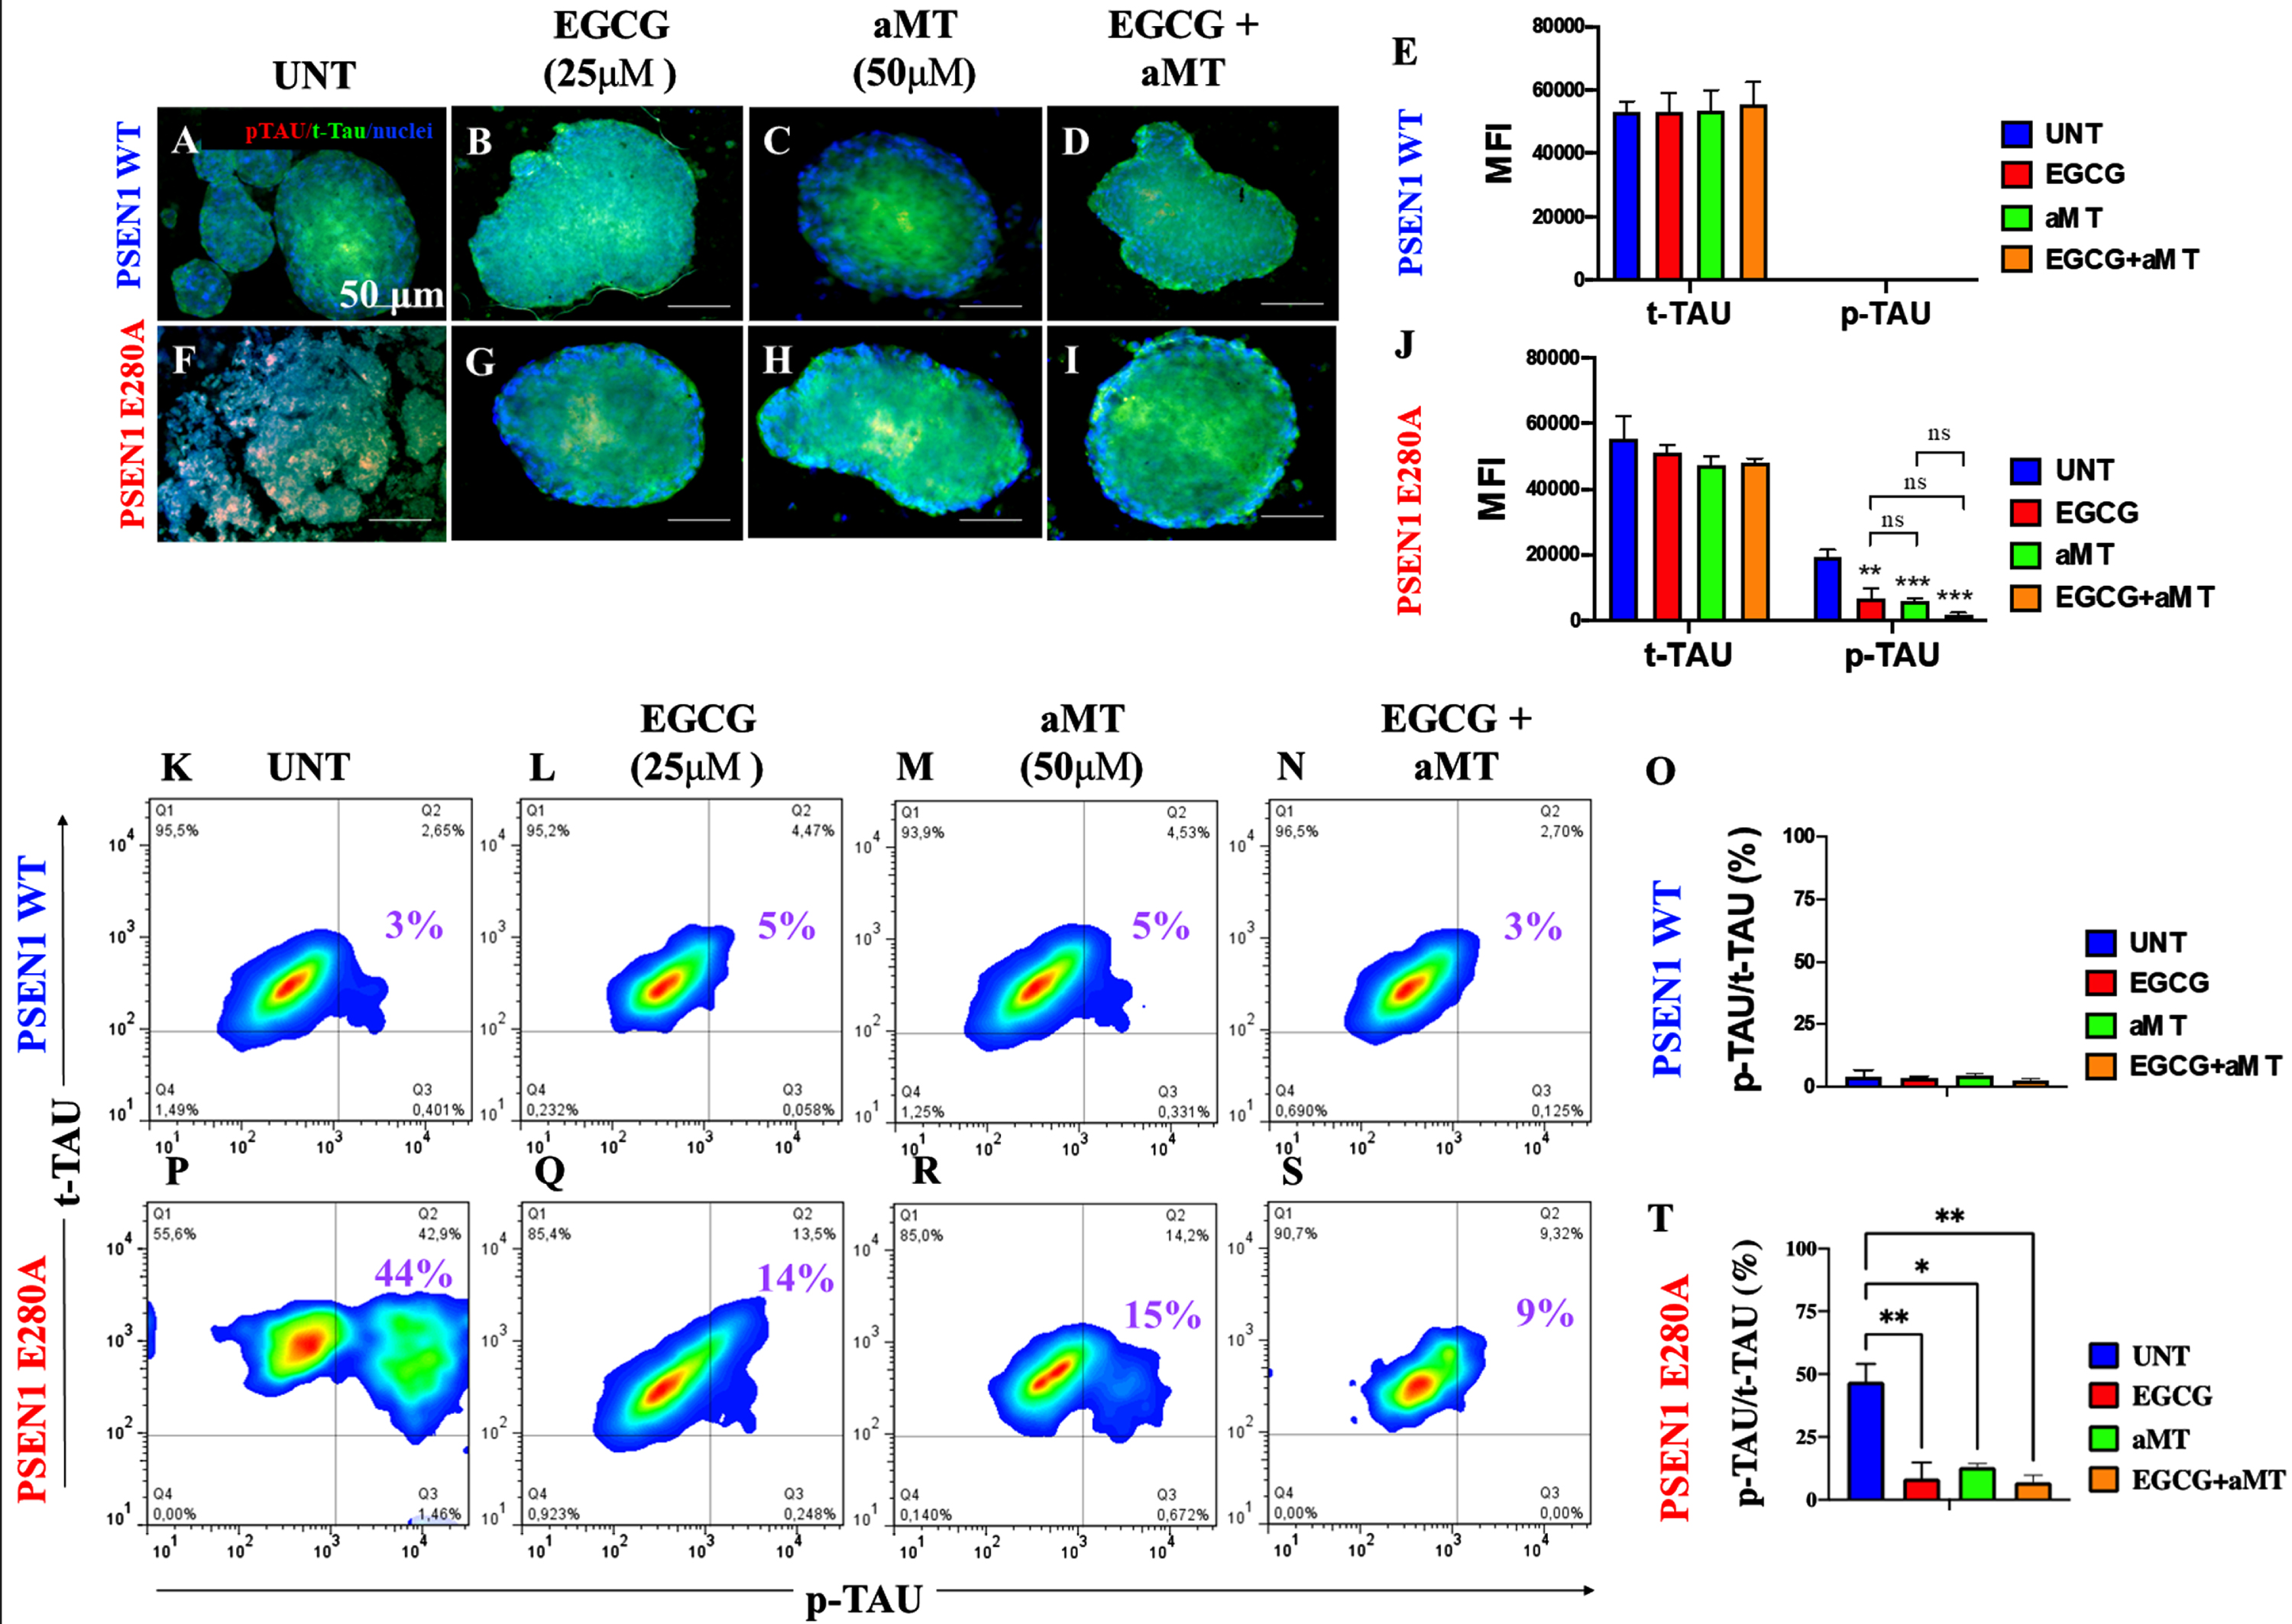
Combined treatment with EGCG and aMT completely blocked the phosphorylation of protein tau. WT PSEN1 and PSEN1 E280A CSs were left without (UNT; A, B) or treated with 25μM EGCG (C, D) and 50μM aMT (E, F) alone or in combination (G, H) for 11 days. CSs were double-stained as indicated in the figure with antibodies against phosphorylated (Ser202/Thr205) Tau (p-Tau; red), total Tau (t-Tau; green), and nuclei were stained with Hoechst (blue). I) Mean fluorescence intensity (MFI) quantification of images obtained by immunofluorescence analysis of PSEN1 WT CSs. J) MFI quantification of images obtained by immunofluorescence analysis of PSEN1 E280A CSs. K-N, P-S) Representative 2D density plot showing t-tau (y-axis) and p-tau (x-axis) flow cytometry double analysis performed on untreated WT (K) and mutant CSs (P), or treated with EGCG only (L, Q), aMT only (M, R), or EGCG/ aMT (N, S). O, T) represent the quantitative analysis of the data from quadrant Q2. The 2D histograms and images represent one out of three independent experiments. Statistical significance was determined by one-way ANOVA with a Tukey post hoc test; **p < 0.01; ***p < 0.001. Image magnification 10x.
When applied together with EGCG, aMT limits the beneficial effect of EGCG on Ca2+ influx in PSEN1 E280A CSs
Finally, we evaluated the effects of the two compounds on Ca2+ functionality in CSs exposed to acetylcholine (ACh). To this end, WT and mutant PSEN1 E280A CSs were exposed to ACh at 1 mM final concentration. As shown in Fig. 7, ACh stimulated a temporary increase in intracellular Ca2+ in WT CSs (Fig. 7A, ΔF/F = 0.165±0.06, mean duration = 10 s; n = 9 CSs imaged, N = 3 dishes Fig. 7E). Ca2+ influx into WT CSs after ACh addition was altered by EGCG (Fig. 7B), aMT (Fig. 7C), and by a combination of EGCG and aMT (Fig. 7D, E). In contrast, ACh did not affect intracellular Ca2+ in mutant PSEN1 CSs (Fig. 7F, ΔF/F = 0.00±0.02, mean duration = 10 s; n = 9 CSs imaged, N = 3 dishes, Fig. 7J). While EGCG dramatically restored Ca2+ influx in mutant CSs (Fig. 7G, ΔF/F = 0.33±0.01, mean duration = 10; n = 9 CSs imaged, N = 3 dishes, Fig. 7J), aMT did not restore Ca2+ influx in the mutant CSs (Fig. 7H, J), in contrast to its effect on untreated mutant CSs (Fig. 7F, J). Interestingly, administration of ECGG and aMT together decreased ACh-induced Ca2+ influx in PSEN1 E280A CSs (Fig. 7I; ΔF/F = 0.15±0.02, mean duration = 10 s; n = 9 CSs imaged, N = 3 dishes, Fig. 7J).
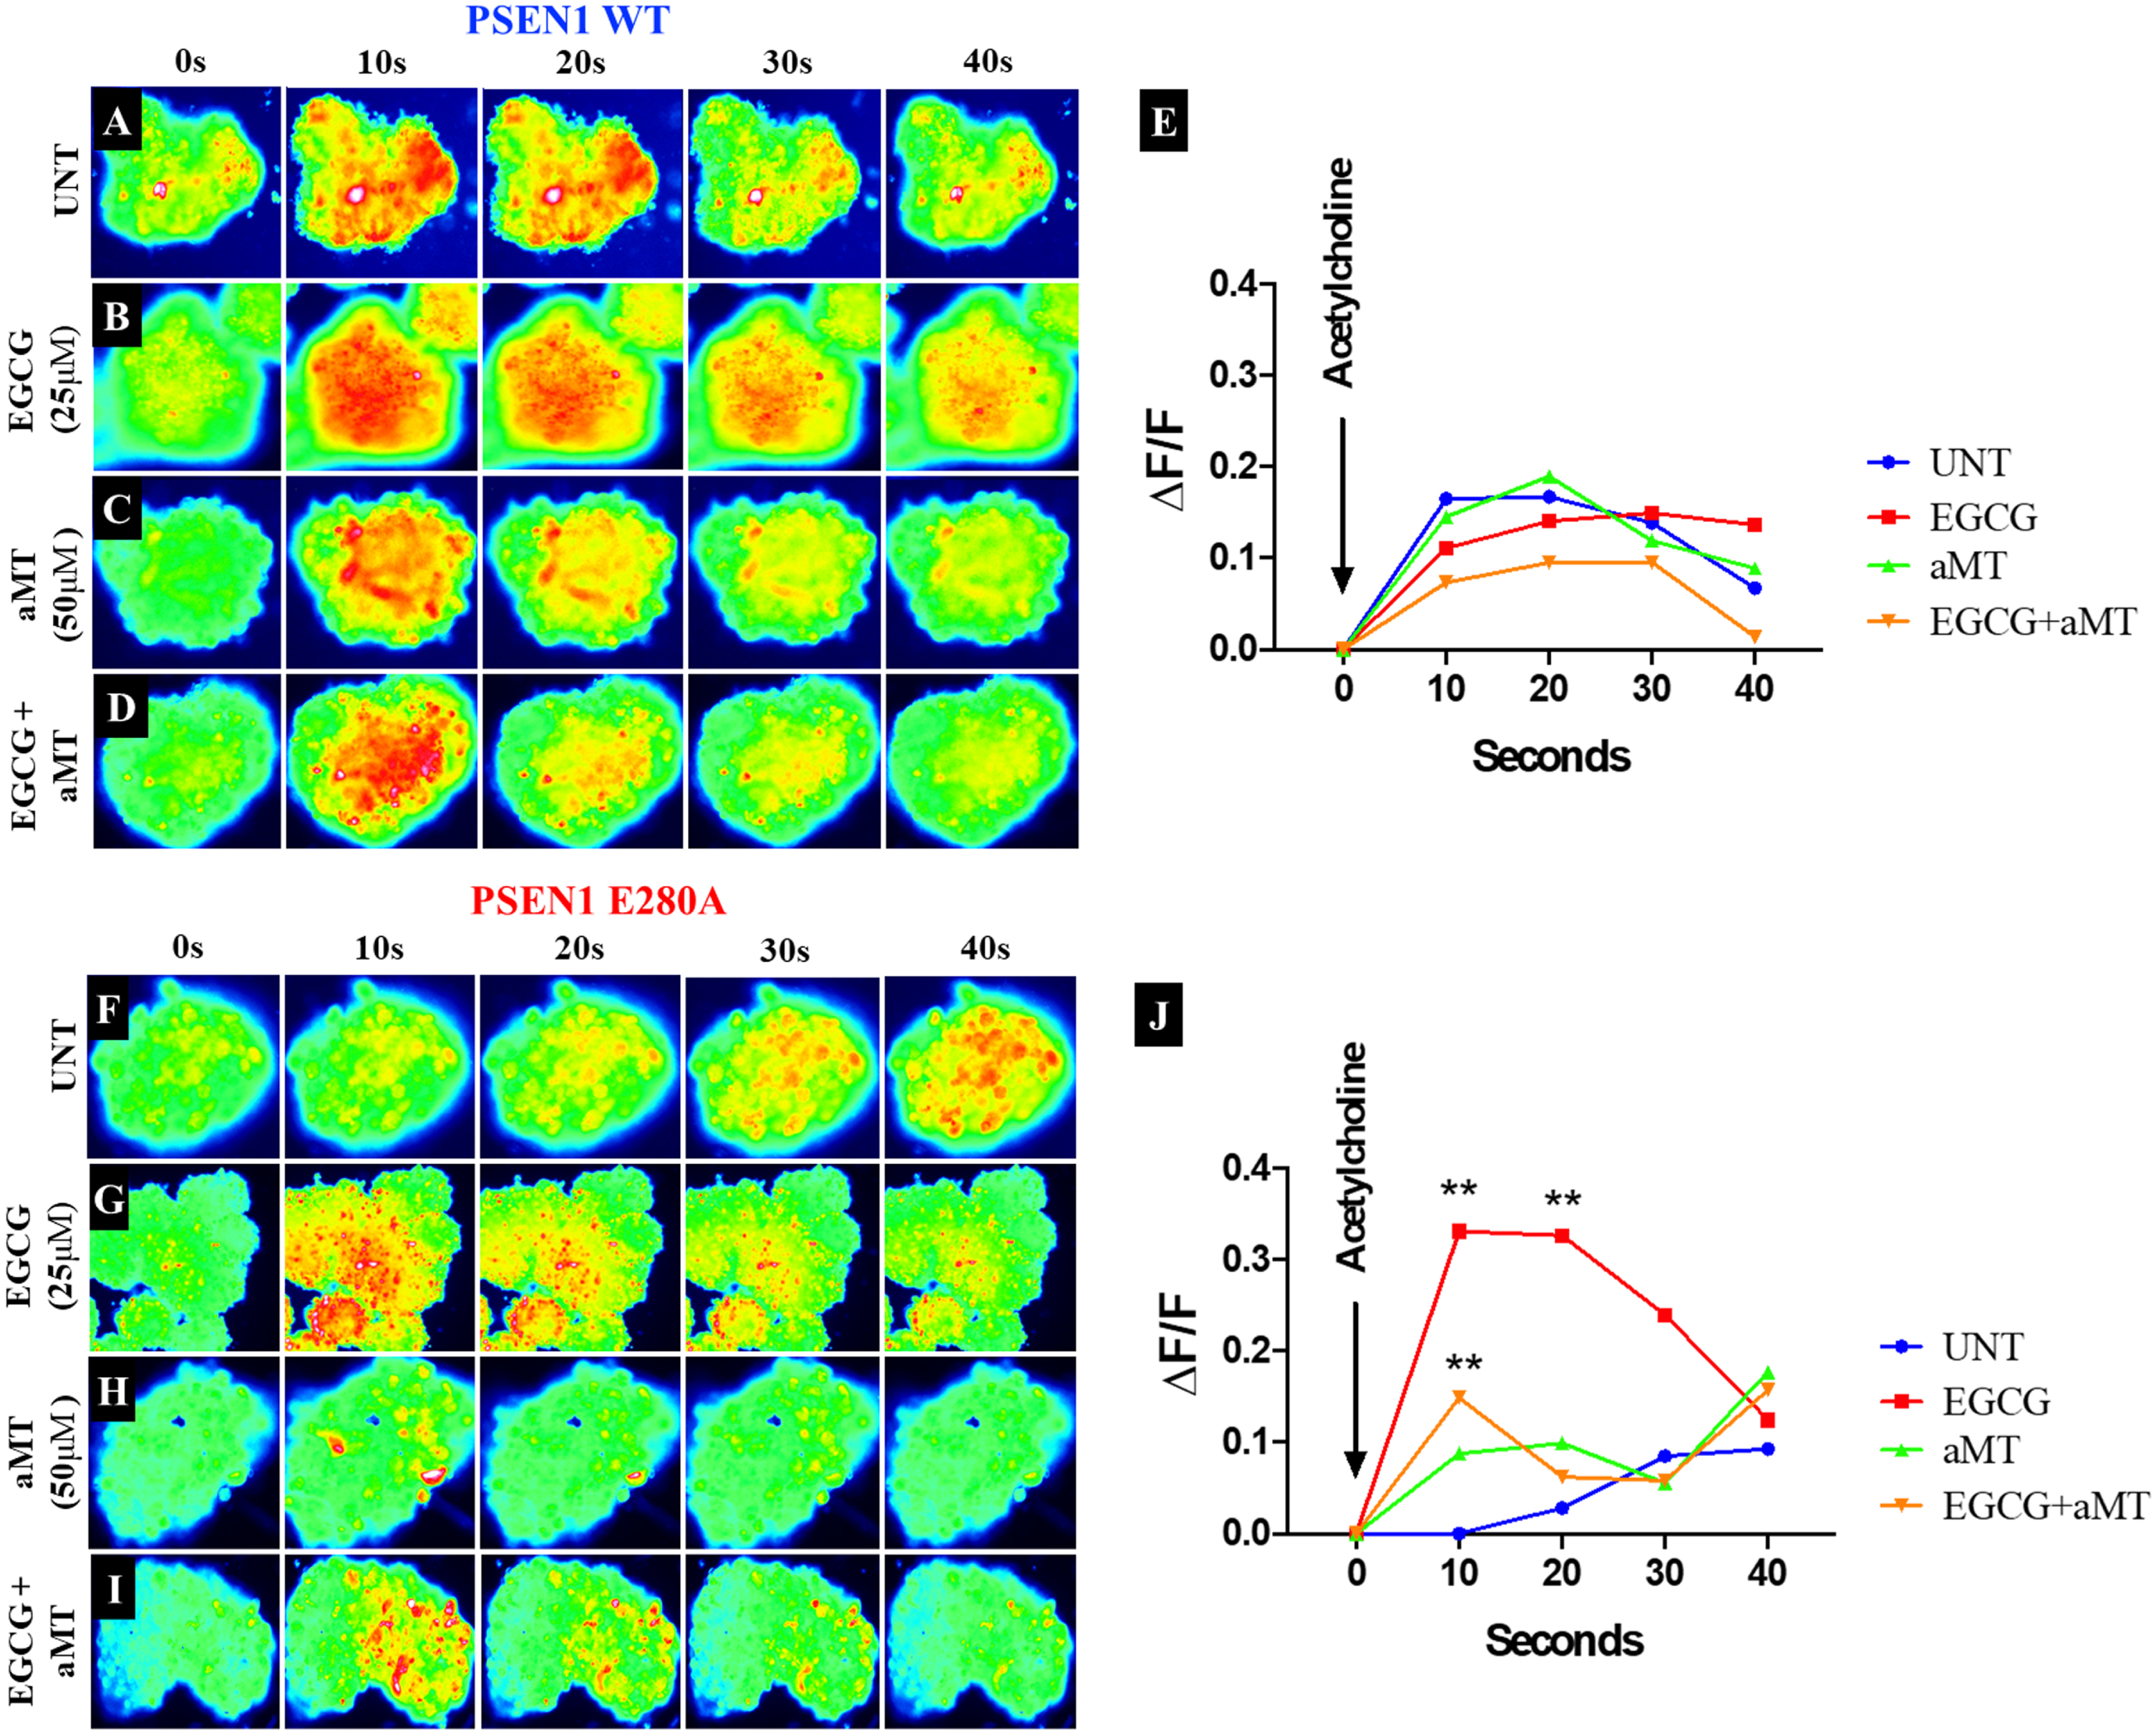
aMT lessens the effect of EGCG on Ca2+ influx in PSEN1 E280a CSs. The WT PSEN1 and PSEN1 E280A CSs were left without (UNT; A, F) or treated with 25μM EGCG (B, G) and 50μM aMT (C, H) alone or in combination (D, I) until day 11. Time-lapse images (0, 10, 20, 30, and 40 s) of Ca2+ fluorescence in CSs (n = 9 CSs imaged, N = 3 dishes) as a response to ACh treatment. ACh was puffed into the culture at 0 s (arrow). Then, the Ca2+ fluorescence of cells was monitored at indicated times. Color contrast indicates fluorescence intensity: dark blue < light blue < green < yellow < red. E) Normalized mean fluorescence signal (ΔF/ F) over time, indicating temporal cytoplasmic Ca2+ elevation in response to ACh treatment in PSEN1 WT CSs. J) Normalized mean fluorescence signal (ΔF/ F) over time, indicating temporal cytoplasmic Ca2+ elevation in response to ACh treatment in PSEN1 E280A CSs. Statistical significance was determined by two-way ANOVA with a Tukey post hoc test; **p < 0.01. Image magnification 10x.
DISCUSSION
Cerebral spheroids are potential in vitro models for understanding neuronal dysfunction [40]. We report for the first time that cholinergic-like PSEN 1 E280A CSs derived from MenB cells replicate the neuropathological hallmarks of FAD in 3D, mirroring previously reported findings in hUC-MSC-derived ChLNs PSEN1 E280A cultured in planar (2D) culture [22]. Indeed, mutant CSs, but not WT CSs, contained high amounts of intracellular AβPPf, OS, and hyperphosphorylated tau protein, as evidenced through immunochemistry using antibodies to E610, DJ-1-sulfonic (SO3), and AT8, flow cytometry and BTA-1 staining. Because the WT and mutant cells grow in conglomerates, i.e., in cell spheres, the pathological markers were more prominently detectable in 3D than in 2D cultures. This is indeed an advantage of 3D cultures prepared in Fast-N-Spheres V2 medium. Since we found no differences in the levels of iAβPP fragments, OS markers, or p-tau after 11 days of culture, the replication of neuropathological features of FAD is easier and more cost-effective when MenSC-derived CSs are used rather than cell models based on other cell culture methods (e.g., [41]). Interestingly, a recently described Aβ-GFP transgenic mouse model of AD, Aβ-GFP Tg, displays increased Aβ accumulation inside neurons and tau phosphorylation, among other physiological alterations [42]. Together, these observations suggest that intracellular AβPP fragments or Aβ1 - 42, rather than extracellular Aβ42 peptide deposition, might represent early-stage pathology in individuals with PSEN1 E280A FAD [43]. Furthermore, our observations support the view that the iAβPP fragments identified by antibody 6E10, mass spectrometry [22] and flow cytometry (this work) trigger OS and hyperphosphorylation of intracellular tau protein in a time-dependent manner in CS-derived ChLNs, probably through a mechanism involving JNK kinase [22]. Moreover, the observation that mutant CSs, but not WT CSs, were unresponsive to ACh suggests that the mutant CSs have altered endogenous physiological Ca2+ influx. In agreement with previous studies [44], our observations suggest that the accumulation of iAβPP fragments precedes tau pathology. These findings support the idea that iAβPP fragments and/or Aβ42 trigger early neurotoxicity in FAD [45, 46] and represent an early stage in the pathology of AD [43]. However, whether iAβPP fragments and/or Aβ42 provoke neuronal apoptosis (represented in this work by loss of ΔΨm and CASP3-positive cells) or necrosis [43] deserves further investigation. Regardless of the mechanism, intracellular Aβ is increasingly recognized as a prominent player in cholinergic neuronal demise and as a basis for new treatment approaches, e.g., bioactive polyphenols, cannabinoids, and bifunctional anti-(i)amyloid and anti-OS agents [23, 47–49].
We also report here for the first time that EGCG and aMT in combination are highly effective in improving pathological (i.e., iAβPPf and p-tau), OS (i.e., DJ-1 Cys106-SO3), and apoptosis indicators in PSEN1 E280A CSs. These observations might be explained by the effect of each of the components of the mixture. Indeed, we found that both EGCG and aMT display high antioxidant capacity and that the antioxidant capacity of the combined EGCG/aMT was even higher (e.g., 3.35-fold and 2.34-fold increases in ORAC value compared to EGCG and aMT, respectively). We found that EGCG blunted the generation of H2O2, as reflected by a reduction in the level of oxDJ-1 [50], inhibition of amyloid accumulation [23, 51], increased disassembly of full-length tau protein [52], blockade of the activation of the main apoptosis factors CASP3 and nuclear fragmentation, and increased ΔΨm, and thereby increased the survival of mutant CSs to a similar extent as WT CSs. Likewise, we found that aMT was also highly effective as a neuroprotective agent against intrinsic insults in PSEN1 E280A CSs. aMT not only efficiently scavenged H2O2 by acting as an antioxidant [53] but also reduced the accretion of iAβPPf, possibly through direct interaction with amyloid, thereby protecting CSs against iAβPPf toxicity [54, 55]. Furthermore, aMT almost completely blocked hyperphosphorylation of tau protein ([56] and references therein), restored ΔΨm [57], and inhibited iAβPPf-induced apoptosis in mutant CSs by inactivating CASP3 [55, 58]. These observations are consistent with the idea that both the combination of EGCG/aMT and EGCG and aMT individually act as antioxidants, antiamyloidogenic agents, inhibitors of tau aggregation, and blockers of apoptosis. In agreement with previous observations [23], EGCG altered Ca2+ influx in response to ACh in PSEN1 E280A CSs. However, mutant CSs were almost unresponsive to ACh when exposed to a combination of aMT and EGCG. Moreover, aMT reduced the beneficial effect of EGCG on Ca2+ influx in mutant CSs. How aMT affects Ca2+ influx in CSs is not yet known. A possible explanation for our observations is that aMT either interacts directly with cholinergic receptors (e.g., nAChR [59]), blocking their interaction with ACh and thereby inhibiting voltage-activated calcium currents [60], or increases Ca2+ efflux from CSs. Additional research is required to clarify this issue. Regardless of the mechanism, our results show that aMT does not contribute to the restoration of Ca2+ influx in mutant CSs.
Several studies have shown that EGCG is not only an effective antioxidant (e.g., [61]) but that it also possesses anti-amyloidogenic properties [62]. Our current observations support this interpretation. In agreement with others [63–66], we found that EGCG displays high antioxidant activity according to the ORAC test. Furthermore, EGCG significantly reduced iAβPP accumulation. These results suggest that early inhibition of iAβPP and quenching of ROS, specifically H2O2, block further signaling that would otherwise lead to cell death. Interestingly, EGCG can be enzymatically modified to enhance its lipophilicity and antioxidant properties [67]. Unfortunately, no information on the antioxidant effects of such compounds on human cells is currently available. Such derivative compounds might be used to help prevent OS-induced neuronal cell death in FAD. Likewise, in agreement with others, we found that aMT displays antioxidant capacity according to the ORAC assay [68, 69]. This might explain why aMT is effective in alleviating OS induced by H2O2 in PTr2 cells [70] and in mutant E280A CSs (this work). We showed here, however, for the first time that the combined action of two antioxidant agents, EGCG and aMT, is even more efficient in protecting mutant CSs. However, further experiments are necessary to establish whether the combined action of EGCG and aMT is additive or synergistic [71].
Conclusion
Familial AD, most cases of which are caused by mutations in PSEN1, e.g., PSEN1 E280A, is a complex neurodegenerative malady in which progressive neuronal deterioration occurs, leading to loss of memory. It is now accepted that intracellular Aβ, rather than extracellular Aβ aggregation, is the likely cause of neuronal cell death. We have shown that early generation and accumulation of iAβPPf are responsible for initiating cellular events that lead to ROS (H2O2) production, hyperphosphorylation of tau, activation of proapoptotic proteins (e.g., CASP 3), alterations in Ca2+ influx, and apoptosis in ChLNs [22] and in CSs (this work). It is, therefore, reasonable to assume that drugs designed to eliminate Aβ-induced signaling cell death targets/or pathological signals may have cooperative (additive or synergistic) effects. Consistent with this view, combined use of EGCG and aMT has proven to be highly useful in almost completely reducing intracellular AβPPf, OS, p-tau, loss of ΔΨm, and apoptotic markers in PSEN1 E280A CSs. However, aMT and EGCG in combination were ineffective at restoring Ca2+ influx in mutant CSs because of their antagonistic action. Therefore, our present observations provide a cautionary note regarding the use of aMT to restore physiological functions associated with Ca2+ influx. However, this limitation might be overcome by delivering EGCG (e.g., [72]) and aMT (e.g., [73]) nanoparticles to specific brain neurons (e.g., cholinergic or pyramidal) that can be directly loaded with the cargo (EGCG and aMT) intracellularly. Further investigation is needed to validate the effectiveness of using combined EGCG and aMT in the early treatment of FAD patients carrying the PSEN1 E280A mutation.
Footnotes
ACKNOWLEDGMENTS
We are grateful to the Bioactive Substances Service and Research Group (SIU-UdeA) for ORAC testing.
FUNDING
This work was funded by MinCiencias (grant. no. 1115-807-62912, contract no. 749-2018).
CONFLICT OF INTEREST
The authors have no conflict of interest to report.
DATA AVAILABILITY
All datasets generated for this study are included in the manuscript.