
Abstract
Background:
Most studies using diffusion-weighted MRI (DW-MRI) in Alzheimer’s disease (AD) have focused their analyses on white matter (WM) microstructural changes using the diffusion (kurtosis) tensor model. Although recent works have addressed some limitations of the tensor model, such as the representation of crossing fibers and partial volume effects with cerebrospinal fluid (CSF), the focus remains in modeling and analyzing the WM.
Objective:
In this work, we present a brain analysis approach for DW-MRI that disentangles multiple tissue compartments as well as micro- and macroscopic effects to investigate differences between groups of subjects in the AD continuum and controls.
Methods:
By means of the multi-tissue constrained spherical deconvolution of multi-shell DW-MRI, underlying brain tissue is modeled with a WM fiber orientation distribution function along with the contributions of gray matter (GM) and CSF to the diffusion signal. From this multi-tissue model, a set of measures capturing tissue diffusivity properties and morphology are extracted. Group differences were interrogated following fixel-, voxel-, and tensor-based morphometry approaches while including strong FWE control across multiple comparisons.
Results:
Abnormalities related to AD stages were detected in WM tracts including the splenium, cingulum, longitudinal fasciculi, and corticospinal tract. Changes in tissue composition were identified, particularly in the medial temporal lobe and superior longitudinal fasciculus.
Conclusion:
This analysis framework constitutes a comprehensive approach allowing simultaneous macro and microscopic assessment of WM, GM, and CSF, from a single DW-MRI dataset.
Keywords
INTRODUCTION
Alzheimer’s disease (AD) is a neurodegenerative brain disease that causes cognitive impairment and is the most common cause of dementia. In the AD continuum, when individuals exhibit symptoms of cognitive dysfunction but their activities of daily living are not affected, they are diagnosed with mild cognitive impairment (MCI). Brain atrophy is recognized as one of the pathological features most proximate to cognitive decline [1]. Early observational studies using magnetic resonance imaging (MRI) identified hippocampal [2] and medial temporal lobe atrophy [3] as macroscopic landmarks of the disease [4], which are nowadays accepted as biomarkers for disease staging and risk assessment [1, 5].
Several studies have investigated the effect of AD on brain anatomy using MRI, most of them focused on gray matter (GM) degeneration and cortical atrophy patterns [6–18]. In contrast to structural MRI, diffusion-weighted MRI (DW-MRI) allows revealing microstructural effects of AD, mostly in the white matter (WM) where the diffusion of water is shaped by the architecture of axonal membranes and myelin sheaths. Most diffusion studies in AD and MCI have used the diffusion tensor model and its derived metrics, such as fractional anisotropy (FA) and mean diffusivity (MD), to detect WM degeneration induced by the disease. Consistent findings across tensor-based studies reveal a widespread increase of MD in the WM and decrease of FA in certain WM areas including the splenium, cingulum bundle, superior longitudinal fasciculus, uncinate fasciculus, and parahippocampal gyrus [19–24]. Research in the early stages of AD has suggested that WM microstructural degeneration is not always secondary to neuronal loss [25] and may be an early pathological feature preceding detectable hippocampal atrophy [26, 27].
Some studies have also reported a counter-intuitive increase of FA in crossing fiber areas such as the corticospinal tracts for AD patients compared to controls [20, 28]. The increase of FA can be explained by the partial loss or degeneration of specific fiber populations in WM regions where multiple fiber bundles with different directions meet, which are both highly prevalent in the human brain WM [29] and cannot be faithfully represented by the diffusion tensor model. More complex models are therefore needed to infer fiber-specific information from diffusion MRI. Constrained spherical deconvolution (CSD) was introduced to overcome that limitation by modeling the WM in each voxel as a continuous fiber orientation distribution function (fODF) [30]. To estimate these fODFs, traditional CSD requires high angular resolution DW-MRI acquired with a constant non-zero diffusion weight (b-value), also referred to as a single-shell acquisition. Fiber-specific measures derived using CSD on single-shell data have been recently used to investigate WM differences between healthy controls and patients with AD, finding degeneration along specific fiber pathways such as the splenium of the corpus callosum (CC), the cingulum bundle in its posterior and parahippocampal aspects, the uncinate fasciculus, and the arcuate fasciculus [31].
Given the limited spatial resolution of DW-MRI, the observed diffusion signal in a voxel might originate from multiple tissue types and/or the surrounding cerebrospinal fluid (CSF). These partial volume effects (PVE) can affect diffusion measures of microstructural integrity [32]. For instance, when the PVE due to CSF contamination is corrected in the GM, differences in MD between controls and AD patients are attenuated [33], suggesting that previously reported diffusion abnormalities in GM areas [34] were likely due to CSF contamination caused by macroscopic atrophy rather than a change in GM microstructural properties. The PVE also affects traditional “single-shell” CSD, where the diffusion-weighted signal is modeled solely as WM content and thus spurious features and biases in quantitative parameters are produced in the presence of GM or CSF [35].
The contribution of each tissue type to the signal can be quantified by exploiting their distinct diffusion signal dependency on the b-value. As CSF signal decays much faster than GM and WM signals, it is possible to distinguish between CSF signal and tissue signal using only one non-zero b-value in conjunction with the corresponding b = 0 data. Therefore, diffusion measures can be corrected for CSF contamination at interfaces between WM/CSF and GM/CSF in studies using single-shell data [31, 36]. However, to reliably discriminate between WM, GM, and CSF signal profiles, more than one non-zero b-value is needed. When DW-MRI is acquired with a multi-shell scheme, it is possible to separate the observed signal in a voxel into the contributions from each tissue type. Multi-shell multi-tissue constrained spherical deconvolution (MSMT-CSD) [35] uses the different tissue signal dependencies on the b-value to improve fODF estimation by quantifying the portion of the signal attributed to each macroscopic tissue type (WM-, GM-, and CSF-like). Therefore, in addition to effectively correcting for PVE in the WM modeling, this approach provides diffusion-derived measures of tissue-like content within each voxel.
In this work, we aimed to exploit the advantages of MSMT-CSD to investigate AD-related brain changes using multi-shell diffusion MRI. Tissue-specific microstructural properties are represented by a multi-tissue model composed of the PVE-corrected WM fODF along with the contributions of GM and CSF to the diffusion signal. Macroscopic changes in brain anatomy are captured by the deformation fields involved in spatial normalization of multi-tissue information to a study-specific template. Differences between control subjects, patients with MCI, and dementia due to AD are interrogated by comparing fiber-specific measures of WM integrity, local tissue-like decompositions, and local volumetric changes. Linear relations between these measures and CSF biomarkers were also explored in a small sub-sample of the data. The analyses herein presented integrate the strategies of Fixel-Based Analysis (FBA) [37, 38], Voxel-Based Morphometry (VBM), and Tensor-Based Morphometry (TBM) [39–41]. The simultaneous use of these strategies helps to disentangle micro- and macroscopic effects, while the employed diffusion-derived measures allow to gain some insight into the nature of observed differences between symptomatic stages along the AD continuum.
MATERIALS AND METHODS
Study participants
Patients with MCI due to AD (n = 29) and AD dementia (ADD) (n = 23), as well as cognitively healthy controls (n = 27) were included in the study (see Table 1). The diagnosis of MCI due to AD and ADD was done according to the NIA-AA research criteria [42] while taking into account clinical data, neuropsychological examination, structural MRI, and, in some cases, CSF biomarkers using validated cutoff values [43, 44]. Control group consisted of volunteers for biomarker research having a normal neuropsychological examination and no evidence of central nervous system pathology after extensive investigation [45]. The study was approved by the local ethics committee and all subjects gave written informed consent.
Description of data per group: cognitively healthy controls (CO), patients with mild cognitive impairment (MCI) due to AD, and AD dementia (ADD)
The fourth column corresponds to the subjects for whom cerebrospinal fluid (CSF) biomarkers were examined within 3 months before/after MRI acquisition, from this subset, patients with abnormal CSF levels of Aβ1–42 (<638.5 pg/mL) are presented in the fifth column. The final column indicates the number of subjects in each group for which data were acquired before versus after the scanner hardware upgrade. Sd, standard deviation.
All tools for data pre-processing, modelling, and statistical analysis are available as part of the MRtrix software package (https://www.mrtrix.org/). The MRI data that support the findings of this study are not publicly available due to restrictions imposed by the administering institution and the privacy of the participants.
Image acquisition and pre-processing
Data were acquired on a Siemens 3T MRI scanner with a (32)-channel head coil using a multi-slice, single-shot EPI, spin-echo imaging sequence. Diffusion weightings of b = 0, 700, 1000 and 2800 s/mm2 were applied in 10, 25, 40, and 75 directions, respectively. Other imaging parameters were: voxel size of 2.5×2.5×2.5 mm3, matrix size of 96×96, and 40 axial slices. During the study, the gradient set of the MRI scanner was upgraded from 40 to 80 mT/m; following this upgrade, the sequence TR and TE were changed from 6000/116 ms to 5900/83 ms, with all other parameters remaining fixed. The acquisition time was approximately 16 min. A T1-weighted MR image was additionally acquired with a voxel size of 1×1×1 mm3.
Each DW-MRI dataset was pre-processed using a state-of-the-art pipeline. Data were first denoised using random matrix theory, thereby increasing the signal-to-noise ratio (SNR) without spatially smoothing the data [46]. Then, Gibbs-ringing artifacts were suppressed [47], head motion and eddy current-induced distortions were corrected [48, 49], and inhomogeneities of the B1 field were accounted for [50]. Finally, images were up-sampled to 1.25×1.25×1.25 mm3 to improve the accuracy of subsequent spatial normalization [51, 52]. Preprocessing was performed using MRtrix3 (version 3.0.2) [53] (https://www.mrtrix.org/). Note that the MRtrix3 scripts invoke the “eddy” tool from FSL and “N4BiasFieldCorrection” from ANTs [50]. The T1-weighted image was used to compute the intracranial volume (ICV) with SPM12 [54].
CSF biomarkers
From the 79 individuals, 37 underwent a lumbar puncture less than 3 months before or after image acquisition. This subset included 8 controls, 19 patients with MCI due to AD, and 10 patients with ADD. CSF biomarker analyses were performed with single parameter ELISA (Fujirebio, Belgium) kits following standard procedures [44]. CSF levels of amyloid-β of 42 amino acids (Aβ1–42), total tau (T-tau), and phosphorylated tau at threonine 181 (P-tau181) were considered to investigate linear relations of these biomarkers with measures derived from multi-shell DW-MRI.
DW-MRI processing
The methodology in this work can be divided into three parts. First, diffusion signal information in each image voxel is decomposed into the full WM fODF as well as the CSF and GM contributions using MSMT-CSD. Second, the tissue decomposition maps were spatially normalized across the study subjects by calculating a study-specific template and transforming all the subjects’ data to this template using a multi-channel registration method. Tissue constituency was described with a set of measures extracted from spatially normalized tissue maps, while local morphology was described examining the changes induced by the spatial normalization. In the third step, all information was analyzed with nonparametric hypothesis tests. A schematic overview of the pipeline is presented in Fig. 1. All steps were performed using MRtrix3 (version 3.0.2) [53] (https://www.mrtrix.org/).
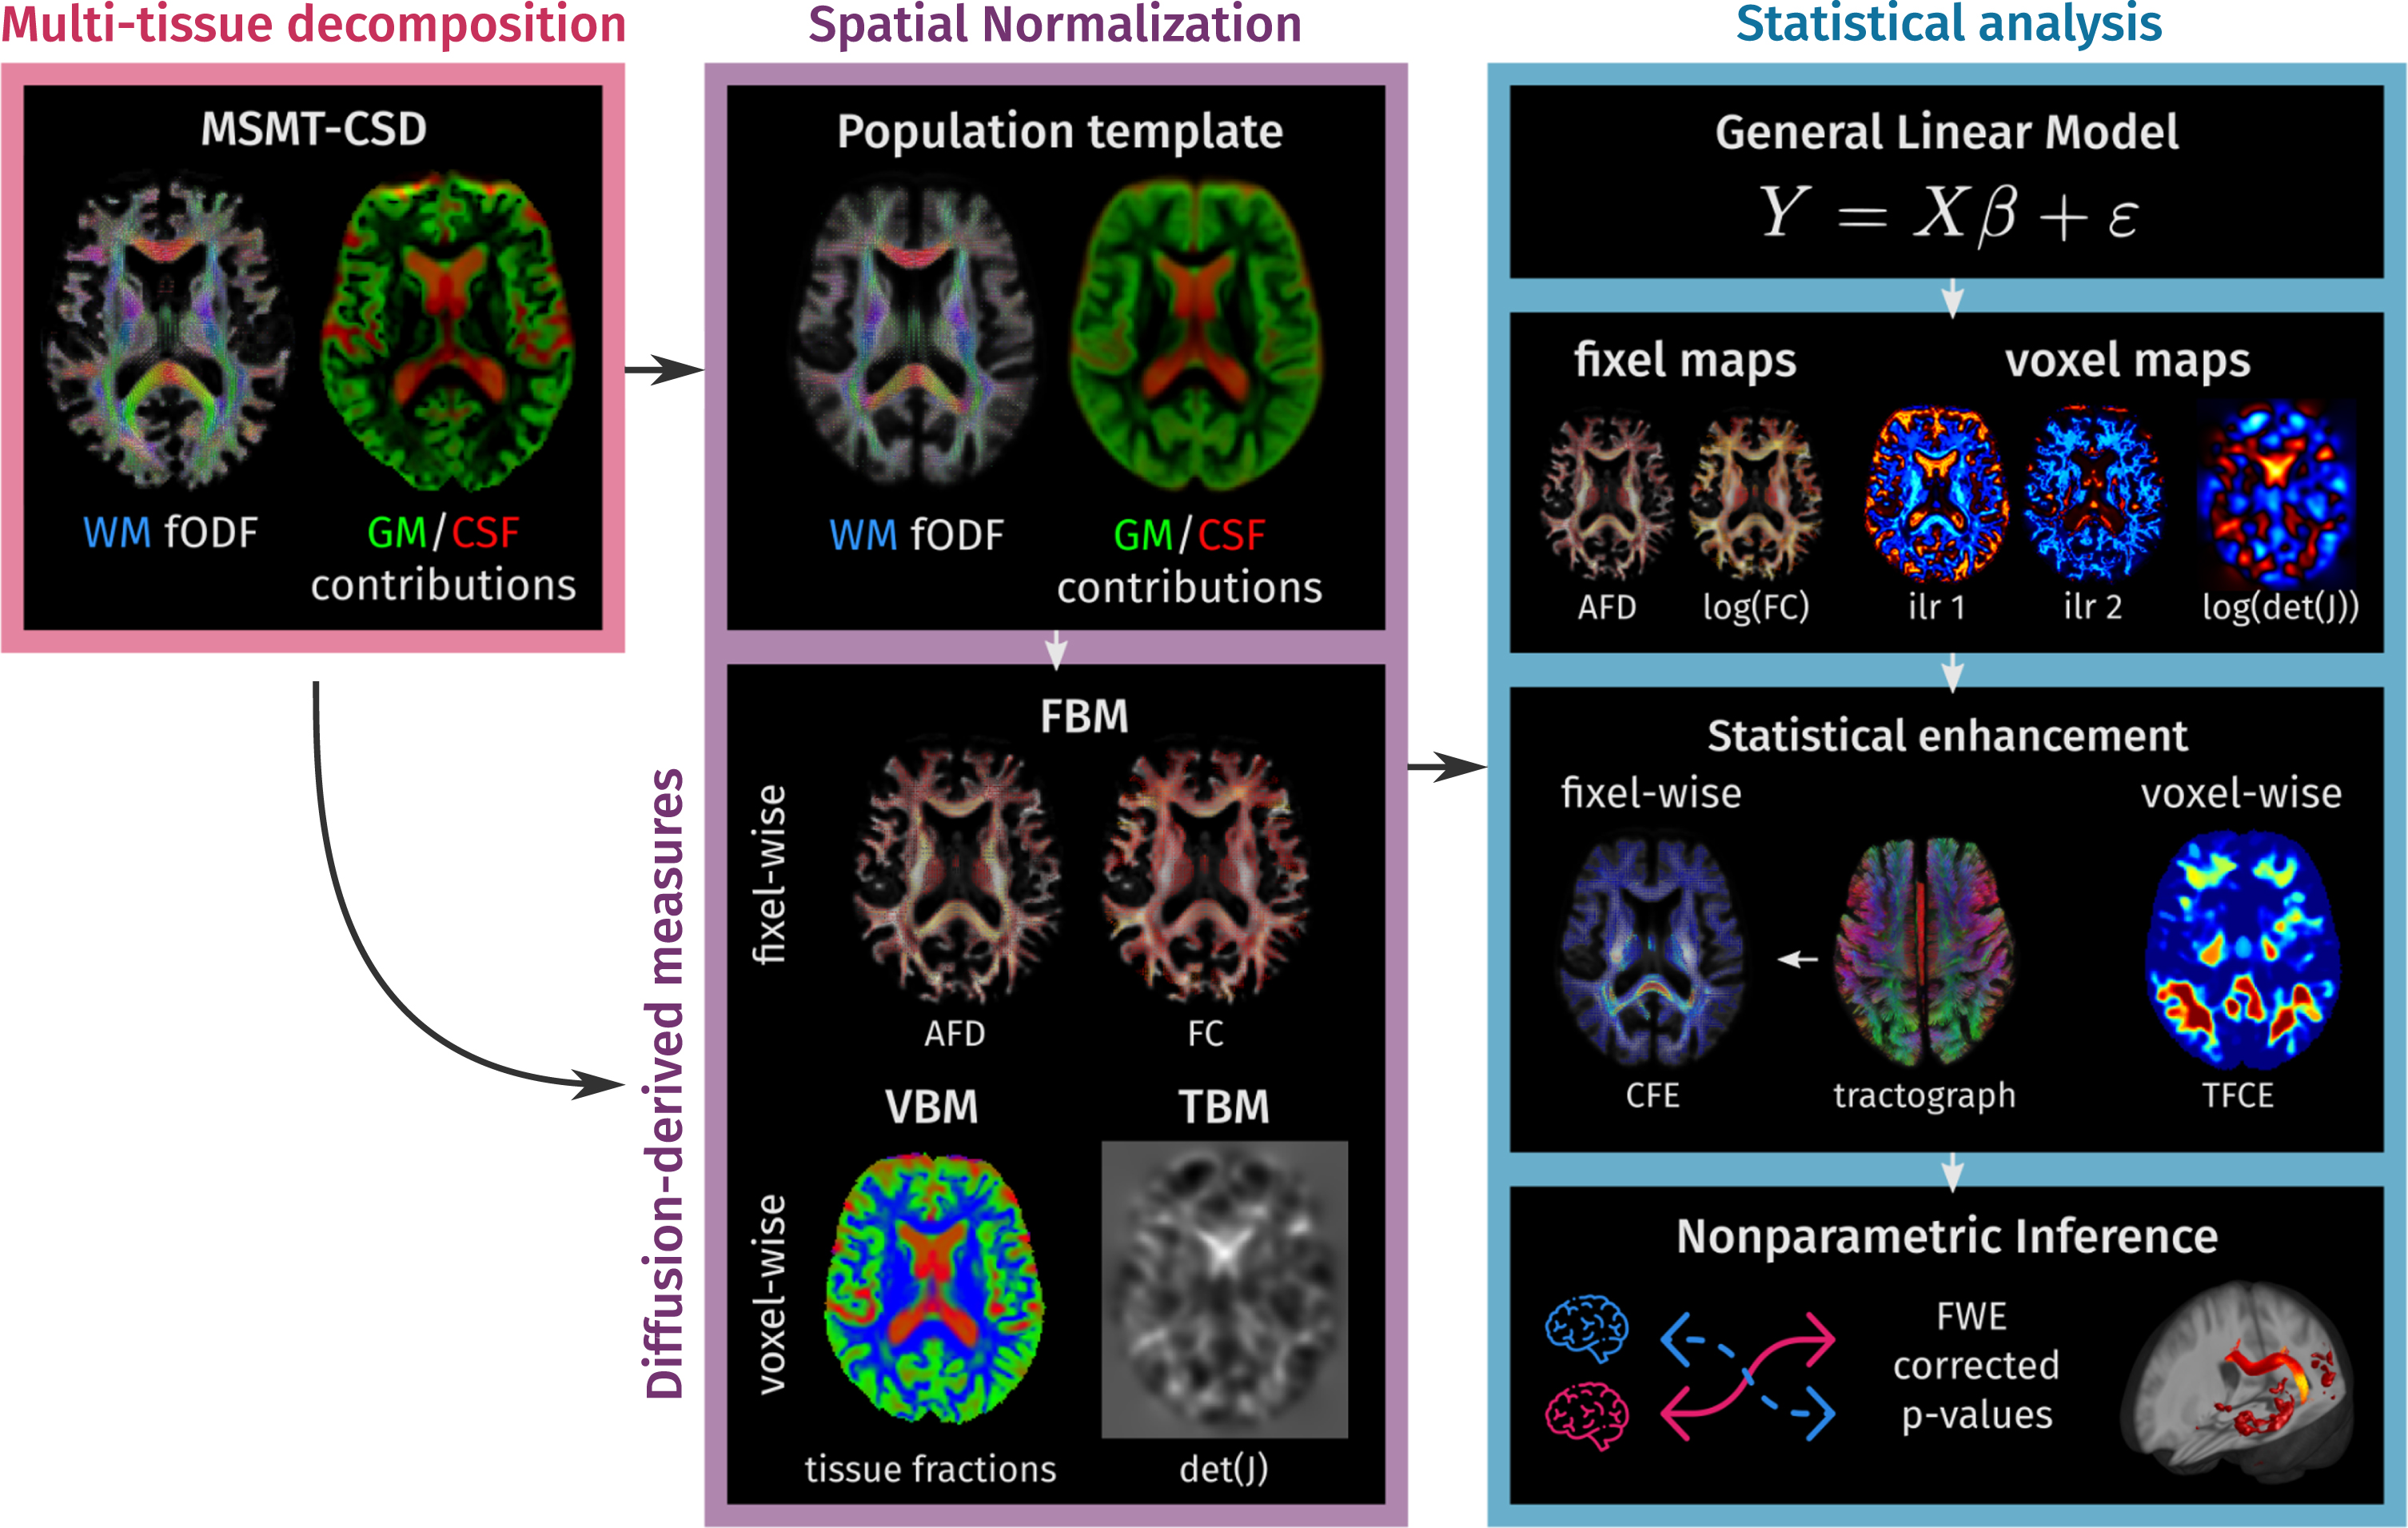
Methodology overview. In the first step, a multi-tissue decomposition is obtained from the multi-shell diffusion data. In the second part, the information is spatially normalized to a population template calculated for the study population. In template space, each subject is represented by a set of diffusion-derived measures that capture: fiber-specific morphology (Fixel-Based Morphometry), underlying tissue-like composition (Voxel-Based Morphometry), and local volumetric changes with respect to the population template (Tensor-Based Morphometry). Finally, statistical analyses are conducted following non-parametric inference strategies for fixel- and voxel-wise measures in parallel.
Multi-tissue decomposition
A multi-tissue model was obtained by applying MSMT-CSD to each DW-MR dataset. To perform MSMT-CSD, a representative signal response for each of WM, GM, and CSF was estimated using an unsupervised method based on specific tissue diffusivity properties [55]. Average tissue responses were obtained across subjects (separate average responses were calculated for the scans acquired before the upgrade and for those acquired after the upgrade to facilitate consistent tissue decompositions before and after the upgrade), and then, using these averaged tissue responses, MSMT-CSD was applied to each dataset. To assure WM fODF, GM, and CSF contribution maps were comparable across subjects they were intensity normalized with a multi-tissue informed approach [56, 57]. The resulting multi-tissue decomposition consists of the WM fODF along with the GM and CSF contributions to the signal, the WM contribution map is extracted from the WM fODF as l = 0 term of the spherical harmonic (SH) expansion [58]. The minimum contribution of each tissue-like component was set at 1e–8.
Spatial normalization
A study-specific template was built from a set of 24 cases including 12 controls, 6 patients with MCI, and 6 patients with AD. These sub-groups were age-matched and balanced by gender. This multi-tissue population template was constructed with an iterative atlas building framework [59] that used a multi-channel nonlinear diffeomorphic registration algorithm [60] to align the fODFs as well as the GM and CSF-like contribution maps (see Fig. 2). Afterwards, the same registration algorithm was applied to align the multi-tissue decompositions for all participant scans to the population template.
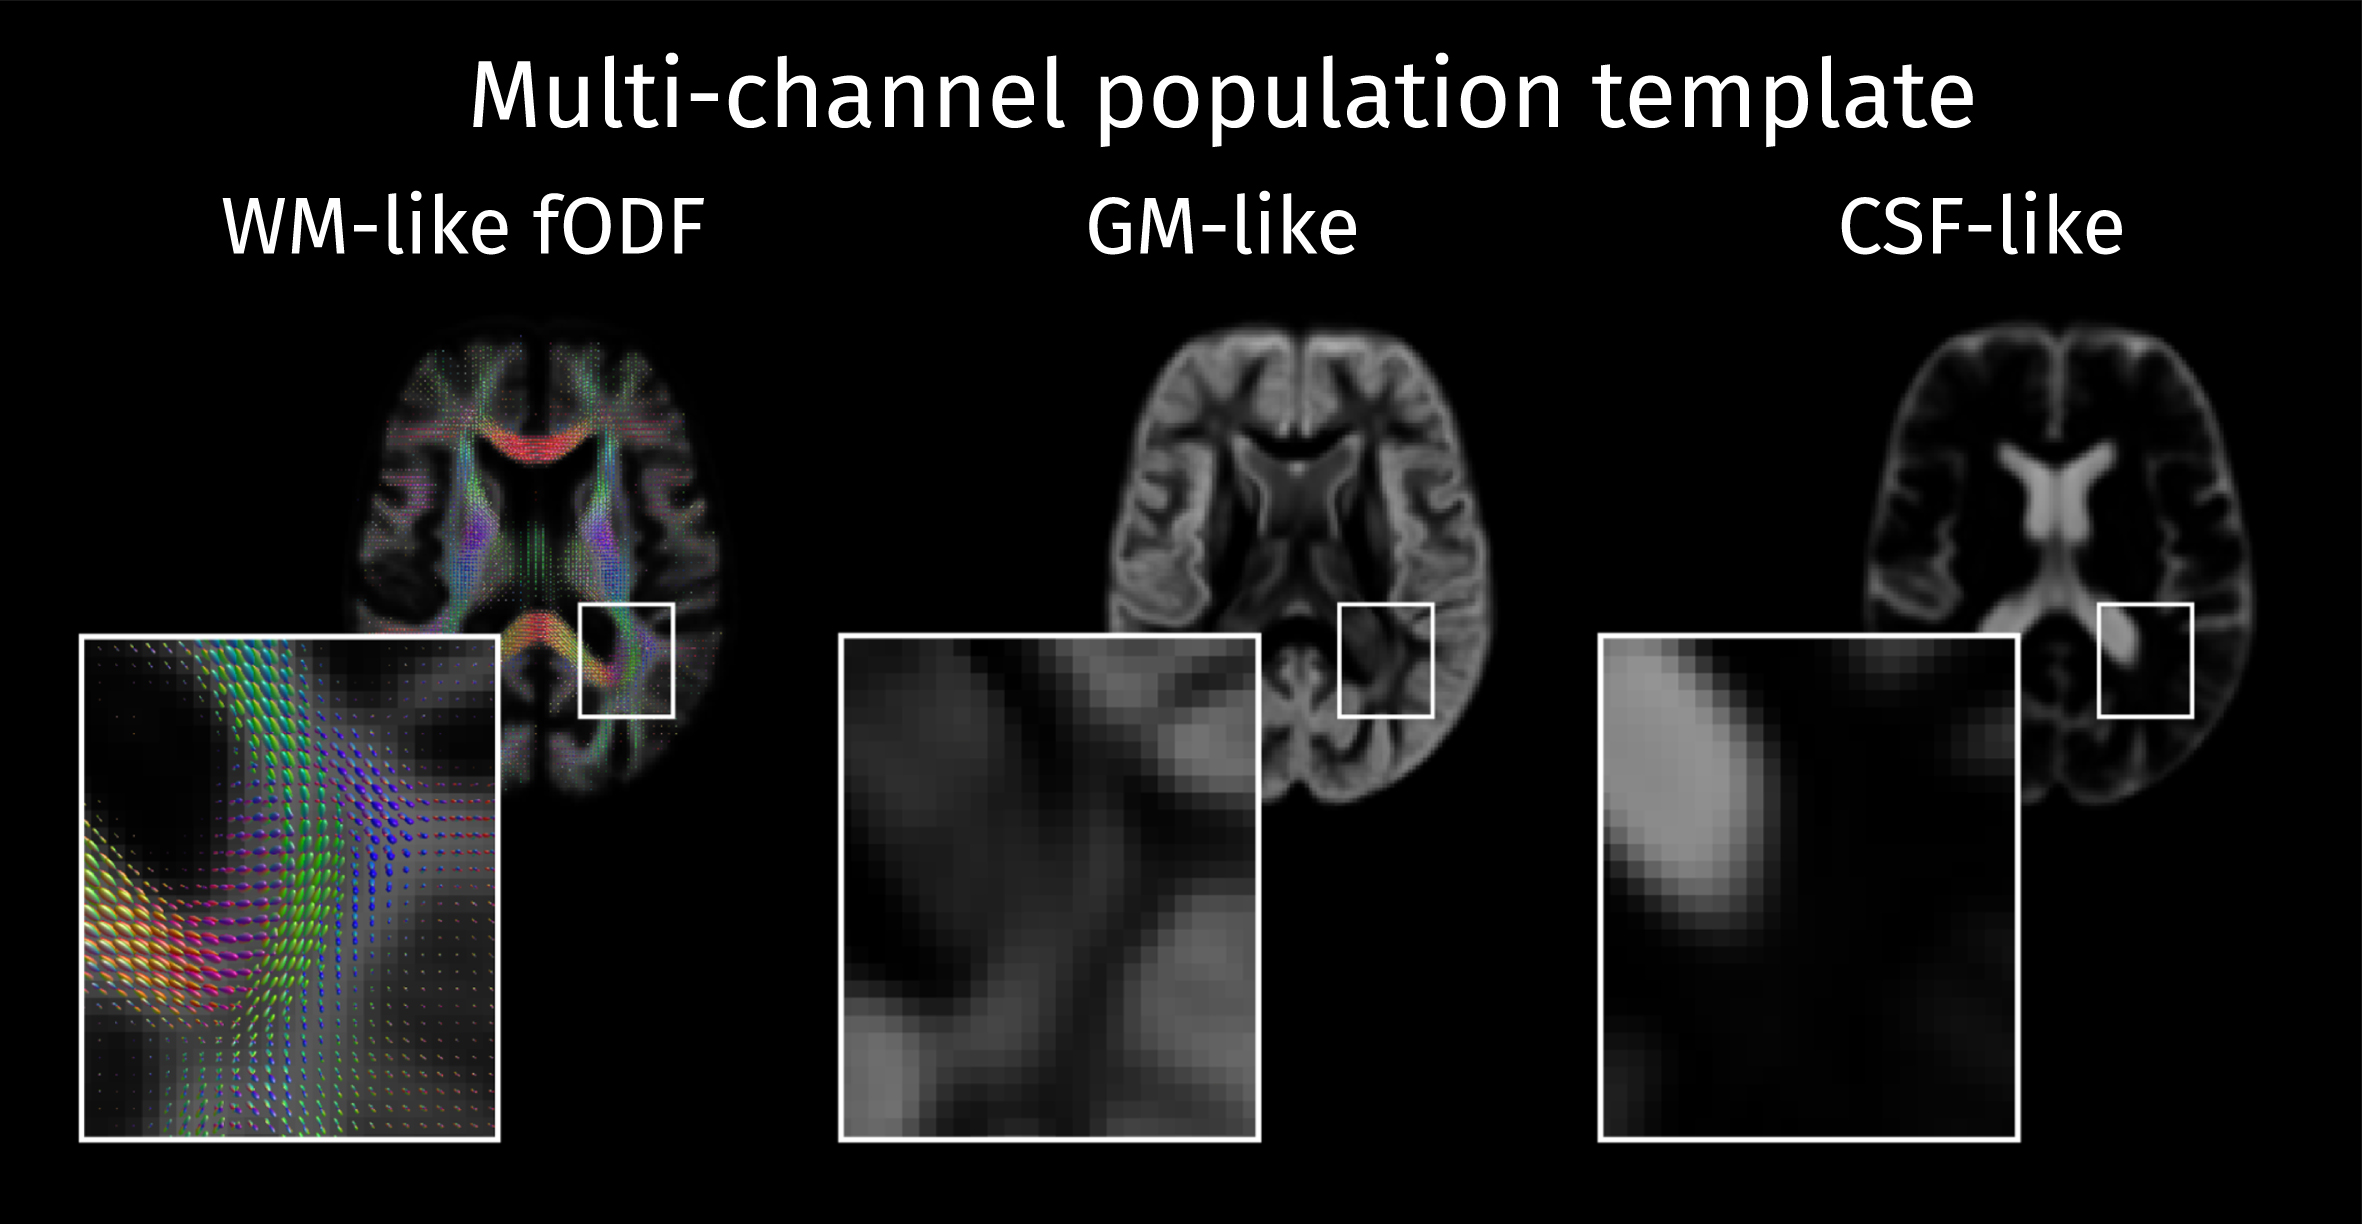
The study-specific population template is composed of a white matter fiber orientation distribution function (WM fODF) template along with the voxel-wise templates containing the tissue-like contributions for GM and CSF.
Diffusion-derived measures
The fODF is a continuous function represented in the SH basis, which can represent multiple fiber populations crossing within a single voxel. To facilitate quantification and statistical analysis, these are segmented to estimate within each voxel a finite number of discrete fiber populations [61]. The term fixel is used to refer to a specific population of fibers oriented in a specific direction within a voxel [62]. The integral of the fODF ascribed to each fixel is proportional to the volume of fibers aligned in the corresponding direction; this measure is known as apparent fiber density (AFD) [51] and it has been demonstrated to effectively quantify specific fiber integrity in crossing fiber regions [63]. The AFD values extracted from the fODF can be mapped to their respective fixels as shown in Fig. 3.
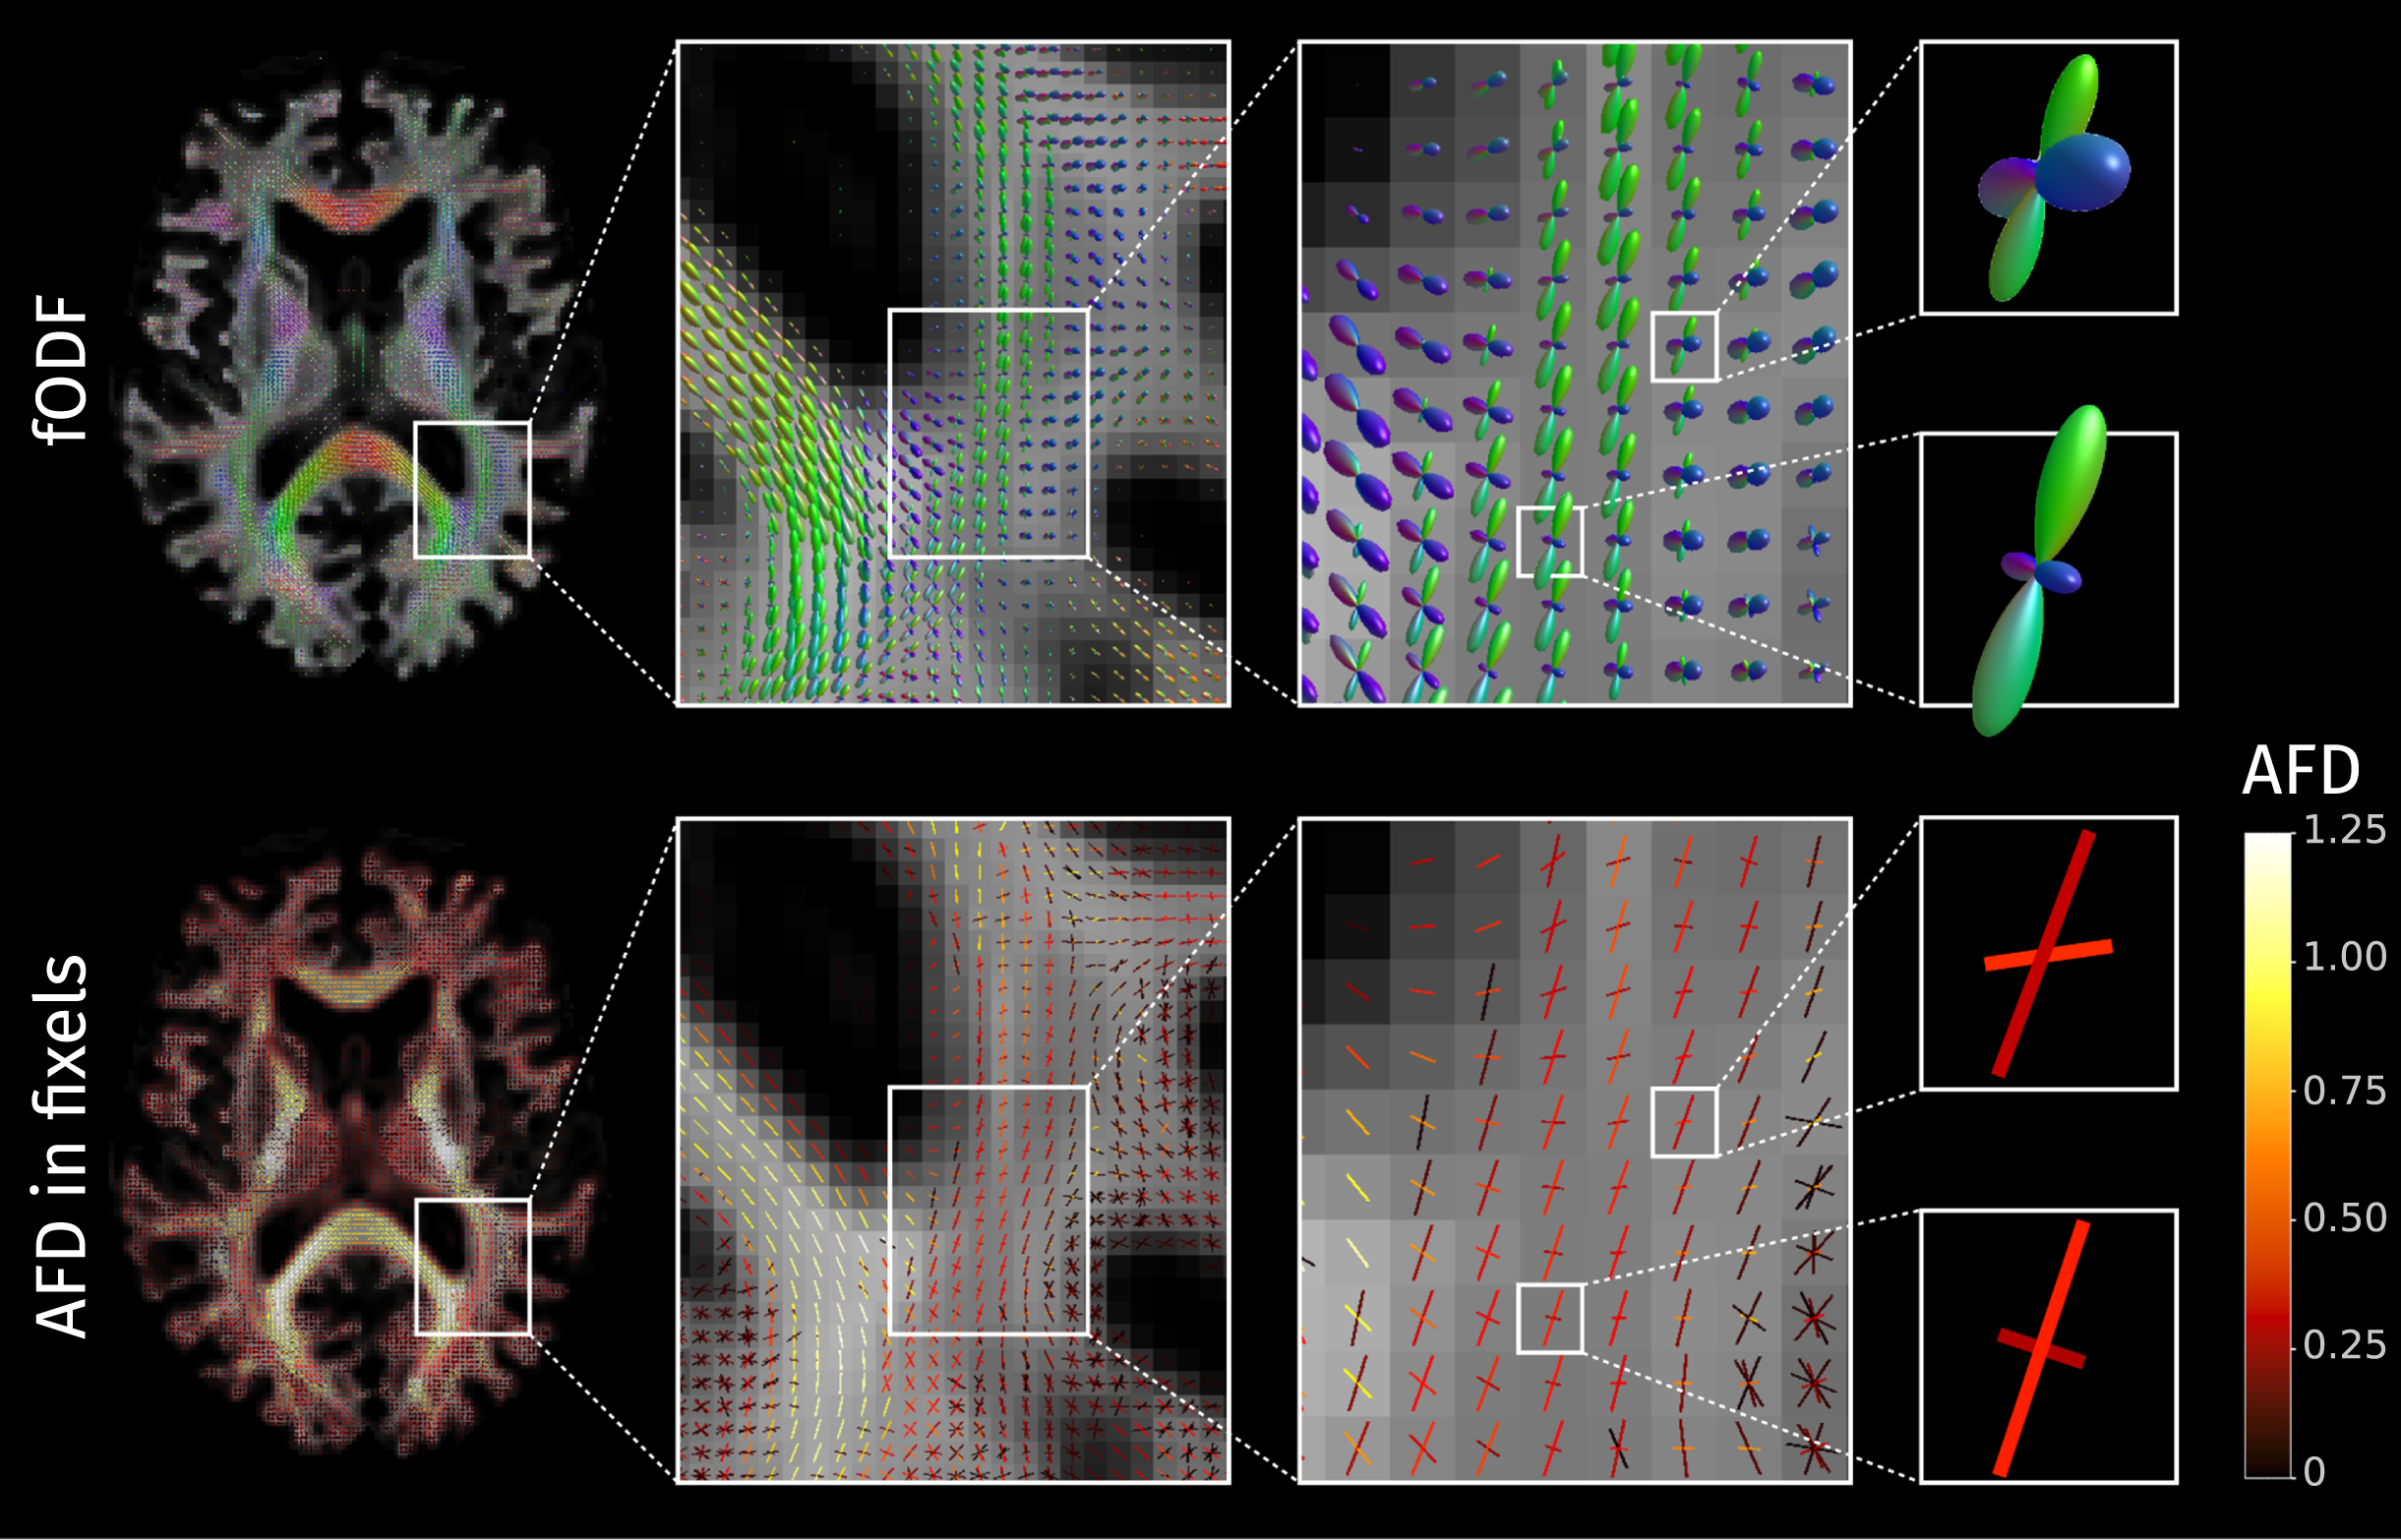
The fiber orientation distribution functions (fODF) can encode multiple fiber populations within a single voxel; each of these fiber populations is described with directional elements called “fixels". In the bottom row, each fixel is here colored according to the value of apparent fiber density (AFD).
During the spatial normalization process, the multi-tissue model is warped to match the population template. When applied to voxel maps, the warping causes expansion or contraction of regions in the spatially normalized image. In a particular voxel, this volumetric change (with respect to the population template) is captured by the determinant of the Jacobian matrix J. This concept has been extended to the fixel-based analysis framework by accounting for the effect of the Jacobian transformation along different fiber directions [37, 51]. Given a unitary vector f specifying a fiber direction (also known as a ‘fixel’) the change in scale along this direction is ∥Jf∥, and the total volumetric change is the product between ∥Jf∥ and the change in the area perpendicular to f; the latter of these is a measure of the variation in fiber bundle cross-section (FC) [37, 51] and is calculated as:
The determinant of the Jacobian as well as the fiber bundle cross-section measure are not absolute measures of volume or area but rather measures of morphological changes relative to the population template. When one of these measures is smaller than one, the corresponding features are smaller in the subject space than in the template space, and vice-versa.
In some neuroimaging analysis pipelines, a modulation step is carried out to adjust for the effects of spatial normalization by combining the model-derived spatially normalized measures with the macroscopic changes induced by the deformation. Although this step was conceived to capture both mesoscopic and macroscopic abnormalities, it has been shown that the use of modulated measures for hypothesis testing can lead to decreased sensitivity, probably due to the introduction of multiplicative noise [64]. In our analyses, we treated model-derived measures and deformation-derived measures separately.
To ensure model-derived measures (tissue-like contributions and AFD) represent true fractions of the signal, they were divided by the sum of the three tissue-like contributions at each voxel. In template space, each subject is described by two fixel-wise and four voxel-wise measures. The fixel-wise measures are the two fiber-specific measures: AFD and the FC area. The voxel-wise measures are the three tissue-like fractions and the determinant of the Jacobian matrix.
Statistical analysis
Hypothesis testing to detect differences of measures between controls, MCI, and ADD patients was done using the General Linear Model (GLM) framework including age, gender, ICV, and scanner version (before versus after update) as covariates. Analyses of fixel- and voxel-wise measures were performed separately and each one involved two steps: first, an omnibus F-test was employed to detect any group effect in any of the investigated measures. Then, post hoc t-tests were used to identify directed pairwise group differences for each measure only within the brain areas that showed significant effects according to the initial F-test. In both steps, family-wise error (FWE) corrected p-values were calculated in a non-parametric way using random permutations to compute the empirical null distributions associated with the enhanced test statistics [65–67]. In this study, permutation testing was conducted with 5000 permutations and the significance level for all tests was set at α= 0.05.
Analyses of fixel- and voxel-wise measures followed the principles of FBA [37, 68], VBM, and TBM [39–41], respectively. These approaches are closely related and include equivalent steps: data smoothing, enhancement of the test statistic map, and calculation of p-values with correction for multiple comparisons. The FWE correction used in this work addresses multiple testing problems that arise from testing each hypothesis in many fixels/voxels (MTP-I), and from testing the multiple hypotheses that arise due to the presence of multiple groups and multiple measures (MTP-II) [66, 67].
Analysis of fixel-wise measures
Smoothing and statistical enhancement of fixel-wise quantitative parameters were based on a fixel-fixel connectivity matrix, encoding fractional connectivity between fixels based on streamlines tractography. A whole-brain tractogram of 10 million streamlines was generated from the population fODF template using the iFOD2 algorithm [69]; from this, a subset of 2 million streamlines was extracted using the Spherical-deconvolution Informed Filtering of Tractograms (SIFT) method [61] to reduce density biases in the reconstruction. Elements of the fixel-fixel connectivity matrix are calculated as the fraction of streamlines intersecting one fixel that also intersect another fixel [62]. These data were used both for smoothing of fixel-wise measures weighting a Gaussian kernel with FWHM = 10 mm, and for performing statistical enhancement via Connectivity-based Fixel Enhancement (CFE), for which the default parameters were used (E = 2; H = 3; C = 0.5). The initial omnibus F-test was performed to detect any group effect across the two fixel-wise measures: AFD and FC (log-transformed for normality). Post hoc analysis consisted of testing 12 contrasts in the GLM (3 pairs of groups×2 measures×2 effect directions) while applying strong correction for multiple comparisons [66].
Analysis of voxel-wise measures
Statistical analysis of the three tissue-like fractions {T
csf
, T
gm
, T
wm
} should take into account the compositional nature of this data: 0 < T
i
< 1 and T
csf
+ T
gm
+ T
wm
= 1. The latter implies the three tissue-like fractions are linearly dependent with only two degrees of freedom, therefore projecting them to a 2-dimensional space is more appropriate for the statistical analysis than treating the three measures independently. At each voxel, the tissue-like fraction values were mapped into a 2-dimensional space using the isometric log-ratio (ilr) transformation [70], an approach that was recently adopted to study the tissue composition of lesions in AD using DWI [71]. The two independent and unbounded isometric log-ratios were calculated as follows:
The isometric log-ratios can capture changes in the relation between the three tissue-like fractions. Increasing ilr1 values could reflect: a decreased WM-like fraction, accompanied by the increase of GM or CSF-like fractions, or an unchanged WM-like fraction with an increased product of GM and CSF-like fractions. Increases in ilr2 reflect an increase in the CSF-like fraction relative to the GM-like fraction. Before statistical analysis, voxel maps containing the ilr were smoothed using a 3D Gaussian kernel with FWHM = 5 mm (voxel maps are smoothed with a narrower Gaussian filter than the spatial kernel used for fixels due to the latter being additionally constrained by fixel-fixel connectivity).
Voxel-wise analysis of ilr serves the purpose of comparing local tissue compositions, which is the original objective of VBM [39, 40], with the difference that, in this case, tissue-like maps are obtained from the observed diffusion signal and not from a probabilistic segmentation of structural MRI. Meanwhile, analysis of the Jacobian determinant is the most common form of TBM, which aims to identify regional volumetric differences [40]. An initial omnibus F-test was performed to detect any group effect across the three voxel-wise measures: two isometric log-ratios and Jacobian determinant (log-transformed for normality). Post hoc testing for pairwise differences included strong correction of p-values over the 18 tests (3 pairs of groups×3 measures×2 effect directions). Enhancement of test statistics was done using Threshold-Free Cluster Enhancement (TFCE) method applied with default parameters (E = 0.5 and H = 2) [41].
Linear correlations with CSF biomarkers
Possible relationships between CSF biomarkers and tissue degeneration were explored by testing the linear correlations of levels of CSF Aβ1–42, total tau, and P-tau181 with the extracted fixel- and voxel-wise measures. The CSF levels of each biomarker were considered as a continuous regressor in a GLM that also included age, gender, ICV, and scanner as covariates. In these analyses, the relation of each biomarker with diffusion-derived measures was tested with two omnibus F-tests, one for fixel-wisel measures, and one voxel-wise measures. If any significant effects were detected, post hoc testing was performed while applying strong FWE correction across tests. Effects were considered significant when the FWE corrected p-values associated with the alternative hypotheses are below the significance level (α= 0.05).
RESULTS
Differences in fixel-wise measures
The integrity of WM fibers was evaluated using two fixel-wise measures: AFD and FC. The initial omnibus F-test identified an extensive set of fixels where the fiber measures differ across disease stages (FWE-corrected p < 0.05), Fig. 4 shows the streamline segments corresponding to those fixels where significant effects were detected. Effects are present in the splenium of the CC, the inferior longitudinal fasciculus (ILF), the uncinate fasciculus, the thalamo-occipital projection, the cortico-spinal tract (left), the cingulum bundle (right), the parahippocampal part of the cingulum bundle (left), and the left arcuate fasciculus.
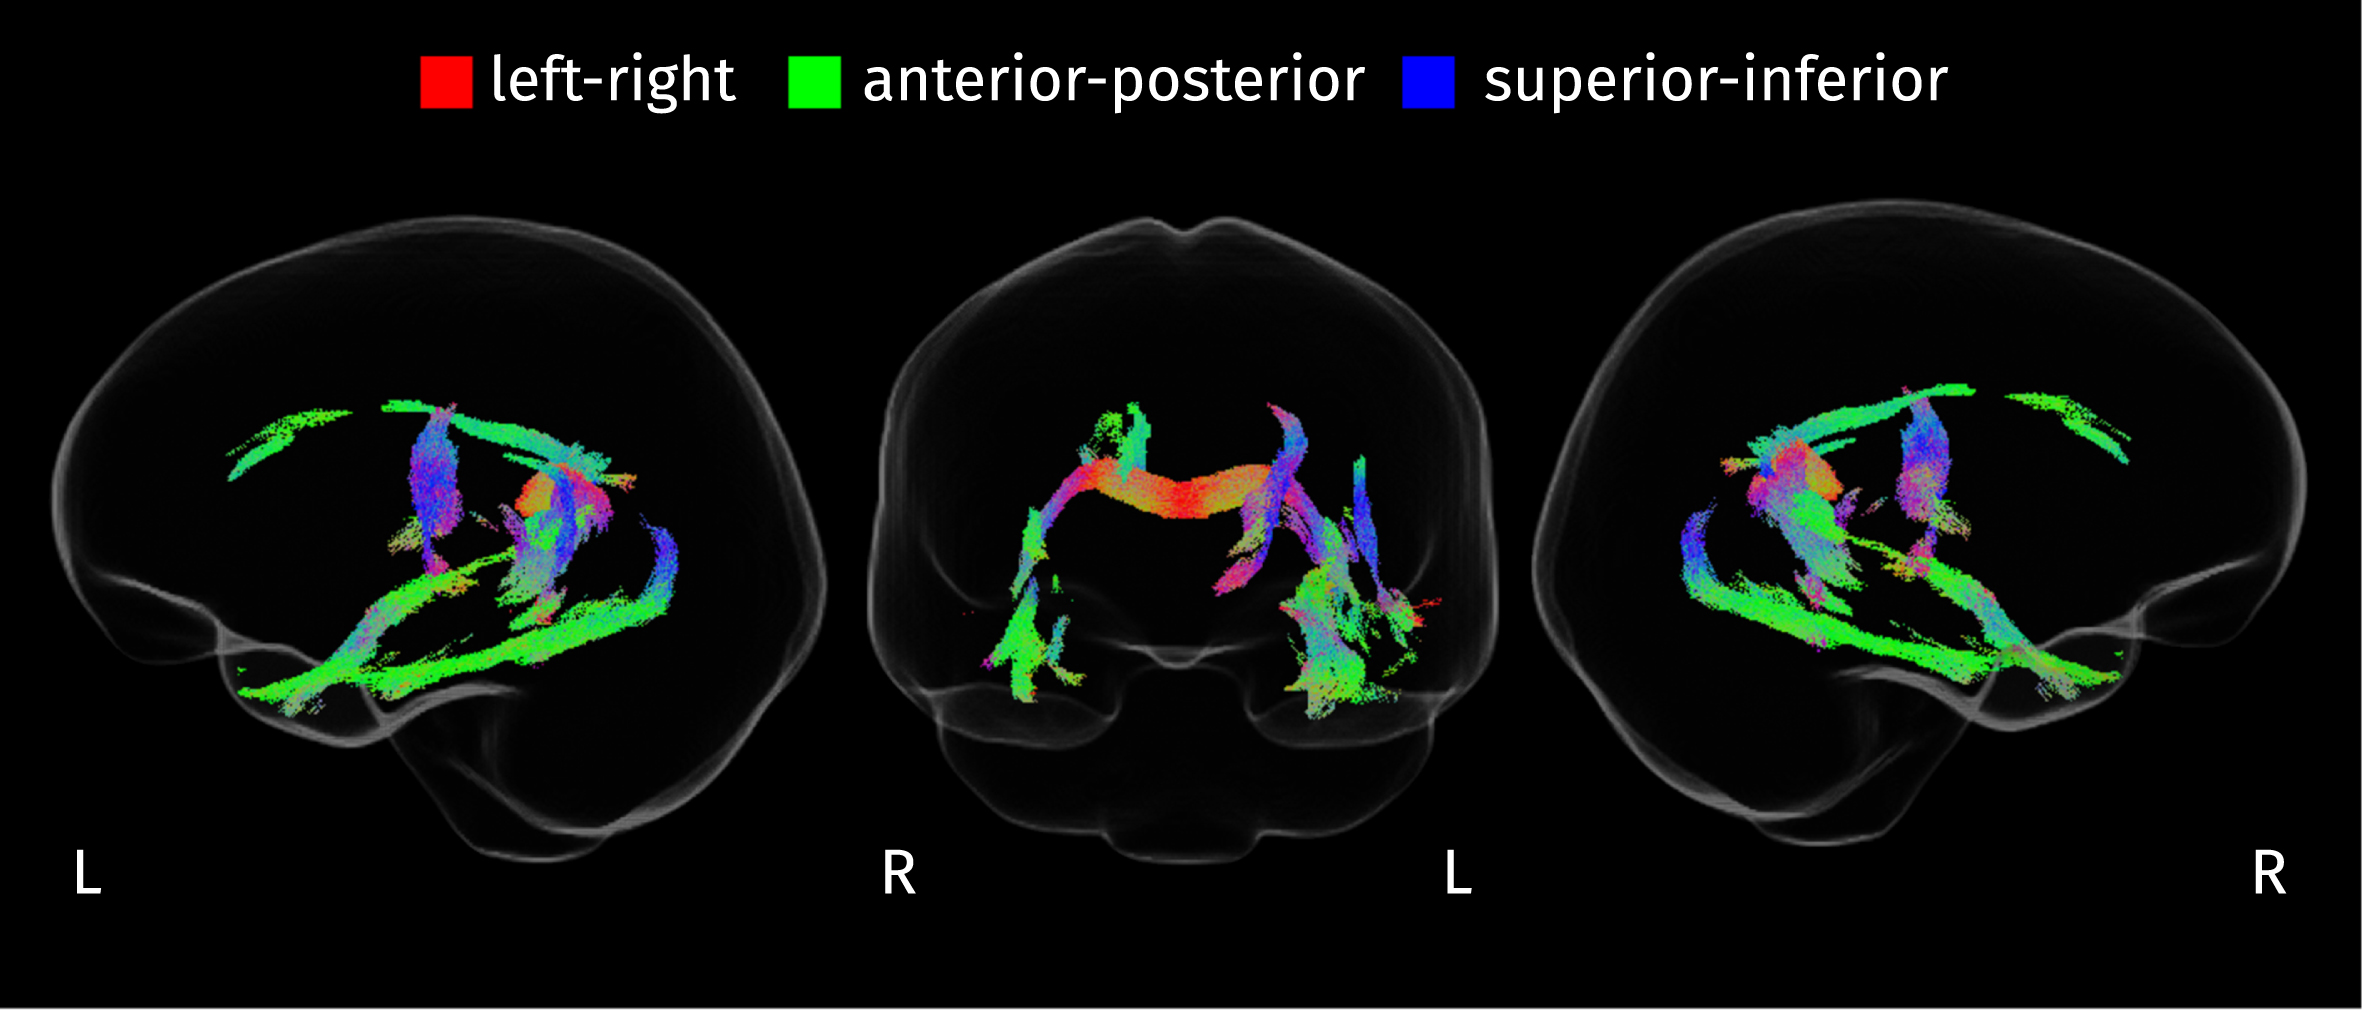
Streamline segments in the population template tractogram corresponding to fixels where the disease stage has a significant effect on any of the two fixel-specific measures (FWE-corrected p < 0.05). Streamlines are colored according to their orientation.
From post hoc analyses, differences in AFD and FC were detected between MCI and controls, and between ADD and controls. Patients with MCI and ADD show less AFD than controls in the splenium of the CC (see Fig. 5), while FC decreases in both groups of patients (compared to controls) are present also in the splenium, and in other white matter tracts such as the left corticospinal tract, left uncinate fasciculus, and right ILF. For ADD patients, decreased FC is also detected in the right cingulum, left arcuate fasciculus, left parahippocampal gyrus, and left thalamo-occipital projections (see Fig. 6). Many of these fiber tracts overlap with the areas resulting from the F-test shown in Fig. 4, explaining most of the significant effects in the omnibus test.
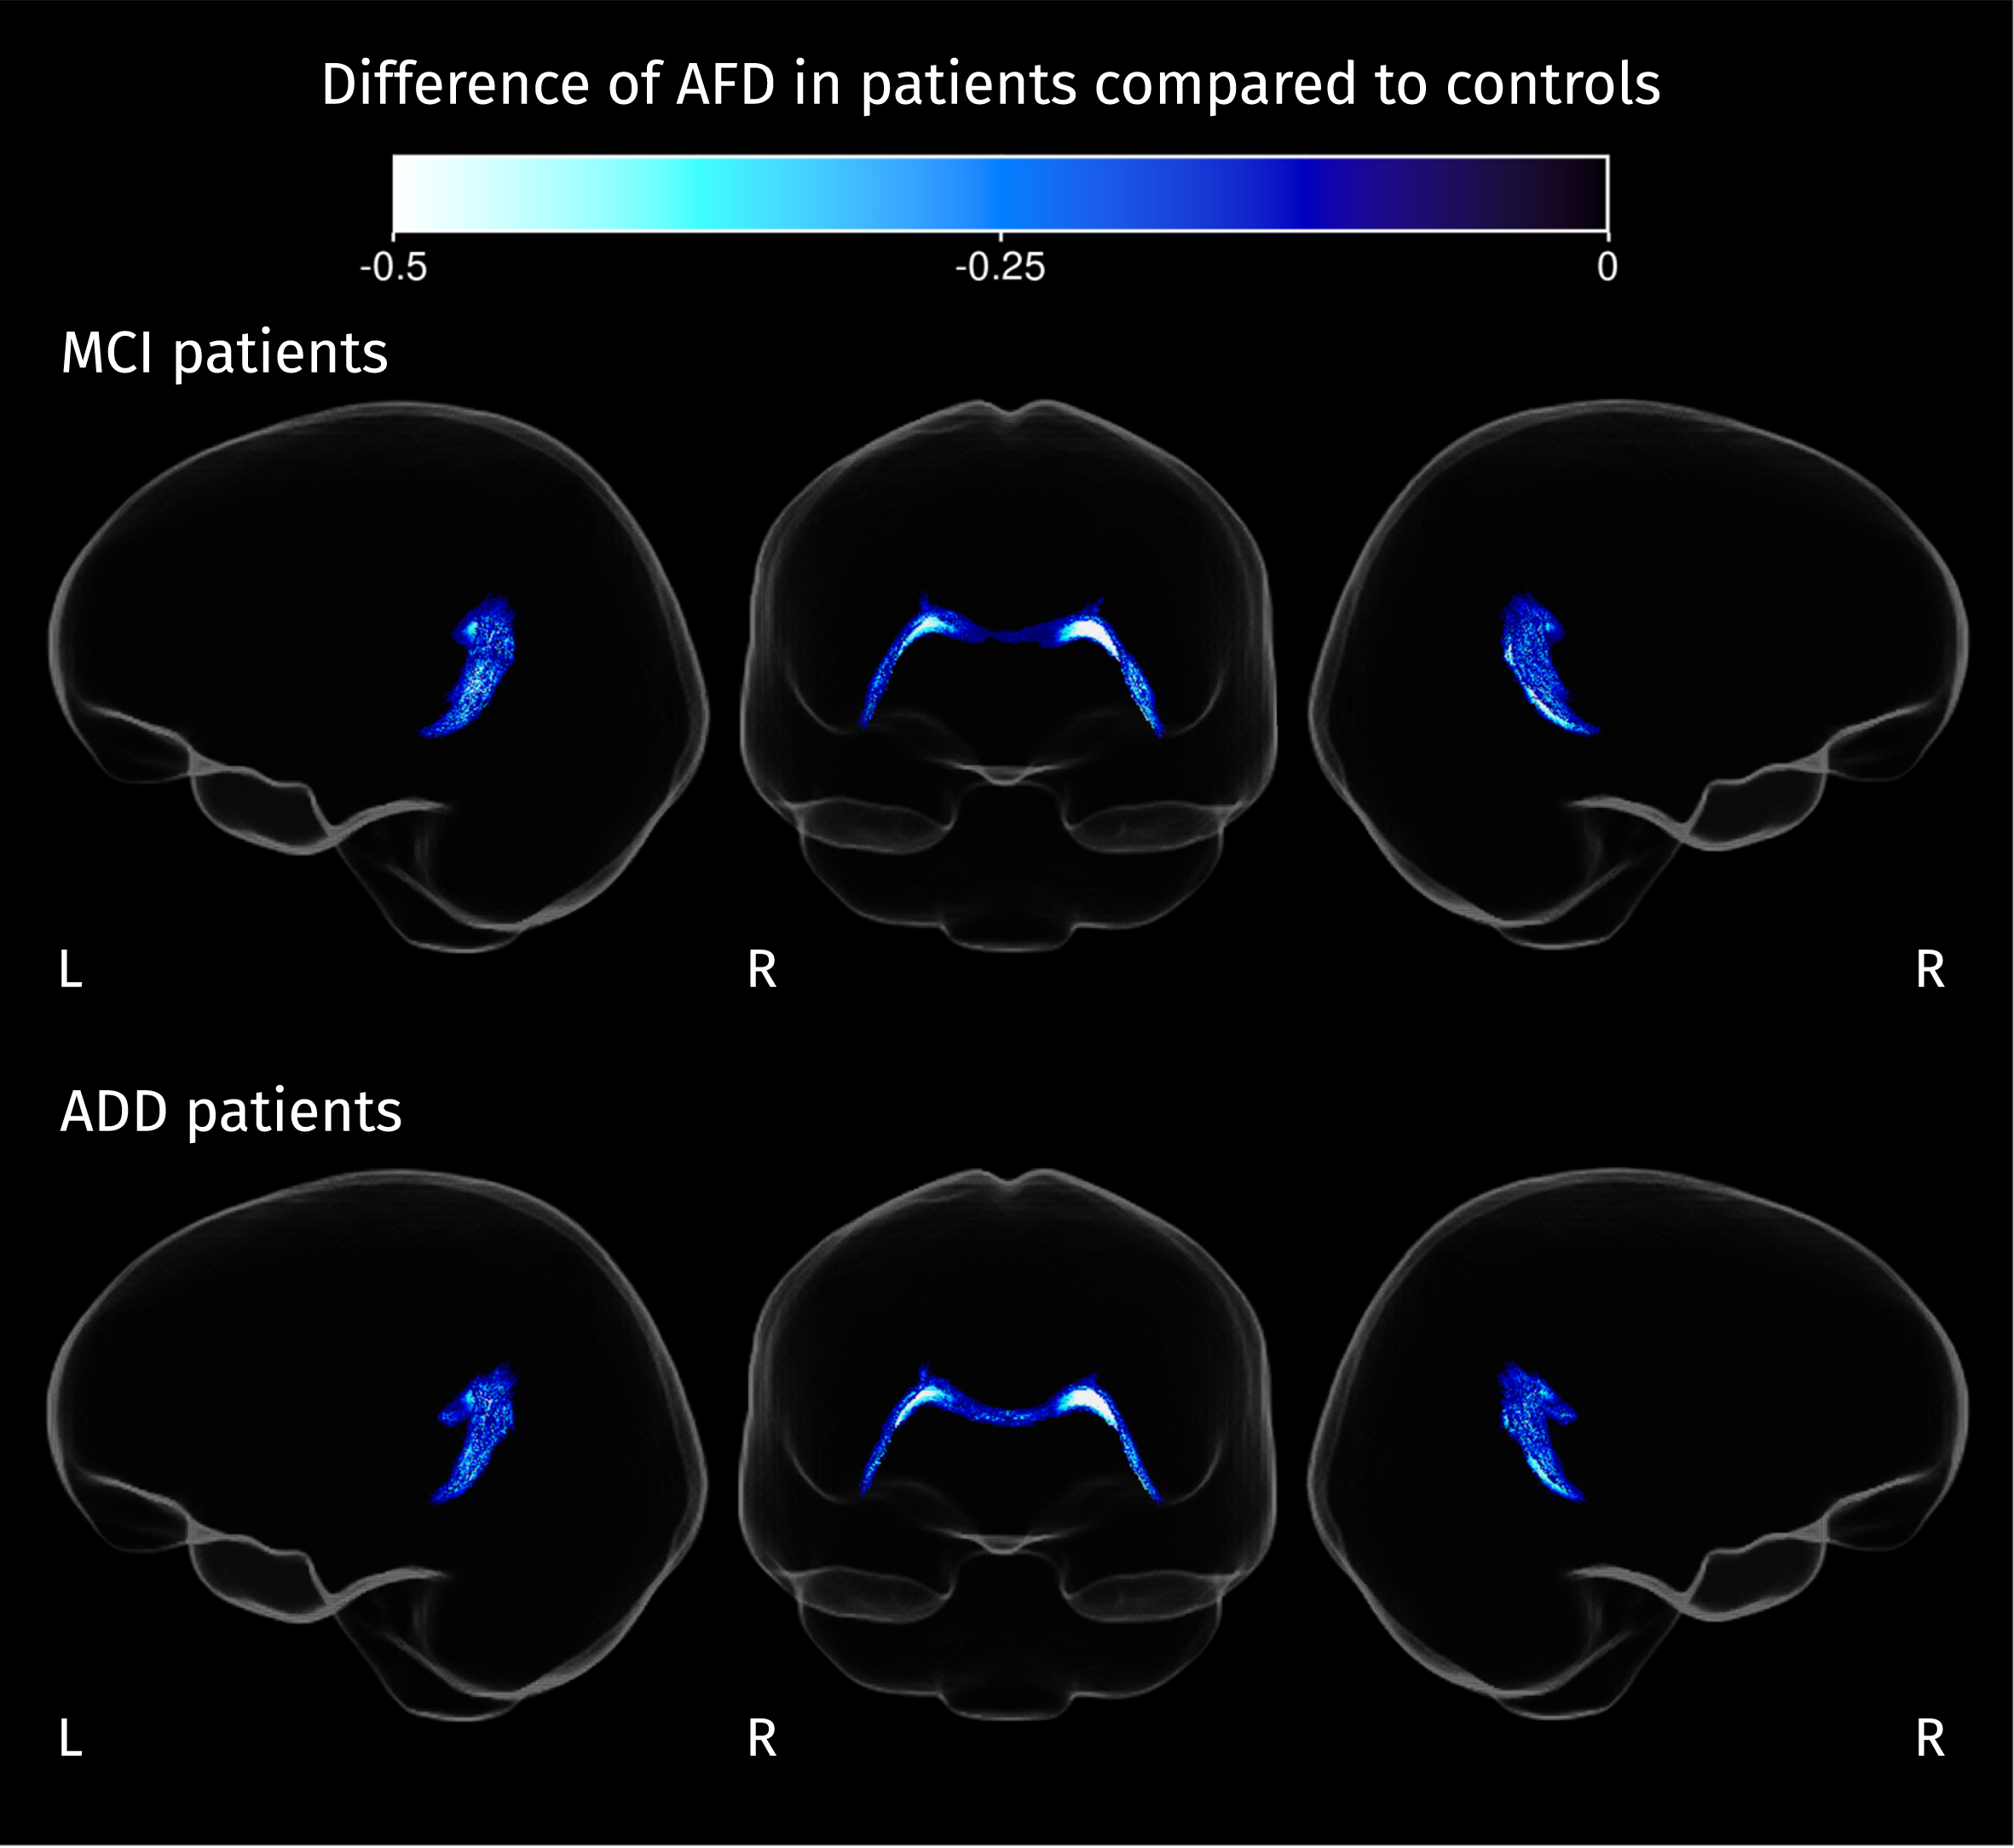
Section of the corpus callosum where AFD is significantly reduced in both groups of patients compared to control subjects (strong FWE-corrected p < 0.05). Color corresponds to the value of the difference between the mean AFD for patients and the mean AFD for controls.
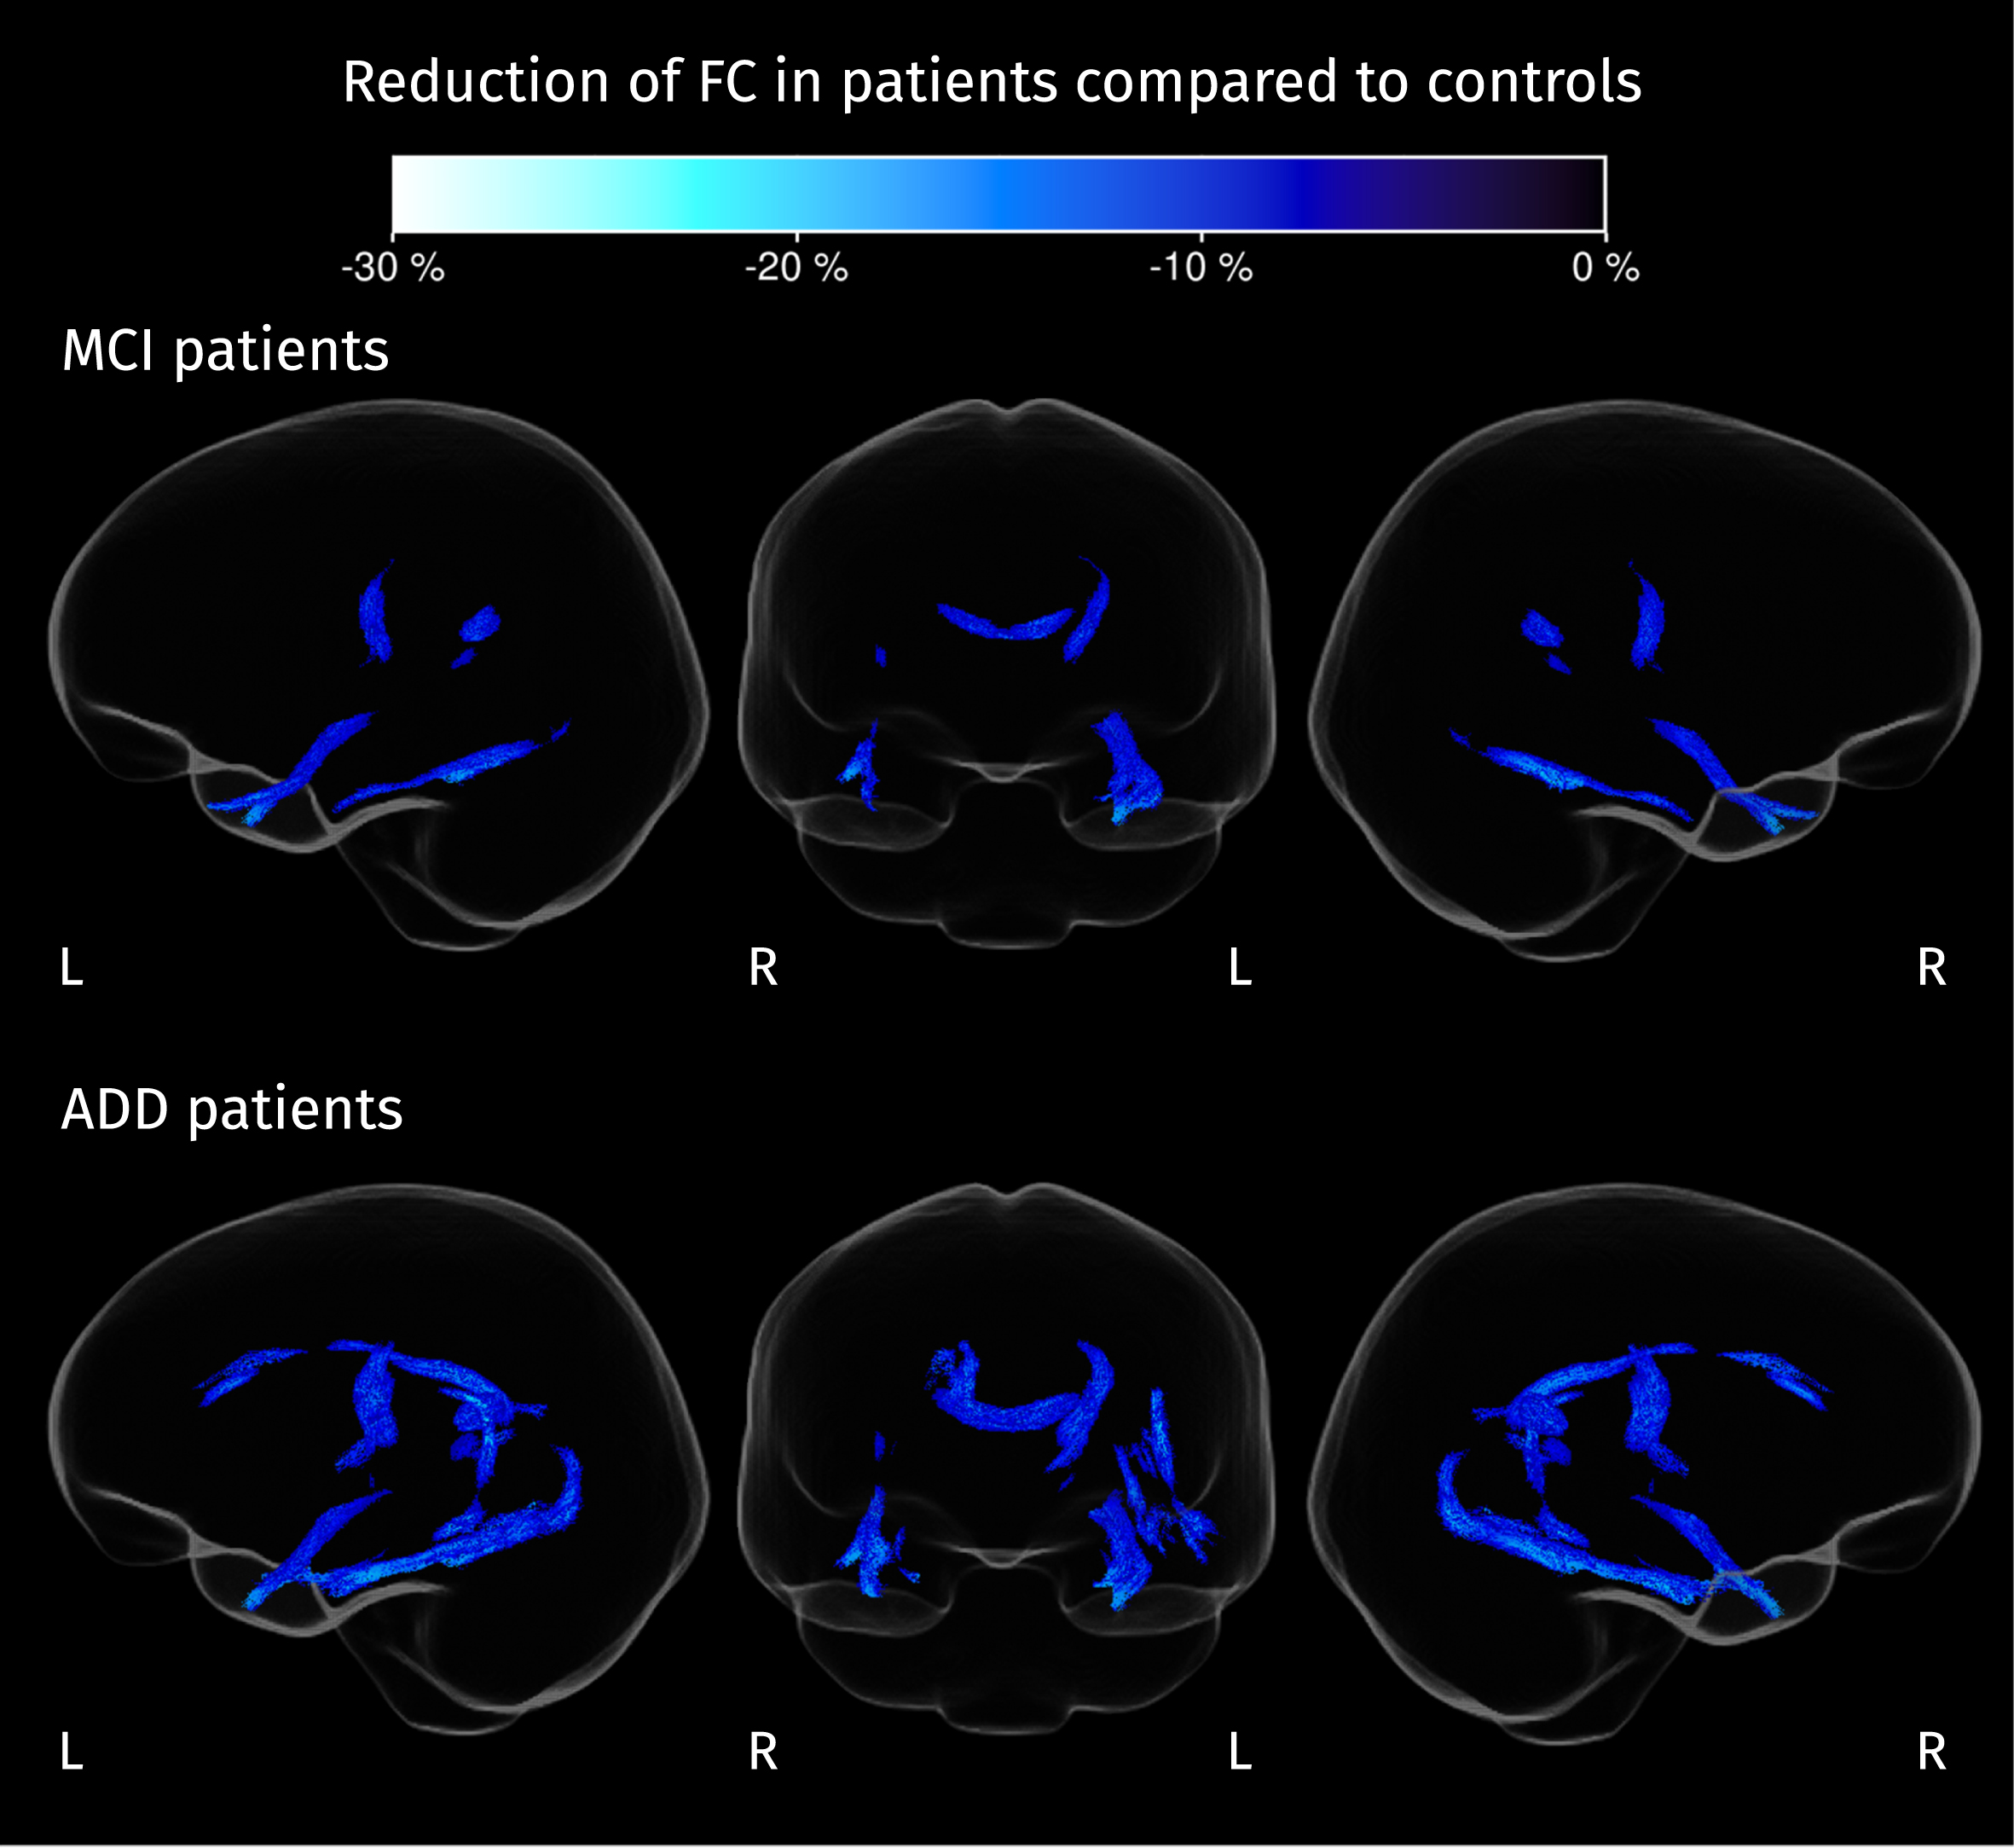
Streamline segments corresponding to fixels where FC is significantly reduced in patients compared to controls (strong FWE-corrected p < 0.05). Color corresponds to the percentage of change in each group of patients compared with the control group.
Differences in voxel-wise measures
Widespread significant group effects for the three voxel-wise measures (2 ilr parameters and the Jacobian determinant) were identified by the omnibus F-test covering a large portion of the template analysis mask. As shown in Fig. 7, voxel-wise measures differ across disease stages in 44.1% of the analyzed brain area.
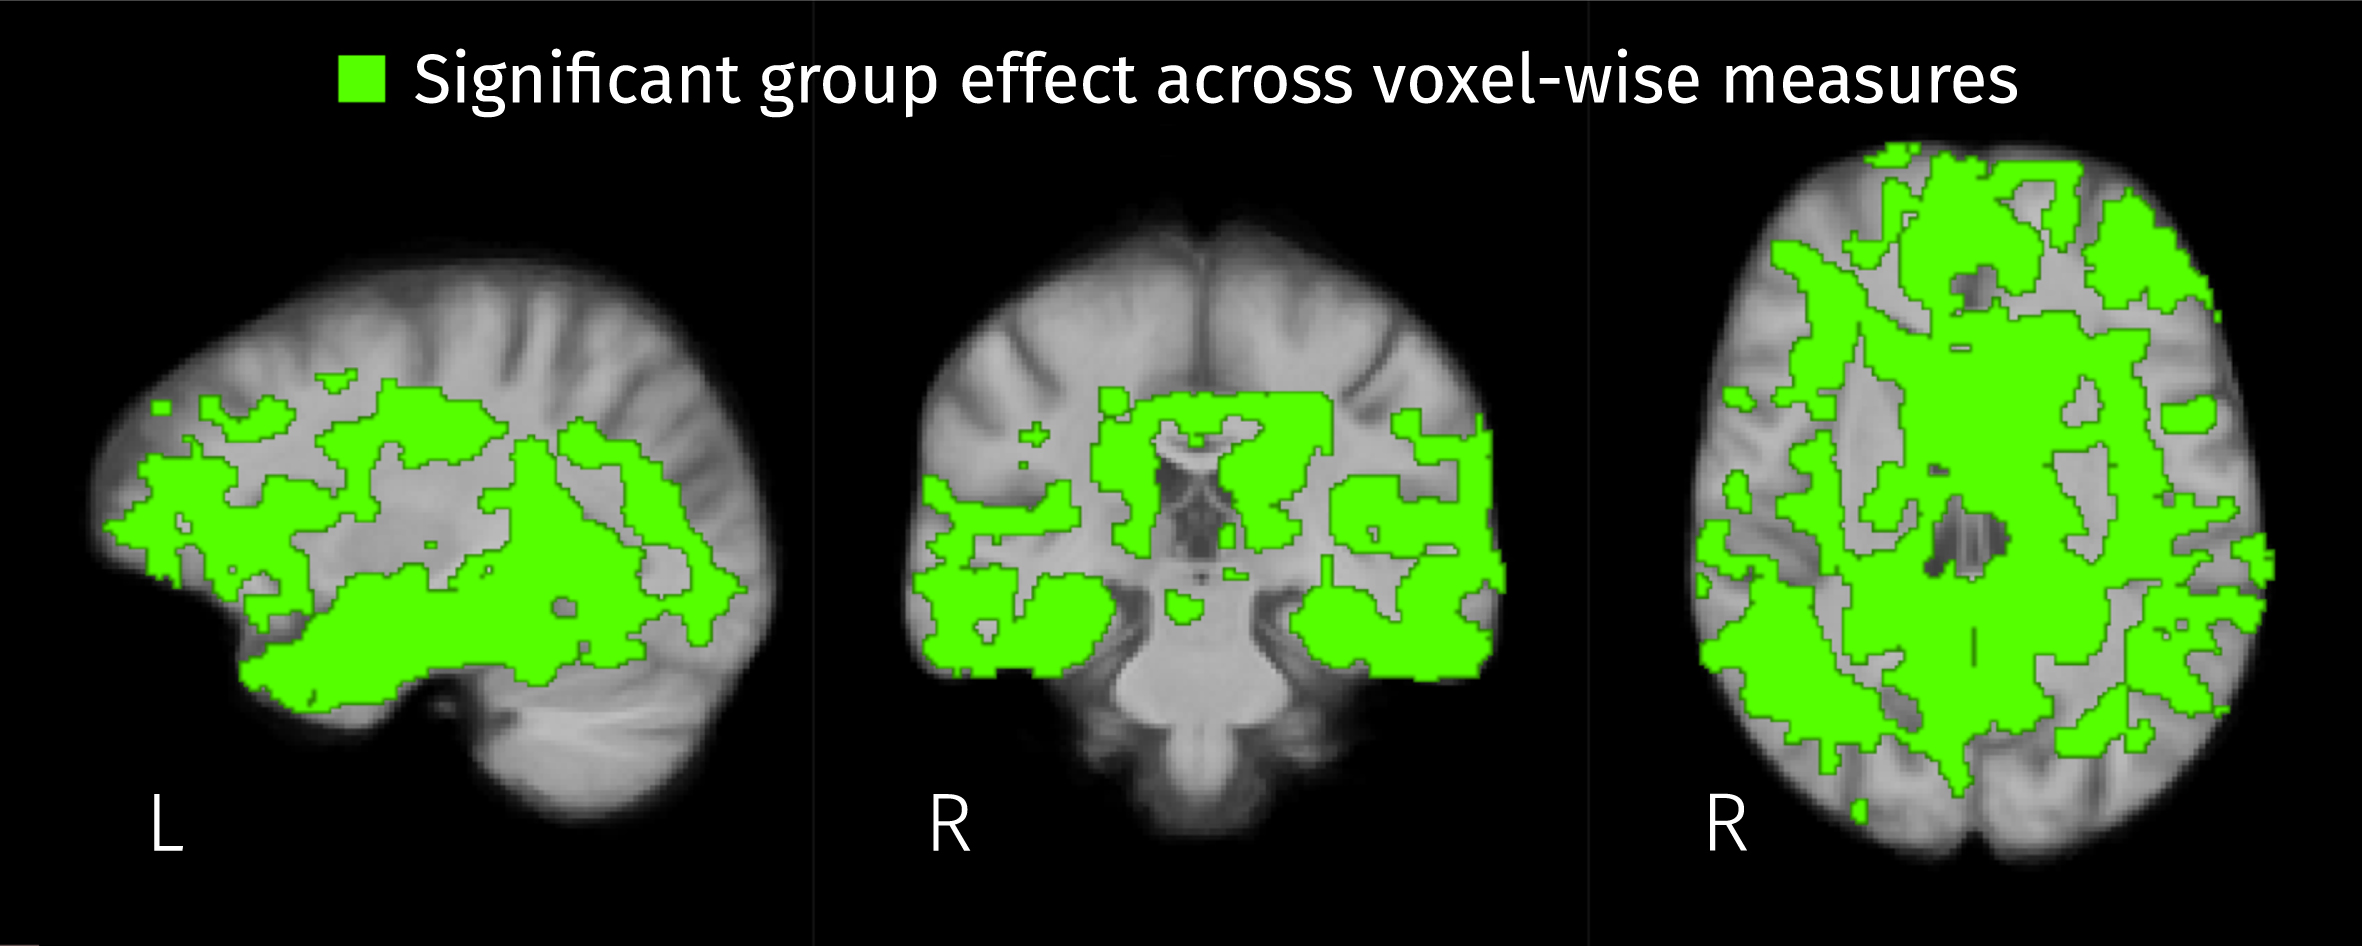
Brain areas where the disease stage has a significant effect on any of the three voxel-wise measures: the two isometric log-ratios and the Jacobian determinant (FWE-corrected p < 0.05).
Post hoc analyses resulted in significant differences of all three voxel-wise measures between MCI and controls, and between ADD and controls. Also, the first isometric log-ratio (ilr1 in Equation 2) was the only one of the analyzed measures that showed significant differences between ADD and MCI. Increases of ilr1 were detected in MCI and ADD patients compared with controls, and in ADD compared with MCI. The increment of this ratio indicates the reduction of WM-like fraction accompanied by increased CSF or GM-like fractions, or the increased product of CSF and GM-like fractions while WM-like remains constant. Significant increases of the second isometric log-ratio (ilr2 in Equation 2) were revealed for both MCI and ADD patients when compared to control subjects. Increased ilr2 could be the result of decreased GM-like fraction with increased or constant CSF-like fraction, or increased GM-like fraction with also increased CSF-like and therefore decreased WM-like fraction. Figures 8–10 show the group differences of tissue-like fractions in areas where significant increases in ilr1 or ilr2 were detected. When MCI subjects are compared against controls, significant changes in tissue-like composition are detected in the intersection between the insular cortex and planum polare, in the cingulate cortex, amygdala, hippocampus, and caudate, revealing decreased GM-like fraction (see Fig. 9, top row) with increased CSF-like fraction (see Fig. 10, top row). There are also some areas such as the cingulum and inside the temporal lobe surrounding the ILF where the differences in ilr are due to reductions of WM-like fraction (see Fig. 8, top row). In the case of ADD patients when compared to controls, all of the changes in MCI patients are recapitulated and expanded, along with differences in the CC, superior and inferior longitudinal fasciculi, parahippocampal gyrus of the cingulum, and thalamic radiations. These differences in WM areas come from reductions of WM-like fraction (see middle row of Fig. 8) accompanied by increased GM-like fraction (red areas in Fig. 9, middle row). Significant differences in tissue-like composition between ADD and MCI patients were also detected in the inferior temporo-occipital region of the right temporal lobe where WM-like fraction decreases (see Fig. 8, bottom row) while GM-like fraction increases (see Fig. 9, bottom row).
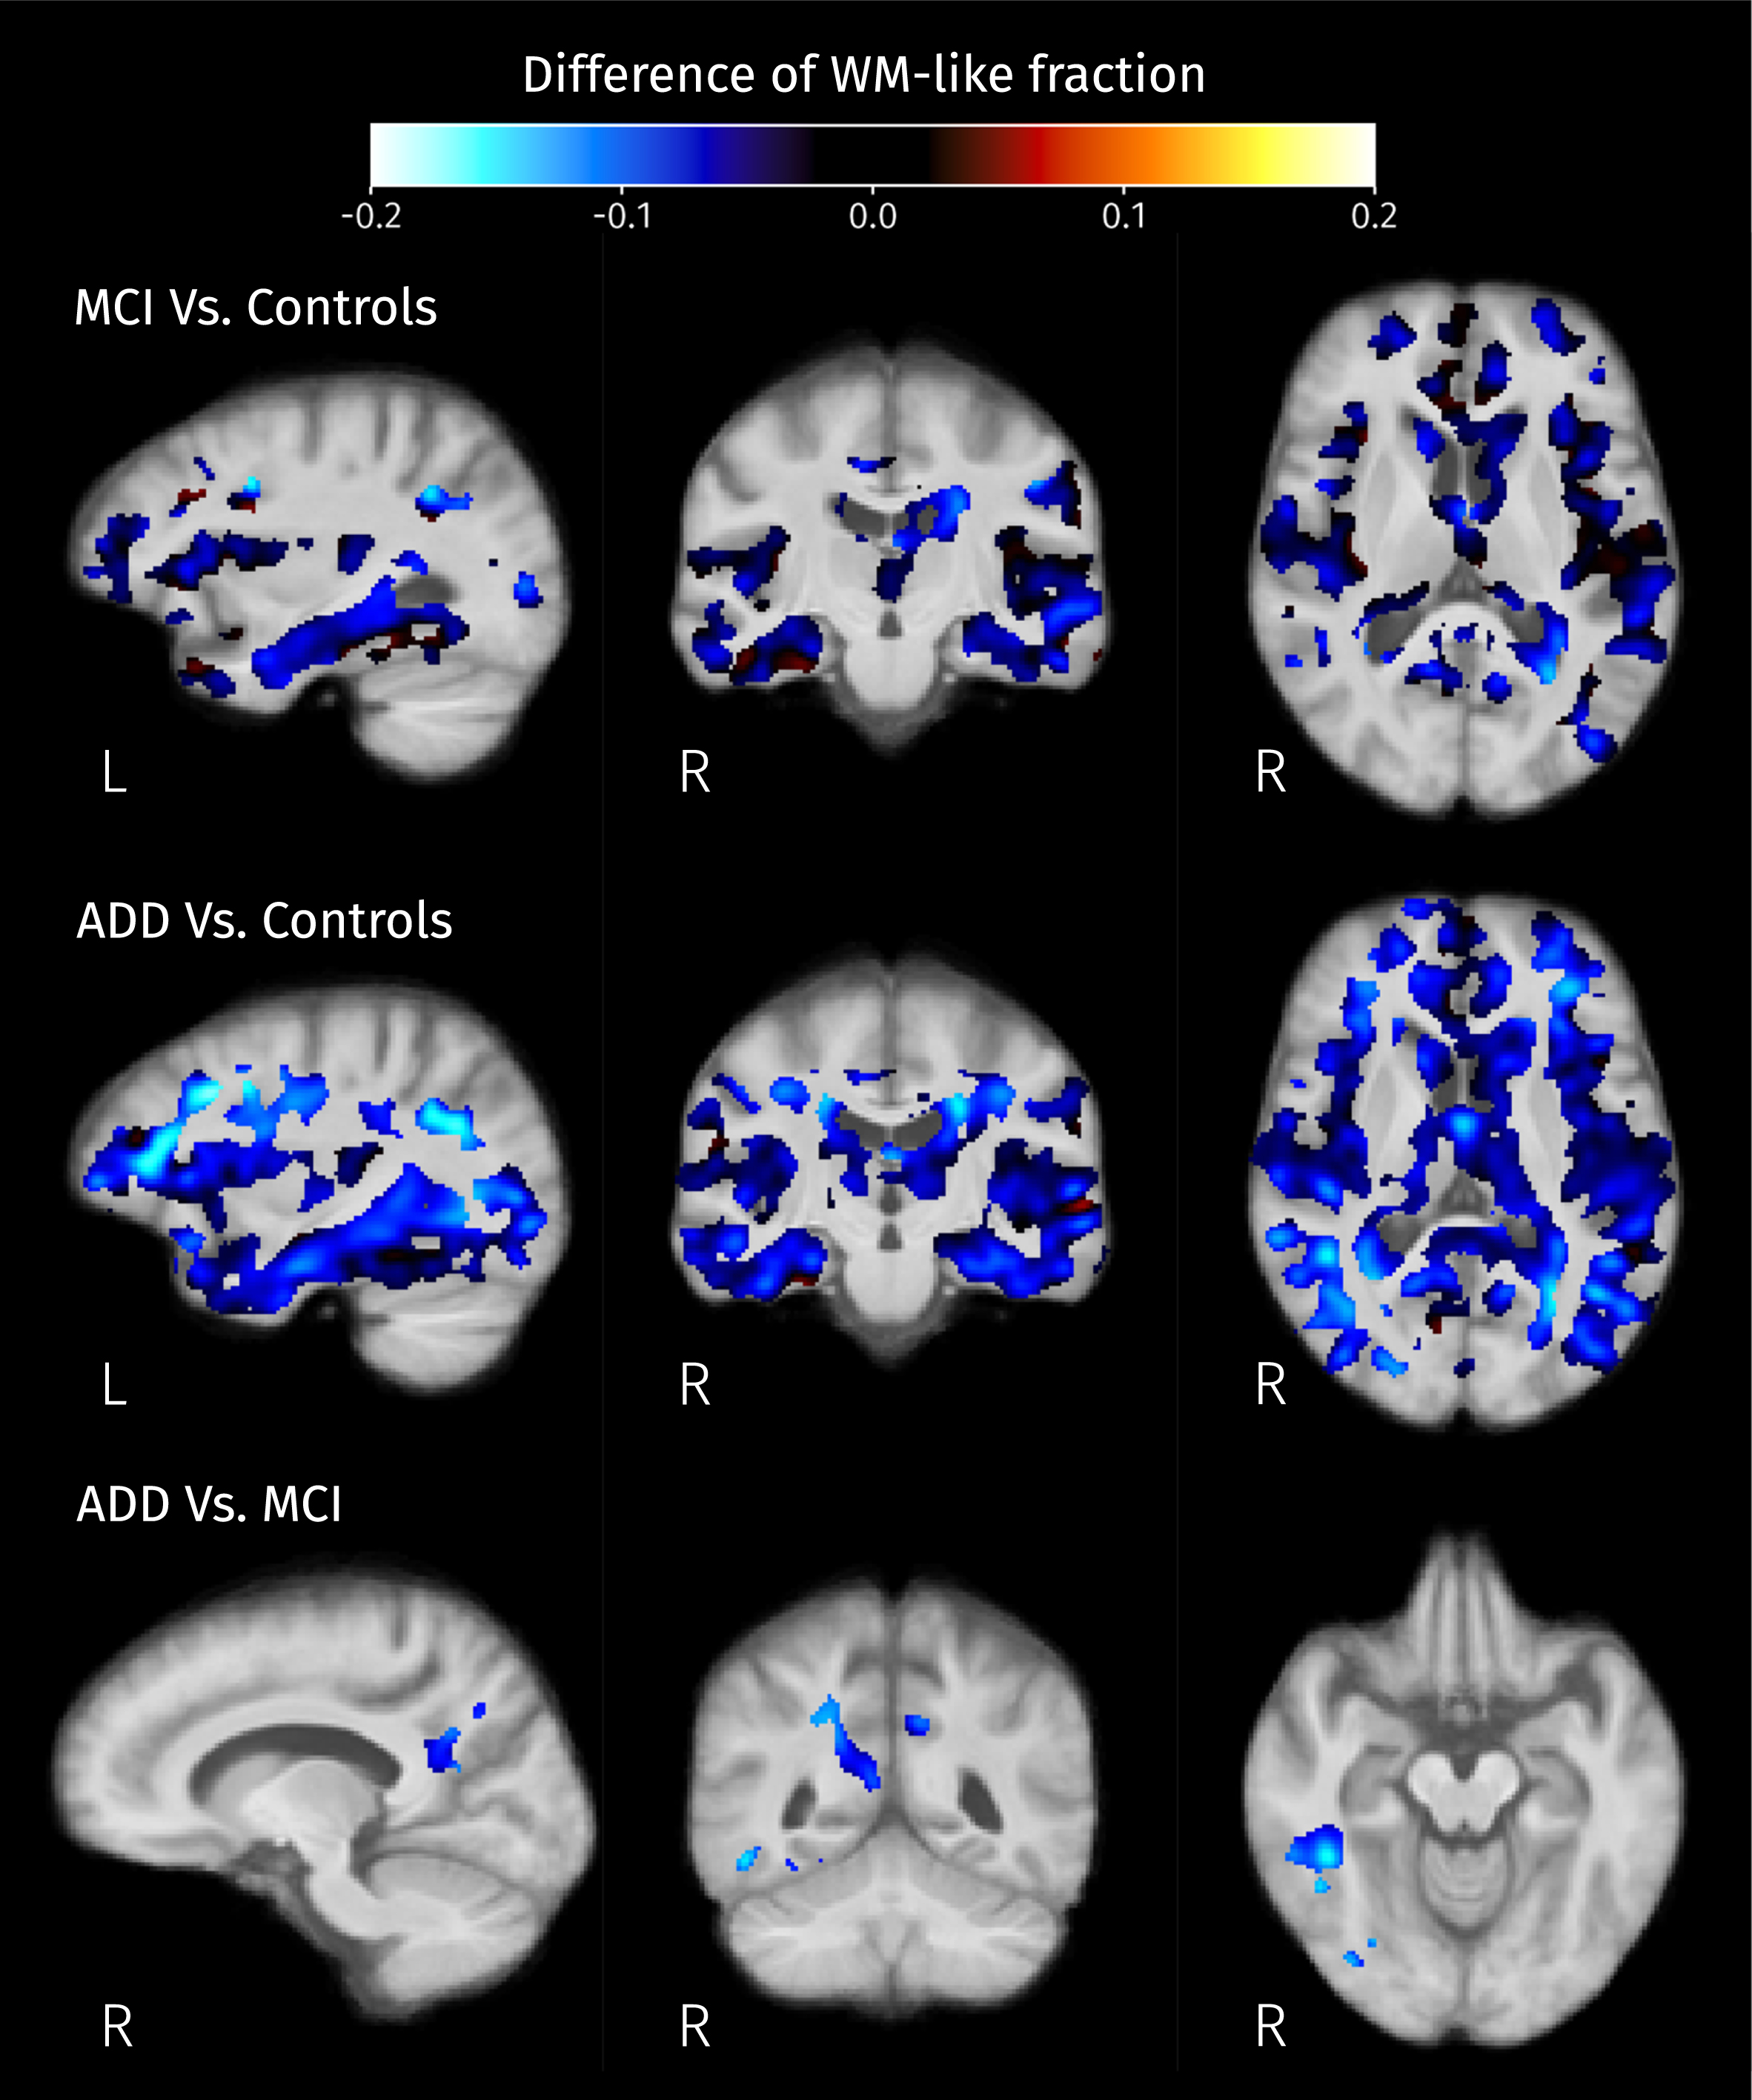
Differences of mean WM-like fraction in brain areas where at least one of isometric log-ratios is significantly different (strong FWE-corrected p < 0.05) between pairs of groups.
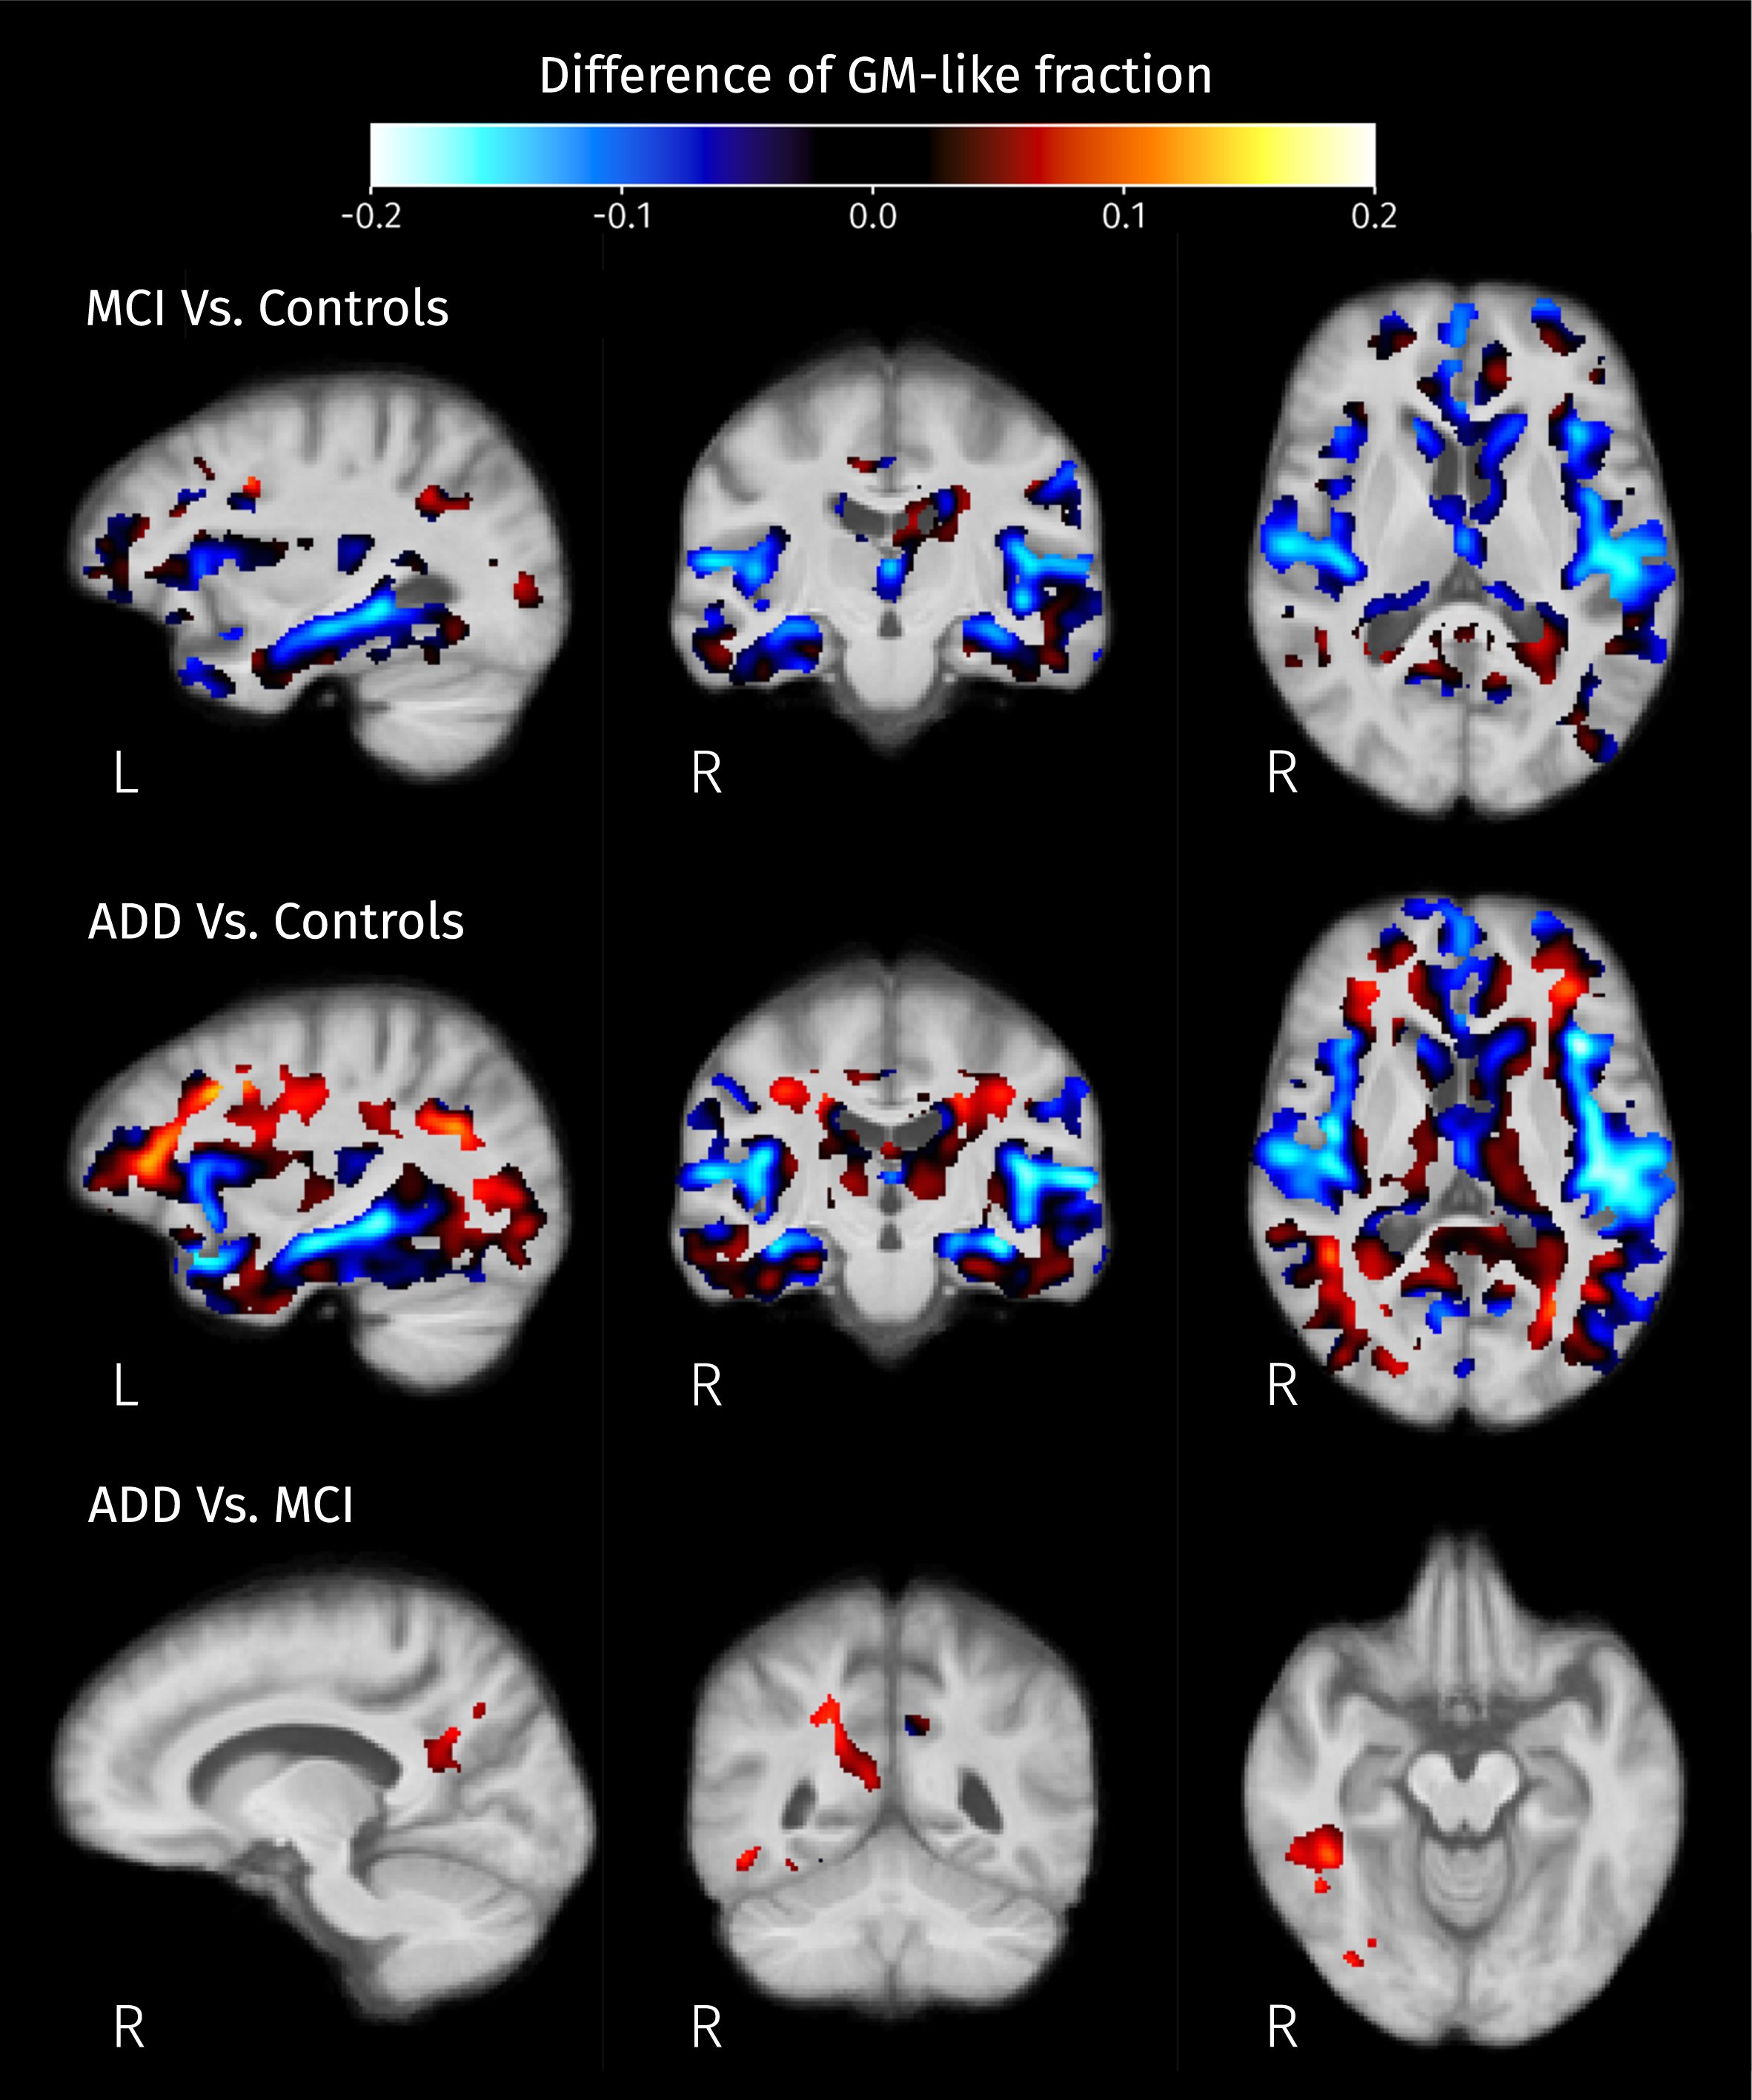
Differences of mean GM-like fraction in brain areas where at least one of isometric log-ratios is significantly different (strong FWE-corrected p < 0.05) between pairs of groups.
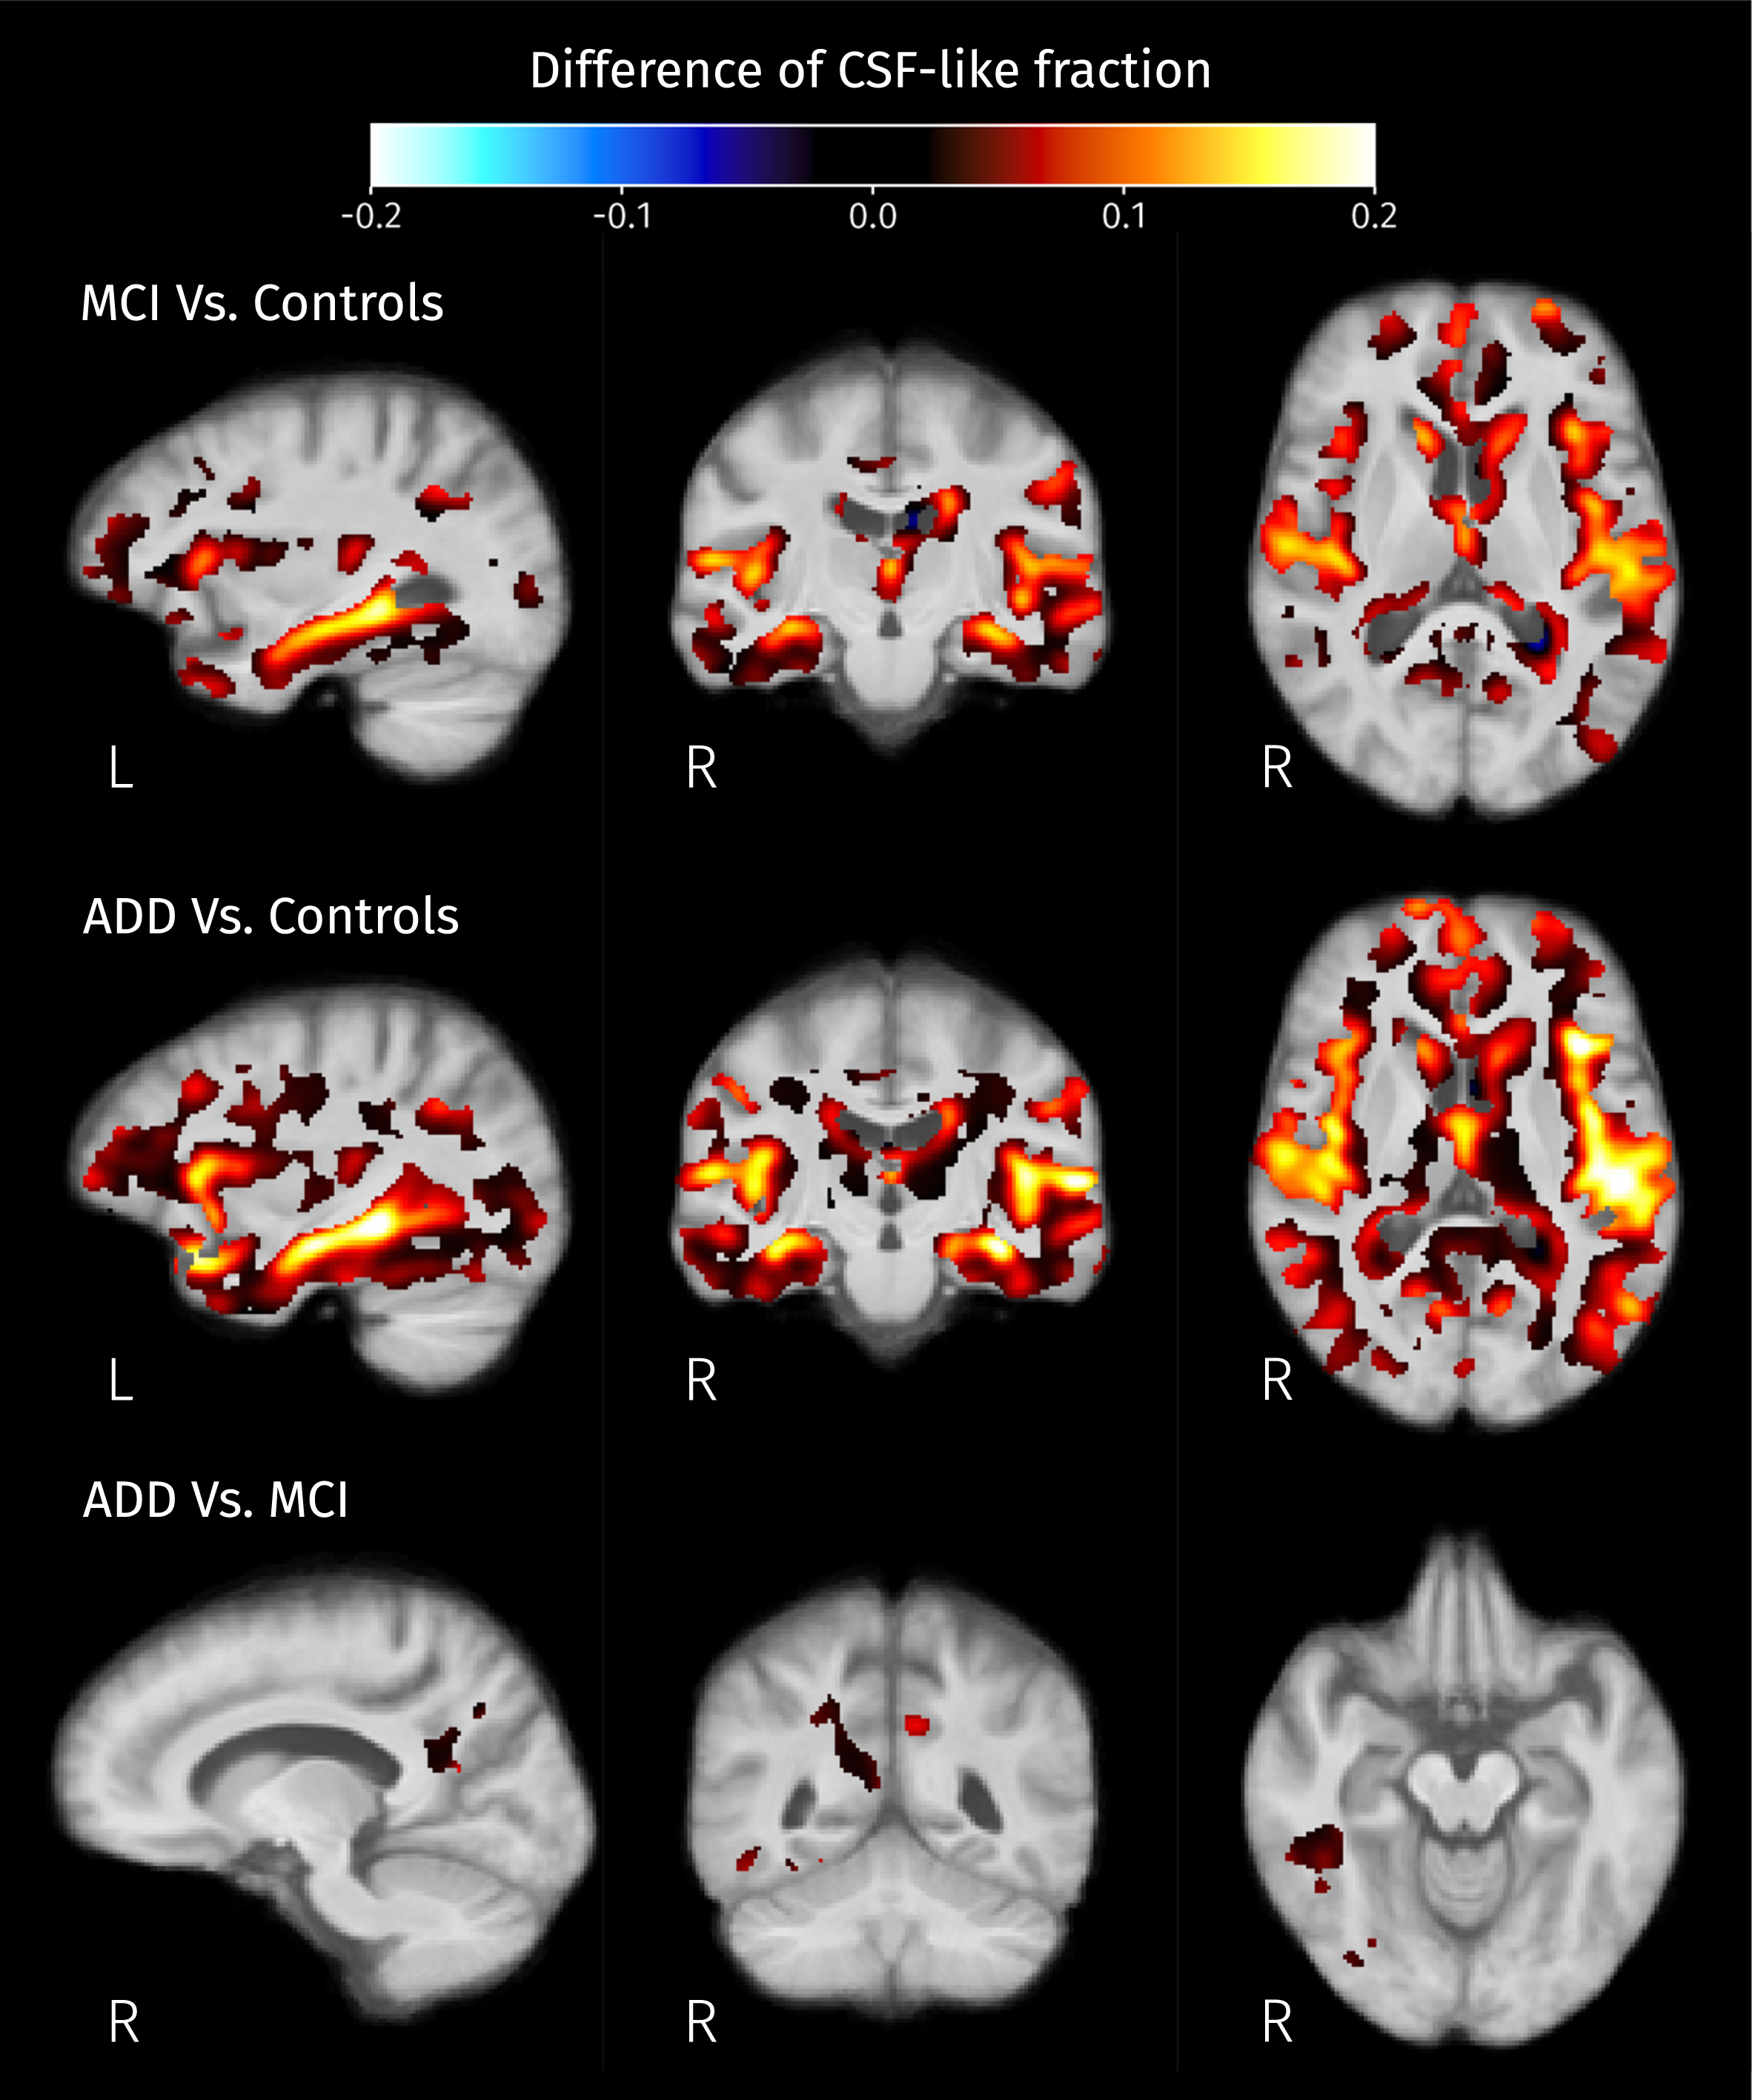
Differences of mean CSF-like fraction in brain areas where at least one of isometric log-ratios is significantly different (strong FWE-corrected p < 0.05) between pairs of groups.
The absolute differences of the three tissue-like fractions for the three pairs of groups can be seen simultaneously in a color-coded visualization shown in Supplementary Figure 1.
Differences in local volume
Significant differences in local volume were detected in both MCI and ADD patients groups when compared with controls. Figure 11 shows the resulting pairwise differences in the determinant of the Jacobian matrix, which accounts for volumetric changes induced by spatial normalization. For both groups of patients, ventricles are expanding and there is a significant shrinkage of the anterior part of the left temporal lobe. For ADD patients, the significant reduction of the local volume in the temporal lobe was detected in both hemispheres, reaching the angular gyrus where the posterior parts of the middle and inferior longitudinal fasciculus are located.
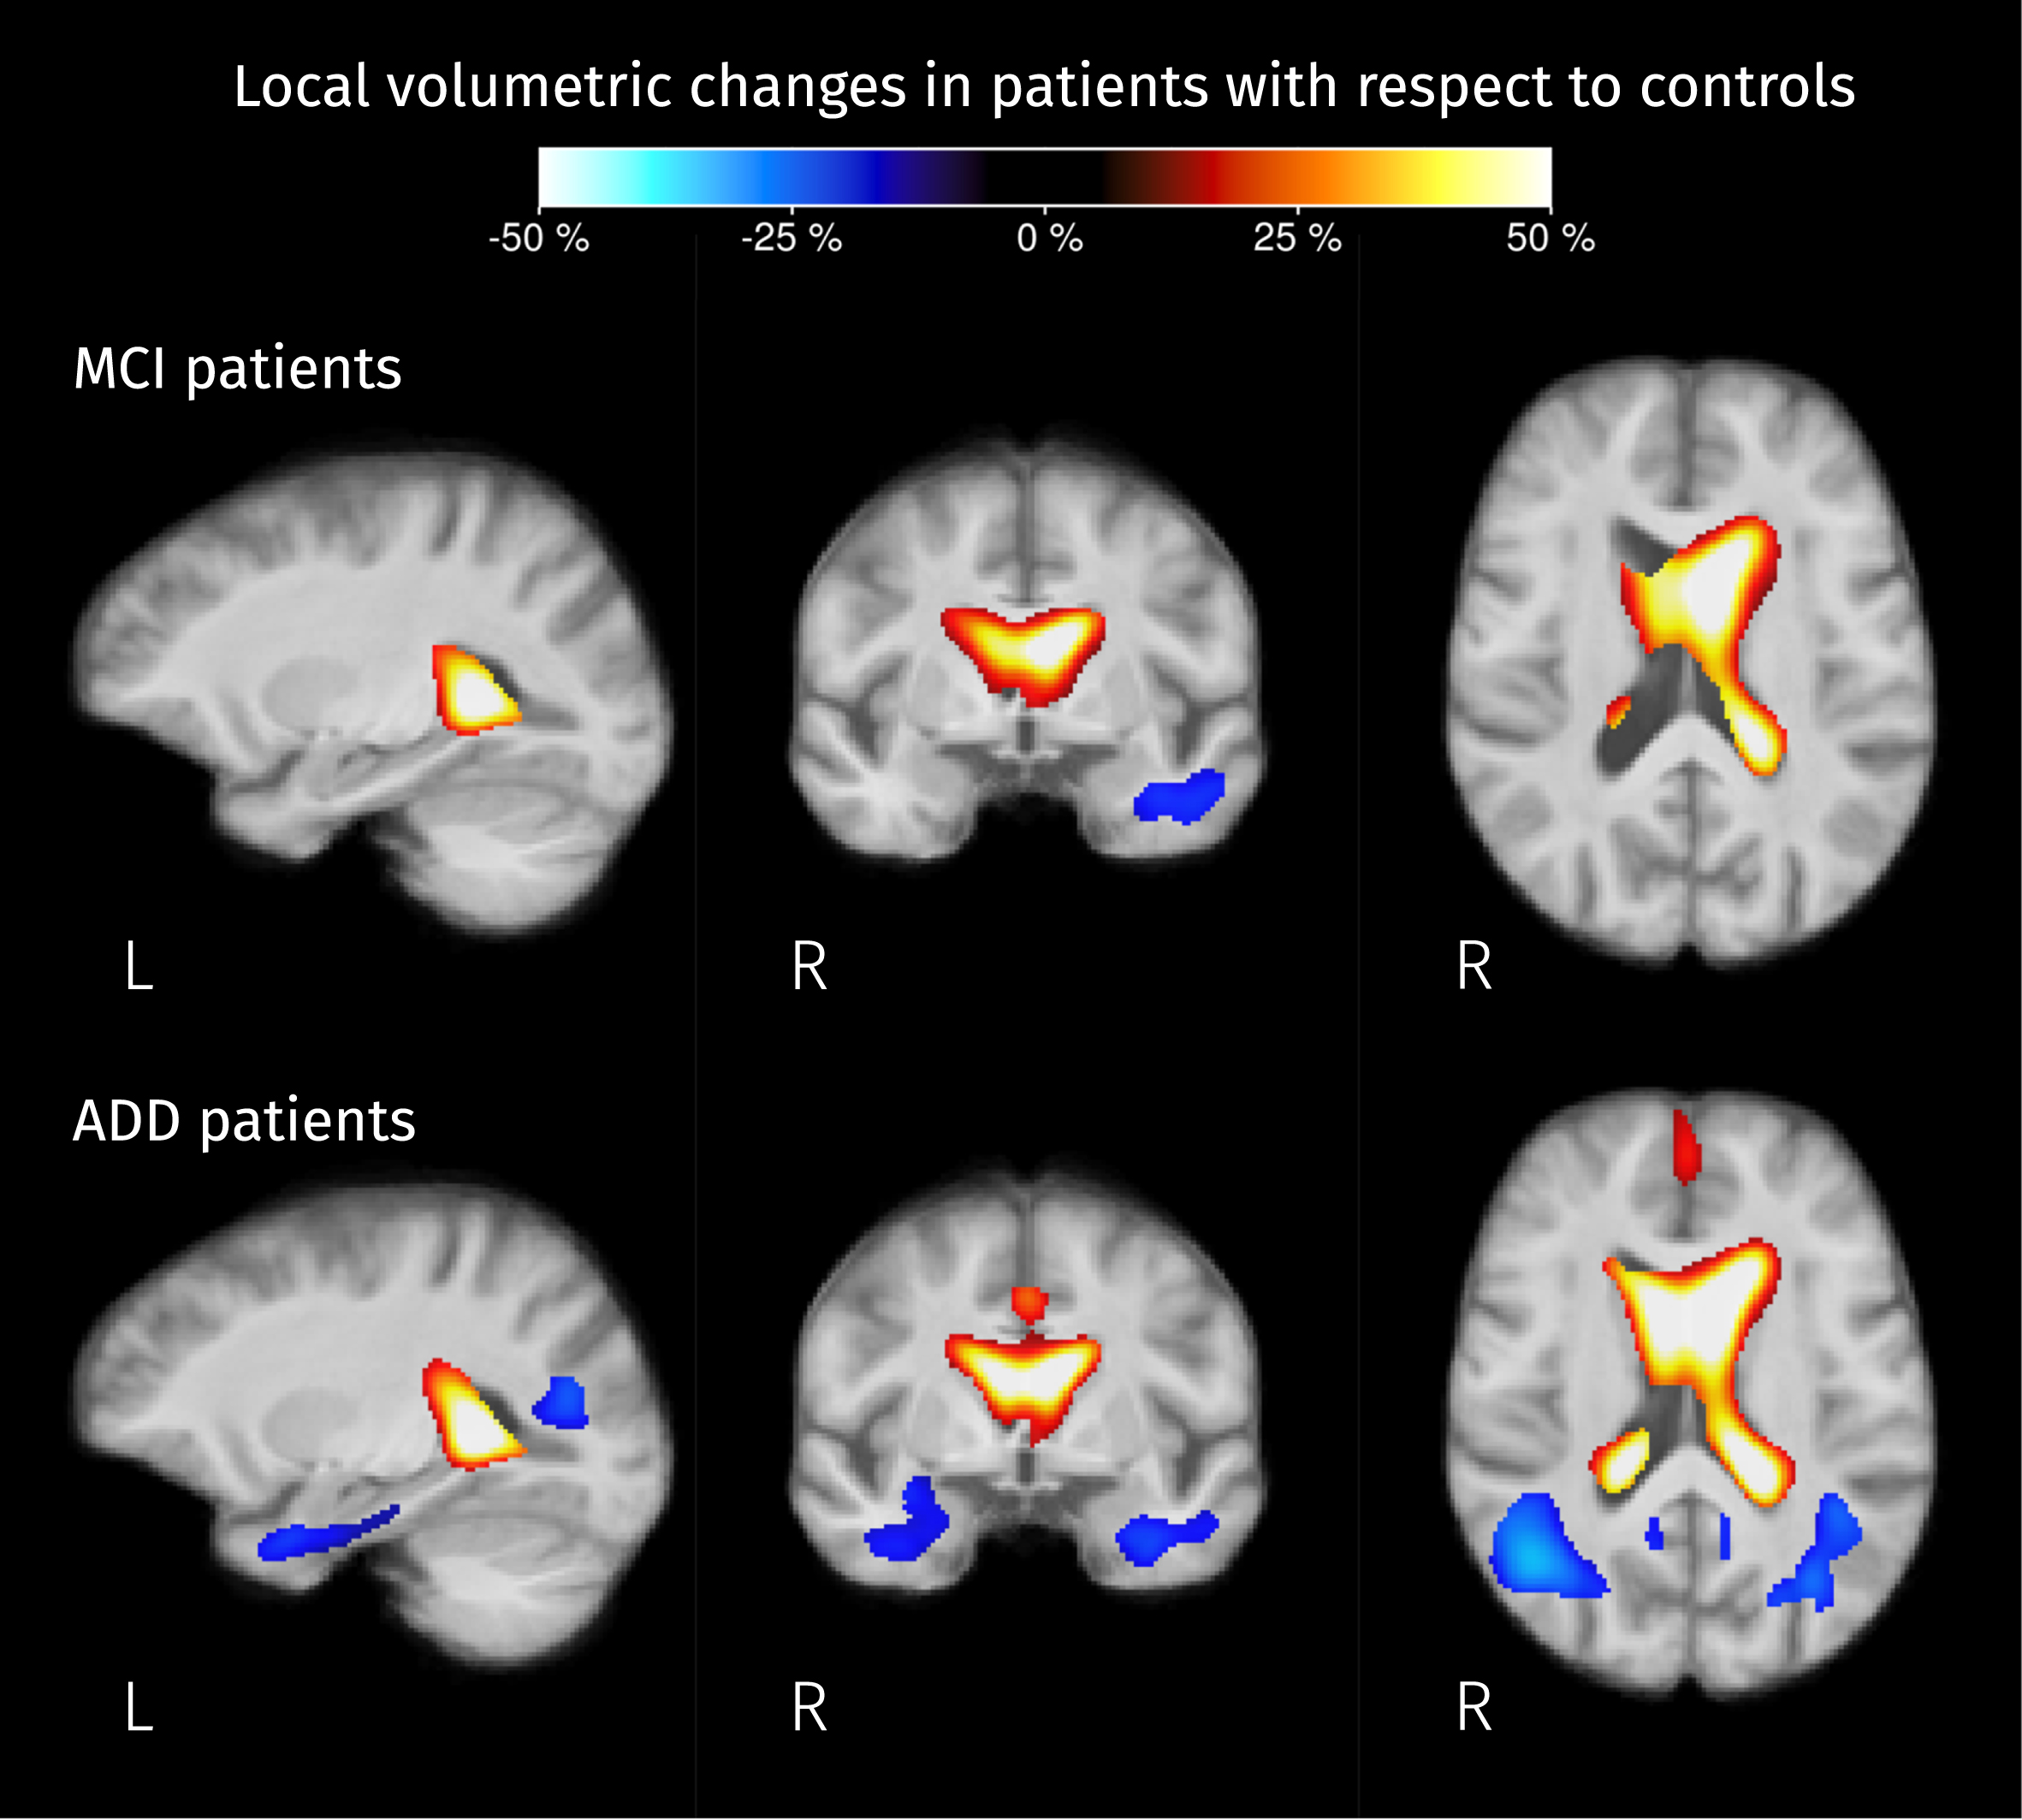
Brain areas where the Jacobian determinant is significantly different (strong FWE-corrected p < 0.05) in patients compared to controls. The colormap represents the percentage of change in local volume compared to the control group. Analogous to FC, analyses for this value were performed in the log domain therefore this percentage of change was calculated as exp(βPT) – 1 where βPT represents the difference between the mean value of the logarithm of the Jacobian determinant for MCI/AD patients and the mean of those values for controls.
Correlation between CSF biomarkers and diffusion-derived measures
Significant effects of Aβ1–42 in fixel- and voxel-wise measures were detected with the omnibus F-tests. From post hoc testing negative correlations between Aβ1–42 level and the fixel/voxel-wise measures of macroscopic area/volume change relative to the template were found in the interface between the ventricles and the genu of the CC (shown in Fig. 12). The negative regression coefficient, in this case, means that the lower the CSF Aβ1–42 levels, and thus the more pathological, the greater the volumetric change caused by the registration to the population template.
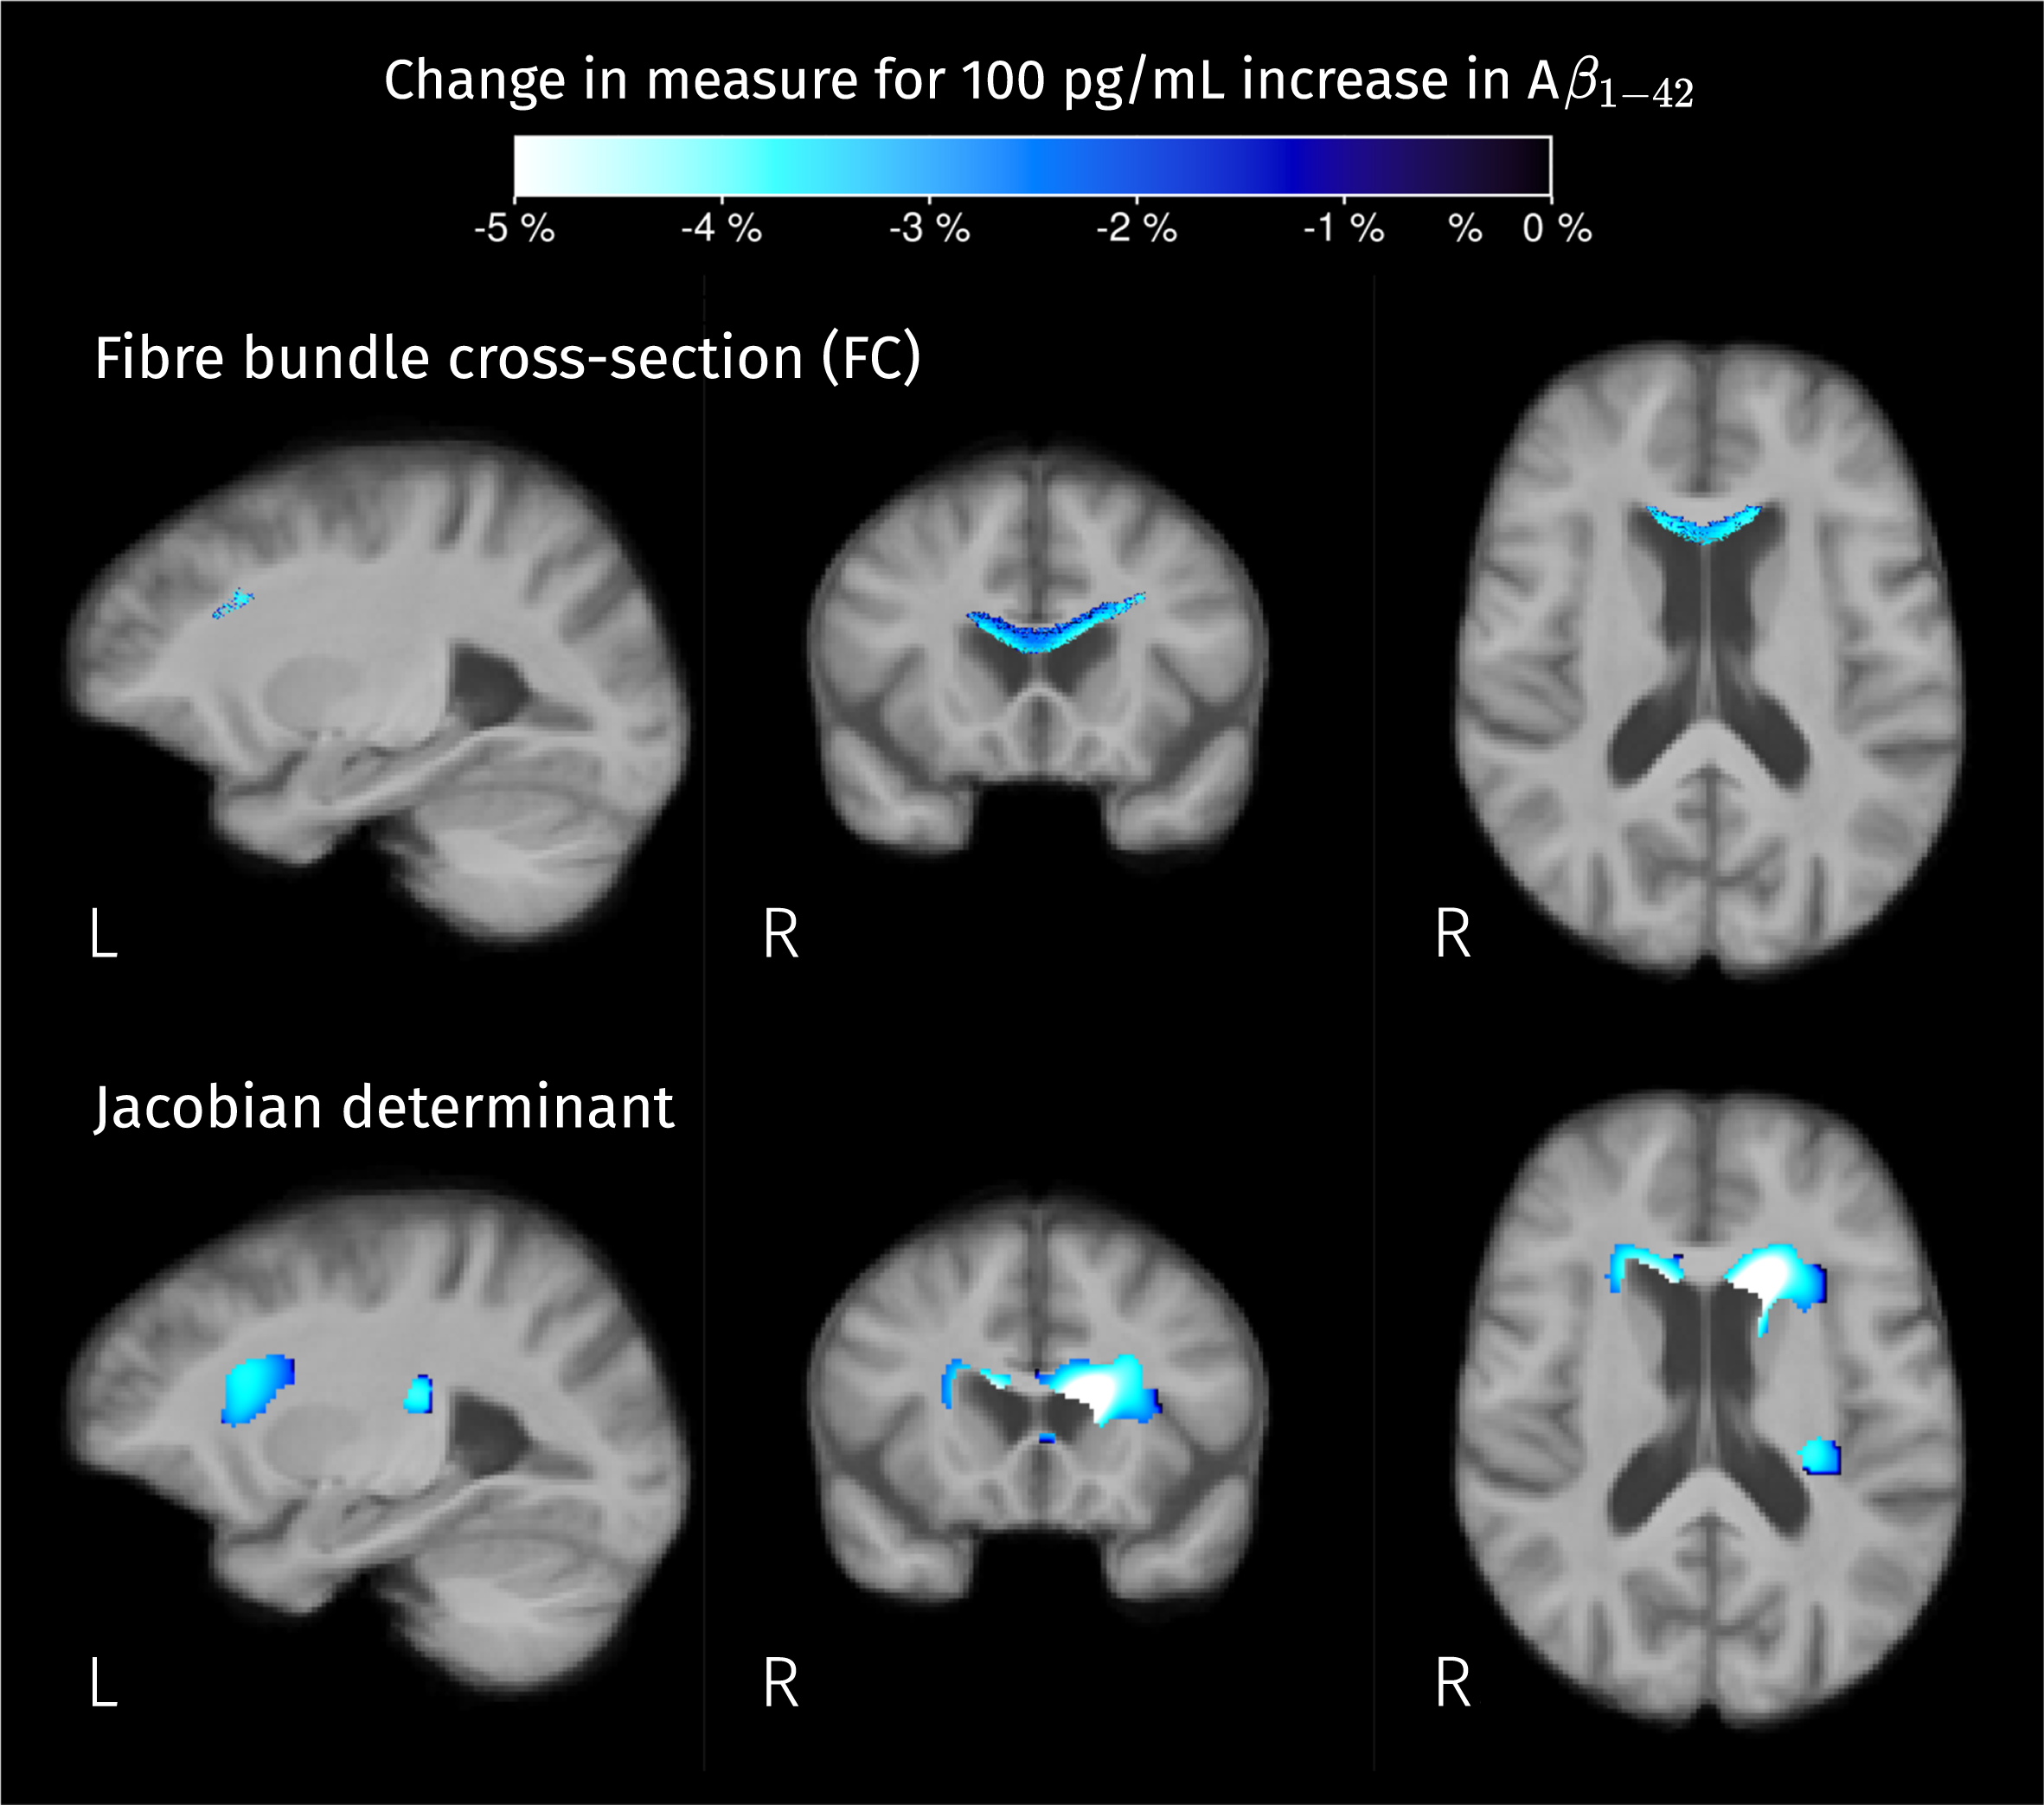
Brain areas where there is a significant linear relation between CSF biomarker for Aβ1–42 and measures of macroscopic change relative to the population template. Color corresponds to the percentage of change in these measures for a 100 pg/mL increase in biomarker value. Given that analyses for fiber cross-section and Jacobian determinant were performed in the log scale, the color-coded effects in significant areas were calculated as exp(β×100) – 1 where β is the GLM coefficient of Aβ1–42 for the corresponding measure.
Interestingly, but not surprisingly, a significant linear correlation between Aβ1–42 level and ilr2 was found in the left hippocampus, and also in the anterior part of the cingulate cortex, in the left dorsal anterior insula, and in the genu of the CC (see Fig. 13). From the F-tests for the other two CSF biomarkers, total tau and P-tau181, no significant correlations were detected between them and diffusion-derived measures.
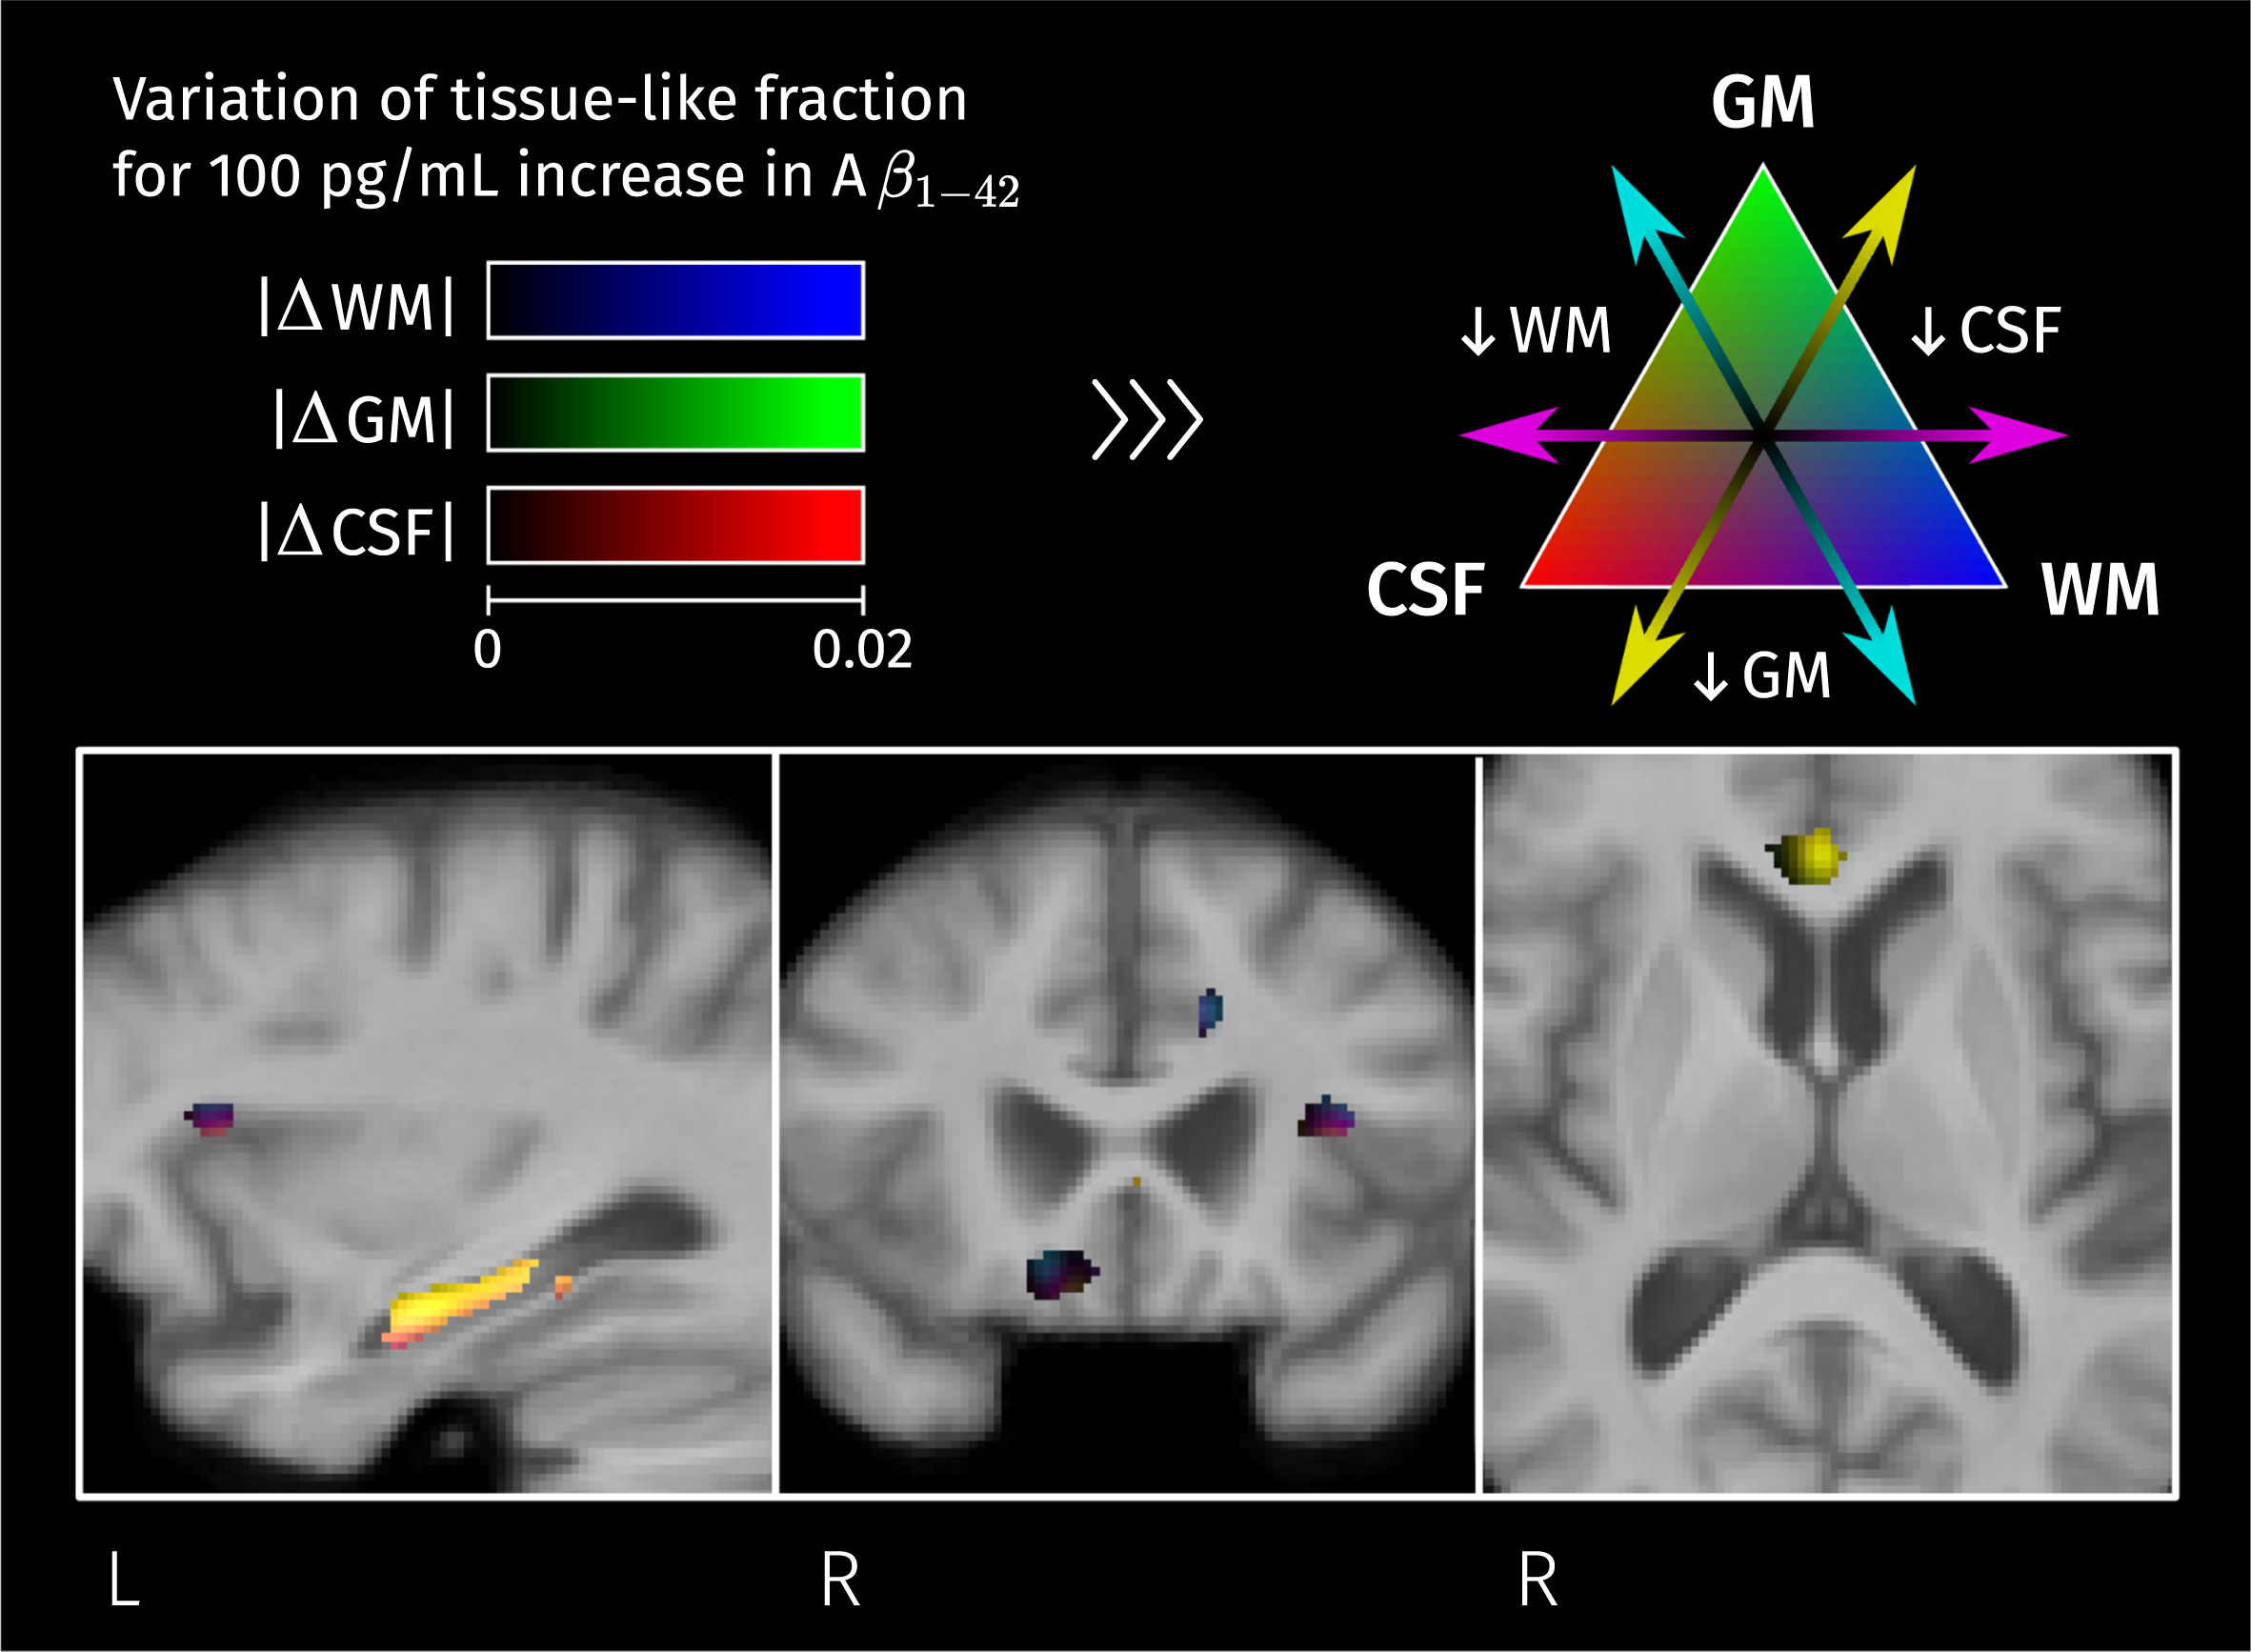
Significant linear relation between CSF biomarker for Aβ1–42 and the second isometric log-ratio was found in the left hippocampus. Colormap represents the estimated GLM coefficient of Aβ1–42 (multiplied by 100) for the GM-like and CSF-like fractions.
DISCUSSION
In this work, we presented a comprehensive analysis framework for the study of AD effects in brain tissue by comparing a set of measures derived from multi-shell DWI between groups of subjects belonging to the AD continuum and cognitively healthy controls. This framework integrates the strategies of fixel-, voxel-, and tensor-based morphometry to detect differences in fiber specific properties, tissue composition, and macrostructural changes, respectively. One novel aspect of this work is the use of MSMT-CSD to model the complex underlying WM fiber configuration while allowing to account for partial volumes by estimating the contributions of each tissue type to the diffusion signal.
Differences of fixel-wise measures
To study WM integrity, fiber-specific measures, namely AFD and FC, were investigated following the FBA approach [37]. The integration of the MSMT-CSD within the FBA pipeline allows improving the estimation of the mentioned fiber measures because it gives a more precise fODF in voxels where WM/GM and WM/CSF signals are mixed [35]. After applying the strong FWE correction to post hoc pairwise one-sided comparisons in two directions, decreased AFD was detected in the splenium of the corpus callosum for both MCI and ADD patients compared to controls (Fig. 5), while macrostructural decreases of fiber bundle cross-section were found in several WM tracts (Fig. 6). A previous investigation applied the FBA framework to study the WM integrity in AD and MCI patients using single-shell diffusion data [31] finding specific fiber tracts with significant decreases of the WM integrity measures in AD patients when compared to healthy controls. There are common findings such as reduced AFD in the splenium and reduced FC in the right cingulum, uncinate fasciculus, and ILF. Mito et al. [31] also reported a larger set of fibers tracts with decreased AFD in ADD patients, those tracts include the parahippocampal cingulum, inferior fronto-occipital fasciculus, and left fornix.
Some of the tracts in which we were able to detect significant reductions of FC, but not of AFD, correspond with tracts that have previously been reported to show differences in diffusion-based measures such as FA and MD. The study of voxel-based metrics derived from the diffusion tensor and diffusion kurtosis models has also reported reduced WM integrity measures in the cingulum, uncinate fasciculus, arcuate fasciculus, and ILF [20–22, 72]. In the corticospinal pathway, previous works have reported reduced mean kurtosis, increased free-water index, and increased FA in regions where the corticospinal tracts cross with other ones [20, 43], which can be observed when WM degeneration occurs in a subset of crossing fiber populations. This hypothesis is consistent with the results herein presented, which show degeneration specifically along some fiber bundles in the corticospinal tract in AD patients. One possible explanation of why fiber-specific differences outside the splenium were captured by the measure of macrostructure rather than by the measure of microstructure is that those differences, previously attributed to microstructural changes, could be macroscopic effects captured by diffusion tensor metrics due to PVE [73].
Differences in voxel-wise measures
Differences of tissue-like composition as well as macroscopic differences of volume (with respect to the template) were detected in both groups of patients when compared to controls. Detected changes in tissue-like composition in the ILF, cingulum, thalamic radiations, and superior temporoparietal areas correspond to a reduction of the WM-like fraction (see Fig. 8), these changes are concordant with previously reported decreased FA and increased MD in such areas [20, 23] suggesting a widespread degeneration of diffusion barriers in WM. It is worth mentioning that WM-like reduction in temporal and parietal structures coincides with a significant reduction of the local volume (see Fig. 13), meaning that the WM degeneration is also detectable at the macroscopic level and might be more advanced than the degeneration observed in the frontal areas where no volumetric differences were detected.
When looking at the GM-like fraction differences between groups (see Fig. 9), the decreases detected in the cortical and subcortical areas are consistent with the widely reported landmarks of the disease: hippocampal atrophy and cortical atrophy in the temporal lobe. Therefore, these differences most likely correspond to actual GM degeneration. Some of the observed changes in tissue-like composition inside WM areas, manifested as increases in ilr, are the result of increased GM-like fraction; from the calculation of ilr we know that there must be an increase of the CSF-like fraction too, and therefore a reduction of the WM-like fraction; as this effect is mostly observed in WM areas such as the longitudinal fasciculi (bright areas in Fig. 8), this is a change that indicates degeneration of diffusion barriers in WM as a result of demyelination, axonal loss or gliosis. Those findings are consistent with the reported tissue-like composition of white matter hyperintensities observable in, e.g., T2-weighted FLAIR MR images [71]. Increased CSF-like fraction accompanying WM degeneration (see Fig. 10) is also compatible with recent research reporting differences of the free-water index between AD and MCI compared to controls [36]. Although their analyses use a different diffusion model, the CSF-like signal fraction obtained in this work is conceptually close to the free-water index, both being related to the part of the signal produced by isotropic unrestricted diffusion.
Differences in local volume herein reported, namely ventricle expansion and atrophy inside the temporal lobe (shown in Fig. 11), have been widely reported in AD literature [4], these results partially overlap with the results of a previous study performing TBM using a considerably larger dataset of T1-weighted MRI [74].
Correlations with CSF biomarkers
We included an exploration of the relation between CSF biomarkers and the different diffusion-derived measures, resulting in significant effects of Aβ1–42 levels in macroscopic measures and tissue composition in certain areas. Negative correlations between measures of volumetric change (with respect to the template) and CSF Aβ1–42 values were found in the interface between the ventricles and the genu of the CC (Fig. 12), indicating expansion of the ventricles in the presence of decreased (i.e., pathological) values of this biomarker.
All effects of CSF Aβ1–42 levels in fiber-specific measures detected with the omnibus F-test were confirmed as effects driven by the volumetric differences with respect to the population template, and no significant correlations with AFD were detected at the significance threshold level after applying the strong correction for multiple comparisons during post hoc testing; this is an important consideration because some of the previous findings of significant correlations between CSF biomarkers and diffusion tensor measures of WM integrity have been reported without proper adjustments for multiple comparisons [75].
The significant correlations between CSF Aβ1–42 levels and tissue-like composition come from different combinations of tissue-like content variation depending on their location (seen as different colors in Fig. 13). As CSF Aβ1–42 levels are more pathological, the GM-like fraction decreases in the left hippocampus and genu of the CC, WM-like fraction decreases in the cingulate cortex and insula, and CSF-like fraction increases in all these areas. The detected relations between tissue-like compositions and CSF levels of Aβ1–42 are consistent with other works that have reported correlations between this biomarker and diffusion tensor parameters in the temporal lobe area [75, 76].
About treating tissue diffusivity properties separated from morphology
In this paper, we decided to treat the model-derived measures separate from deformation-derived measures instead of modulating the former with the latter. This approach resembles the original voxel-based morphometry proposal [39, 40] which was designed to detect local differences by removing most of the anatomical variability with the spatial normalization, and then the macrostructural differences, captured by the deformation fields, could be analyzed with tensor-based morphometry. The decision to not include a modulation step was guided by two considerations: First, it prevents the decreased sensitivity due to the increased variance of modulated measures, especially when advanced normalization algorithms are used [64], as is the case here. Second, it allows the post hoc investigation of effects sources (constituency versus morphology), facilitating the interpretation of the results. However, the original FBA pipeline [37] explicitly recommends combining AFD with FC to obtain a third measure, called FDC, that reflects ‘the ability to relay information’. To compare against what was detected in AFD and FC, we tested for group effects in FDC with an F-test (see Supplementary Figure 2, which shows the tracts where significant effects of group in FDC were detected) and post hoc testing for pairwise differences (see Supplementary Figure 3, which shows the pairwise differences in FDC). Significant effects and pairwise differences of FDC are very similar to the significant differences of AFD (Fig. 5) and do not capture the effects that are detected when analyzing FC.
Comparison with diffusion kurtosis imaging analysis
For the purpose of comparing the presented analyses against previously used models for analyzing multi-shell DW-MRI, we have tested for group effects and correlations with CSF biomarkers in diffusion kurtosis imaging (DKI) parameters voxel maps, namely MD, FA, and mean kurtosis (MK) using the same data and preprocessing. DKI fitting was performed using an iterative weighted linear least squares estimator [77] with the addition of constraints to ensure physically plausible fits [78]. We followed the same statistical approach we used for voxel-wise measures, i.e., an omnibus F-test to detect any group effect or biomarker correlation in any of these three DKT parameters followed by post hoc analyses of pairwise group differences or biomarker correlations for each measure while performing strong FWE correction for multiple comparisons.
The results indicate patients exhibit reduced FA (see Supplementary Figure 4) in areas around the ventricles that might not be related to WM microstructural degeneration but to PVE with surrounding CSF. Decreased FA for ADD patients was also observed in the hippocampal area, in the anterior part of the superior longitudinal fasciculus, and in the intersection between the cingulum bundle and the corticospinal tract. All these areas exhibited significant differences in FC and tissue-like composition according to our results, therefore the differences observable with FA are captured by our analyses. However, FA does not reveal significant decreases in some of the areas where we detected reductions of FC and WM-like content such as the uncinate fasciculus and inferior longitudinal fasciculus, suggesting that the sensitivity of FA is limited compared to our more comprehensive analysis.
Maps of MD group differences (Supplementary Figure 5) closely match the maps of group differences for tissue-like fractions. Increased MD is associated with distinct phenomena depending on the location. In GM it agrees with increased CSF-like fraction accompanied by decreased GM-like fraction. Meanwhile, the increase of MD in WM coincides with an increased GM-like fraction rather than an increased CSF-like fraction, favoring the explanation of those differences as an increase in cellularity rather than a mere increase of free-water content. The sensitivity of MD is comparable with the sensitivity of tissue-like fractions, the latter giving more specific information about underlying changes. The decreases in MK coincide with areas where MD increases (Supplementary Figure 6), indicating the use of MK does not seem to add sensitivity compared to MD in this cohort.
No significant correlations between DKI parameters and CSF biomarkers were detected. Although the sample for the analyses with CSF biomarkers was quite small (37 subjects), we did find significant correlations between CSF levels of Aβ1–42 and measures of macrostructural variations, as well as tissue-like content. This suggests the diffusion-derived measures used in this work might be more sensitive to AD pathological processes.
Limitations
This work has some limitations regarding image acquisition. First, DW-MR images were acquired with a restricted field of view, thus the analyzed area did not include the superior slices of the brain, where GM changes might be ubiquitous. Second, geometric distortions due to field inhomogeneity were not corrected, as no explicit image data tailored for this purpose were acquired; therefore, high variability in high susceptibility areas could limit the power to detect significant differences.
Other important limitations are the small sample size, which reduces the power of the performed tests, and the fact that the data were acquired in only one center, which could hinder the generalizability of the reported results. Given these limitations, and the strong correction for type I errors, the reported differences might be underestimating the extent of actual differences between groups. Future work reproducing these analyses with larger datasets, and therefore more power, could help to detect more subtle and widespread disease effects in brain tissue. Such work should be possible with the inclusion of advanced acquisition protocols in large multi-centric studies such as the Alzheimer’s Disease Neuroimaging Initiative (ADNI3).
Conclusions
This study presents a comprehensive neuroimaging approach for the study of micro- and macroscopic brain differences in the AD continuum using multiple measures derived all from a single DW-MRI data set. The results corroborate prior studies in that there are widespread significant differences between the brains of patients with AD dementia, MCI due to AD, and those of age-matched healthy controls. The use of tissue-specific measures capturing microstructural diffusivity properties, as well as measures of morphological changes, gives additional specificity about the nature of observed AD effects. The significant macrostructural changes comprise ventricle expansion, temporal lobe atrophy, and shrinkage of fiber bundle cross-sectional area in some WM tracts such as the splenium, the corticospinal tract, the cingulum bundle, and the inferior longitudinal fasciculus. Changes in fiber-specific WM microstructure were only detected in the splenium and tapetum, while reductions of WM-like content were observed in a larger set of areas including the cingulum, and the inferior and superior longitudinal fasciculi, where those variations are accompanied by increased GM-like fraction suggesting changes related to increased cellularity instead of increased free-water content. Variations in tissue composition were also detected in the hippocampus and insular cortex as reductions of the GM-like fraction accompanied by increases of the CSF-like fraction, indicating true GM degeneration. The strong control for false positives incorporated in our analyses supports the robustness of reported findings. Direct comparison with DKI analysis suggests that diffusion-derived measures used in this study could be more sensitive to differences between AD patients and controls than DKI parameters.
Footnotes
ACKNOWLEDGMENTS
The authors thank Mrs. Naomi De Roeck, Mrs. Jill Luyckx, Mrs. Shana Mangelschots, Drs. Mandy Melissa J. Wittens, Dr. Charisse Somers, and Dr. Joery Goossens (BIODEM, UAntwerp) for their assistance with patient recruitment and follow-up, data collection, and CSF biomarker analyses.
DG received funds from the “Departamento Administrativo de Ciencia, Tecnología e Innovación” - COLCIENCIAS, grant 727.
RS is supported by fellowship funding from the National Imaging Facility (NIF), an Australian Government National Collaborative Research Infrastructure Strategy (NCRIS) capability.
BJ is a postdoctoral fellow of the Research Foundation Flanders, Belgium (FWO: 12M3119N). BJ and JS gratefully acknowledge support from Belgian Science Policy Prodex (Grant ISLRA 2009–1062).
This research was funded in part by an unrestricted research grant from Janssen Pharmaceutica NV, Belgium; the agency of Flanders Innovation & Entrepreneurship (VLAIO); the Flemish Agency for Innovation by Science and Technology (IWT 140262); the Interreg V programme Flanders-The Netherlands of the European Regional Development Fund (ERDF) (Herinneringen/Memories project).