
Abstract
Background:
In recent years, there have been several meaningful advances in the understanding of the cognitive effects of vestibular loss. However, there has not yet been an investigation exploring the early biomarkers of preclinical cognitive decline in individuals with age-related vestibular loss.
Objective:
We aim to explore the “early biomarkers” of preclinical cognitive decline based on altered cortical activity (resting-state electroencephalography (EEG) and P300) with a multichannel EEG system in individuals with age-related vestibular loss.
Method:
This is a case-control study. A total of 21 patients with age-related vestibular loss (66.50±5.79 years, 13 [62% ] females), 19 patients with cognitive decline (68.42±5.82 years, 13 [68% ] females), and 21 age- and sex-matched healthy controls were recruited. All participants underwent a comprehensive battery of neuropsychological tests, audio-vestibular evaluations, resting-state EEG and P300 recordings.
Results:
Significant visuo-spatial, executive, and attention hypofunction were observed in the age-related vestibular group, reflected by decreased subscale scores. Reduced gamma functional connectivity between the right cuneus (Brodmann area 19, BA19) and the left superior parietal gyrus (BA7) was observed in both the age-related vestibular group and the cognitive impairment group. Smaller P300 amplitudes were observed in the age-related vestibular group (1.43±3.69μV) and cognitive impairment group (1.15±4.24μV) than in the healthy control group (3.97±2.38μV).
Conclusion:
Decreased P300 amplitude and functional connectivity between the right BA19 and the left BA7 were “early biomarkers” observed in individuals with age-related vestibular loss; these biomarkers may contribute to visuospatial, executive, and attention hypofunction.
INTRODUTION
In recent years, there have been several meaningful advances in the understanding of the cognitive effects of vestibular loss. Reduced vestibular function in healthy older adults is associated with diminished spatial cognitive skills [1, 2] and increased levels of cognitive impairment among individuals with mild cognitive impairment (MCI) and Alzheimer’s disease (AD). Patients with vestibular dysfunction were threefold more likely to have AD than age-matched controls [3]. In addition, recent studies have indicated cognitive deficits including nonspatial cognitive impairment, such as short-term memory or attention function [4–8]. Vestibular dysfunction may be one of the risk factors for cognitive decline. Vestibular loss occurs universally with age in the phenomenon known as age-related vestibular loss (presbyvestibulopathy). Population-based studies have suggested that nearly 50% of individuals over age 60 demonstrate some form of vestibular physiological decline [9, 10] Finding preclinical markers of cognitive decline associated with age-related vestibular loss in healthy older adults has the potential to lead to a more accurate identification of individuals who will ultimately develop cognitive decline, allowing treatments to be initiated earlier.
Brain functional changes are a potential mechanism underlying the association of vestibular loss and cognitive decline. Studies have shown that individuals with cognitive decline show altered cortical activity (spontaneous and elicited brainwaves) compared to age-matched peers undergoing healthy aging. Cognitive decline is associated with frequency-specific changes in oscillatory activity, generalized slowing of the spectral profile, reduced complexity, and perturbations detected by resting-state electroencephalography (EEG) [11–14]. When analyzed with machine learning, resting-state EEG performed well as a biomarker, especially in classifying AD and healthy subjects, a task at which reached approximately 98% accuracy [13, 15–21]. More specifically, systematic changes have been noted in auditory P300 event-related potentials (ERPs) with the development of AD [22]. It is widely speculated that P300 amplitude is an index of brain processes elicited by tasks required in the maintenance of working memory, attention, and executive function [23]. However, there is limited information on spontaneous and elicited brainwaves in vestibular loss among healthy older adults.
In this study, all participants underwent a comprehensive battery of neuropsychological tests, comprehensive audio-vestibular evaluations, and resting-state EEG and P300 recordings. We used resting-state EEG and P300 recordings to detect the same characteristics of spontaneous and elicited brain activity in participants with age-related vestibular loss and cognitive decline compared with healthy controls, balancing with age, sex, years of education, hearing threshold, central auditory processing, alcohol intake, smoking, and underlying diseases. We aimed to identify an “early biomarker” of preclinical cognition decline based on resting-state EEG and P300 with a multichannel EEG system in individuals with age-related vestibular loss.
METHODS
Participants
Community-dwelling older adults aged 60 to 85 years were recruited from the otolaryngology clinic of Shanghai Sixth People’s Hospital Affiliated Jiaotong University between August 2019 and December 2020. All participants were right-handed and able to comply with the instructions, and they or their legal representatives had a clear understanding of the purpose of the study. Individuals were excluded if they: 1) had middle ear lesions, acoustic neuroma, long-term noise exposure, and other congenital cochlear malformations; 2) had a history of psychiatric and/or neurological disorders; or 3) had cardiovascular disease, diabetes, or alcohol use disorder, as these conditions may affect cognitive function. Approval was obtained from the Ethics Committee of the Sixth People’s Hospital affiliated to the Shanghai Jiao Tong University (Clinical Trial Number: ChiCTR2000029009).
Audiometric examination
Audiograms were measured in 1-octave steps at frequencies ranging from 0.25 to 8 kHz using a manual audiometer (GSI-61, Grason-Stadler Inc., Eden Prairie, MN, USA) coupled with TDH-39 headphones. Descriptions of distortion product otoacoustic emissions, tympanograms, and central auditory processing tests are provided in the Supplementary Material. Descriptions of distortion product otoacoustic emissions were recorded using an otoacoustic emissions system from Otometrics (Madsen Capella2, Natus Medical Denmark ApS, Taastrup, Denmark) with insert-mounted probes in a soundproof room (<30 dBA). Emissions were measured at 2f1 –f2 target frequencies of f2 = 2, 3, 4, 6, and 8 kHz. The f2/f1 ratio was set to 1.2. Response growth functions were collected using L2 levels from 35 to 85 dB SPL measured in 5 dB steps. The level of L2 was 10 dB less than that of L1. Tympanograms were obtained over the pressure range of 200 to –400 daPa at 226 Hz using a GSI tympanometer (Tympstar, Grason-Stadler Inc., Denmark). The passing criterion was a type A peak in a range of –100 to +50 daPa with a static admittance of 0.3–1.6 mho.
Central listening processing test
The auditory perception tests of speech, dichotic listening and temporal processing were performed in two on-site soundproof rooms using an audiometer equipped with TDH-39 headphones. Stimuli were presented at 40 dB sensation level. The speech-in-noise test and competing sentences test were assessed using the Mandarin version of the hearing-in-noise test that was developed with MATLAB (R2012a) software by the House Ear Institute. The Mandarin version of the hearing-in-noise test consists of 240 Chinese sentences organized into 12 phonemically balanced lists (20 sentences in each list). Each sentence consists of 10 words; the words were recorded digitally from a male speaker and were equated for naturalness, length, and intelligibility. The sentences were presented bilaterally with -5 dB signal-to-noise ratio in the speech-in-noise test and –3 dB signal-to-noise ratio in the competing sentences test. Each subject was tested with one of the sentence lists. Each subject was instructed to repeat the sentence as accurately as possible. Performance was scored as the percentage of words that the subject repeated correctly from a total of 200 words. The dichotic listening test included 20 pairs of double-digits presented in random order. Each digit in the pair was presented simultaneously to the same ear; measurement was obtained from both the left ear and right ear. The numbers in each pair were aligned at onset and offset. Subjects were instructed to repeat both numbers in any order. A response was judged as correct if the two numbers were repeated correctly. The performance was scored as the percentage of correct responses out of the total number of responses. The gap detection threshold was measured using a 3-interval forced-choice procedure designed with MATLAB software. A gap varying in size from 1 to 20 ms was randomly embedded in the middle of 1 of 3 noise bursts that were presented in the 3 stimulus intervals. Three buttons presented on a computer monitor corresponded to the 3 intervals. Participants were instructed to click the button to indicate which interval contained the gap stimulus. The next trial was initiated after a response was given to the previous trial. No feedback was given to the subject regarding response accuracy. Each test run started with a gap of 20 ms; the size of the gap decreased by 2 ms each time the subject correctly identified which interval contained the gap and increased 1 ms for each incorrect response. This 2 ms-down, 1 ms-up rule was followed until 12 reversals were reached. The gap detection threshold (in ms) was calculated from the mean value of the last 8 reversals.
Video head impulse test (vHIT)
The vHIT test was employed to address the functions of the three respective semicircular canals based on the selection of the test plane. The standard protocol of Halmagyi et al. [24] was followed in the vHIT test using an ICS Impulse R3.0 vHIT device (Otometrics A/S; Taastrup, Denmark). During the test, participants seated facing a target dot positioned on a wall at 1 m and instructed the subject to look continuously at the dot. The subject’s head was quickly turned laterally by 5-15° by the operator at a peak angular velocity of 200-250°/s. The ratio between the velocity of the slow-phase eye movement and the velocity of the head impulse was calculated as the vestibulo-ocular reflex HIT gain, which was measured in all three planes to evaluate the function of each semicircular canal. The age-related vestibular loss defined as a video-HIT gain threshold between 0.6 and 0.8.
Rotary chair test (RCT)
The RCT was performed with a rotary chair (System 2000; Micromedical, USA) to evaluate the function of the horizontal semicircular canal at low frequencies from 0.1 to 0.64 Hz at ratio steps (seven frequencies in total). It was performed with a rotatory chair in a completely dark room with the eye movements observed via infrared rays. The participant’s head was restrained in 30° forward inclination. After the recording of spontaneous nystagmus, the horizontal gaze-evoked nystagmus and the eye movements in both saccade and pursuit tests were recorded. Finally, the eye movements were recorded using the sinusoidal harmonic acceleration test. The eye movements were measured in terms of gain, phase, and symmetry. The RCT result was considered abnormal if the results were outside the normal ranges at two consecutive frequencies, suggesting dysfunction of the low-frequency response of the horizontal semicircular canal. The age-related vestibular loss defined as a RCT gain thresholds is between 0.1 and 0.3.
Cognitive testing
All participants completed several different cognitive tests administered by professional geriatricians. Cognitive testing consisted of the following assessments: 1) Mini–Mental State Examination (MMSE) [25]; 2) Montreal Cognitive Assessment Basic (MoCA-B) [26]; 3) Addenbrooke’s Cognitive Examination III (ACE-III) [27]; 4) Symbol Digit Modalities Test (SDMT) [28]; 4) Shape Trails Test (STT, including parts A and B) [29]; 5) Clock Drawing Test (CDT) [30]; 6) Judgment of Line Orientation (JLO) [31]; 7) 30-item Boston Naming Test (BNT) [32]; 8) Animals Fluency Test (AFT) [33]; and 9) Auditory Verbal Learning Test (AVLT, containing 5-min delayed recall, 20-min delayed recall and delayed recognition trials) [34, 35]. The AVLT assesses an individual’s verbal learning and memory skills, and the SDMT and STT require participants to focus attention and executive a visual-motor task. The CDT and JLO measure visuospatial function, while The BNT and AFT measure language deficits and naming ability. Sleep quality was assessed using the Pittsburgh Sleep Quality Index [36], summary scores were reported, and depression status was assessed using the Self-Reported Inventory of Depressive Symptomatology [37].
Resting-state EEG acquisition
Resting-state EEG was recorded using a 256-channel system (EGI, HydroCel Geodesic Sensor Net, GSN) with a sampling rate of 1000 Hz. All electrode-skin impedance values were kept below 50 kΩ. During recordings, participants were instructed to keep awake and avoid eye movements or posture changes, and the participant and EEG were monitored for signs of drowsiness. A 5-min resting-state EEG recording was obtained while subjects sat in an armchair with their eyes closed.
Event-related potentials (P300) acquisition
During the P3 cortical waves test, the participants were asked to press a switch held in the right hand each time they detected a target tone with their eyes closed. The auditory oddball task included presentation of a 1 kHz pure tone (50-ms duration with a shaped 5-ms rise and fall time), while an “oddball” target stimulus was presented as a pure tone of 2 kHz. A stimulus at 1 kHz was presented in 85% of the trials, together with a stimulus at 2 kHz in 15% of the trials. The whole task consisted of a total of 1000 auditory stimuli with random interstimulus intervals ranging from 850 ms to 1450 ms. The sound stimuli with an intensity of 75 dB were delivered through two loudspeakers 100 cm from the subjects.
EEG data preprocessing
The EEG data preprocessing analysis was performed as described in our previous study [38, 39]. The EEG data pre-processing analysis was conduct by EEGLAB toolbox and scripts written in MATLAB2014a (The Mathworks, Natick, MA) as described in our previous study. The resting-state data were bandpass filtered between 0.5 and 70 Hz (ERP data were 0.1 and 40 Hz), and notch filtered at 50 Hz. The signal obtained on each trial was then resampled at 500 Hz and segmented into 150 epochs of 2 s. Data were inspected for quality and removed noise by interpolating channels and deleting epochs with poor signal quality. The next step was running independent component analysis and manually rejecting eye-moving, muscle-moving, and heart-beating components.
EEG power analysis
The spectrum analysis was computed by scripts written in MATLAB using the Welch function and then transformed to power spectrum density units in μV2/Hz across 150 epochs of resting-state EEG data. The data were extracted for each frequency band: delta (2-3.5 Hz), theta (4–7.5 Hz), alpha1 (8.5–10 Hz), alpha2 (10.5–12 Hz), beta1 (12.5–18 Hz), beta2 (18.5–21 Hz), beta3 (21.5–30 Hz), and gamma (30.5–45 Hz). To assess the spatial distribution, the average power estimates for each frequency band were calculated separately for 5 cortical regions: frontal, parietal, occipital, temporal area, and the whole brain. (Electrode locations are displayed in Supplementary Figure 1).
P300 analysis
The ERP analysis was computed by scripts written in MATLAB. The ERP data epoched into intervals of 2.0 s surrounding the marker (beginning 0.5 s was before the marker), including standard stimulus and deviation stimulus. The baseline was correlated according to the first 0.5 s of each segment to avoid high drift and eliminate noise. The traditional superposed average method was used to compute the average of trials for each subject and the group average across subjects. Amplitude and latency were used for comparison across groups.
Source localization
We used KEY-LORETA software (available free at http://www.uzh.ch/keyinst/loreta.htm) to implement a weighted minimum norm inverse solution method, called standardized low-resolution electromagnetic tomography (sLORETA), to localize cortical sources of EEG activity in the three-dimensional space. sLORETA calculated the standardized current source density at each of the 6,239 voxels in the gray matter and the hippocampus of the MNI-reference brain at eight frequency bands. This calculation of the current source density was based upon a linear weighted sum of the scalp electric potentials. sLORETA estimated the underlying sources under the assumption that the neighboring voxels should have a maximally similar electrical activity. Current source densities in each voxel between two conditions or groups were compared by permutation test on paired data. The results (maximum Z-values) are presented by specifying the name of the gyrus and the Brodmann area (BA) according to laterality and localization.
Functional connectivity
We used a voxel-wise approach to determine cortical regions of interest (ROIs). Exact low-resolution electromagnetic tomography (eLORETA) defined the Montreal Neurological Institute (MNI) coordinates of the cortical voxels underlying the electrode sites to create the ROIs. To analyze functional connectivity between all pairs of ROIs, we used lagged phase synchronization. Lagged phase synchronization is a method for evaluating the similarity between signals in the frequency domain based on normalized Fourier transforms, which could be resistant to low spatial resolution and volume conduction. Twelve bilateral ROIs were defined based on source localization results: 1) left and right superior parietal gyrus (SPG, BA7); 2) left and right cuneus (BA19); 3) left and right superior temporal gyrus (STG, BA22); 4) left and right occipital-temporal cortex (OTC, BA37); 5) left and right angular gyrus (AG, BA39); and 6) left and right intraparietal sulcus (BA40).
Statistical analysis
Data analysis was performed using SPSS version 24 (SPSS/PC, Chicago, IL, USA). Shapiro-Wilk tests were used to assess the normality of distributions. The χ2 test and t-test were used to determine intergroup differences depending on the data type. The power spectra of groups were compared using two-way repeated-measures ANOVAs, followed by a post hoc test (Bonferroni) for each frequency point. sLORETA was used to perform between-condition voxel-by-voxel comparisons of the current density distributions for each different frequency band, and a p-value < 0.05 was considered to indicate statistical significance. Nonparametric statistical analyses of functional sLORETA images (i.e., statistical nonparametric mapping) were performed for each contrast, and a t-test corrected for multiple comparisons was used for unpaired groups (p < 0.05).
RESULTS
Group classification and participants
All available vestibular test results were reviewed by an otolaryngologist for evidence of age-related vestibular loss according to the Bárány Society guidelines of 2019 [8]. Each of the flowing specific criteria must be fulfilled: 1) age≥60 years; 2) chronic vestibular syndrome at least 3 months duration with at least 2 of the following symptoms: postural imbalance or unsteadiness, gait disturbance, chronic dizziness, or recurrent falls; 3) peripheral vestibular hypofunction documented by at least 1 of the following: video-HIT gain between 0.6 and 0.8 bilaterally or RCT gain between 0.1 and 0.3; 4) not better accounted for by another disease or disorder. All participants evaluated cognitive function by professional geriatricians. The diagnosis of AD was based on the National Institute of Neurological and Communicative Disorders and Stroke/Alzheimer’s Disease and Related Disorders Association (NINCDS-ADRDA) criteria [40, 41], the Jak/Bondi criteria for minor neurocognitive disorder (another term for MCI) [42, 43], and the SCD-initiative group (an international working group of researchers and clinicians) Research Framework for subjective cognitive decline (SCD) [44]. Twenty-one participants with age-related vestibular loss but normal cognitive function were recruited as the age-related vestibular loss group (AVL group), while 19 participants with cognitive decline but normal vestibular function were recruited as the cognitive impairment group (CI group). A total of 21 participants, matched for age, sex, years of education, hearing threshold, central auditory processing, alcohol intake, smoking and underlying diseases and showing no evidence of age-related vestibular loss or cognitive decline, were selected as healthy controls (HC group).
A total of 21 patients with age-related vestibular loss (mean age of 66.50±5.7 years, 13 [62% ] were females), 19 patients with cognitive decline (mean age of 68.42±5.82 years, 13 [68% ]) were females), and 21 healthy controls were included in the analysis. There was no difference in the distribution of age, sex, education level, hearing threshold, or central auditory processing between the three groups (Table 1).
Comparison of clinical and audio-vestibular function test results across different groups
aNS indicates nonsignificant; *p < 0.05; **p < 0.01; ***p < 0.001. MMES, Mini-Mental State Examination; MoCA-B, the Montreal Cognitive Assessment-Basic; ACE, Addenbrooke’s cognitive examination-III; IDS-SR, Inventory of Depressive Symptomatology (Self-Reported).
Neuropsychological testing
The MMSE, MoCA-B, and ACE-III, which reflect overall cognitive status, showed on significant difference between the AVL and HC groups. The CDT (t = 2.021, p = 0.043), SDMT (t = 2.592, p = 0.013) and STT-A (t = 2.103, p = 0.040) scores were significantly decreased in the AVL group compared to the HC group. There was a significant decrease in the MMSE (t = 2.721, p = 0.010), MoCA-B (t = 3.635, p = 0.001), ACE-III (t = 3.130, p = 0.003), AVLT (t = 2.751, p = 0.009; F = 2.999, p = 0.005; t = 3.497, p = 0.001), AFT (t = 3.550, p = 0.001), BNT (t = 2.860, p = 0.007), CDT (t = 2.769, p = 0.009), SDMT (t = 5.041, p < 0.000), and STT (t = 3.003, p = 0.005; t = 2.450, p = 0.019) scores in the CI group compared to the HC group.
Significant hypofunction in the visuospatial, executive and attention domains was observed in both the CI group and the AVL group, as demonstrated by their CDT, SDMT, and STT-A scores (Fig. 1).
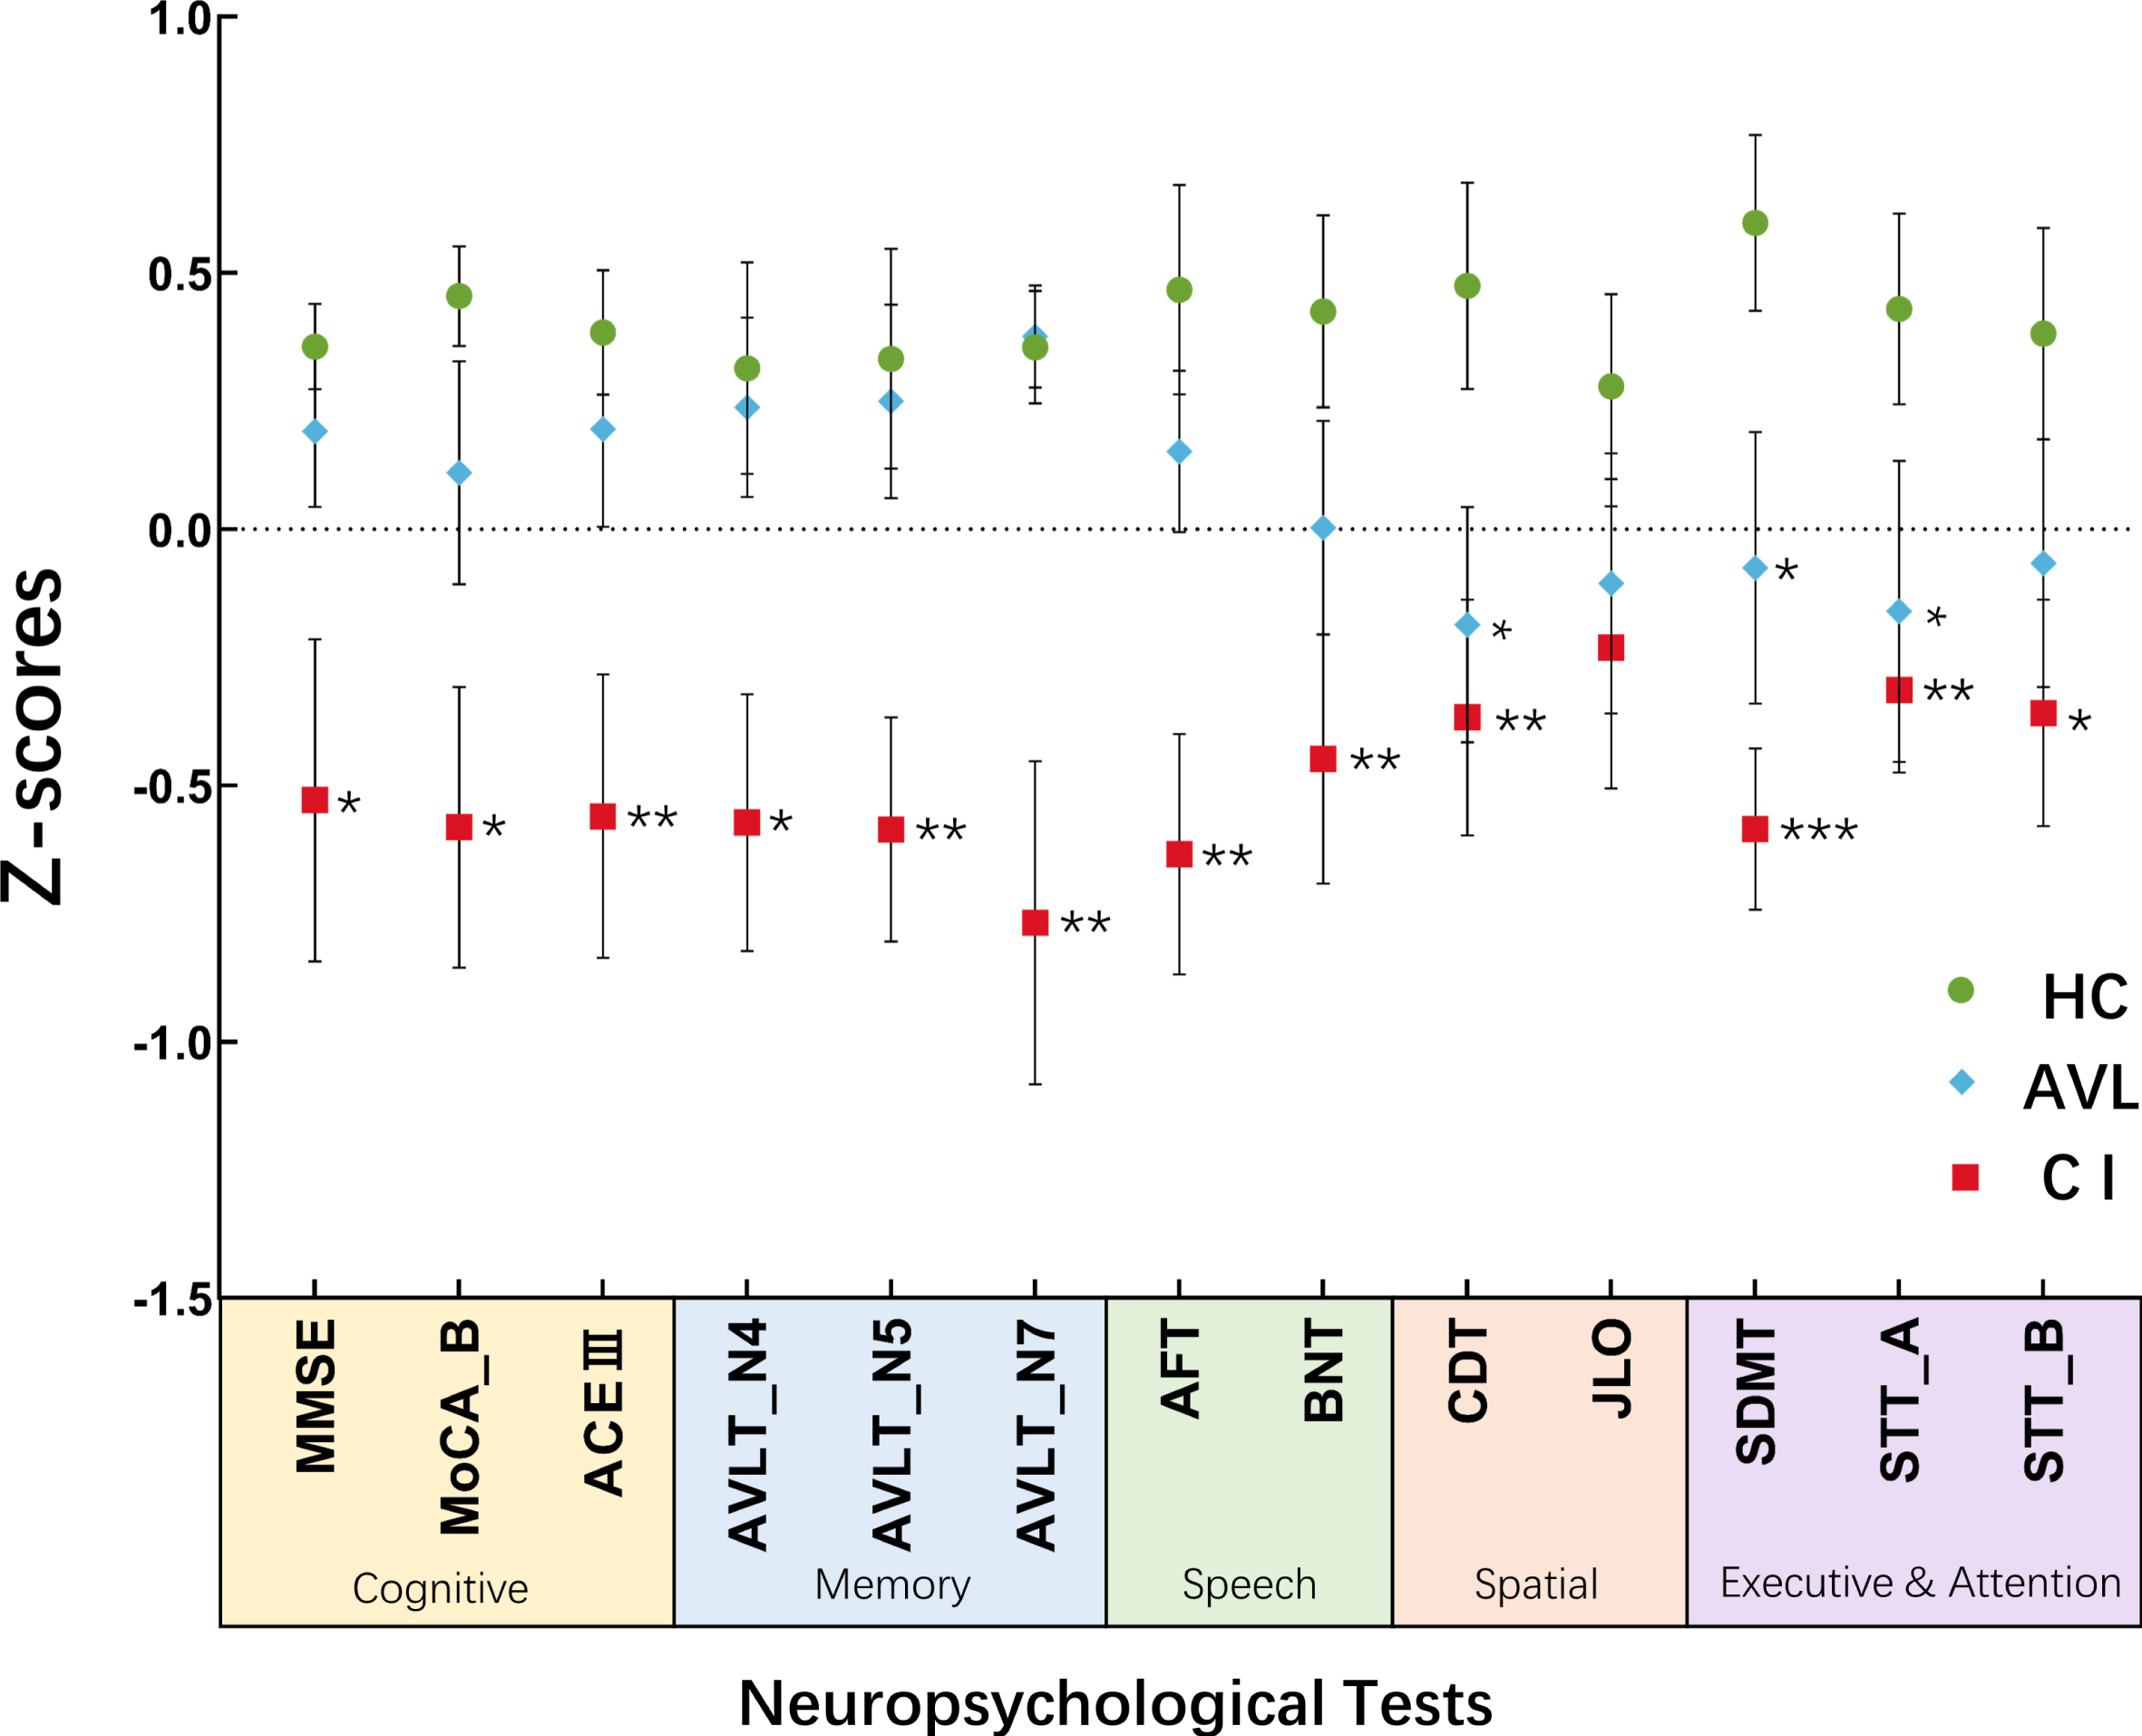
The results of neuropsychological tests were shown across three groups Significant hypofunction in visuospatial, executive and attention was observed both in CI group and AVL group demonstrated by the scores of CDT, SDMT, and STT-A. (Error bars represent the standard errors of the means). *p < 0.05; **p < 0.01; ***p < 0.001.
EEG power and source localization results
In the AVL group, alpha1, beta1, and beta3 band power was also decreased in the whole brain (t = 2.848, p = 0.029; t = 7.087, p < 0.001; t = 5.774, p < 0.001). A significant decrease in power was observed in the theta band in the frontal and occipital lobes (t = 6.226, p < 0.001; t = 5.257, p < 0.001), while beta2 power was observed predominantly in the parietal (t = 10.296, p < 0.001), occipital and temporal lobes (t = 10.813, p < 0.001; t = 5.931, p < 0.001). Reduced gamma-band power was observed in the frontal and parietal lobes (t = 3.411, p = 0.001; t = 3.437, p = 0.001). In the CI group, Alpha2, beta1, beta2, and beta3 band power significantly decreased in the whole brain (t = 2.631, p = 0.039; t = 8.679, p < 0.001; t = 13.909, p < 0.001; t = 7.482, p < 0.001). A significant decrease in power was observed in the delta band, especially in the frontal lobe (t = 3.261, p = 0.017). The decrease in theta band power occurred in the frontal and temporal lobes (t = 4.641, p < 0.001), while gamma band power decreased in the temporal lobe (t = 2.358, p = 0.022) (Fig. 2A). More specifically, the beta1 and beta3 band power showed a significant decrease in the whole brain, while theta band power decreased in the frontal and temporal lobes, and beta2 band power decreased in the parietal, occipital and temporals lobe in both the AVL and CI groups compared to the HC group.
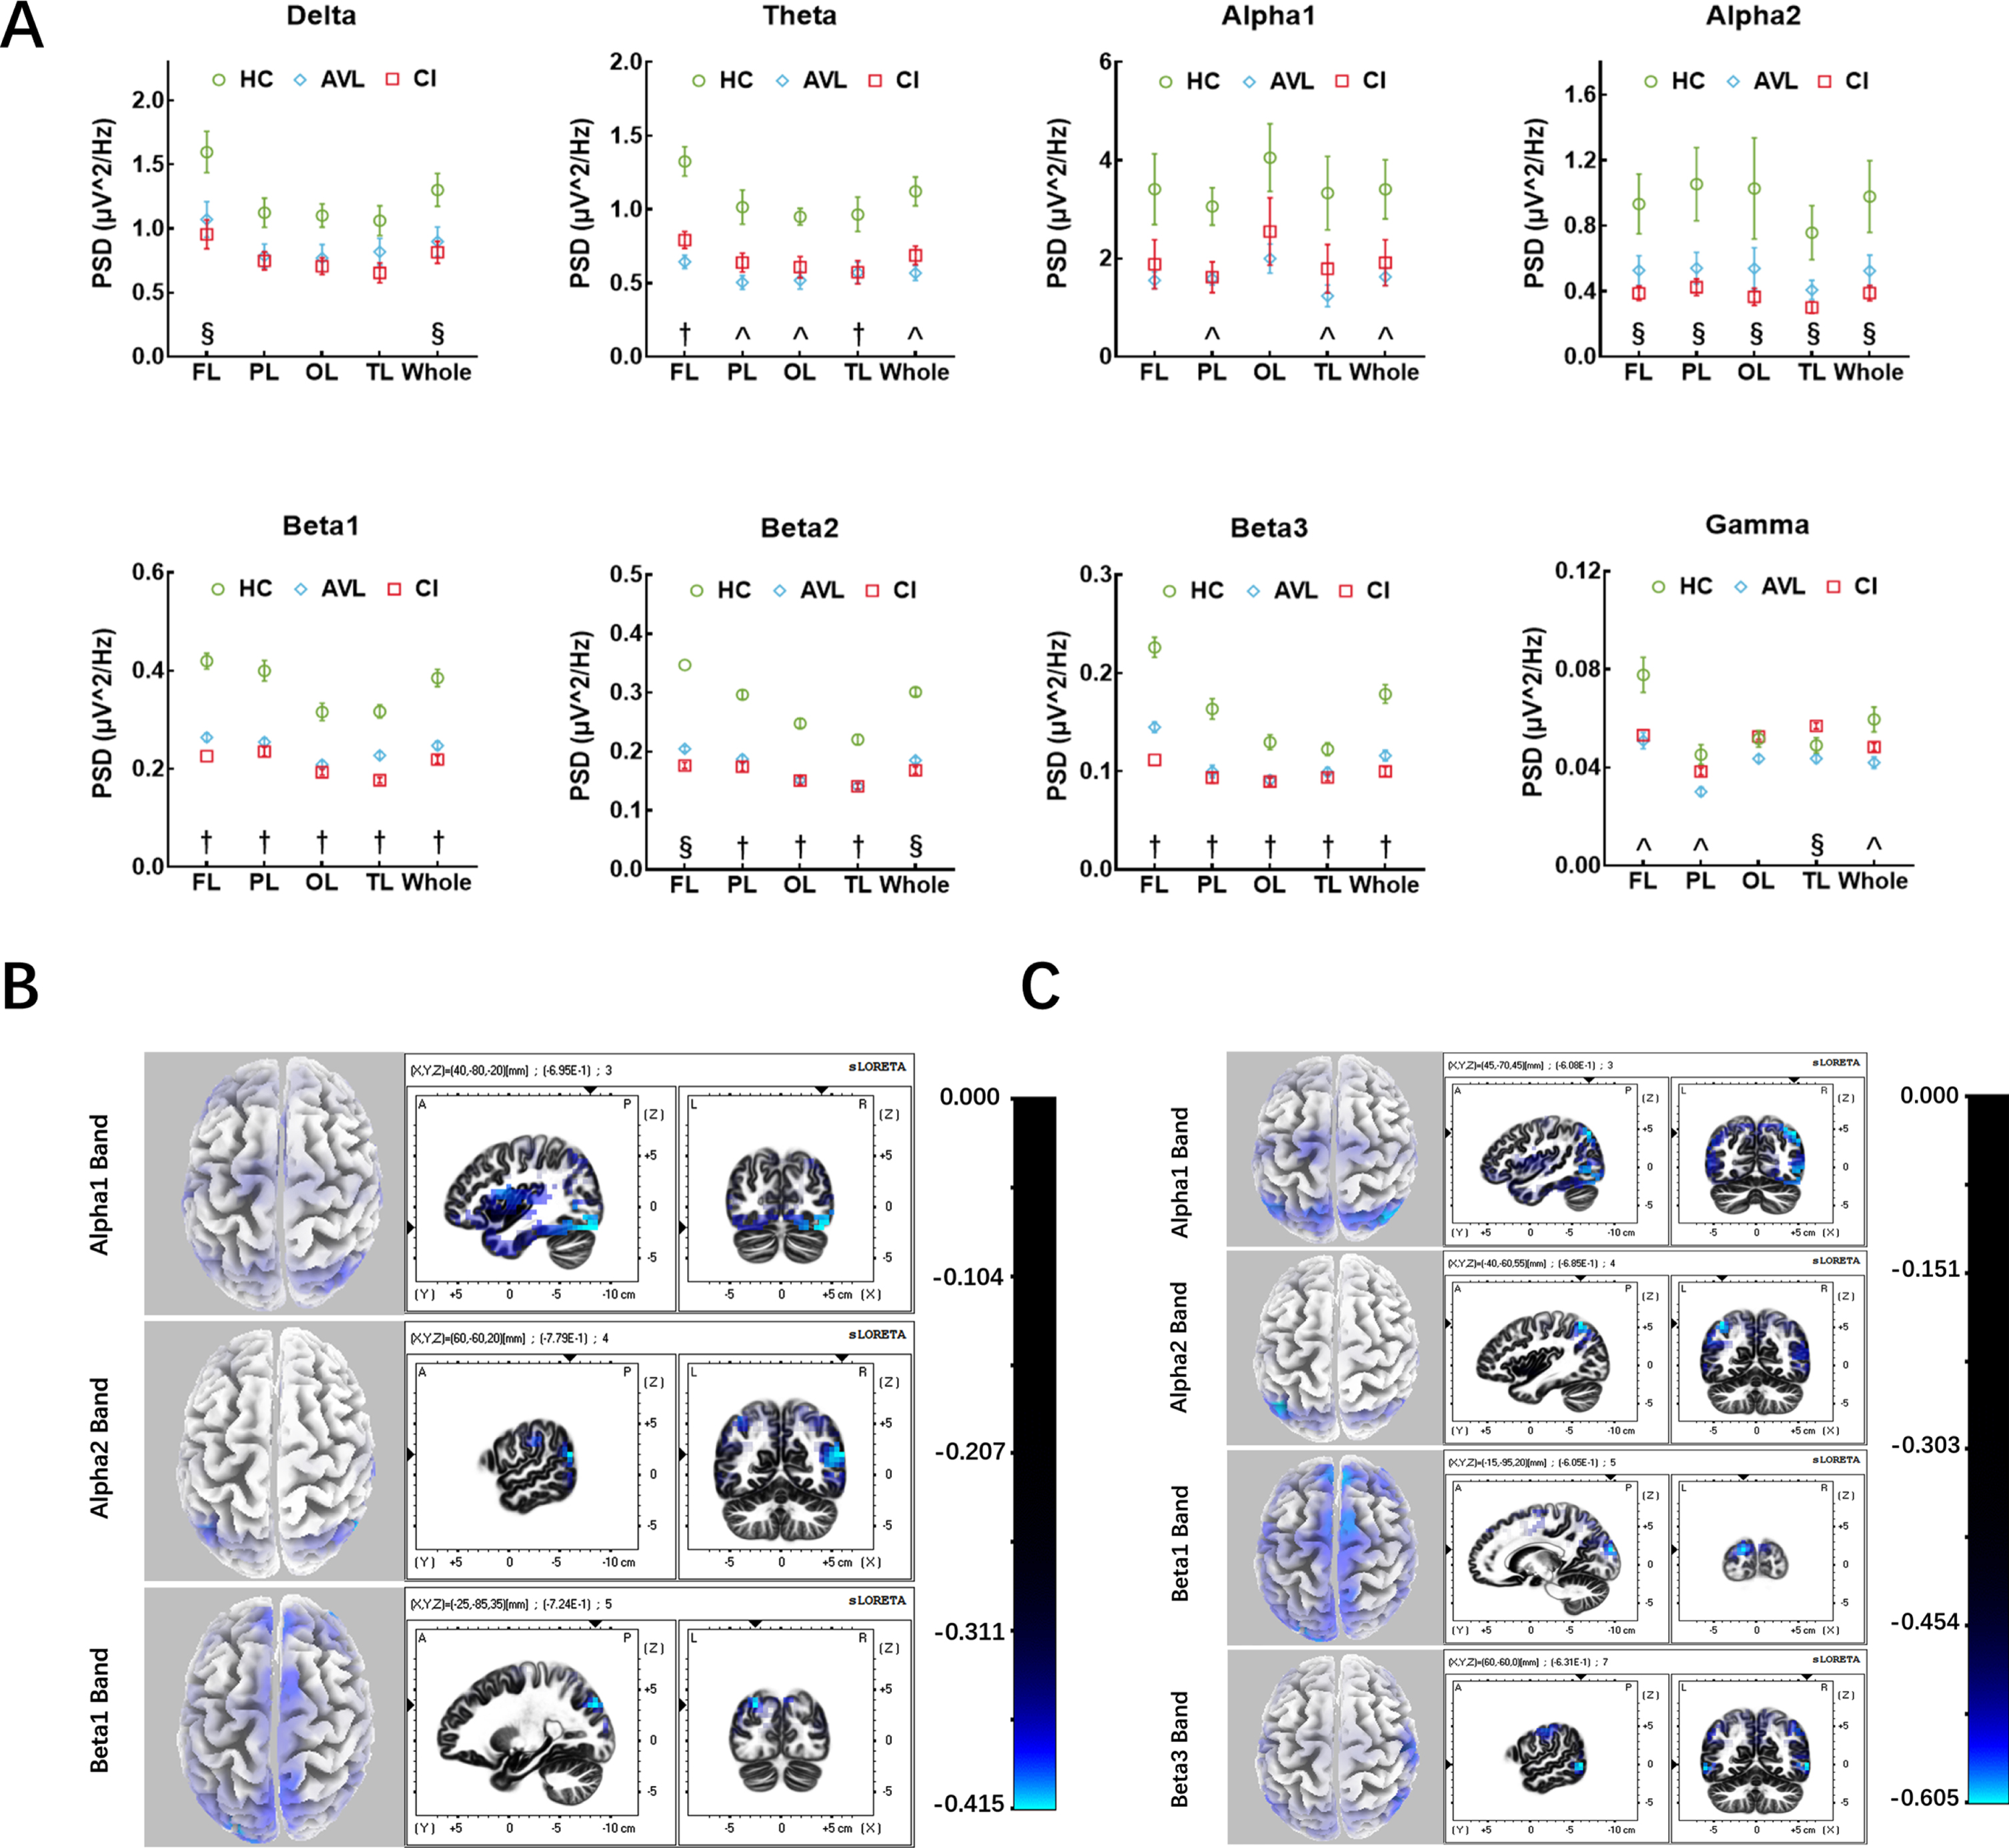
The results of EEG power and source localization. A) The EEG power results between three groups. Three kinds of results: (§) the significant difference of EEG power only between CI and HC groups; (∧) the significant difference of EEG power only between AVL and HC groups; (†) both CI and AVL groups showed significant difference of EEG power compared to HC group. (Error bars represent the standard errors of the means). PSD, power spectrum density; FL, frontal lobe; PL, parietal lobe; OL, occipital lobe; TL, temporal lobe. B) EEG source localization (sLORETA) activation maps between the AVL and the HC groups. Sources (blue area) superimposed on the average MRI images from the Montreal Neurological Institute (x-y-z coordinates of MRI images indicated on the figures). Alpha1 band showed decreased activity in V1, OTC, and cuneus. Alpha2 band showed reduced activity in IPS, STG, SPG, AG, OTC, and cuneus. While beta1 band showed decreased activity in cuneus, frontoparietal cortex, SPG, and pre-SMA. C) EEG source localization (sLORETA) activation maps between the CI and the HC groups. Sources (blue area) superimposed on the average MRI images from the Montreal Neurological Institute (x-y-z coordinates of MRI images indicated on the figures). Alpha1 band showed decreased activity in SPG, AG, OTC, and cuneus. Alpha2 band showed reduced activity in IPS, STG, SPG, AG, OTC, and cuneus. Beta1 band showed decreased activity in cuneus, and pre-SMA, while beta3 band showed reduced activity in MTG, OTC, cuneus, S3, and M1.
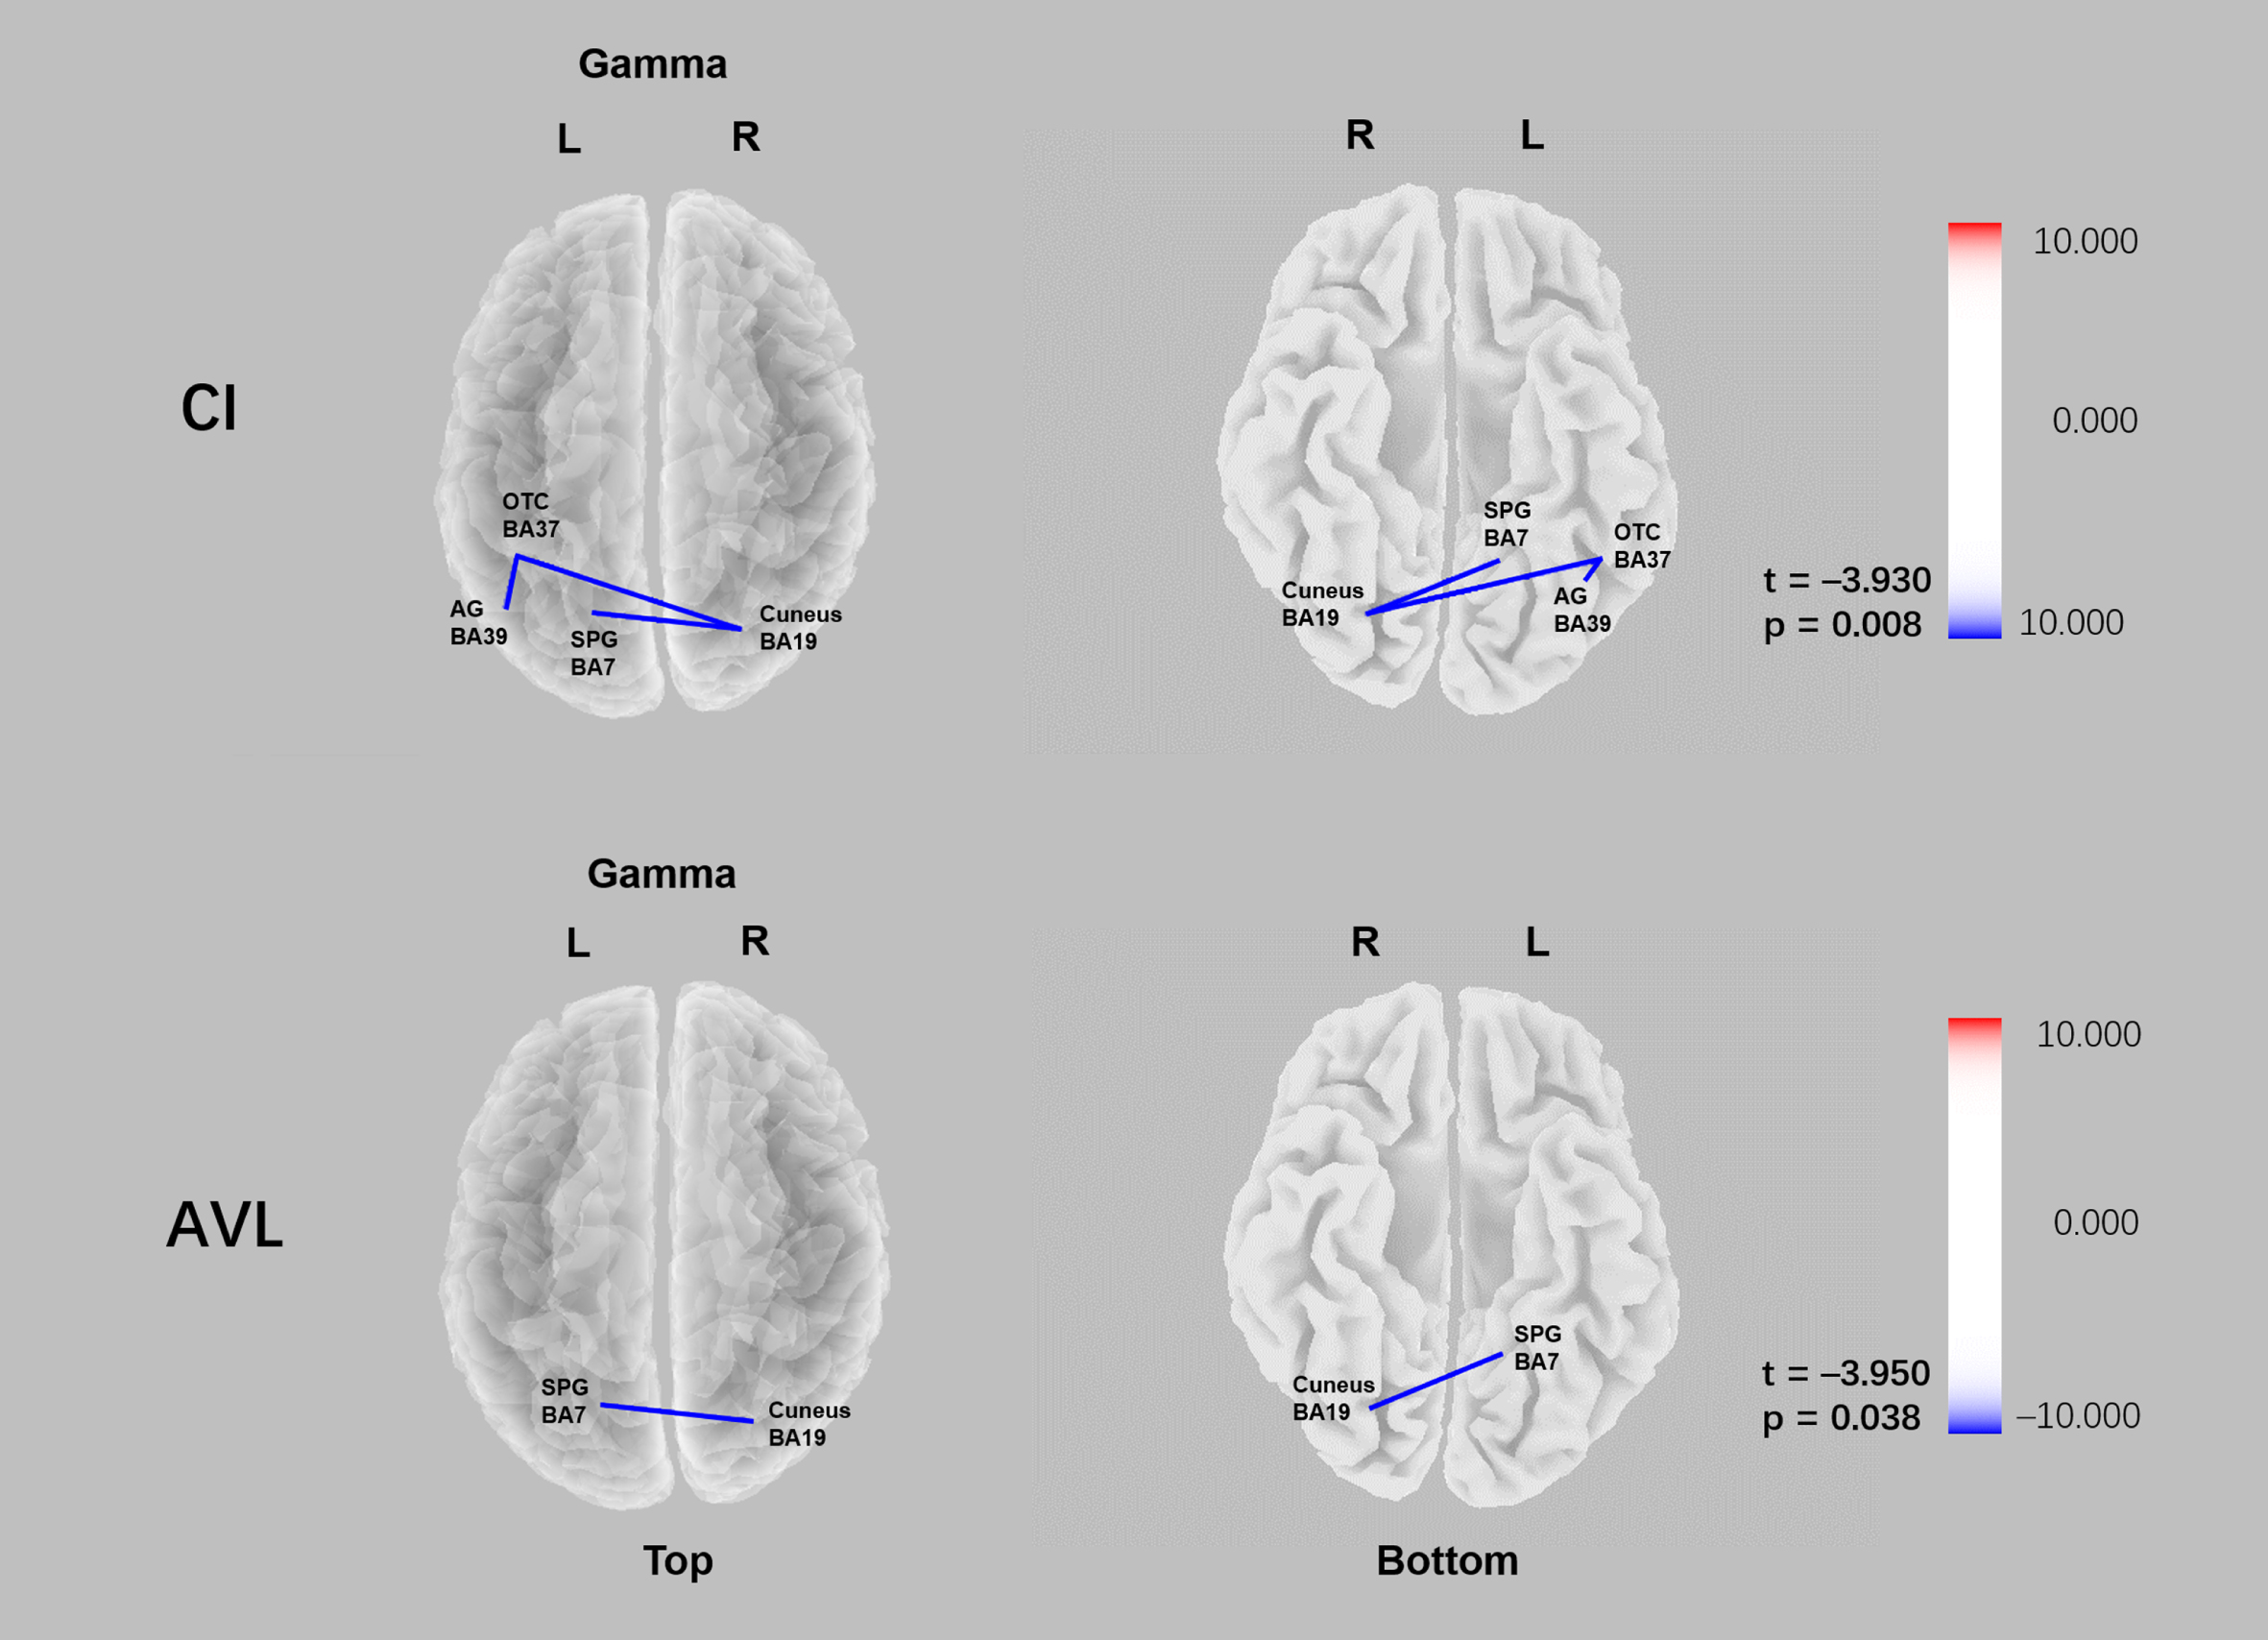
Comparison of functional connectivity of the CI and AVL groups relative to HC group in sLORETA source space. Lower gamma linear connectivity between the right cuneus (BA19) and the left superior parietal gyrus (BA7) was observed in both CI group and AVL groups relative to the HC group (pCI = 0.008; pAVL = 0.038).

The P300 results at the electrode location Cz between threes groups. A) The grand-averaged P300 from scalp electrode Cz across three groups. A significant decrease in amplitude was between the CI and HC groups, and this decrease also existed between the AVL and HC groups. Topographic maps illustrate the distribution of the P300 effect, revealing clear midline parietal maxima in all groups. B) Histograms showed the amplitude (μV) and latency (ms) at Cz averaged across groups, there was no significant difference of latency between the three groups, while the amplitude of CI and AVL group was lower than HC group. (Error bars represent the standard errors of the means). C) The correlation of P300 amplitude and scores (if necessary, the score would be inverted) of different cognitive performances. X-axis showed the amplitude of P300; Y-axis showed the individual neuropsychological tests averaged to form 4 domains: Cognitive testing (MMSE, MoCA-B, and ACE-III), spatial function (CDT and JLO), naming ability (AFT and BNT), and executive function (SDMT, STT-A, and STT-B). Computed averages were related to the amplitude and plotted separately. The higher amplitude was significantly associated with better general cognitive, spatial, naming, and executive function.
In the AVL group, the sources for the alpha1 band were located in the cuneus (BA19), OTC (BA37), and primary visual cortex (BA17). The sources for the alpha2 band were located in the intraparietal sulcus (IPS, BA40), STG (BA22), SPG (BA7), AG (BA39), OTC (BA37), and cuneus (BA19). The sources for the beta1 band were located in the cuneus (BA19), frontoparietal cortex (BA10), pre-supplementary motor area (pre-SMA, BA8), and SPG (BA7) (Fig. 2B). In the CI group, the sources for alpha1 were located in the SPG (BA7), AG (BA39), OTC (BA37), and cuneus (BA19). The sources for the alpha2 band were the IPS (BA40), STG (BA22), SPG (BA7), AG (BA39), OTC (BA37), and cuneus (BA19). The sources for beta1 were located in the cuneus (BA19) and pre-SMA (BA8) (Fig. 2C). The common source locations were the OTC (BA37), cuneus (BA19), IPS (BA40), STG (BA22), SPG (BA7), AG (BA39), and pre-SMA (BA8) between the AVL and CI groups compared with the HC group. The functions of the identified regions included visual motion processing, face recognition, encoding memory, and theory of mind (BA37); processing of visual information (BA19); spatial orientation and semantic representation (BA40); language comprehension, prosody, attention to speech, and theory of mind (BA22); spatial orientation, among other parietal associational functions (BA7); language processing, spatial orientation and semantic representation (BA39); and control of eye movements (BA8).
Functional connectivity
In the AVL group, reduced gamma linear connectivity between the right cuneus (BA19) and the left superior parietal gyrus (BA7) was observed (t = –3.950 p = 0.038). In the CI group, decreased gamma linear connectivity between the right cuneus (BA19) and left superior parietal gyrus (BA7), left occipital-temporal cortex (BA37) and left angular gyrus (BA39), left occipital-temporal cortex (BA37), and right cuneus (BA19) was observed relative to that in the control group (t = –3.930 p = 0.008) (Fig. 5).
P300
The amplitude of the AVL group was 1.43±3.69μV, which was 1.15±4.24μV in the CI group and 3.97±2.38μV in the HC group. Significant differences in amplitude were detected by Student’s t-test between the CI and HC groups (p = 0.049) and between the AVL and HC groups (p = 0.048). The latency of the AVL group was 410.05±28.52 ms, compared to 404.83±36.13 ms in the CI group and 403.23±36.13 ms in the HC group. There were no significant differences in latency between the AVL and CI groups and the HC group (p > 0.99) (Fig. 5A, B). The P300 amplitude had moderate correlations with naming ability (r = 0.40, p = 0.01), general cognitive performance (r = 0.32, p = 0.04), spatial function (r = 0.38, p = 0.02), and executive function (r = 0.36, p = 0.02) across all participants by Spearman correlation analyses (Fig. 5C).
DISCUSSION
In the present study, we found that individuals with age-related vestibular loss performed worse than healthy controls in visuospatial, executive, and attention function. Decreased beta1 activity in the cuneus (BA19) and pre-SMA (BA8) was observed in both the CI group and AVL group compared to the healthy controls. The EEG sources for the alpha1 band were distributed in the cuneus (BA19) and OTC (BA37), the alpha2 band in IPS (BA40), STG (BA22), SPG (BA7), AG (BA39), OTC (BA37), and cuneus (BA19). Beta1 oscillations in the cuneus (BA19) and pre-SMA (BA8) were found in both the AVL and CI groups. Moreover, we observed lower P300 amplitude and lower gamma linear connectivity between the right cuneus (BA19) and the left superior parietal gyrus (BA7) in both the CI group and the AVL group than in the controls. Decreased P300 amplitude and abnormal functional connectivity between the right BA19 and the left BA7 were observed to be “early biomarkers” in individuals with age-related vestibular loss; these biomarkers may contribute to the decreased CDT, SDMT, and STT-A scores of these individuals.
To our knowledge, this was the first study to evaluate the interaction between age-related vestibular loss and cognitive decline using EEG recording. As previous reports suggested, vestibular impairment might contribute to cognitive decline [45–47], which was consistent with our study. The cognitive domains reported to be most affected in vestibular loss patients involve visuospatial ability [6]. The non-spatial cognition impairments included attention function, executive and memory process [48]. Previous studies had proposed several potential hypothesis based on the extensive vestibular-cortical network [49]. The vestibular system sent projections to the subcortex and cortical structures [50], including the temporo-parietal junction, hippocampus, and parahippocampal gyrus, which are parts of the complex neural network for cognitive processing [6, 51]. Structural imaging revealed vestibular dysfunction could lead to atrophy of areas within the cortical vestibular network, especially the hippocampus [48, 51], which might result in the degraded spatial cognitive ability [6]. The association between vestibular system and hippocampus might underpinned the visuospatial deficits in subjects with vestibular loss. In addition, the P300 is believed to reflect the amount of attentional capacity [52, 53] and is considered to reflect fundamental cognitive processes. Previous studies suggested that P300 could offer a very useful method for the preclinical assessment of cognitive decline [54, 55]. P300 seems to be a powerful and objective tool to use in this predementia phase to detect this subtle cognitive functional decline. In our study, subjects with age-related vestibular loss made significantly more errors than healthy controls on visuospatial, executive power, and attention subscales and had a smaller P300 amplitude, independent of a general decline in cognition, which is consistent with previous studies.
The evidence for the interaction between the vestibular system and cognitive might be confounded by hearing loss [56]. However, few studies focus on the vestibular system’s influence on cognitive balancing with hearing condition [5, 6]. Vestibular dysfunction was always accompanying sensorineural hearing loss [6] due to the close anatomical links these two systems [57]. In addition, multiple cohort studies have demonstrated that sensorineural hearing loss is an independent risk factor for cognitive decline and even dementia [6, 59]. In a systematic review reporting of ten studies on 126 patients, though all studies demonstrated the decline of spatial cognition vestibular loss individuals. Only three studies described the hearing performance [60]. Whether and to what extent vestibular loss might be interaction with cognitive decline as a risk factor, independently of hearing loss, was important for intervention at preclinical stage. In our study, we excluded the individuals with diseases manifesting in both vestibular and auditory symptoms [56], such as Meniere’s disease. Individuals under long-term exposure were also excluded, which might impair both vestibular and auditory symptoms [61]. We controlled the hearing condition across three groups to minimize interaction between hearing and the vestibular system.
Most [62–64] resting-state EEG and fMRI measurements of individuals with serious cognitive decline have revealed reductions in alpha (8–12 Hz) and beta power (12–30 Hz) [11]. The alpha rhythm is a major neural indicator of sensorimotor integration and “the subject’s relationship to the environment” [65]. The beta rhythm is also involved in conscious thought and logical thinking, inhibition of movement and motor planning, and its suppression can lead to depression or poor cognition [66]. Frontal beta rhythms also emerge during cognitive tasks related to stimulus assessment and decision making [67]. Furthermore, during the balance task, the suppression of oscillations in the alpha band over temporoparietal scalp regions might reflect cortical vestibular processing [68], while beta band power was also significantly suppressed [68]. In our study, both the AVL and CI groups demonstrated decreased beta power in the pre-SMA (BA8), which is involved in planning complex movements. Furthermore, we found lower gamma linear connectivity between the right cuneus (BA19) and the left SPG (BA7) in participants with either cognitive decline or age-related vestibular dysfunction than in controls. Studies in humans using structural and functional neuroimaging and behavioral assays suggested that BA7 was largely associated with visuospatial and attentional processing [69, 70]. Many studies in the literature have confirmed that this cortical area is critically important for the manipulation of information in working memory [71]. BA19 was part of the occipital cortex, a visual association area whose functions include feature extraction, shape recognition, attention, and multimodal integration. Evidence has shown that dense AD pathology in BA19 is present in some cognitively intact subjects with preclinical AD, and BA19 pathology is occasionally present in the absence of substantial pathology in the hippocampus or entorhinal cortex [72]. The gamma band (>30 Hz) mediates information transfer between cortical and hippocampal structures for memory formation [73], and gamma rhythms are involved in various cognitive functions, including visual object processing and attention [74, 75] and strictly reflect behavioral performance [76]. The lower gamma linear connectivity between the right BA19 and the left BA7 might contribute to the worse performance on visuospatial, executive and attention functions.
Limitations
Our study had some limitations. The results obtained from the EEG data require careful explanation because the sample sizes of our subgroups may not have been sufficiently large, especially the AD patients. Our study used a cross-sectional design, which limits the cause–effect conclusions that can be drawn from it. Longitudinal studies tracking the time course of changes would provide valuable insights into the interaction between vestibular and cognitive function. Future studies with larger sample sizes and longitudinal designs are needed to investigate the relationship between age-related vestibular loss and cognitive decline.
Conclusion
In conclusion, we found that subjects with age-related vestibular loss, regardless of any general decline in cognition, exhibit worse performance on the visuospatial, executive and attention subscales than healthy control subjects. Reduced P300 amplitude and reduced gamma linear connectivity between the right cuneus (BA19) and the left SPG (BA7) in both the CI group and the AVL group compared with the controls might be considered potential “early biomarkers” in individuals with age-related vestibular loss and contribute to decreased scores on the CDT, SDMT, and STT-A.
Footnotes
ACKNOWLEDGMENTS
The study was supported by funding from the National Natural Science Foundation of China (Grant No. 82071041); the First Grant (2020YFC2005201) of Chinese National Key Research and Development Program (2020YFC2005200); and National Key R&D Program of China (2016YFC1306305, 2018YFE0203600).