
Abstract
Background:
Visual short-term memory (VSTMT) and visual attention (VAT) exhibit decline in the Alzheimer’s disease (AD) continuum; however, network disruption in preclinical stages is scarcely explored.
Objective:
To advance our knowledge about brain networks in AD and discover connectivity alterations during VSTMT and VAT.
Methods:
Twelve participants with AD, 23 with mild cognitive impairment (MCI), 17 with subjective cognitive decline (SCD), and 21 healthy controls (HC) were examined using a neuropsychological battery at baseline and follow-up (three years). At baseline, the subjects were examined using high density electroencephalography while performing a VSTMT and VAT. For exploring network organization, we constructed weighted undirected networks and examined clustering coefficient, strength, and betweenness centrality from occipito-parietal regions.
Results:
One-way ANOVA and pair-wise t-test comparisons showed statistically significant differences in HC compared to SCD (t (36) = 2.43, p = 0.026), MCI (t (42) = 2.34, p = 0.024), and AD group (t (31) = 3.58, p = 0.001) in Clustering Coefficient. Also with regards to Strength, higher values for HC compared to SCD (t (36) = 2.45, p = 0.019), MCI (t (42) = 2.41, p = 0.020), and AD group (t (31) = 3.58, p = 0.001) were found. Follow-up neuropsychological assessment revealed converge of 65% of the SCD group to MCI. Moreover, SCD who were converted to MCI showed significant lower values in all network metrics compared to the SCD that remained stable.
Conclusion:
The present findings reveal that SCD exhibits network disorganization during visual encoding and retrieval with intermediate values between MCI and HC.
Keywords
INTRODUCTION
Alzheimer’s disease (AD) is characterized by progressive cognitive impairment and behavioral changes with high socioeconomical impact [1]. In the preclinical stages of AD, such as mild cognitive impairment (MCI) or subjective cognitive decline (SCD), memory difficulties are generally apparent in tasks that require complex thinking, episodic memory, learning, or retention of visual and verbal information [2–7]. In particular, SCD is clinically defined as self-perceived changes in memory and cognition that individuals report in the absence of objective evidence of abnormality in clinical and neuropsychological evaluation. It is increasingly recognized as a risk factor both for MCI and AD compared to demographically matched healthy elders (hazard ratio 4.5) [4, 8–11]. SCD remains poorly explored with respect to the integrity of a wide array of brain functions and with a continuing debate regarding its clinical, research, and everyday utility [4, 12–14]. Therefore, it is imperative to seek and identify measurable indices and tools to detect indicative characteristics, patterns, causality, indicators, and factors in order to forestall both SCD and MCI [15, 16].
Meanwhile, technology and neuroimaging tools promise to provide more efficient and objective measurements as opposed to time- and effort-consuming neuropsychological assessment and interviews. In this light, the so-called “digital biomarkers” are emerging from the analysis of data streams from both lifestyle and biomedical technologies, including wearable and traditional electroencephalography (EEG) technology. The ongoing ‘Remote Assessment of Disease and Relapse–Alzheimer’s Disease’ (RADAR-AD, https://www.radar-ad.org/) international study uses remote monitoring technologies (RMTs) to continuously and objectively monitor functional decline in AD. This paper explores EEG analysis as a means for efficient and reliable assessment using technology, in the context of the RADAR-AD study. Remote monitoring technologies in the RADAR-AD study utilizes wearable and smart home devices as well as applications, used both at participant homes and during laboratory trials. The RADAR-AD study highlights the importance of efficient and reliable assessment using technology in such international studies. Motivated by the fact that portable EEG headbands will be used in RADAR-AD home trials, this paper explores the potential of EEG analysis obtained in a lab environment to be later transferred and compared to portable EEG applications at home.
Visual attention and short-term memory as indicators of cognitive impairment
A hallmark of aging widely observed in older-old adults is a decline in visual short-term memory and visual attention [17–20]. It refers to the ability to maintain the focus of cognitive activity over time on a given task and to preserve in mind a visual representation after the sensory stimulus has been disappeared [21, 22]. In particular, visual attention highly interacts with the encoding process of memory implementation [23], which utilizes neural circuits tailored for sensory perception and long-term memory retrieval [21, 24–27]. By this account, after the visual sensory input has been removed from sight, visual short-term memory is implemented by prolonged activations, through visual attention, of the same parietal and occipital brain areas which are supposed to evoke visual perception [28–31]. Visual short-term memory and attention are distinct yet interrelated processes and hold great scientific interest for AD research as precursors of cognitive decline related to AD. Cognitive mechanisms and neural activity underlying these tasks show a large degree of overlap. Therefore, the examination of these cognitive processes in a clinical setting in general or during brain activity recording in particular could indicate early disruption mechanisms related to dementia pathology and future progression. Especially activity within the posterior parietal cortex reflects object maintenance across distraction or sustained attention per se, it is necessary to control for attentional demands inherent in VSTM tasks. During this process, parietal and occipital regions play pivotal role [32–37], whereas the prefrontal cortex does not constitute a particular brain region for memory storage [29, 38]. Thus, plenty of findings, even with single-unit recordings, have provided substantial information with regards to the control of visual processing and stimulus selection in the visual cortex over the parietal cortices [39–49].
Previous studies have shown that AD as well as MCI patients frequently demonstrate deficits on visual attention and visual short-term memory and can be characterized by significant abnormality [50–55]. The deficits relate to reduced white matter integrity [56, 57], worse performance of daily activities, and lower quality of life [53, 58–60]. Electrophysiological studies employing the computational theory of visual attention [61, 62] have found also decreased visual short-term memory storage capacity in elders compared to younger adults [18, 63–66]. Moreover, several neuroimaging studies have identified interrupted connections, basically located over the superior longitudinal and inferior fronto-occipital fasciculus, the parietal and frontal eye field regions, and corpus callosum, which has been found to be responsible for visuospatial dysfunction in cases of brain damage [67, 68].
Recent studies underline the principle involvement of posterior parietal cortices (PPC) in visual short-term memory [30, 69], given that create mental images, while combining sensory and motor inputs. Therefore, the activity in the PPC is highly correlated with the proportion of scene-related information and mental representations that can be stored in visual short-term memory [30]. Functional changes in early stages of AD are located over the posterior hemispheres rather than the frontal areas of the brain [32–37]. Studies highlight the pivotal role of the PPC, visual and prefrontal cortices, a key neural factor of the mental representation of the visual world in attention [68, 70–76]. In particular, the PPC might act as a capacity-limited store for the representation of the visual scene, while pieces of evidence suggest that item location and identification are in generally taken place in dorsal (occipito-parietal) and ventral (occipito-temporal) cortical visual areas, respectively [44]. As a result, impairment in attentional mechanisms related to divide and sustain attention has been related to impaired visuospatial memory function in older-old adults [53, 77–80]. Finally, pieces of evidence have showed that visuospatial decline is linked to reduced bilateral parietal and right temporo-parietal metabolism in mild to moderate AD [81]. Despite this body of work, research focusing on associations between brain activation and visual short-term memory and visual attention performances among people with MCI and SCD is still in its infancy.
Brain connectome in preclinical stages of AD continuum
Investigating human brain connectome, based on graph theory, can improve our understanding of the complex organization of the human brain [82–85]. Recent findings underline that subtle connection between different brain regions, showing reduced functional connectivity (FC), constitutes the substrate of the AD pathophysiological mechanisms [86]. Evidences shows that AD is associated with alteration of FC among different brain regions [87–90]. Specifically, it has been shown that AD patients have decreased FC between regions in the hippocampus, in prefrontal lobe and medial frontal, parietal and posterior cingulate cortex, and between the two lobes [91, 92]. In detail, FC abnormalities have been described as a disconnection syndrome and have been widely reported in preclinical stages, such as MCI and SCD, as well [57, 93–95]. Thus, they promise great utility in predicting future transition to more advanced stages of cognitive decline and conversion to AD [96, 97]. Despite the fact that resting state has been already investigated in SCD population, brain connectome during memory and attentional performance is scarcely explored [98–100].
Our recent review [94] suggested that SCD may actually demonstrate intermediate changes between healthy elders and MCI at a network level of the brain and implies that brain connectome could be considered as a potential biomarker of predicting future cognitive deterioration associated with AD. However very limited studies have so far explored the brain network in SCD using EEG [93, 94]. In the majority of the included studies, SCD exhibited lower values compared to healthy controls with regards to local efficiency, network strength, and shortest path length but preserved global network properties such as small-world and rich-club. On the other hand, local network metrics like degree, shortest path length, clustering coefficient, etc., revealed the subtle connectivity issues in spatial, functional, and structural changes in particular brain areas in SCD compared to HC. Nevertheless, studies based on EEG have revealed that MCI subjects displayed a significant decrease in alpha power, a slowing of the EEG, a reduced complexity of the EEG signals, and perturbations in the EEG synchrony compared to normal elderly people [101–104]. Furthermore, it has been reported that there is a prominent decrease in the functional coupling of EEG rhythms in AD and MCI compared to normal elderly subjects [105–109]. Therefore, the investigation of the complex brain mechanisms holds great scientific interest for the SCD using FC patterns, against those of more advanced stages. So far, the knowledge about the course of FC alterations in the SCD is really scarce [110, 111], while the exploration of FC in SCD using high density EEG is still limited [93, 94].
Study aim
The present study constitutes a novel research that focuses on investigating brain connectivity abnormalities and network metrics [112] (Clustering Coefficient, Strength, and Betweenness Centrality) at the occipito-parietal area throughout preclinical stages of AD by implementing High Density-Electroencephalography (HD-EEG, EGI GES 300) during a visual attention (VAT) and a short-term memory task (VSTMT). We have constructed correlation matrices and weighted undirected networks to precisely detect brain network properties across the four groups and compare the results with standard neuropsychological tests. In light of previous research findings [93, 94], our expectation in this study was to find differences in network properties among SCD individuals with regards to HC. In particular, we hypothesized that the SCD group would exhibit brain changes and network interruption in a similar way to those displayed in MCI, although to a lower extent, yielding in an intermediate stage between HC and MCI [93, 94]. To the best of our knowledge, there is no existing study that has explored the potential of these particular network metrics in SCD population during VAT and VSTMT with HD-EEG [94]. Therefore, our study aimed to: 1) compare VSTMT and VAT performances between HC and people with SCD, people diagnosed with MCI and AD by standardized neuropsychological tests at baseline and after three years, and 2) examine the clinical relevance between visual short-term memory and visual attention performances with the parameters of the brain network, so as to improve our understanding of factors contributing to the signs and symptoms of SCD.
MATERIALS AND METHODS
Settings and participants
In total 80 participants were recruited from the memory & dementia clinic of the 1st Department of Neurology, U.H. AHEPA, Aristotle University of Thessaloniki, Greece (https://www.med.auth.gr/) and the Greek Association of Alzheimer’s Disease and Related Disorders (GAADRD; https://www.alzheimer-hellas.gr/index.php/el/). The study was carried out in accordance with the Declaration of Helsinki, has received approval by the Scientific & Ethic committee of GAADRD (No 41/6-6-2018), while a written informed consent was obtained from all participants prior to their participation in the study. The diagnosis of HC, SCD, MCI, and AD was set by a neuropsychiatrist (MT) according to the structural magnetic resonance imaging (MRI), medical history, neuropsychological tests, and neurological examination. Upon initial processing, we identified that the EEG data of seven individuals were highly contaminated by both head and eye movement artifacts. This can be explained due to the nature of the experiment that constitutes several participants to ask the experiment to help them. Hence, they were excluded from the signal analytic EEG pipeline, yielding 73 participants for the final results in the study.
In detail, the SCD group consisted of 17 participants, the MCI group consisted of 23 participants, the AD group consisted of 12 participants, while 21 HC were also included having similar range of ages and education. The participants in all four groups were over 60 years old [113–115]. Table 1 presents the average age with the standard deviation for each group of participants. Participants with AD fulfilled the National Institute of Neurological and Communication Disorders and Stroke/Alzheimer’s Disease and Related Disorders Association (NINCDS-ADRDA) criteria for probable AD [116], as well as the Diagnostic and Statistical Manual of Mental Disorders (DSM-V) criteria for dementia of Alzheimer type (APA, 1994). On the other hand, the MCI participants fulfilled the Petersen criteria [117], while the SCD group met IWG-2 Guidelines [118] as well as the SCD-I Working Group instructions [119]. More specifically, the criteria for recruiting SCI participants were in accordance with the latest suggestions proposed by the SCD-I Working Group [119], while for the participants of the other groups the respective above mentioned criteria were followed. Moreover, we would like to make clear that with regards to our study, the identification of SCD participants further included self-perceived memory decline compared to other cognitive functions and in reference to others of the same age occurring during the past five years as determined by the individuals’ medical history and an informant report, at an age cut-off of 60. Regarding the preclinical stage of SCD, we tried to eliminate possible confounding factors based on blood tests (hormonal disorders, vitamin deficiency, etc.) and structural MRI (vascular/demyelinating lesions, tumors, anatomical variations, etc.). All the above were taken under consideration for the recruitment process, since they could affect our sample performance and signal elicitation. Additional inclusion criteria for the SCD and HC subjects were to have a normal general medical, neurological, and neuropsychological examination. Exclusion criteria included 1) severe psychiatric, physical, or other neurological disorder illness or any other somatic disorder which may cause cognitive impairment, 2) history of alcohol or drug and use of neuromodifying drugs except cholinesterase inhibitors or memantine for the AD patients, and 4) left handedness.
Mean±SD (standard deviation) and p value of demographic characteristics of participants (HC = 21, SCD = 17, MCI = 23, AD = 12)
Neuropsychological assessment
All participants underwent a detailed neuropsychological evaluation at baseline, where the EEG recording took place and after 3 years (follow-up), which included the same standardized neuropsychological battery, an insightful psychological interview and medical history using the Structured Clinical Interview for DSM-IV Axis I Disorders Clinical Version (SCID-CV) [120], as well as physical and neurological examination. In particular, the following neuropsychological battery was implemented in order to assess cognitive status comprehensively and evaluate aspects like working memory, executive functioning, attention, memory and language: a) the Greek version of Mini-Mental State Examination (MMSE) [121], b) Functional Rating Scale for Dementia (FRSSD) [122], c) Functional and Cognitive Assessment Test (FUCAS) [123], d) Trail Making Test part-B [124], e) RBMT-story Direct and delayed recall [125], f) Rey Osterrieth Complex Figure Test copy and delay recall (ROCFT-copy and delayed recall) [126], g) Rey Auditory Verbal Learning Test (RAVLT), and h)Verbal Fluency test (FAS). Evaluation of mood and behavior took place both from the interview data and the participant and caregiver answers to the relative brief self-report tools, the Neuropsychiatric Inventory (NPI) [127] and the Perceived Stress Scale (PSS) [128].
Notably, in each of the neuropsychological tests we used to test the cognitive performance of the four groups, the performance of all subjects in HC and SCD was indicative of normal cognitive status (Table 1). In other words, the aforementioned neuropsychological tests are only capable of distinguishing between normal and abnormal cognitive status and lacks the sensitivity necessary to classify a subject as HC or SCD. This is not the case for the other groups, since according to the One-way ANOVA test, used to investigate differences between our four groups, the MCI and AD group showed statistically significant worse performance scores in the majority of MMSE, FRSSD, FUCAS, RAVLT, FAS, ROCFT, and RBMT memory tests. In Table 2, superscripts indicate when the difference between two groups is statistically significant using the independent sample t-test. Table 2 presents the mean values and standard deviation in the baseline, the follow-up neuropsychological assessment, and the SCI and MCI who converted to more advanced stages after three years.
Mean±SD (standard deviation) and p value of one-way ANOVA of neuropsychological assessment at baseline and follow-up among participants and those who converged in follow-up (HC = 21, SCD = 17, MCI = 23, AD = 12)
*HC versus MCI –p < 0.05. **HC versus AD –p < 0.01. ∨HC versus SCD –p < 0.05.
Visual attention and short-term memory task (VAT & VSTMT) and EEG recording
For this research, participants had to fulfil one task involving visual attention and short-term memory. The task began with a 5-point calibration procedure, to correctly map eye position onto screen coordinates and written instructions were given to participants. In total, 22 images containing landscapes or events were used and a multiple-choice question, relating to the image, followed immediately after the image disappeared. Each trial began with a fixation circle, which remained on the screen for 1 s. Each image was afterwards projected for 20 s and subjects were instructed to pay particular attention to the images and its items (VAT). After the presentation, the fixation circle was presented and then the question followed (VSTMT). Participants were asked to respond to a question relevant to the image as quickly as possible and proceed to the following. Two examples were given in the beginning, to help subjects familiarize with the experiment. The whole procedure was divided into two blocks, each one consisting of 11 images and a 1-min break between them. The total duration was approximately 12 min. The whole process is illustrated in Fig. 1.
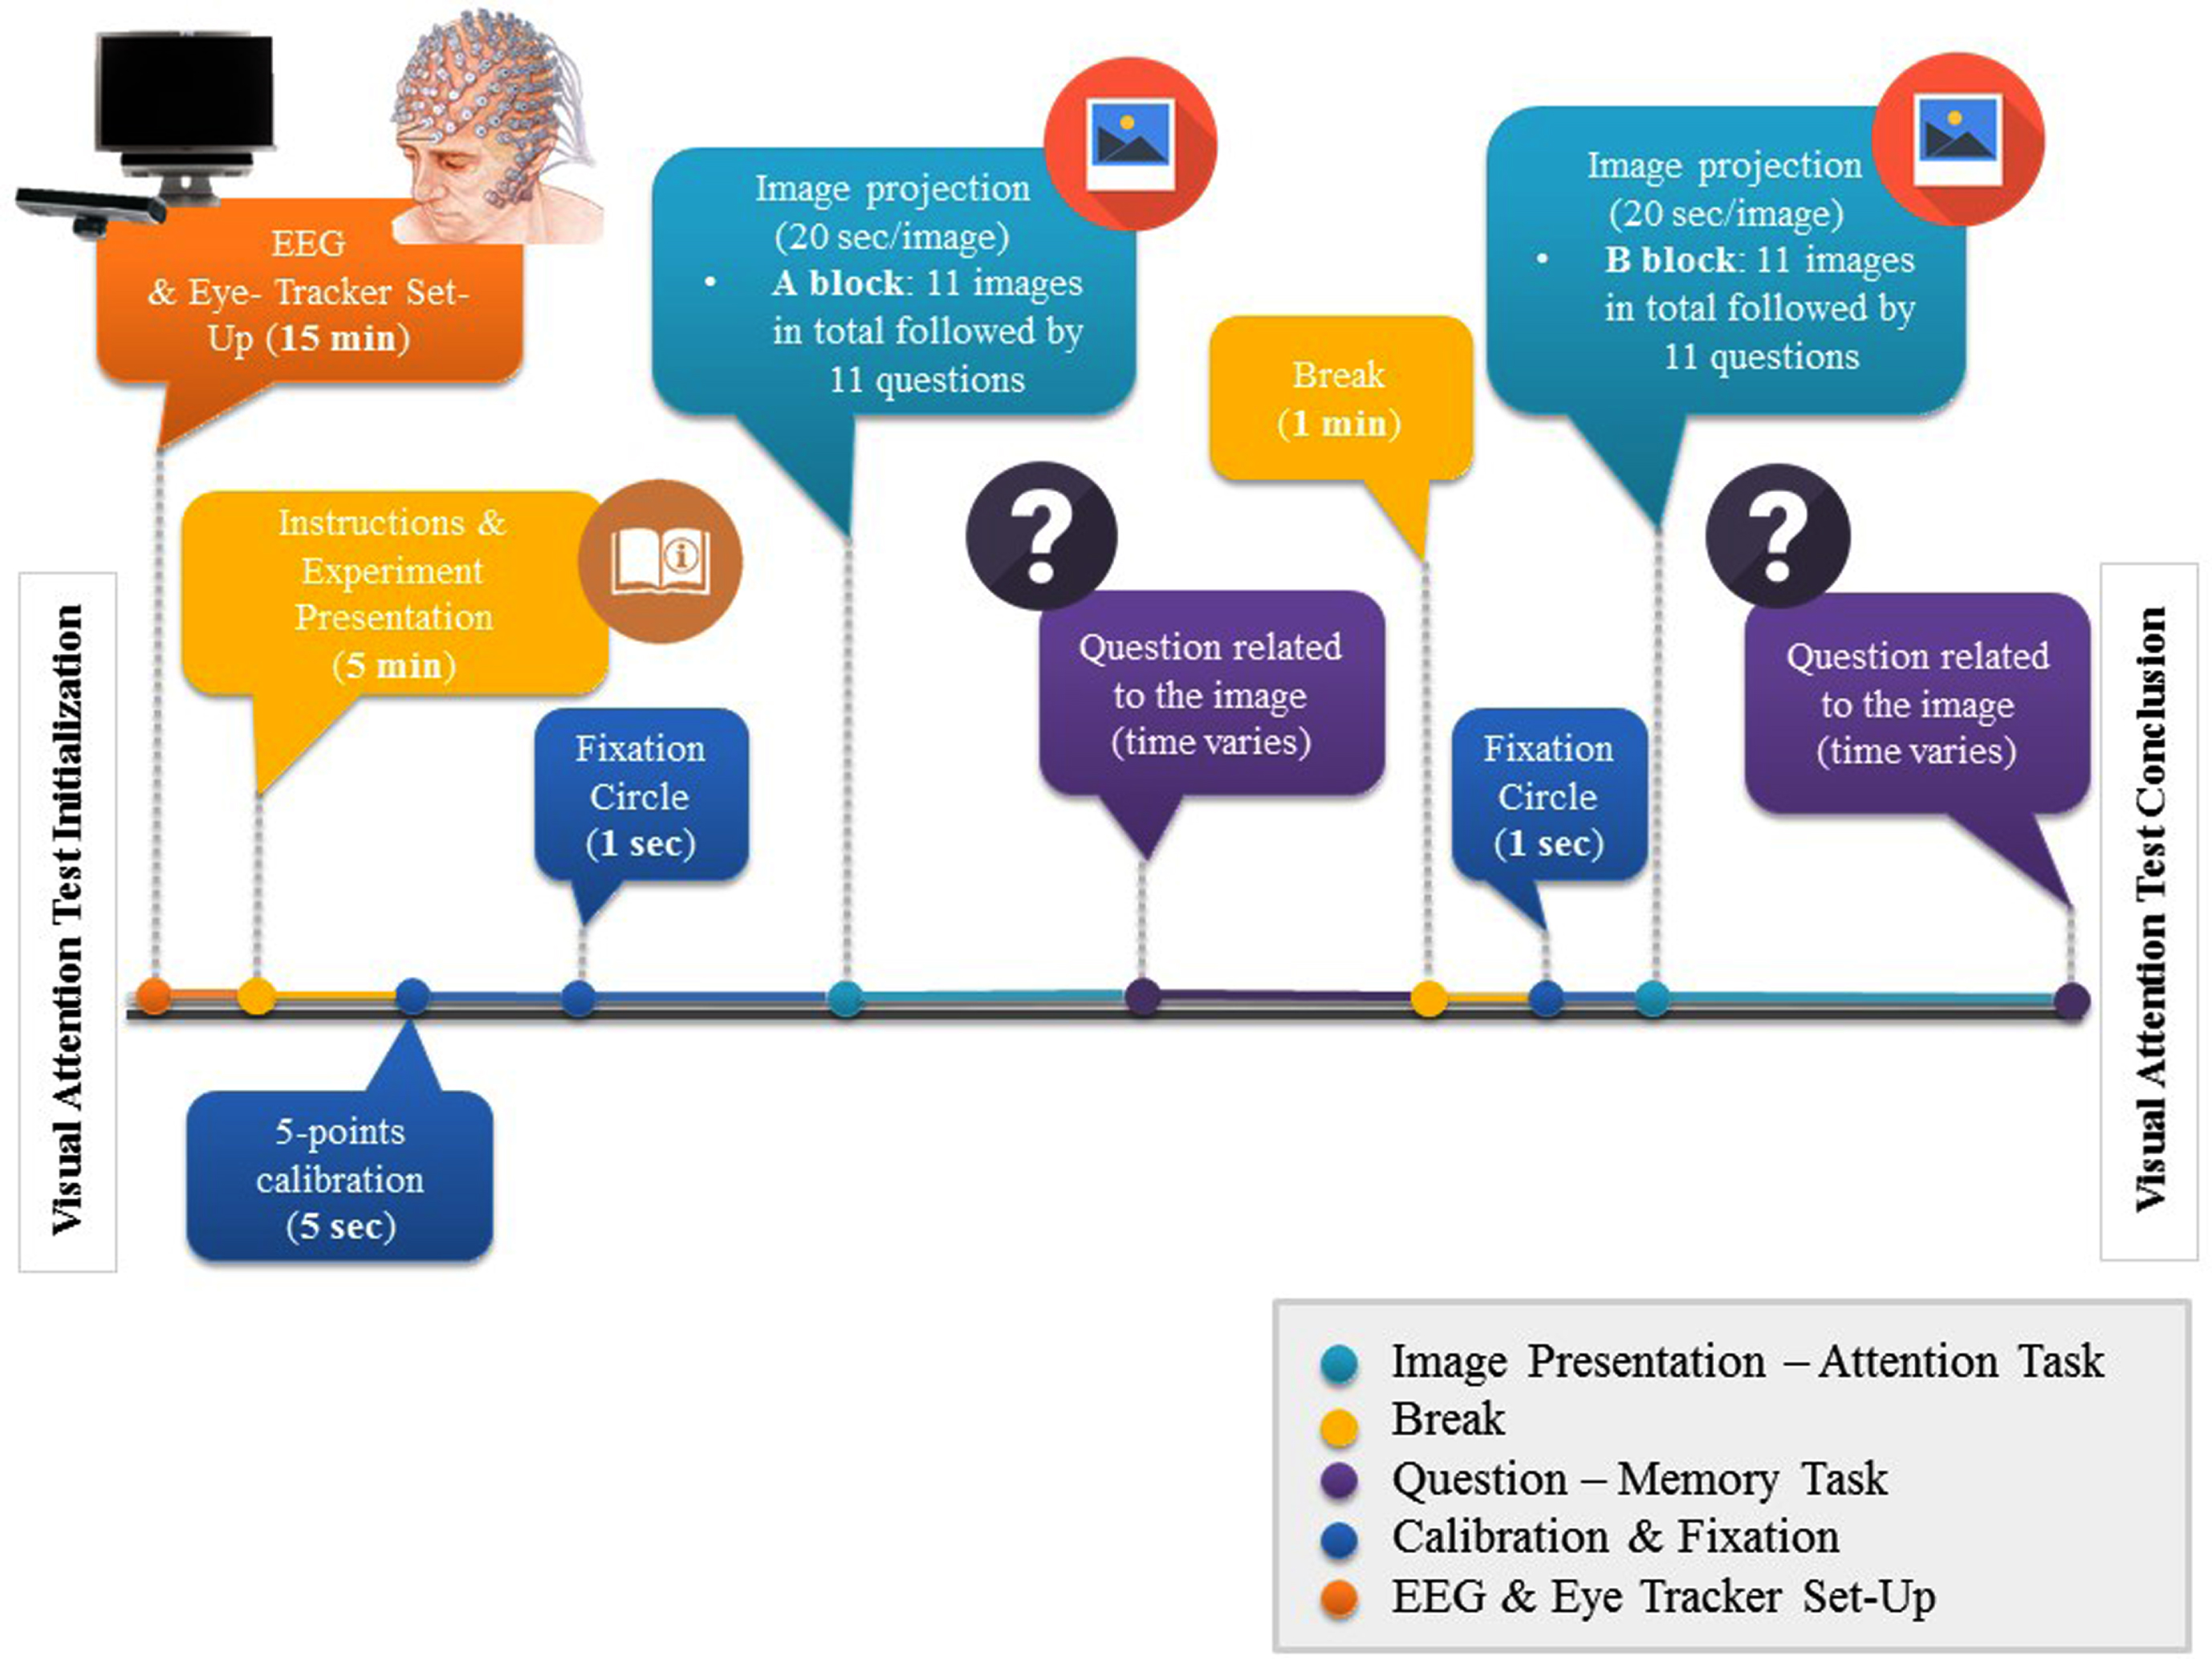
EEG, Eye-Tracker Set-Up, and VAT & VSTMT process timeline
EEG data acquisition and network construction
Regarding the data acquisition, we have followed the same protocol as we did in our previous research efforts [93]. Figure 2 illustrates the pipeline process for data acquisition, construction of the weighted undirected networks, and extraction of the metrics derived from the Correlation Matrices of the EEG, during VSTMT and VAT. HD-EEG data were recorded with the EGI 300 Geodesic EEG system (GES300) using a 256-channel HydroCel Geodesic Sensor Net (HCGSN) and a sampling rate of 250 Hz (EGI Eugene, OR). Moreover, the researcher placed the electrodes in accordance with the ‘256 HCGSN adult 1.0’ montage system, while the signals were recorded relative to a vertex reference electrode (Cz) and with AFz as the ground electrode. The impedance was kept for all electrodes below 50 kΩ throughout the experimental procedure as recommended for the high-input impedance amplifier [129]. The SMI Red500 (SensoMotoric Instruments) eye-tracker was used to generate gaze maps and ensure the sustained attention of the participants while avoiding fatigue. The experiment was projected on a 22” monitor and the tasks were developed using the Experiment Center software, powered by SMI. Subjects sat approximately 60 cm away from the monitor. HD-EEG data were initially filtered with a 5th-order bandpass Butterworth IIR filter of 0.3–70 Hz and then segmented using the task triggers timestamp and an epoch time of 1 s, including 100 ms pre-stimulus time. In addition, artefact detection and bad channel replacement was performed. Data were baseline-corrected using a 100 ms pre-stimulus period and the Net Station 4.3 software (EGI; https://m.egi.com/clinical-division/clinical-division-clinical-products/ges-300). We examined both tasks (VAT and VSTMT). Detection of “bad” segments was executed by marking those segments with amplitudes more than 100μV. Also, signals from the rejected (bad) electrodes were replaced using an interpolation process provided by the ‘bad channel replacement’ algorithm (Net Station 4.3). The brain network analysis was conducted at a first level in a personalized fashion, deriving the individual weighted correlation matrices upon all trials. Then the averaged profiles (i.e., averaged correlation matrices) were estimated for every group (HC, SCD, MCI, and AD) and were considered as the input matrices for the estimation of the network metrics. The Pearson Correlation Coefficient (PCC) was employed in order to measure connectivity between all pairs of electrodes. PCC is a measure of normalized covariance between two continuous variables that can be estimated by dividing the covariance of two variables by the product of their standard deviations. In this respect, the weighted correlation matrices were created using the PCC between the time series of each pair of electrodes (all electrodes at VAT and VSTMT, occipito-parietal electrodes). Besides the pre-processing steps performed using Net Station’s algorithms, all other processing and analysis steps were performed using Matlab 2019 (The Mathworks, Natick, USA).
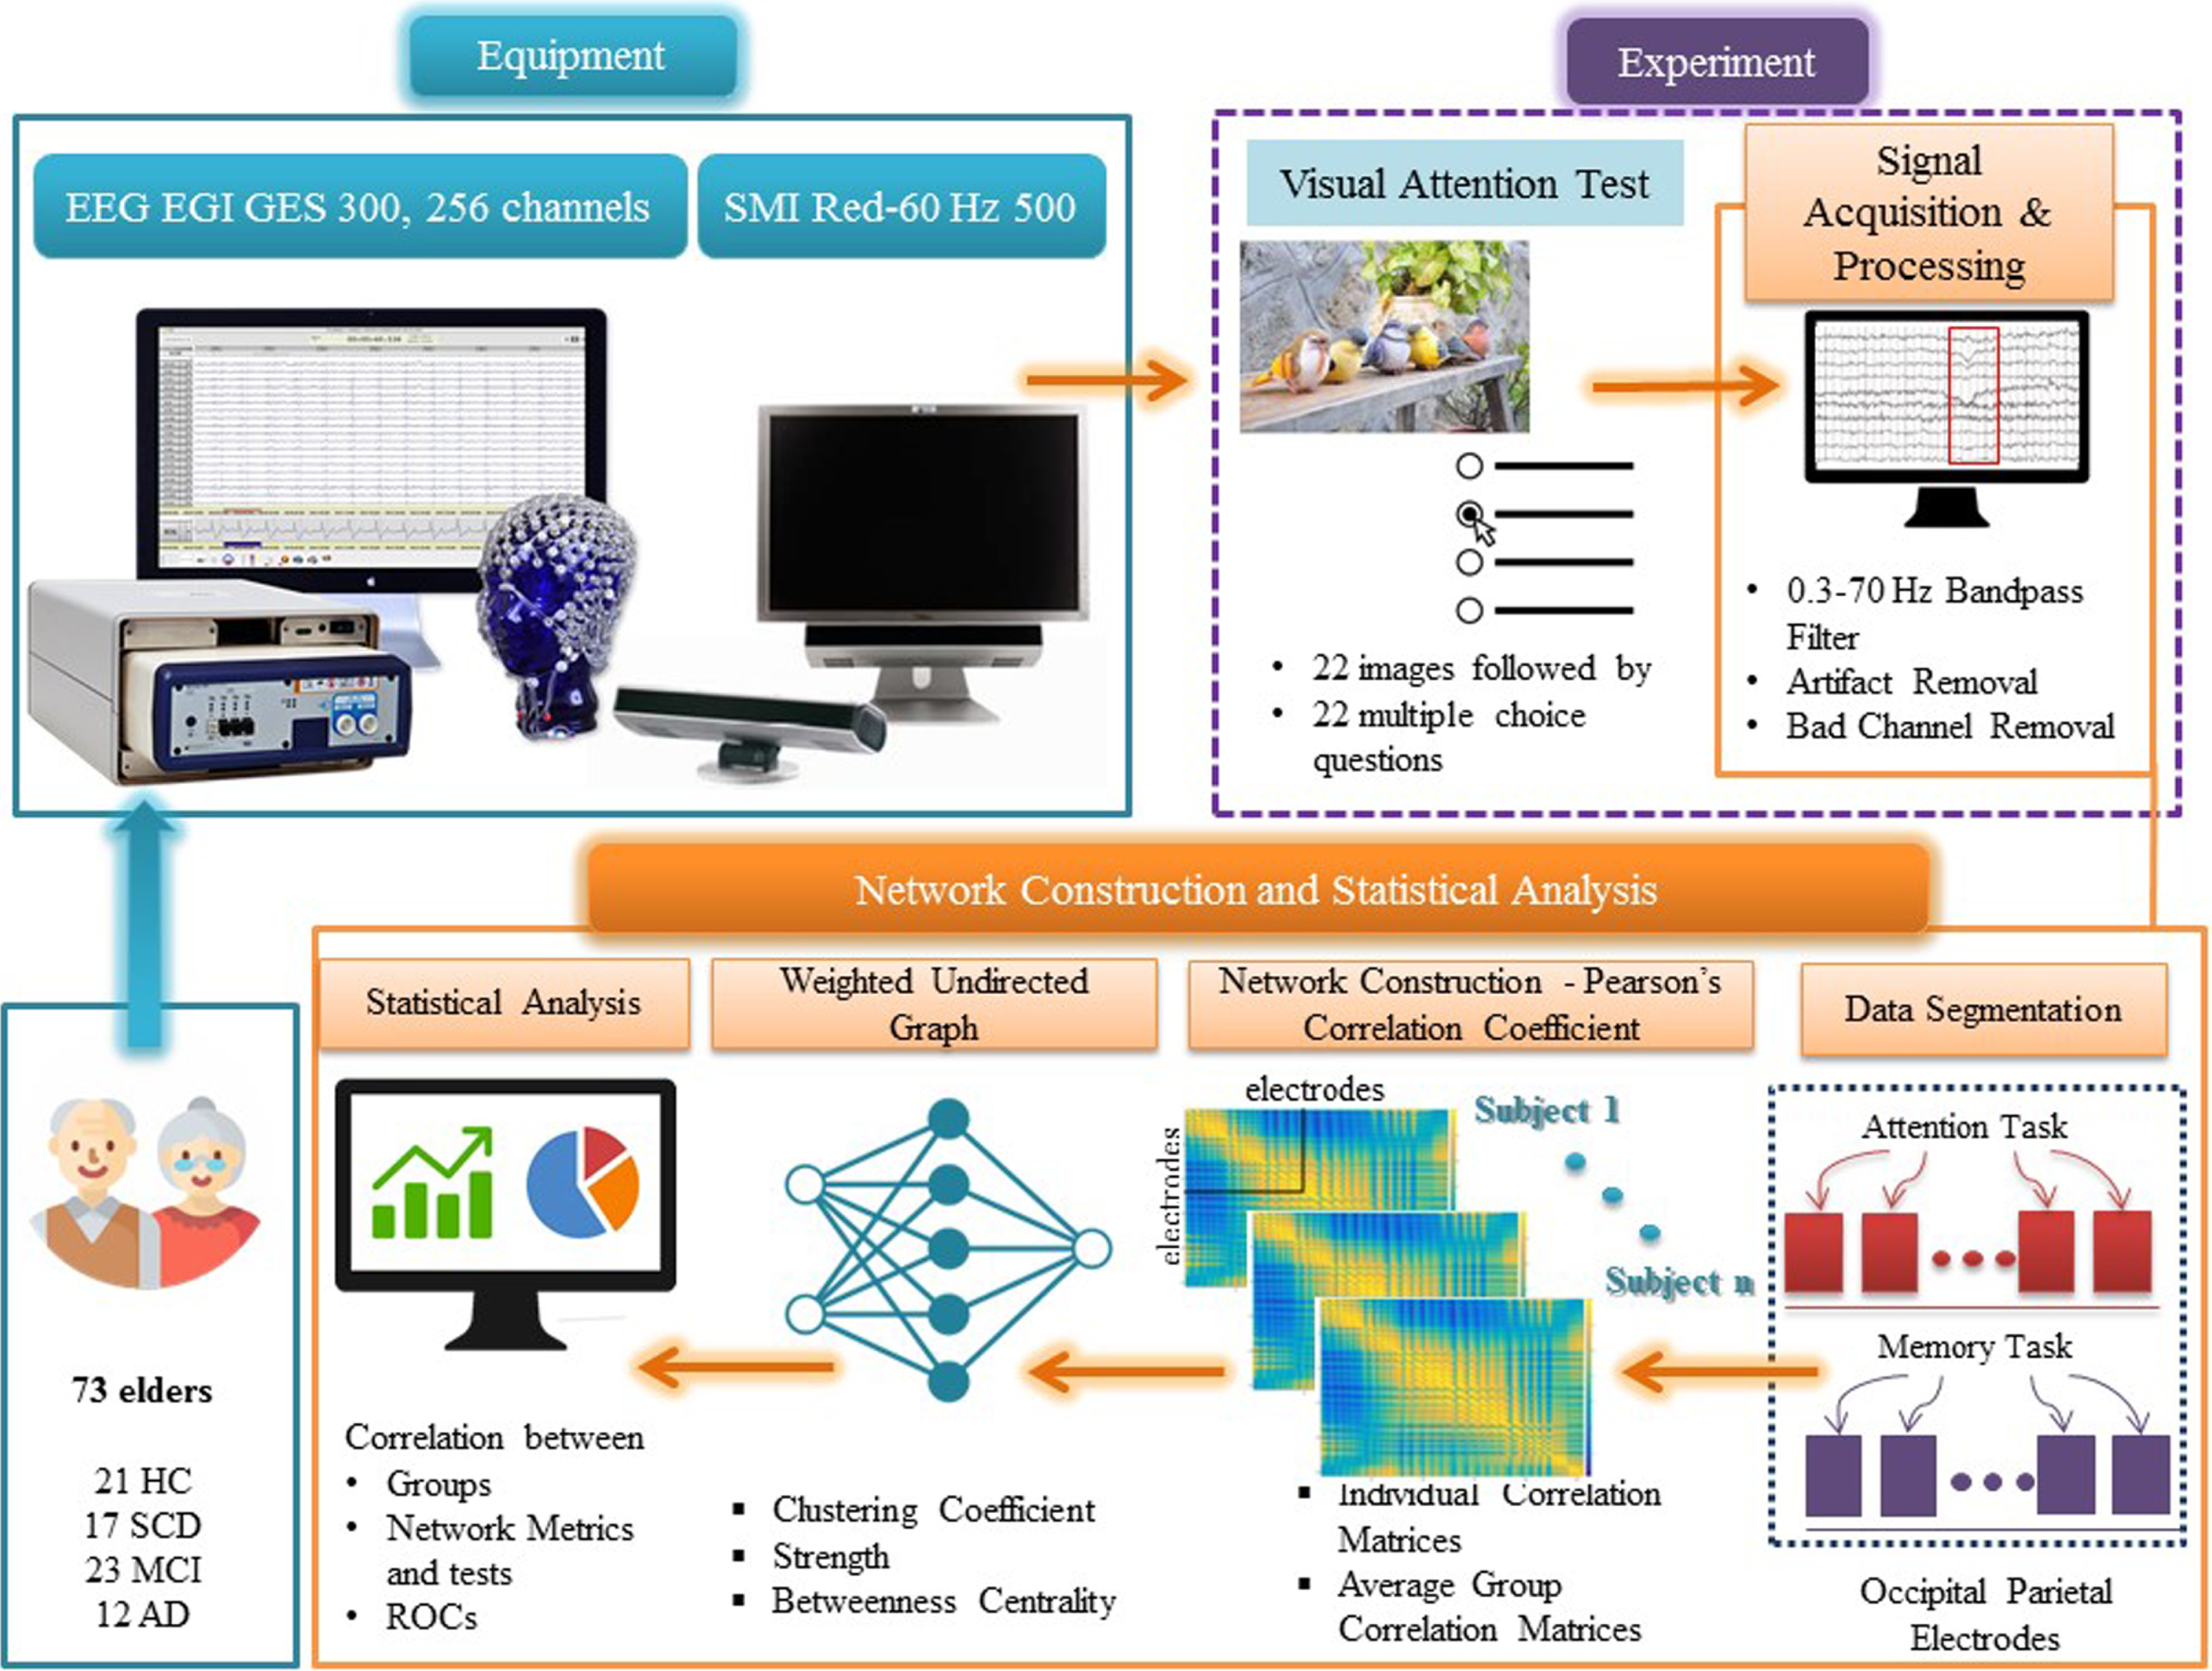
Outline of the experimental procedure and the methodology for extracting the network metrics derived from Correlation Matrices after VAT and VMT.
Occipito-parietal network analysis
We employed weighted correlation matrices from the EEG electrodes in order to analyze the undirected brain network and explore particular network metrics. In detail, we considered a local network of selected electrodes (parietal and occipital region), which is the most prominent choice for the examination of VAT and VSTMT [130–134]. Regarding the network, we chose the following electrodes according to the EGI system numbering: “66, 72, 75, 76, 77, 78, 84, 85, 86, 87, 88, 95, 97, 98, 99, 100, 101, 104, 105, 106, 107, 108, 109, 110, 112, 113, 114, 115, 116, 117, 118, 119, 121, 122, 123, 124, 125, 126, 127, 128, 129, 134, 135, 136, 137, 138, 139, 140, 141, 142, 146, 147, 148, 149, 150, 151, 152, 153, 154, 156, 157, 158, 159, 160, 161, 163, 164, 165, 166, 167, 168, 169, 170, 171, 172, 173, 175, 176, 177, 178, 179, 180, 188, 189, 200” [135], which represent the respective parietal and occipital areas. The corresponding electrodes of the EEG were considered to constitute the nodes of the graph [112], while the correlation between the nodes –electrodes (absolute value of PCC) represents the edges of the graph [136, 137]. More information about the position of the electrodes can be found in Electrical Geodesics Inc (2007) Geodesic Sensor Net Technical Manual (https://www.egi.com/research-division/geodesic-sensor-net). In this way, we constructed a weighted graph in order to analyze the brain network and explore the network metrics of clustering coefficient, strength and betweenness centrality. Whereas strength (S) quantifies aggregation and clustering coefficient (CC) segregation, we also considered the betweenness centrality (BC) as a measure of centrality [138]. Using the toolboxes of Brain Connectivity (https://brain-connectivity-toolbox.net) and FieldTrip (https://www.fieldtriptoolbox.org/), these network metrics were derived from the weighted adjacency matrices with the intention to characterize the connectivity properties of local occipito-parietal network. The details of these network metrics are briefly presented below.
Clustering Coefficient (CC)
Given a graph G of N nodes and weighted connections, the weighted clustering-coefficient CC
v
of node v provide us with a measure of interconnection between node v and its neighbors, where Nv is the number of links between neighbors of v and Kv its degree [138].
Strength (S)
The connection strength S
k
of each node k in the graph is estimated as the sum of the weights of all the connections of node k, gaining information on the total level of (weighted) connectivity of a node [138]. The strength expresses how strongly the node is connected with its neighboring nodes, by summing all weights of the connections of this node. Strength equals to the sum of connectivity weights attached to a given node. It may serve, approximately, as a centrality measure, indicating the importance of the associated brain region within the observed network organization:
Betweenness Centrality (BC)
The Betweenness Centrality BC
v
of a node v in the graph is related to the fraction of the total number of the shortest paths, that pass through node v from node s to node t (σ
st
(v)), to the total number of the shortest paths from node s to node t (σ
st
). BC describes the centrality of a graph using shortest paths and represents the degree to which nodes stand between each other. The total BC of the graph G is the average of all N node Betweenness Centralities:
Statistical analysis
We compared brain network data (in terms of PCC) among the four groups at the level of significance p = 0.05. Network metrics were compared between groups using ANOVA analysis. Statistical analysis was performed using SPSS v25.0 for Windows (IBM Corporation, Armonk, NY, USA). For assessing the normality assumption for continuous and categorical variables we used the Kolmogorov-Smirnov and chi-squared test, respectively. For examining the potential statistical significance between two independent groups (e.g., HC versus SCD), we used the independent sample t-test. Moreover, independent sample t-test was used for the years of education variable yielding no statistical difference among the groups, with p = 0.253, while no gender differences were found after Chi-Square analysis (p = 0.522). We used One-Way ANOVA in order to analyze the difference in the network metrics across the four groups both for VAT and VSTMT. In cases, where network metrics showed statistical significance between groups, within group differences were tested using the t-test. Correlation between neuropsychological tests and network-derived metrics was assessed by using PCC.
RESULTS
Comparison of network properties between HC, SCD, MCI, and AD
In order to compare the network properties of the different groups we have employed the following analysis: a) The mean and standard deviation of the averaged measured corresponding to the network metrics (Clustering Coefficient, Strength, and Betweenness Centrality) of each group and for each task (see Table 2 and Supplementary Figure 1). These are further complemented by the result of the one-way ANOVA test across the four groups and for each network metric and task, and the results of an independent sample t-test to evaluate the statistically significant difference between pairs of groups (superscripts are used to indicate the statistically significant difference between a pair of groups); b) Boxplots visualizing the separability of the four groups for each network metric and task (Fig. 3); and c) Topoplots generated from the correlation matrices for the three networks metrics for both tasks (VAT and VSTMT) (Fig. 4).
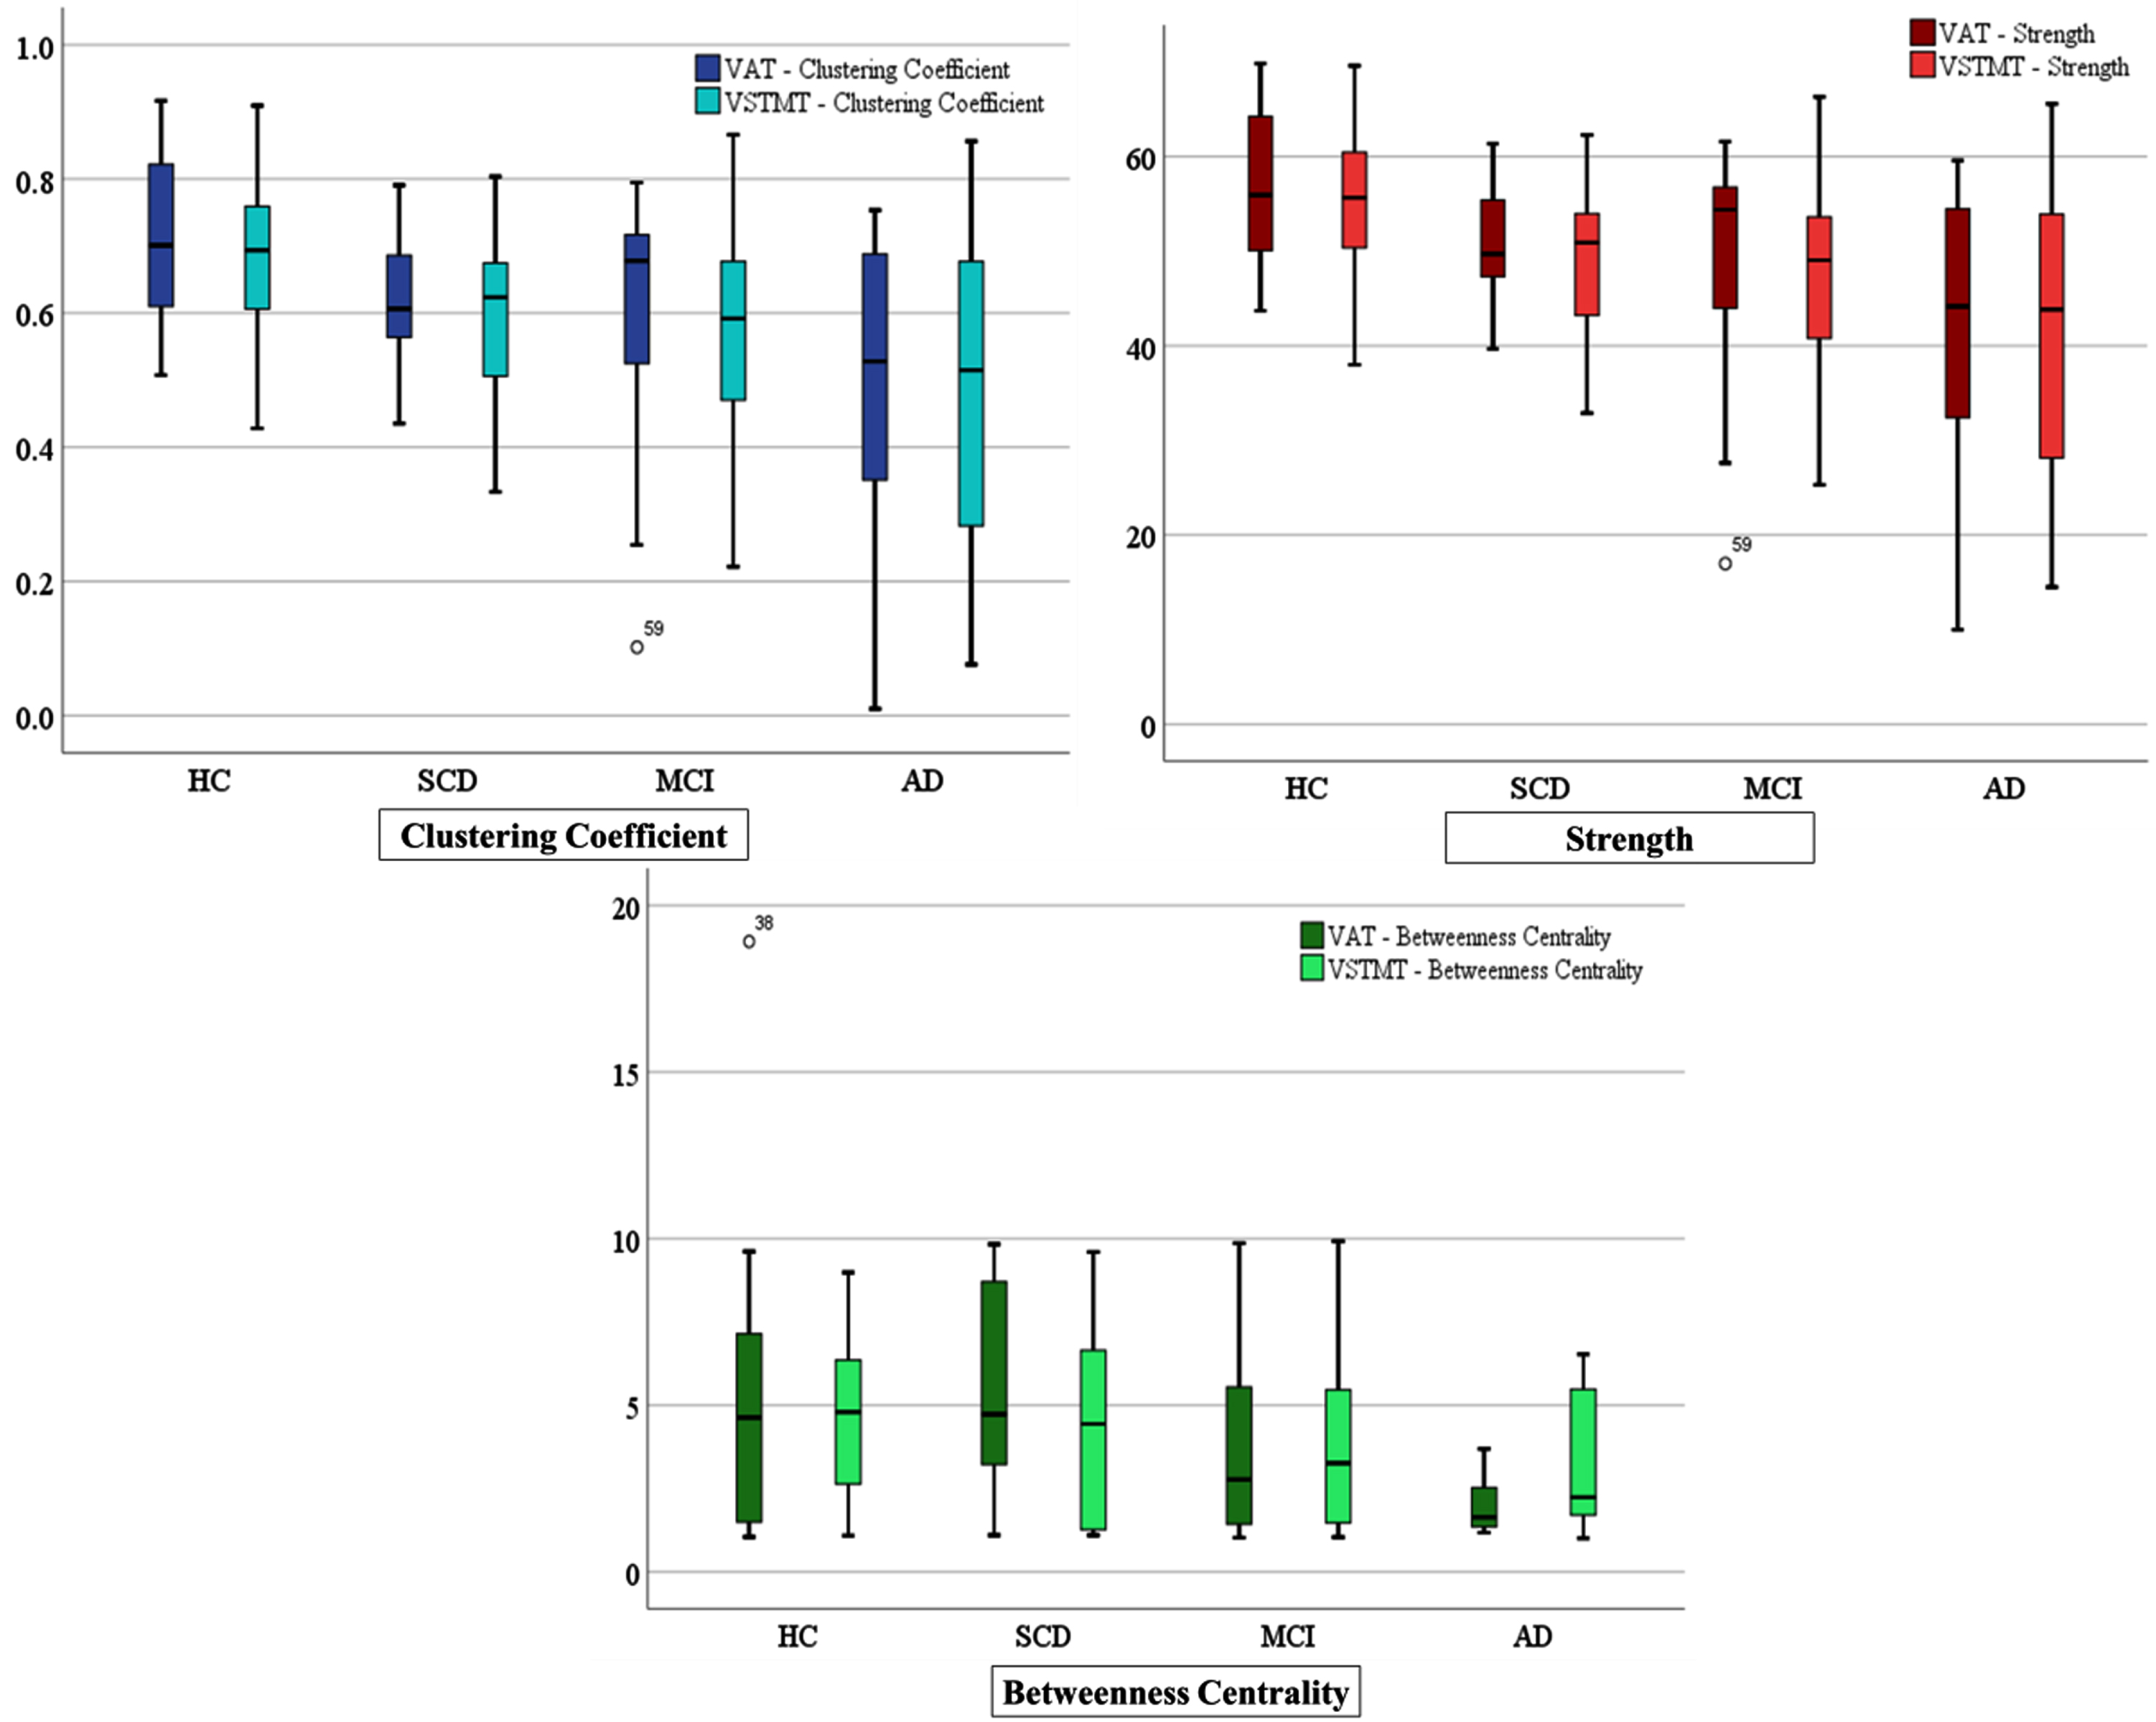
Boxplots showing differences for the four groups of participants (HC = 21, SCD = 17, MCI = 23, AD = 12) in Clustering Coefficient, Strength, and Betweenness Centrality during VAT and VSTMT.
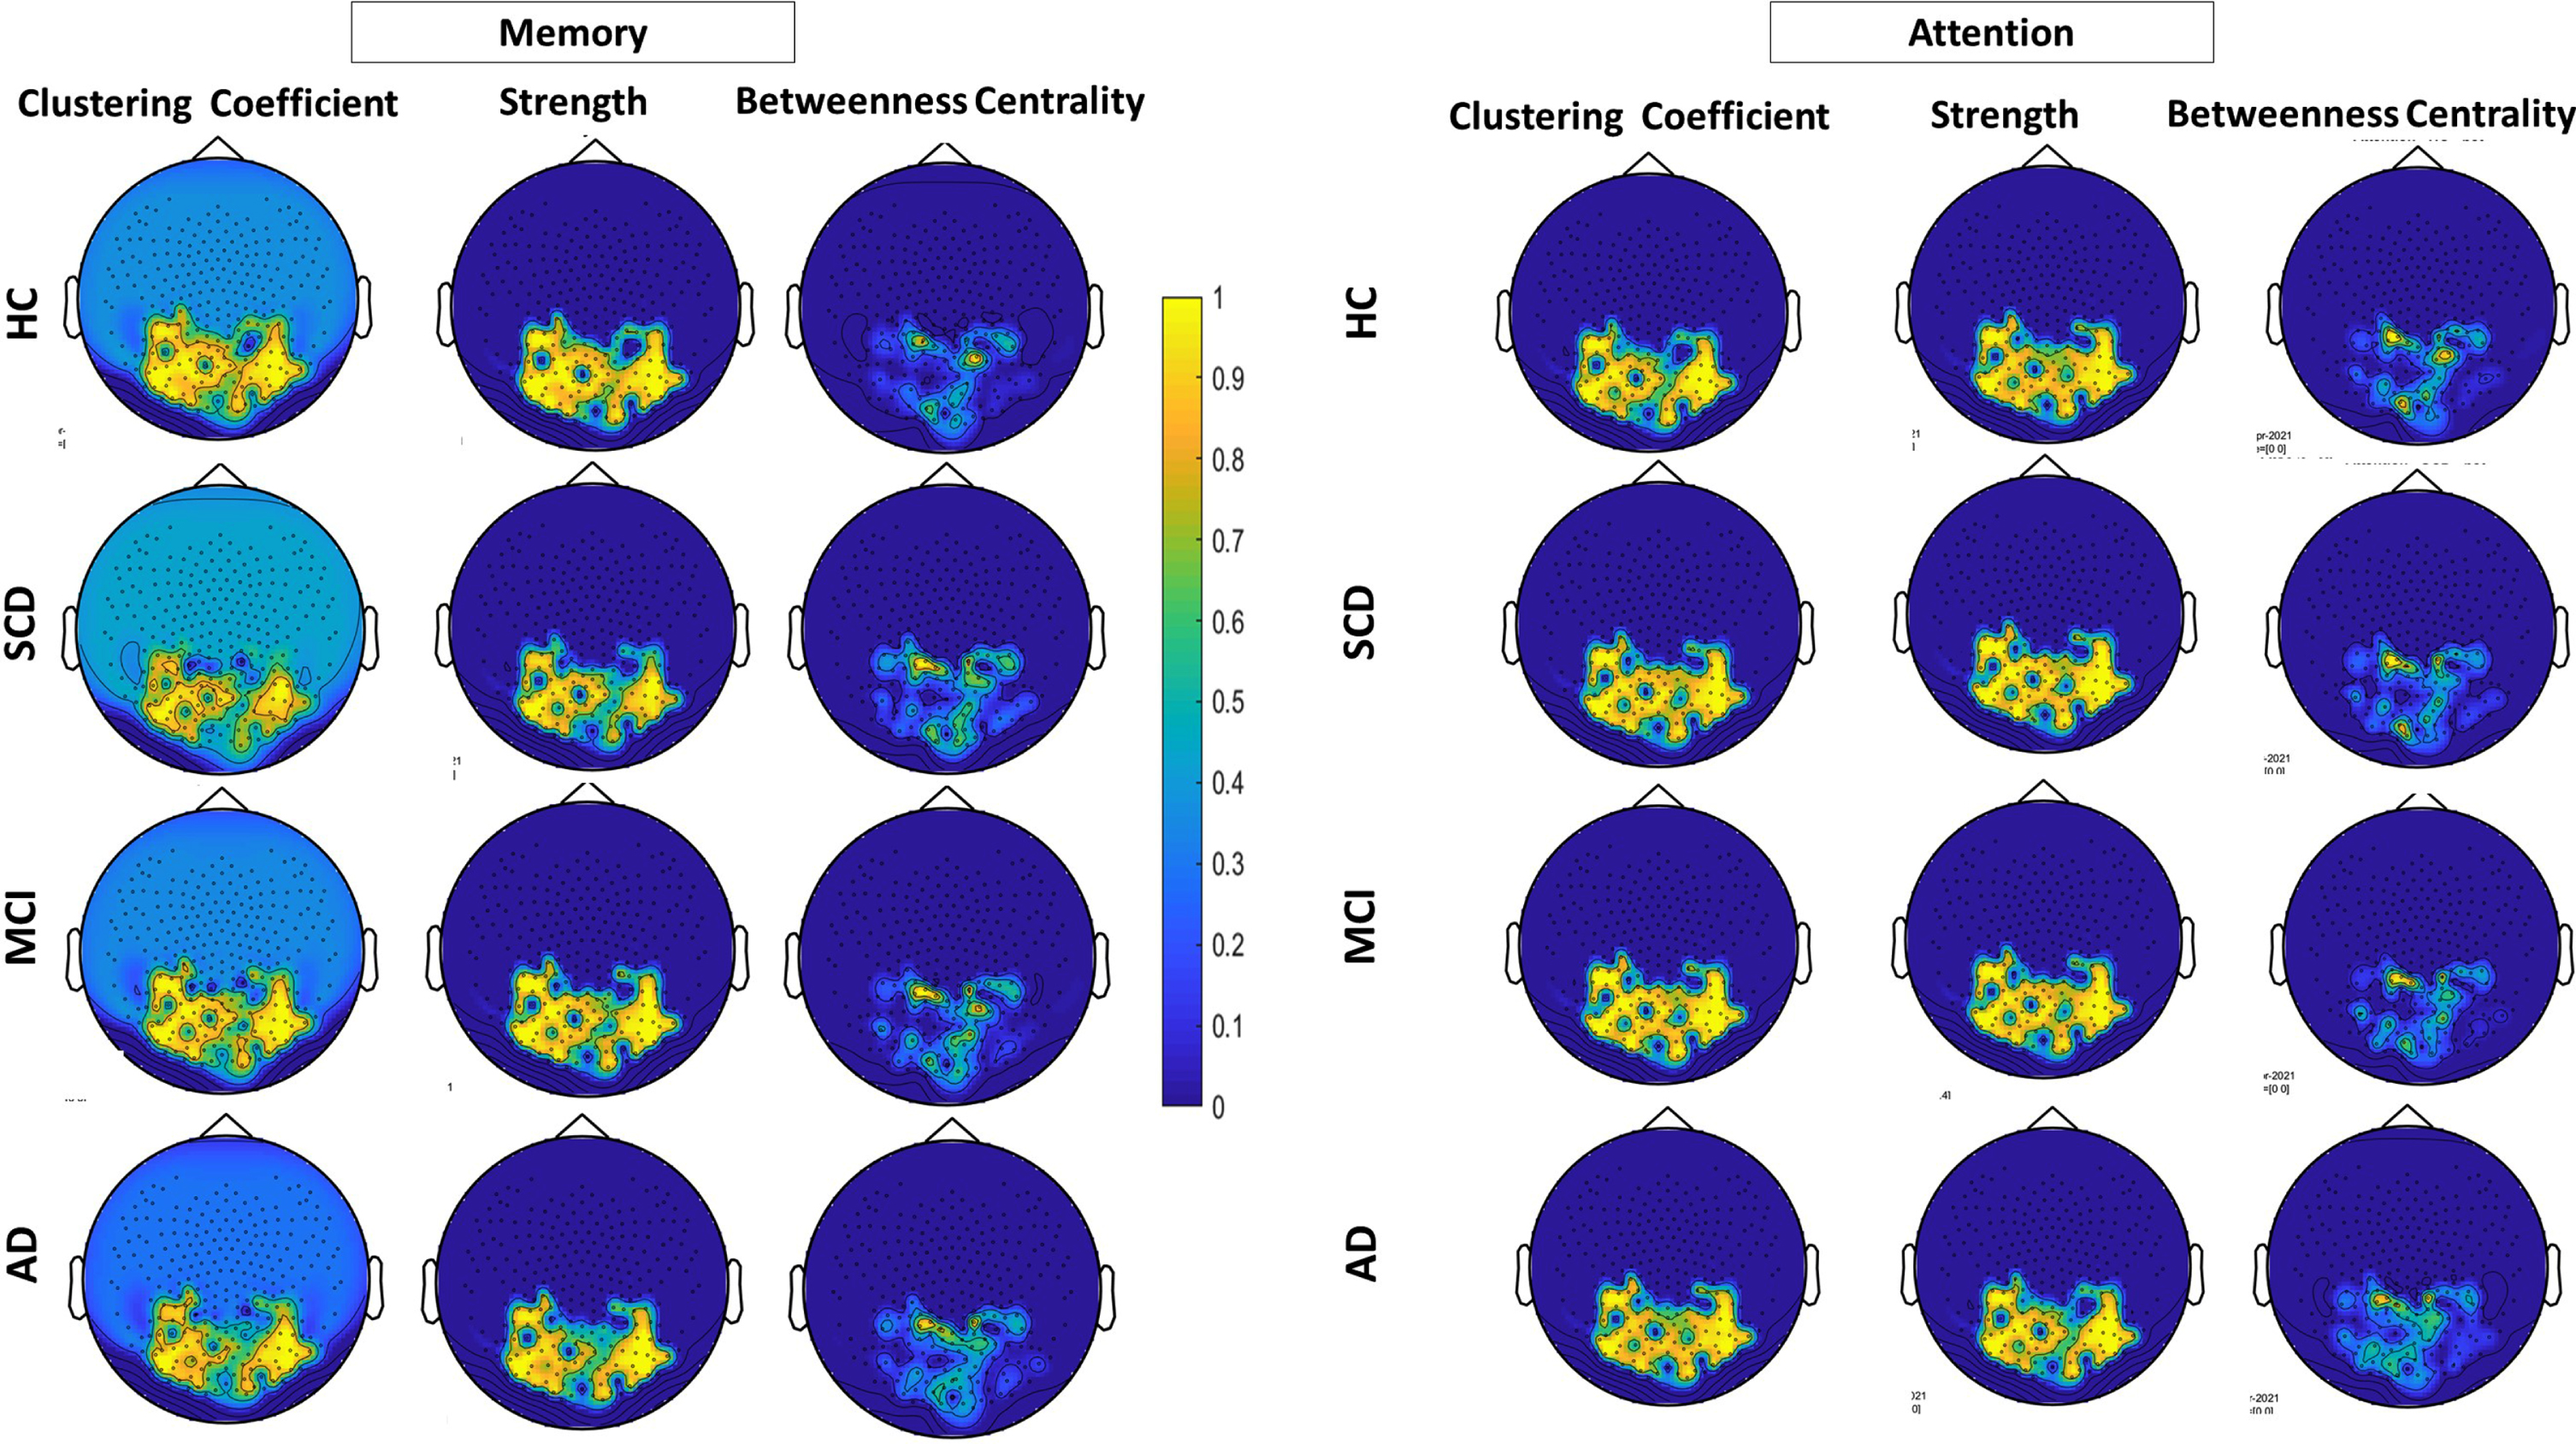
Topoplots for the three network metrics (clustering coefficient, strength and betweenness centrality during VAT (right) and VSTMT (left) across the four groups of participants (HC = 21, SCD = 17, MCI = 23, AD = 12).
In Table 2, we can observe that the mean values of the HC are higher compared to the rest of the groups (i.e., SCD, MCI, and AD). Moreover, the results of the one-way ANOVA test show that there is statistically significant difference in several network metrics across the four groups of participants at level p = 0.05, such as: i) in VSTMT: CC: [F (3, 69) = 4.56, p = 0.006], S: [F (3, 69) = 4.76, p = 0.005], and BC: [F (3, 69) = 0.78, p = 0.510], and ii) VAT: CC: [F (3, 59) = 5.06, p = 0.003], S: [F (3, 69) = 5.40, p = 0.002], and BC: [F (3, 69) = 3.54, p = 0.019]. In addition, the results of the independent sample t-test indicate that statistically significant differences are also present between pairs of groups as described below:
VAT
According to Independent Sample t-test, CC was higher for HC (M = 0.71, SD = 0.12) compared to SCD (M = 0.62, SD = 0.09), t (36) = 2.43, p = 0.026, to MCI (M = 0.59, SD = 0.19), t (42) = 2.34, p = 0.024, and to AD group (M = 0.48, SD = 0.25), t (31) = 3.58, p = 0.001 as well. On the other hand, with regards to S, statistical analysis showed higher values for HC (M = 56.42, SD = 8.06) compared to SCD (M = 50.59, SD = 6.19), t (36) = 2.45, p = 0.019, to MCI (M = 48.91, SD = 11.97), t (42) = 2.41, p = 0.020, and to AD group (M = 40.77, SD = 16.74), t (31) = 3.58, p = 0.001. Finally, BC showed no statistically significant differences between HC and SCD or MCI but only between HC (M = 5.33, SD = 4.15) compared to AD (M = 1.97, SD = 0.82), t (31) = 2.75, p = 0.010 and SCD (M = 5.33, SD = 3.08) compared to AD (M = 1.97, SD = 0.82), t (27) = 3.67, p = 0.001.
VSTMT
Similar to VAT, according to Independent Sample t-test, CC was also higher for HC (M = 0.69, SD = 0.12) compared to SCD (M = 0.59, SD = 0.11), t (36) = 2.33, p = 0.025, to MCI (M = 0.59, SD = 0.15), t (41) = 2.43, p = 0.019 and to AD group (M = 0.48, SD = 0.24), t (31) = 3.25, p = 0.003 as well. Additionally, with regards to S, statistical analysis showed higher values for HC (M = 55.15, SD = 8.36) compared to SCD (M = 49.27, SD = 7.47), t (36) = 2.26, p = 0.030, MCI (M = 48.21, SD = 9. 71), t (41) = 2.44, p = 0.019, and AD group (M = 41.52, SD = 15.83), t (31) = 3.25, p = 0.003. On the other hand, with regard to BC, comparisons between the remainder of the groups revealed no statistically significant difference either between SCD versus MCI and AD or MCI versus AD.
In Fig. 3, we can observe increased FC (lower mean values in CC and higher mean S) in HC with regards to SCD, MCI, and AD participants, while lower mean values of BC have also been found in later stages of the disease.
Finally, in Fig. 4, we can see that HC group presents a denser network with several connections between nodes at occipito-parietal electrodes regarding CC and S. As the disease progresses, we can see more apparent connections between nodes during VAT and VSTMT (Fig. 4). The correlation differences are more obvious in the VAT. Especially in the case of AD the network connections are much more aberrant, while network interruption is widely observed over the occipito-parietal network.
Sensitivity and specificity of network properties
In this section, we investigate the potential utility of the abovementioned network properties for VAT and VSTMT as a marker to distinguish an individual’s cognitive condition (SCD, MCI, and AD) compared to HC by testing Sensitivity and Specificity among the groups (Table 3). More specifically, we examined the Area Under the Curve (AUC), as formed by drawing the curve of Sensitivity versus Specificity. These pieces of evidence can provide information about the use of CC, S, and BC as indicators that would distinguish SCD from the other conditions (and more importantly the HC from SCD) using objective measures. Specificity and Sensitivity values were estimated by using SPSS v25.0. In particular, we developed ROC curves and identified the best threshold of the network metrics to differentiate the groups. The Sensitivity and Specificity scores corresponding to the cutoff thresholds alongside with the AUC are shown in Table 4, while Fig. 5 visualizes the AUC, Sensitivity, and Specificity of the respective network metrics.
Sensitivity and Specificity of Clustering Coefficient, Strength, and Betweenness Centrality at VAT and VSTMT for all different combinations between pair of groups
Mean±SD of network properties during VAT and VMT across the four groups (HC = 21, SCD = 17, MCI = 23, AD = 12). The last column of the table shows the p-value of one-way ANOVA. Superscripts indicate the statistical significance between groups after independent sample t-test
*HC versus SCD - p < 0.05. **HC versus SCD –p < 0.01. ***HC versus MCI –p < 0.05. ∨HC versus AD –p < 0.001.
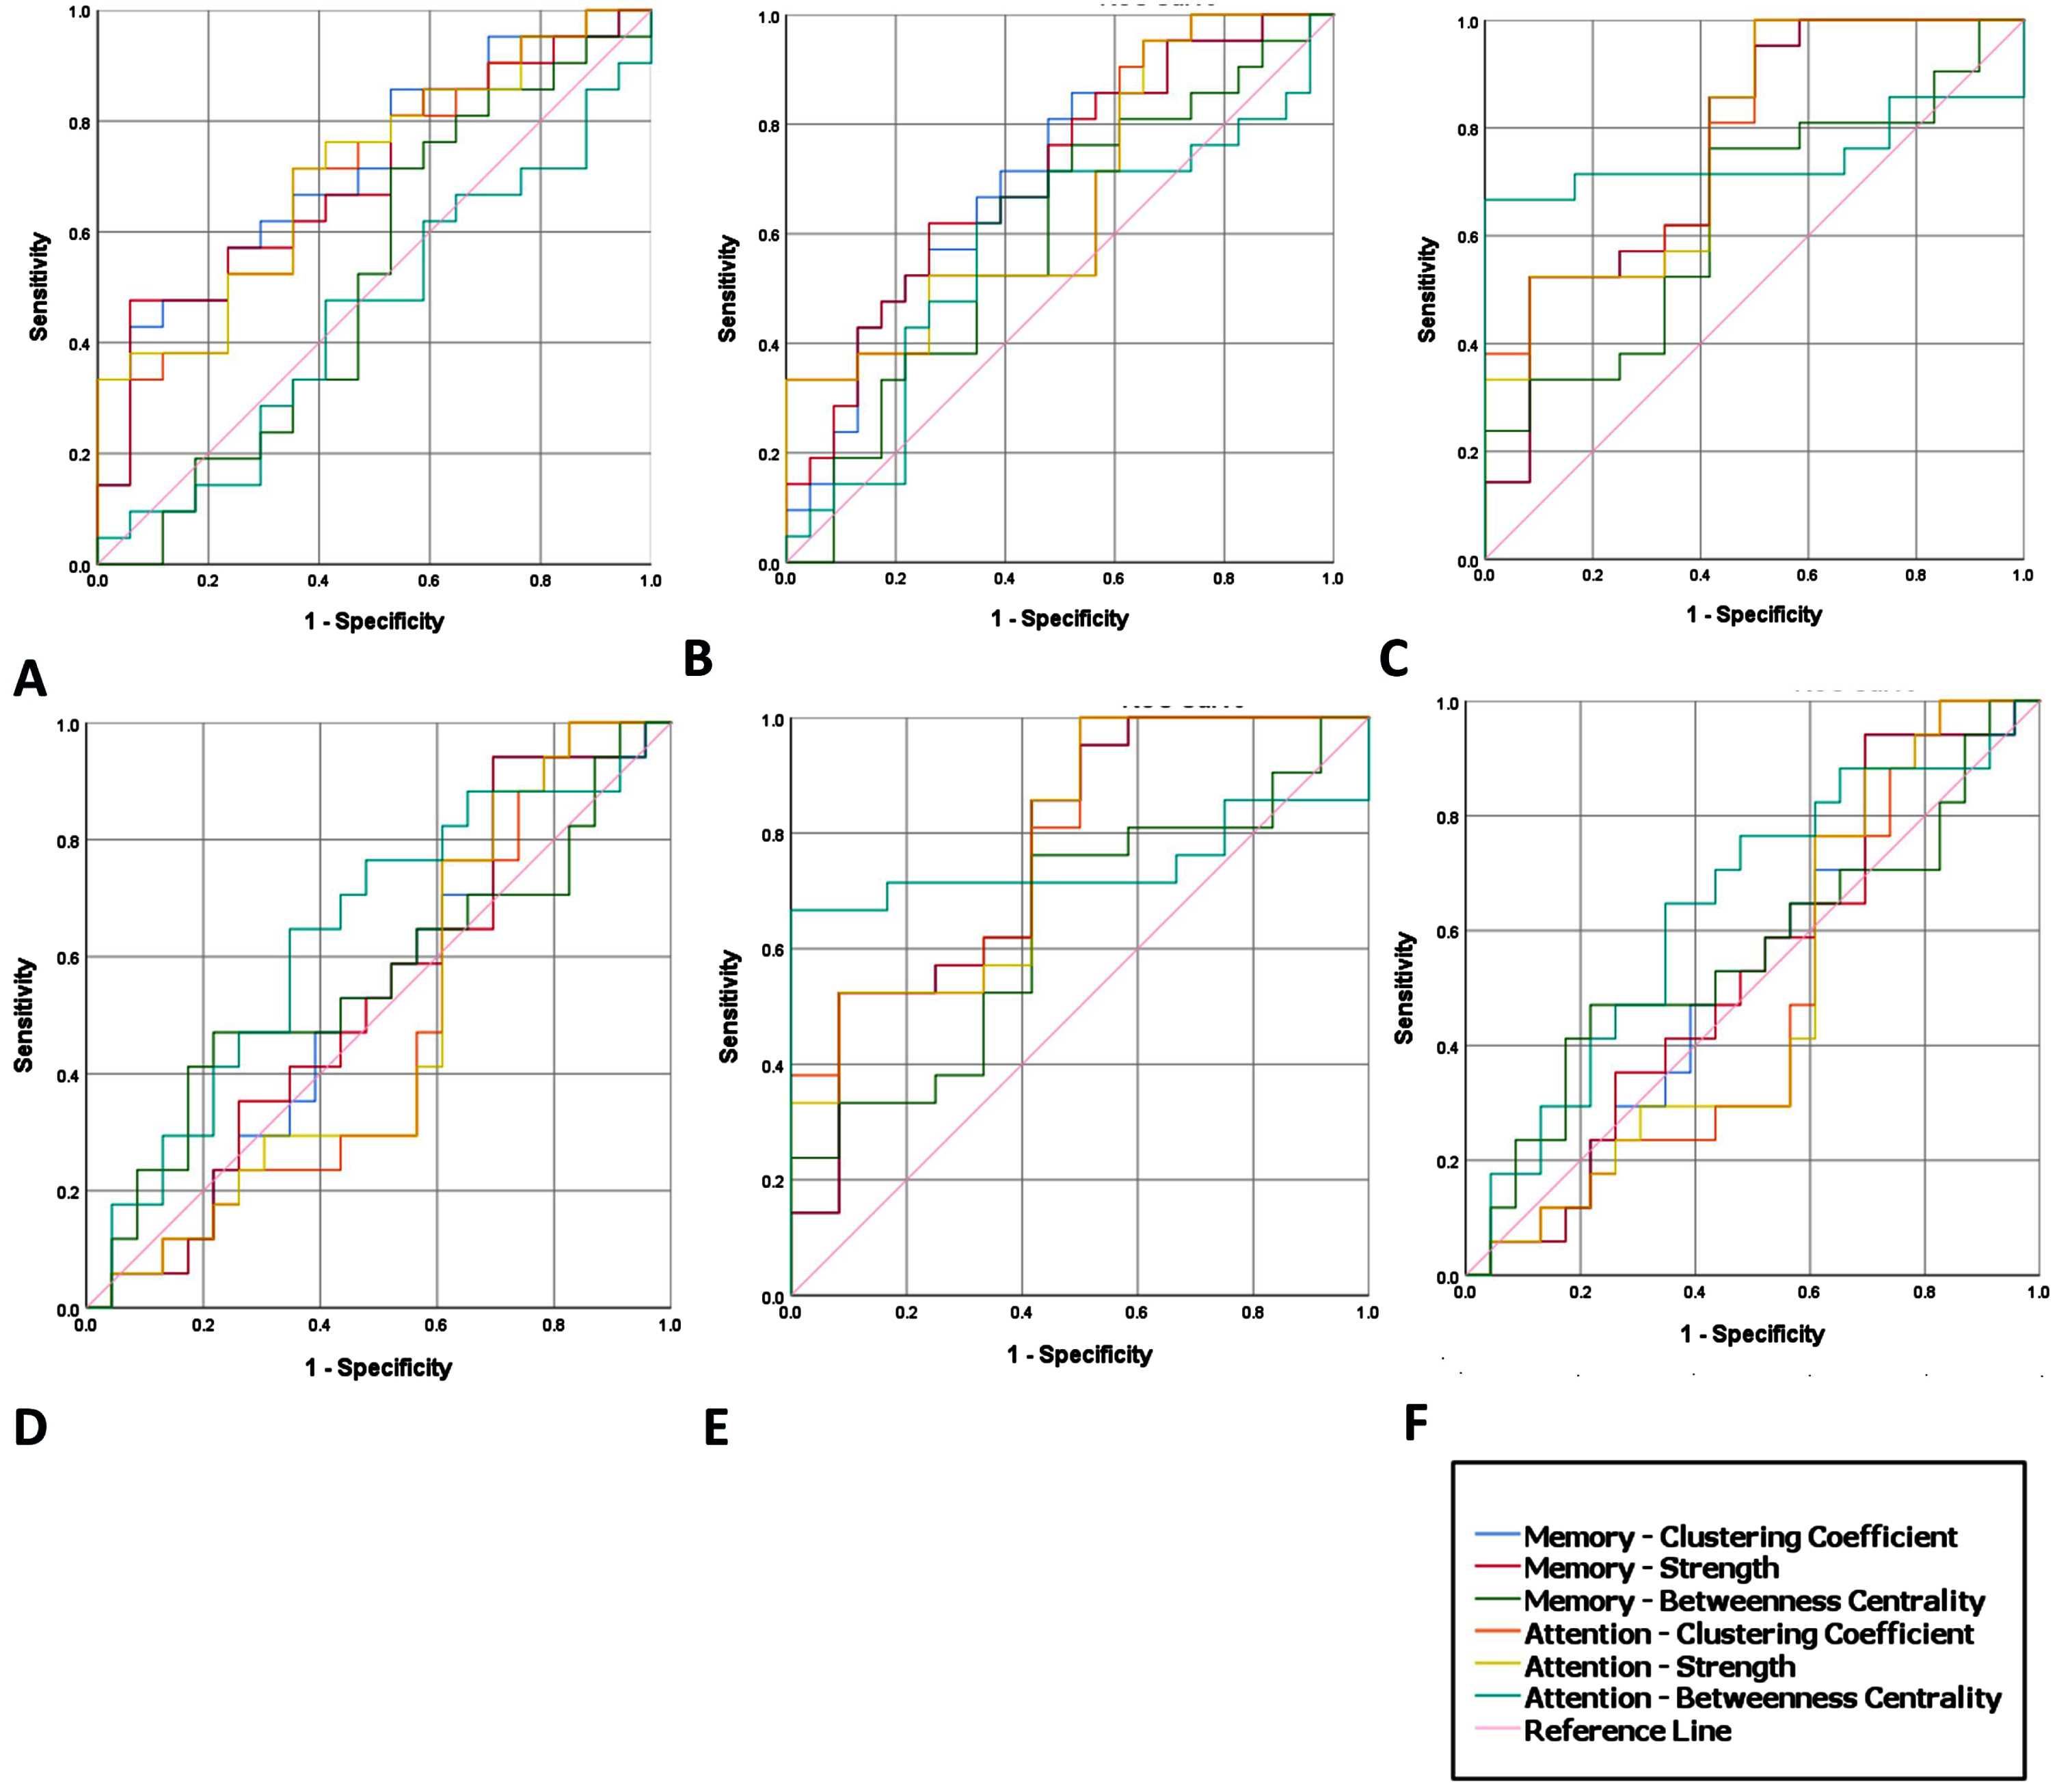
ROC Curves showing the Clustering Coefficient, Strength, and Betweenness centrality at VAT and VSTMT for discriminating between: A) SCD and HC, B) MCI and HC, C) AD and HC, D) MCI and SCD, E) SCD and AD, F) MCI and AD.
In detail, we manage to successfully discriminate HC from SCD using either the CC (Sensitivity = 75% and Specificity = 64%, AUC = 71%) or the S (Sensitivity = 75% and Specificity = 64%, AUC = 71%) measure during VAT and VSTMT. Also, we manage to discriminate HC from MCI using either the CC (Sensitivity = 64% and Specificity = 80%, AUC = 73%) or the S (Sensitivity = 80% and Specificity = 64%, AUC = 79%) measure during both tasks. Finally, HC also discriminated from AD using either the CC (Sensitivity = 65% and Specificity = 82%, AUC = 79%) or the S (Sensitivity = 65% and Specificity = 82%, AUC = 79%) both in VAT and VSTMT. None of the other simulation tests for BC did manage to yield a performance over the minimum value (AUC = 60%) both for Specificity and Sensitivity (Fig. 5). Consequently, although there are cases that we managed to surpass 60%, which indicates a good classification of patient groups, there is still work to do for reaching a clinically meaningful and a highly robust level of discrimination between groups that will allow the adoption of these metrics by the clinicians.
Neuropsychological assessment and network properties
Neuropsychological assessment revealed no statistically significant difference between HC and SCD, whereas significant difference was found between HC and the rest of the groups (MCI and AD) at baseline (Table 1). On the other hand, follow-up neuropsychological assessment after 3 years (Table 1) revealed significant changes in the cognitive performance of the SCD group since 35.3% remained at SCD stage and 64.7% converged to MCI. In addition, from the MCI group, 13% converged to AD and 78.2% remained at MCI group. On the other hand, from the HC group only 9.5% converged to MCI. Moreover, the SCD group who converted to MCI and MCI group who had further cognitive decline or converted to AD showed worse performance in the second neuropsychological examination compared to the baseline assessment (Table 1). Additionally, with regards to the network metrics, SCD who do converted to MCI had lower performance: i) in VSTMT: CC: (M = 0.57, SD = 0.12), S: (M = 47.80, SD = 7.73), and BC: (M = 4.19, SD = 3.16); ii) VAT: CC: (M = 0.62, SD = 0.11), S: (M = 50.73, SD = 7.03) and BC: (M = 4.86, SD = 3.30). On the other hand, the SCD that remained stable showed increased values i) in VSTMT: CC: (M = 0.72, SD = 0.11), S: (M = 57.29, SD = 7.03), and BC: (M = 4.35, SD = 2.70); ii) VAT: CC: (M = 0.68, SD = 0.10), S: (M = 54.93, SD = 6.14) and BC: (M = 3.58, SD = 0.51).
As seen in Table 1, statistically significant differences at baseline are mostly found between the group of HC compared to MCI (less frequent) and AD (in almost all tests), supporting the differentiation of MCI and AD compared to HC in a variety of cognitive domains (e.g., Daily functionality, Memory, Executive Function, etc.). However, as expected, in the case of patients with SCD, who are clinically and cognitively equal to HC, no significant differentiation was found between traditional neuropsychological tests at baseline, which motivates the need to explore other mechanisms for distinguishing between HC and SCD, given that both groups present similar cognitive profile and neuropsychological performance. Albeit, in the follow-up assessment after three years, statistically significant difference was found among the four groups and between the baseline and follow-up assessment in each group of SCD, MCI, and AD showing deterioration in global cognition, visuospatial ability, and episodic memory.
DISCUSSION
The present study presents the results of investigating brain connectome alterations in the preclinical stages of AD by using a HD-EEG during VSTMT and VAT. The evidence collected suggest the importance of brain network metrics extracted through EEG, for the characterization of a subject as SCD that is highly likely to convert to more advanced stages of AD and its connectivity mechanisms as a trigger of the dementia. Our study showed that SCD and MCI participants demonstrate interruptions both in visual attention and in short-term memory network compared to HC, showing the potential use of these networks to identify people that even though they still exhibit a normal neuropsychological profile, they are at risk of developing AD.
In more detail, the results showed that AD patients were always characterized by high impairment levels, while MCI and SCD patients had an intermediate performance compared to HC. In HC, increased CC and S over posterior regions has been found during VSTMT, presumably related to better encoding process during the attentional phase which yields subsequent better retrieval, whereas in SCD and MCI reduced CC and S over posterior regions was detected. According to the conditions and/or the measures considered, SCD performances were close to MCI patients. Indeed, SCD participants’ retrieval processes were impaired in visual modality, which paves the way to suggest that SCD, MCI, and AD patients present limited access of the memory trace or that they have not successfully encoded the information. Therefore, a disrupted attentional process might be partly indicative of the deficit particularly in VSTMT, presenting subtle connectivity alterations.
Moreover, in order to evaluate the potential use of these network metrics as biomarkers, we employed the ROC curve analysis to define the cut-off scores and the Sensitivity and Specificity of each metric (clustering coefficient, strength and betweenness centrality). Based on our findings, the clustering coefficient and strength during VAT have the potential to serve as markers for the detection of SCD, since they manage to distinguish SCD from HC with 71% Sensitivity and 65% Specificity (AUC = 71%, in ROC curves), MCI from HC with 71% Sensitivity and 61% Specificity (AUC = 71% and AUC = 70%, respectively, in VSTMT ROC curves), and AD from HC with 62% Sensitivity and 67% Specificity (AUC = 78% in ROC curves). An important finding deriving from the present study is that several SCD participants, that exhibited a similar neuropsychological profile with HC in the baseline examination but differed in brain network, demonstrated significant cognitive decline after three years compared to HC as revealed by the follow-up assessment. These findings suggest that people who present intermediate values to HC and MCI, may actually convert to MCI after 3 years. In detail, even before detecting decline in neuropsychological tests, network disruptions might show a common disconnection pattern of the brain connectome in SCD, although not to the same extent as in MCI. Moreover, the SCD group who converted to MCI and the MCI who presented worse performance or converted to AD had lower scores in the majority of neuropsychological assessment after three years compared to those who remained stable. Similarly, it has been demonstrated that cognitive measures can predict progression from MCI to Alzheimer’s type dementia/AD [11].
While a prevailing body of literature underlined impaired memory and execution in SCD and MCI population, our findings are in contrast with recent longitudinal studies supporting that neuropsychological assessment in elderly population demonstrates impairment of executive functions, memory, but not attention [52, 140]. In a cross-sectional study [52], it was highlighted the existence of statistical significant differences with respect to selective and sustained attention in HC and SCD, whereas a subsequent longitudinal study concluded that the decline in simple sustained attention in MCI may be early precursors of future cognitive decline related to AD [140]. In this common vein, previous studies have demonstrated good performance in visual short-term memory tasks in asymptomatic cases, prior to the onset of dementia [55]. On the other hand, recent studies have demonstrated increased visual attention and memory errors in patients with AD [141–143], which are aligned with our results supporting that people with cognitive decline present extensive interruption with regards to brain connectome during visual attention and short-term memory tasks. Together, these findings provide growing support for the view that AD and its preclinical stages is associated with visual short-term memory impairments, and that lower performance in visual short-term memory related tasks might be an important signature of cognitive decline. In particular, a large part of the literature has suggested that lower test scores for memory is related to progression from MCI to AD [58]. The aforementioned research evidence is in line with our main findings that the visual attention and visual short-term memory may be vulnerable cognitive domains to early neurodegenerative process associated with SCD. Therefore, our clinical observations also supported this hypothesis, as SCD may frequently report frustration during handling work with more cognitive demands in other non-memory function, such as attention or information processing. Nevertheless, in a recent study, they explored the visual short-term memory deficits by comparing performance in patients with AD to a group of individuals with SCD [55]. SCD people, although mentioned decline in cognitive function, did not demonstrate objective clinical and cognitive changes at the time of the baseline assessment. Interestingly, compared to AD, SCD patients overall did not demonstrate any impairment in short-term retention of object-location bindings. In contrast with this study, our results showed statistically significant better performance in SCD group compared to AD but to lower extent than those of HC.
In line with previous research, we found apparent connections over the posterior regions of the brain during both tasks in people with SCD compared to HC. In particular, a recent study showed that SCD had decreased FC between the lingual gyrus, the left hippocampus and calcarine sulcus, which are areas that are basically involved in encoding visual memories [144, 145], and retrieval [99]. Therefore, interrupted FC between these brain regions could be indicative of poorer visual memory processing that impacts the subjective feeling of cognitive decline and might be also influenced by aging [50, 147]. However, what decreasing FC between the primary visual cortex and other brain regions implies for SCD, is still under investigation, especially as direct connectivity between parietal regions and visual cortex is between in the dorsal and ventral brain areas [93, 149]. Thus, decreased FC across the region of hippocampus and calcarine sulcus and lingual gyrus may reflect disrupted information transition to the hippocampus, indicating that cortical atrophy in visual regions may reflect AD, which is related to lower visuospatial ability and executive function [35, 150]. Thus, decreasing parietal to occipital FC in SCD, as we found in our study, strengthens support for SCD as a dementia precursor. Also, an important strength of the current study that relates to its design is the comparison of neuropsychological tests at baseline and 3-year follow-up, allowing us to derive the percentage of subjects that actually converted to a more advanced stage of AD, despite having a normal neuropsychological profile at baseline. In this way, we were able to quantify the benefit of having brain network properties measured during VAT and VSTMT that are capable of discriminating HC from SCD at baseline. Given that SCD were found to eventually convert in MCI with much higher percentage than HC, further advocates the potential of using EEG, after testing it in larger sample, as a tool for the early detection of people that may develop future cognitive decline so as to enable personalized and timely interventions. Although SCD is recognized as a high-risk status of AD with a normal cognitive level, which is earlier than the stage of MCI [151, 152], the conversion rate of SCD to MCI is 2.3% and 6.6% per year. However, a recent longitudinal neuroimaging study found that 31% of SCD progressed to MCI according to MRI and neuropsychological tests [153], while 52 out of 111 SCD remained stable. In our sample the conversion rate of 64.7% after 3 years follow-up can be explained also due to the fact that the participants were recruited from the outpatient clinics and day centers where the patients have an increased concern about their memory and cognitive ability instead of general public, given that community-based SCD subjects confer a much lower risk of progression to MCI over 3 years compared to clinical cohorts [154]. Therefore, the conversion of the SCD may not only due to cutting off sample sizes, insufficient follow-up time or could also misidentify many SCDs who could potentially convert to MCI, which could result in a highly mixed and heterogenous sSCD group, further reducing statistical power [153].
Nevertheless, several limitations should be reported in the present research study. The subject number was limited especially for AD, therefore raising concerns on whether the results might be biased by the small sample size. However, there are plenty of neurophysiological and brain connectome studies, which have used a similar number of participants or even smaller (12 SCD and 19 MCI [100]; 16 HC and 18 MCI [111]; 13 HC, 16 SCD, and 8 AD [155]; 9 HC and 14 MCI [156]; 16 MCI and 12 HC [157]). Therefore, we believe that given the complexity of conducting a neurophysiological brain connectome study in the patient population, the small number of participants might be a limitation but not a critical one that could mislead the results of the present study. Nevertheless, a possible future extension of this study could be the verification of the presented results in a larger sample including more participants from each stage. Moreover, another limitation of the study is that follow-up assessment was based solely on neuropsychological assessment and not on brain network properties. Thus, future longitudinal studies should focus on follow-up assessment of brain network properties on SCD subjects. This study highlights the importance of brain connectome during visual attention and visual short-term memory process to distinguish the subjects that are at higher from the ones that are at lower risk of developing cognitive decline in the future as a marker of preclinical AD. Further work is needed to examine additional task-specific factors, such as examining the same metrics after some time. Moreover, future studies could also explore Aβ markers or PIB-PET at baseline to investigate if they had any biomarkers of AD (i.e., cerebrospinal fluid amyloid or tau) or any information on the atrophy (like medial temporal lobe atrophy) or white matter hyperintensities (like Fazekas score) in the patients with SCD as compared with HC at baseline. That could strengthen the link between SCD and cognitive performance, as well as evaluating the extent to which other specific factors not examined in this study (e.g., genetic predisposition, volumetric properties of specific regions) may increase the association between SCD and brain networks markers as observed in this study. PCC was selected as a means to estimate connectivity between all pairs of electrodes. Power-based connectivity measurements, like PCC, have been examined by several studies [78, 159] with the scope of constructing weighted brain networks and this was the main reason we followed the same strategy here. Clearly, phase-based connectivity measurements such as weighted phase lag index (PLI), weighted PLI, or Spectral Coherence, could be also explored. This will in essence affect the network’s structure (i.e., phase-based and power-based measures of connectivity tend to reveal different patterns of connectivity), as the connectivity here is assumed to be instantaneous, while volume conduction issues must be also taken into consideration. Hence, phase-based connectivity measurements could be explored in any future extensions of this study as a means of verification but also as means to identify additional network properties that differ among the populations so as to measure connectivity such as Weighted Phased Lag Index [160], Phase Locking Value [161], and Granger Causality [162]. Further future work includes the RADAR-AD Tier 2 and Tier 3 study, which will take place at the CERTH-ITI Smart Home (https://smarthome.iti.gr), both utilizing EEG headbands. The Tier 2 study is already taking place in homes across European sites and utilized the DREEM EEG headband (https://dreem.com/). The Smart Home is a real living environment in Thessaloniki, Greece (https://smarthome.iti.gr/), equipped with a multitude of smart home sensors that monitor both environmental and behavioral parameters such as appliance usage and presence in rooms. The RADAR-AD Tier 3 study will involve healthy age-matched participants, SCD, and MCI to visit the Smart Home and take part in semi-directed as well as free living activities both during the day and during an overnight stay. They will use apps for assessment and intervention for AD and will be monitored by the sensors in order to investigate their suitability and performance as a testbed for future trials with MCI, SCD, and AD. Sensors will include portable EEG to explore similarities and differences to the present HD-EEG study, such as the capabilities and insights provided by the equipment as well as the acceptance and practicality of both applications. Additionally, the Muse EEG portable device will be employed so as to detect brain activity during mindfulness and resting state in people with SCD, MCI, and HC. As both studies include different EEG devices, both at home and at a home-like controlled environment, future work will explore similarities and differences, as well as the potential to transfer and compare the outcomes of the present HD-EEG study over to those applications. It will also explore the acceptance and practicality of these, more portable, applications.
Conclusions
This is the first ever reported study which investigates brain connectivity by using HD-EEG in order to explore network changes in SCD with regards to HC, MCI, and AD individuals while performing a VSTMT and VAT. Therefore, our study provides pieces of evidence that SCD may actually indicate a transitional preclinical stage of AD with network changes and brain connectome interruptions. HC presents a denser visual attention and short-term memory network with several connections between nodes at occipito-parietal electrodes regarding CC and S, whereas less connectivity between nodes (electrodes) in more advanced stages of AD was observed. The differences are more obvious during the visual attention, where the subjects must pay attention and encode the information. At 3-year follow-up examination, SCD showed worse performance in most of the neuropsychological tests compared to HC, while the MCI and AD also showed deterioration in almost all tests. Thus, considering the absence of any differentiation in the neuropsychological tests of HC and SCD at baseline, the ability of brain connectome analysis with EEG during VAT and VSTMT to differentiate between these groups can be considered particularly valuable.
Footnotes
ACKNOWLEDGMENTS
This research was funded by the RADAR-AD project, which has received funding from the Innovative Medicines Initiative 2 Joint Undertaking under grant agreement No 806999. This Joint Undertaking receives support from the European Union’s Horizon 2020 research and innovation programme and EFPIA (![]() ). This communication reflects the views of the RADAR-AD consortium and neither IMI nor the European Union and EFPIA are liable for any use that may be made of the information contained herein.
). This communication reflects the views of the RADAR-AD consortium and neither IMI nor the European Union and EFPIA are liable for any use that may be made of the information contained herein.