
Abstract
Background:
Recent Alzheimer’s disease (AD) genetics findings from genome-wide association studies (GWAS) span progressively larger and more diverse populations and outcomes. Currently, there is no up-to-date resource providing harmonized and searchable information on all AD genetic associations found by GWAS, nor linking the reported genetic variants and genes with functional and genomic annotations.
Objective:
Create an integrated/harmonized, and literature-derived collection of population-specific AD genetic associations.
Methods:
We developed the Alzheimer’s Disease Variant Portal (ADVP), an extensive collection of associations curated from >200 GWAS publications from Alzheimer’s Disease Genetics Consortium and other consortia. Genetic associations were systematically extracted, harmonized, and annotated from both the genome-wide significant and suggestive loci reported in these publications. To ensure consistent representation of AD genetic findings, all the extracted genetic association information was harmonized across specifically designed publication, variant, and association categories.
Results:
ADVP V1.0 (February 2021) catalogs 6,990 associations related to disease-risk, expression quantitative traits, endophenotypes, or neuropathology. This extensive harmonization effort led to a catalog containing >900 loci, >1,800 variants, >80 cohorts, and 8 populations. Besides, ADVP provides investigators with a seamless integration of genomic and publicly available functional annotations across multiple databases per harmonized variant and gene records, thus facilitating further understanding and analyses of these genetics findings.
Conclusion:
ADVP is a valuable resource for investigators to quickly and systematically explore high-confidence AD genetic findings and provides insights into population-specific AD genetic architecture. ADVP is continually maintained and enhanced by NIAGADS and is freely accessible at https://advp.niagads.org.
Keywords
INTRODUCTION
Alzheimer’s disease (AD) is a devastating neurological disorder affecting millions of people worldwide and is the most common cause of dementia [1]. There are no approved drugs that can slow or treat the disease. The disease is complex and highly heritable [2]. The strongest known genetic risk factor for AD is the ɛ4 allele of the Apolipoprotein E gene (APOE ɛ4) [3, 4], but more than one-third of AD cases do not carry any APOE ɛ4 alleles. Large-scale genome-wide association studies (GWAS) have led to the discovery of additional common genetic loci associated with the late-onset AD (LOAD) [5 –9]. Yet, the identification of genetic contributors to LOAD remains a challenge as LOAD is likely caused by multiple low penetrance genetic variants [10], with the small sample sizes further complicating the identification of these causal variants.
The Alzheimer’s Disease Genetics Consortium (ADGC) was founded in 2009 and funded by National Institute on Aging (NIA), to conduct large sample GWAS to identify genes associated with an increased risk of developing LOAD. ADGC co-founded IGAP (International Genomics of Alzheimer’s Project) with three other AD genetics consortia: Cohorts for Heart and Aging Research in Genomic Epidemiology (CHARGE) Consortium, the European Alzheimer’s Disease Initiative (EADI), and the Genetic and Environmental Risk in Alzheimer’s Disease (GERAD) Consortium. IGAP assembled large Caucasian samples for better statistical power and was able to identify 19 genome-wide significant loci in 2013 [11], and five more loci using 30,000 samples more in total in 2019 [12].
In addition to GWAS focusing on association with disease risk, many recent genetic studies have been performed on related phenotypes including neuroimaging biomarkers [13], circulating biomarkers [14, 15], cognitive decline [16, 17], neuropathology [18], and family history [19]. GWAS on Hispanic, African-American, Asian, and other minority populations also led to new variants not observed in Caucasians [20 –22].
In order to help investigators better explore the rich and diverse literature of genetic findings, it is important to have a single resource with harmonized, unified, searchable information on identified genetic variants and genes across a variety of AD studies and populations, along with supporting functional genomic evidence.
To meet this need, we have cataloged genome-wide significant and suggestive genetic association results from all major GWAS published by ADGC (2009–2020) and other AD GWAS publications from the NHGRI/EBI GWAS Catalog [23]. Summaries extracted from each of the articles are made publicly available on the Alzheimer’s Disease Variant Portal (ADVP) (https://advp.niagads.org). To date, ADVP provides the largest, most updated, and comprehensive collection of systematically curated, harmonized, and annotated AD-specific genetic associations. This first release contains information on 6,990 genetic associations and >900 loci curated and harmonized from >200 AD publications. ADVP will serve as an invaluable resource for the research community to explore and decipher the genetic architecture of AD and other neurodegenerative diseases.
MATERIALS AND METHODS
An overview of the ADVP study design is shown in Fig. 1. Supplementary Note 1 provides details on ADVP architecture and implementation.
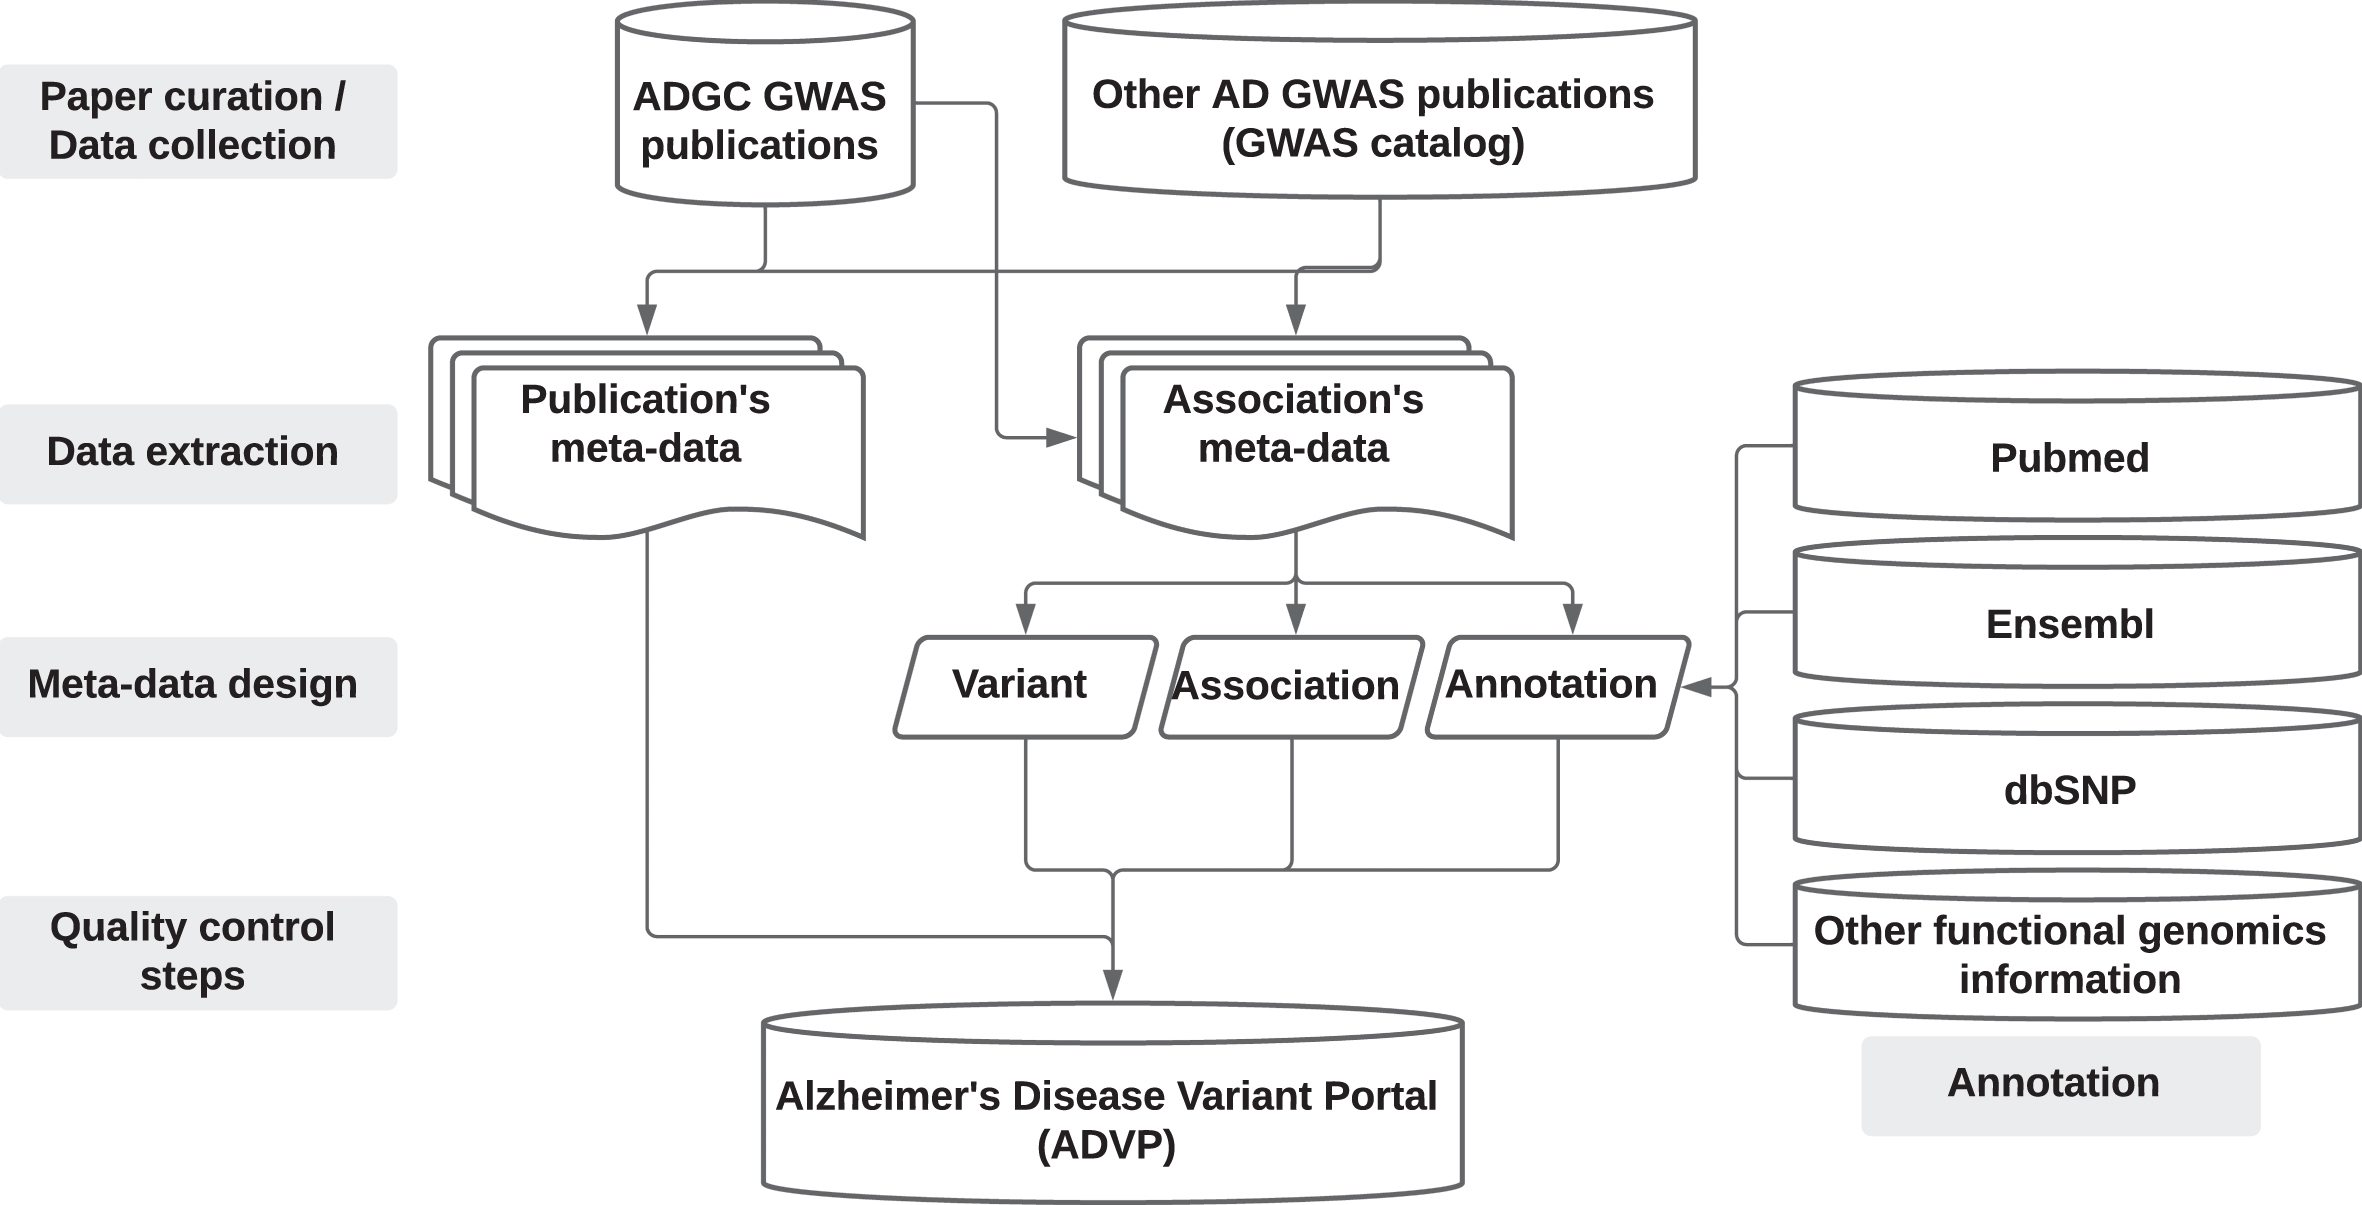
ADVP study design. AD GWAS publications are first collected (Section “Data collection”), genetic variant and association data are then systematically extracted (Section “Data extraction”), harmonized (Section “Meta-data design”), annotated (Section “Annotation”), subjected to quality control steps (Section “Quality control steps”), and stored into ADVP.
Data collection: Collection and curation of AD-related GWAS publications
This ADVP V1.0 release consists of curated and harmonized genetic associations from the genome-wide significant and suggestive loci collected from AD genetic studies conducted primarily by the ADGC. ADGC identified and compiled peer-reviewed publications which used ADGC data by searching the PubMed database for publications with the Consortium’s name as a coauthor or in the acknowledgments, or in which the ADGC’s NIA grant number (UO1AG032984) is referenced or acknowledged. Use of data was confirmed through the methods or supplemental section of the publication. The ADGC AD GWAS publications (2009-January 2020, https://www.adgenetics.org) together with the AD GWAS studies curated using “Alzheimer’s Disease” (MeSH D000544) in GWAS catalog [23] (curation date: Janurary 2020) and not in the ADGC set, were included in the initial set of publications for further curation. All the initial publications (total N = 205; primary ADGC: N = 134; additional publications identified from ADGC review papers: N = 20; additional publications from GWAS catalog: N = 51) were first screened to identify publications reporting GWAS findings. For each publication reporting GWAS findings, all genetic associations reported in the main text (table format) were systematically extracted. As the current ADVP release focuses on the major/main findings in each publication/GWAS study, we did not extract associations reported in the supplementary tables as they often represent supplemental findings not reaching the same level of statistical significance as the main associations. In total, we curated 125 publications which contained GWAS findings reported in the main text (https://advp.niagads.org/publications). Supplementary Table 1 provides details on all curated AD publications in ADVP V1.0. Note the ADGC family-based analyses results will be included in the next release.
Data extraction: Extraction of genetic variants and associations from publications
We applied the following systematic data extraction and curation procedure for each publication to organize all the extracted variant and association information into a structured tabular format according to the pre-specified/designed ADVP data schema (see Section “Meta-data design” for details about the ADVP schema/columns). In each publication, we identified all the tables in the main text with reported association p-values. All the information for these associations was then saved into corresponding template publication meta-data and association meta-data documents. We then performed harmonization for few ADVP fields to ensure consistency and reduce variability when presenting extracted/reported information across publications (e.g., cerebrospinal fluid amyloid beta (1-42) levels can be reported as “CSF Aβ1-42” or as “CSF Abeta”; we map all such reported terms to the same “CSF Ab1-42” term). A second curator was used to verify if the publication records match the curated contents made by the first curator.
Lastly, the extracted information was parsed by customized scripts to validate, annotate, and store the publication, variant, and association data in the relational database [33].
Meta-data design: Meta-data schema for systematic curation and harmonization of genetic associations
Publication meta-data
Meta-data for all curated publications in ADVP was extracted from PubMed (https://pubmed.ncbi.nlm.nih.gov) using the NCBI EDirect command-line interface (https://www.ncbi.nlm.nih.gov/books/NBK179288) with publication PubMed identifiers (PMID) as query keys. For each publication, we record its PMID, PubMed Central identifier (PMCID), first and last authors, journal, and year of publications. We also store the abstract, article URLs, and information on curated/source tables in the Publication meta-data (Fig. 1).
Association meta-data
ADVP association meta-data consists of 28 data fields, of which 19 are extracted directly from the paper contents. The rest of the fields are harmonized (based on extracted original information) or programmatically generated. Harmonized fields were constructed to ensure consistency and reduce variability when combining and presenting the reported/extracted information across publications, e.g., by assigning reported data values into pre-defined phenotype and population groups. Altogether, association meta-data provide 1) variant information (Section “Description of Variants”); 2) association information (Section “Description of association records”); and 3) annotation information (Section “Annotation”). For a detailed explanation of these curated and harmonized/derived data fields, see Supplementary Table 2.
Description of variants
Each genetic variant in ADVP is described using dbSNP rsID, genomic coordinates (chromosome:basepair), reference, and alternative alleles. Both the information reported in the publication (if available) and those derived from the reference databases such as dbSNP [24] and Ensembl [25] are included in the variant description. Genomic location in ADVP is currently stored using both GRCh37/hg19 and GRCh38/hg38 reference genome builds. As most associations/variants that were reported in the curated publications used GRCh37/hg19 genome build, dbSNP b155 was used to provide GRCh38/hg38 reference coordinates for all the variants based on the reported rsID information.
Description of association records
The primary association information was systematically extracted from each source table and recorded as part of the ADVP association record. The extracted information was further recoded and categorized to ensure consistent record descriptions across publications. For each reported association, we first collected a pre-defined set of data attributes commonly reported by genetic association studies (See “Extracted” columns under Supplementary Table 2). These include variant identifier, genomic position, association p-value and statistics related to the effect size (regression beta coefficients and variance, odds ratios, confidence intervals), population/cohort, association model, sample size, reported effect allele and its frequency in the studied population. Collected association model information includes analysis type/model used (such as linear or logistic regression, inverse-variance weighted fixed-effect meta-analysis), any reported covariates/adjustments (such as gender, age, PCs, and APOE ɛ4 dosage), and any other details if reported by the publication.
In addition to the information directly extracted from publications, each association in ADVP is described with the nine specifically designed harmonized meta-information data fields (see Supplementary Note 2 for more details on each of these fields; field names are denoted with the double quotes below): “Record type”: association record type such as SNP-based and gene-based. “Population”: study population categories such as Caribbean-Hispanic, Asian, and others. “Cohort”: harmonized cohort names. “Sample size”: original sample size. “Subset analyzed”: description of the subset of samples used to perform the association analysis. “Phenotype”: the outcome variable (phenotype/trait) of the association analysis. All the curated and harmonized phenotypes are available in Supplementary Table 5. “Association Type”: association type categories such as disease-risk, eQTL, endophenotype, and others. “Stage”: analysis stage (discovery, validation, replication, or meta- or joint- analysis). Please see (Supplementary Figure 1, Supplementary Note 2) for details on how this information was derived. “Imputation”: imputation panel information.
Note, specifically, “Population”, “Cohort”, and “Phenotype” information are displayed in ADVP using both the original (reported) and the derived, harmonized data fields.
Annotation: Genomic and functional annotation for harmonized variants and associations
All variants and associations in ADVP were systematically annotated with genomic context (closest upstream/downstream genes), genomic element (promoter, UTR, intron, exon, intergenic, repeat), functional impact (variant most severe consequence), and cross-referenced with reference databases (dbSNP [24], GenomicsDB [26], PubMed (https://pubmed.ncbi.nlm.nih.gov), and Ensembl [25]).
ADVP reports the genomic context of each genetic variant via multiple data fields: 1) “Locus” – records the gene name as reported in the publication; 2) “Nearest gene” – contains the name of the gene closest to the variant and the distance to the gene (in base pairs (bps)) in upstream (+) or downstream (–) orientation. The nearest genes are identified using GENCODE v34 [27] protein-coding gene annotations. For each genetic variant co-localized with one or more genes, both EnsemblID [25] and HGNC [28] symbols for the gene(s) are reported. For each ADVP variant, the co-localized genomic element is reported based on the genomic partition information [29, 30] such as exonic, intronic, promoter, intergenic, and other genomic elements.
Quality control steps: Variant and association data verification
Quality control for the variant and association information in ADVP is carried out at multiple levels: We ensured records are not double-counted/re-reported across studies. Each association record in ADVP is uniquely identified by a combination of reported locus/variant/interaction name, cohort/analyzed subset, association model used, phenotype, and association p-value and effect size. We cross-checked recorded positional information (chromosome:basepair), rsID, and allele information against reference databases including dbSNP [24], NIAGADS Alzheimer’s Genomics database [26], and 1000 Genome data [31] to ensure correctness of the variant information. We identified and removed any supporting association records (e.g., records that were directly retrieved from the other resources such as GTEx [32] and used for comparison or to support primary findings).
Population-based analysis of AD associations
To understand the genetic architecture of AD associated loci across populations, we compared their reported effect sizes and frequencies for each locus. Note that the effect size values used were those reported in the publications, and we did not attempt to resolve inconsistent results within the same population. This is due to the following two challenges. First, overlapping cohorts were used across different GWAS studies. Second, there is a lack of available genome-wide summary statistics. Therefore, in this analysis we only investigated the effect directions for the top (most significant) association at each AD-associated loci per population.
To do so, we used all association records from case-control AD GWAS studies with complete information on reported allele, effect size (odds ratio), and allele frequency. We then analyzed the four major populations with the most association records (African American, Asian, Caribbean Hispanic, and Caucasian/Non-Hispanic White). Any association records with p > 0.01 were excluded from the analysis. Then for each AD-associated locus (identified using the nearest gene), we selected the most significant (smallest) p-value as the representative association record for that locus in each population.
To investigate the association results across populations, we used the odds ratios and frequencies of the minor alleles since most of the analyzed publications reported the effect and frequency for minor alleles and did not always report information for both alleles. Note that ADVP itself does not use minor allele-based normalization, rather it stores reported alleles and their respective effect sizes and frequencies. We further categorized the AD-associated loci as population-specific or shared if they were associated with AD in more than one population under study. To investigate population specificity of AD loci, we then compared AD-associated loci (both shared and population-specific) across populations based on their normalized effect sizes (odds ratios for minor alleles) and the minor allele frequency.
Functional analysis of AD associations
To validate and assess the quality of association data stored in ADVP, we performed functional analysis of the ADVP variants. We focused this assessment on the non-eQTL AD/ADRD associations (i.e., variants with unknown functions). Therefore, for this analysis, we excluded all curated ADVP eQTL records reported in publications.
First, we evaluated the significance of overlaps between ADVP variants and active enhancer elements across tissues and cell types. We used Roadmap Epigenomics [33] (ChromHMM-determined [34]) and FANTOM5 [35] enhancer sets across 35 tissue/cell type categories. We then ranked individual tissue/cell types based on the degree and significance (odds ratio, Fisher’s exact test) of enhancer overlaps in each of the analyzed tissues/cell types. Second, to further investigate potential functional roles of ADVP variants, we overlapped ADVP variants with the AMP-AD eQTL records for the three brain regions.
RESULTS
In order to focus on association findings with the highest confidence, we decided to concentrate on large-scale association studies at the genomic level, with the majority of studies included in ADVP (65%) reporting associations reaching genome-wide significance, a gold standard for human genetic discoveries. Furthermore, ADVP collected extensive meta-data, including consortiums and cohorts, which were not available in both the GWAS catalog [23] and AlzGene [36], and are important for relating the results reported across publications. Finally, ADVP provides convenient links for investigators to explore biological significance of the reported variants (e.g., their genomic context, available functional genomic data, or other known associations, if any) via genomic and functional annotations (Fig. 1).
In terms of the number of curated AD-related associations and publications, ADVP provides more comprehensive AD-related association information than the NHGRI-EBI GWAS catalog [23] and AlzGene [36] resource (see Table 1 for main improvements and comparisons). ADVP significantly expands coverage of AD publications by 1) providing information on 125 GWAS publications (compared to, e.g., 69 in GWAS catalog, or 41 in AlzGene), 2) includes association information for both genome-wide significant and suggestive loci and variants, 3) contains 4 times more association records, and 4) 60% more of distinct AD-related variants compared to these resources (Table 1).
Comparison of the contents and main features between ADVP and other genetic databases
*Highest numbers of records are highlighted in bold.
Following the ADVP curation criteria (see “Data collection”, Fig. 1), we first identified and screened 205 AD-related publications from 2009 to January 2020. Out of these, we identified 125 publications with genetic associations reported in the main text tables (N = 225 tables). Genetic variant and association data were then systematically extracted (Section “Data extraction”), harmonized (“Meta-data design”), annotated (“Annotation”), subjected to quality control steps (“Quality control steps”), and stored in ADVP (Fig. 1).
ADVP data summary
The ADVP V1.0 release contains high-quality genome-wide and suggestive AD-related genetic associations extracted from GWAS publications. This includes 6,990 genetic associations for variants, genes, and SNP interactions. Figure 2 shows the distribution of ADVP genetic associations by harmonized meta-information data fields: a) Nine harmonized phenotypes; b) Six harmonized analyses type; c) Population, and d) Cohorts/Consortiums.
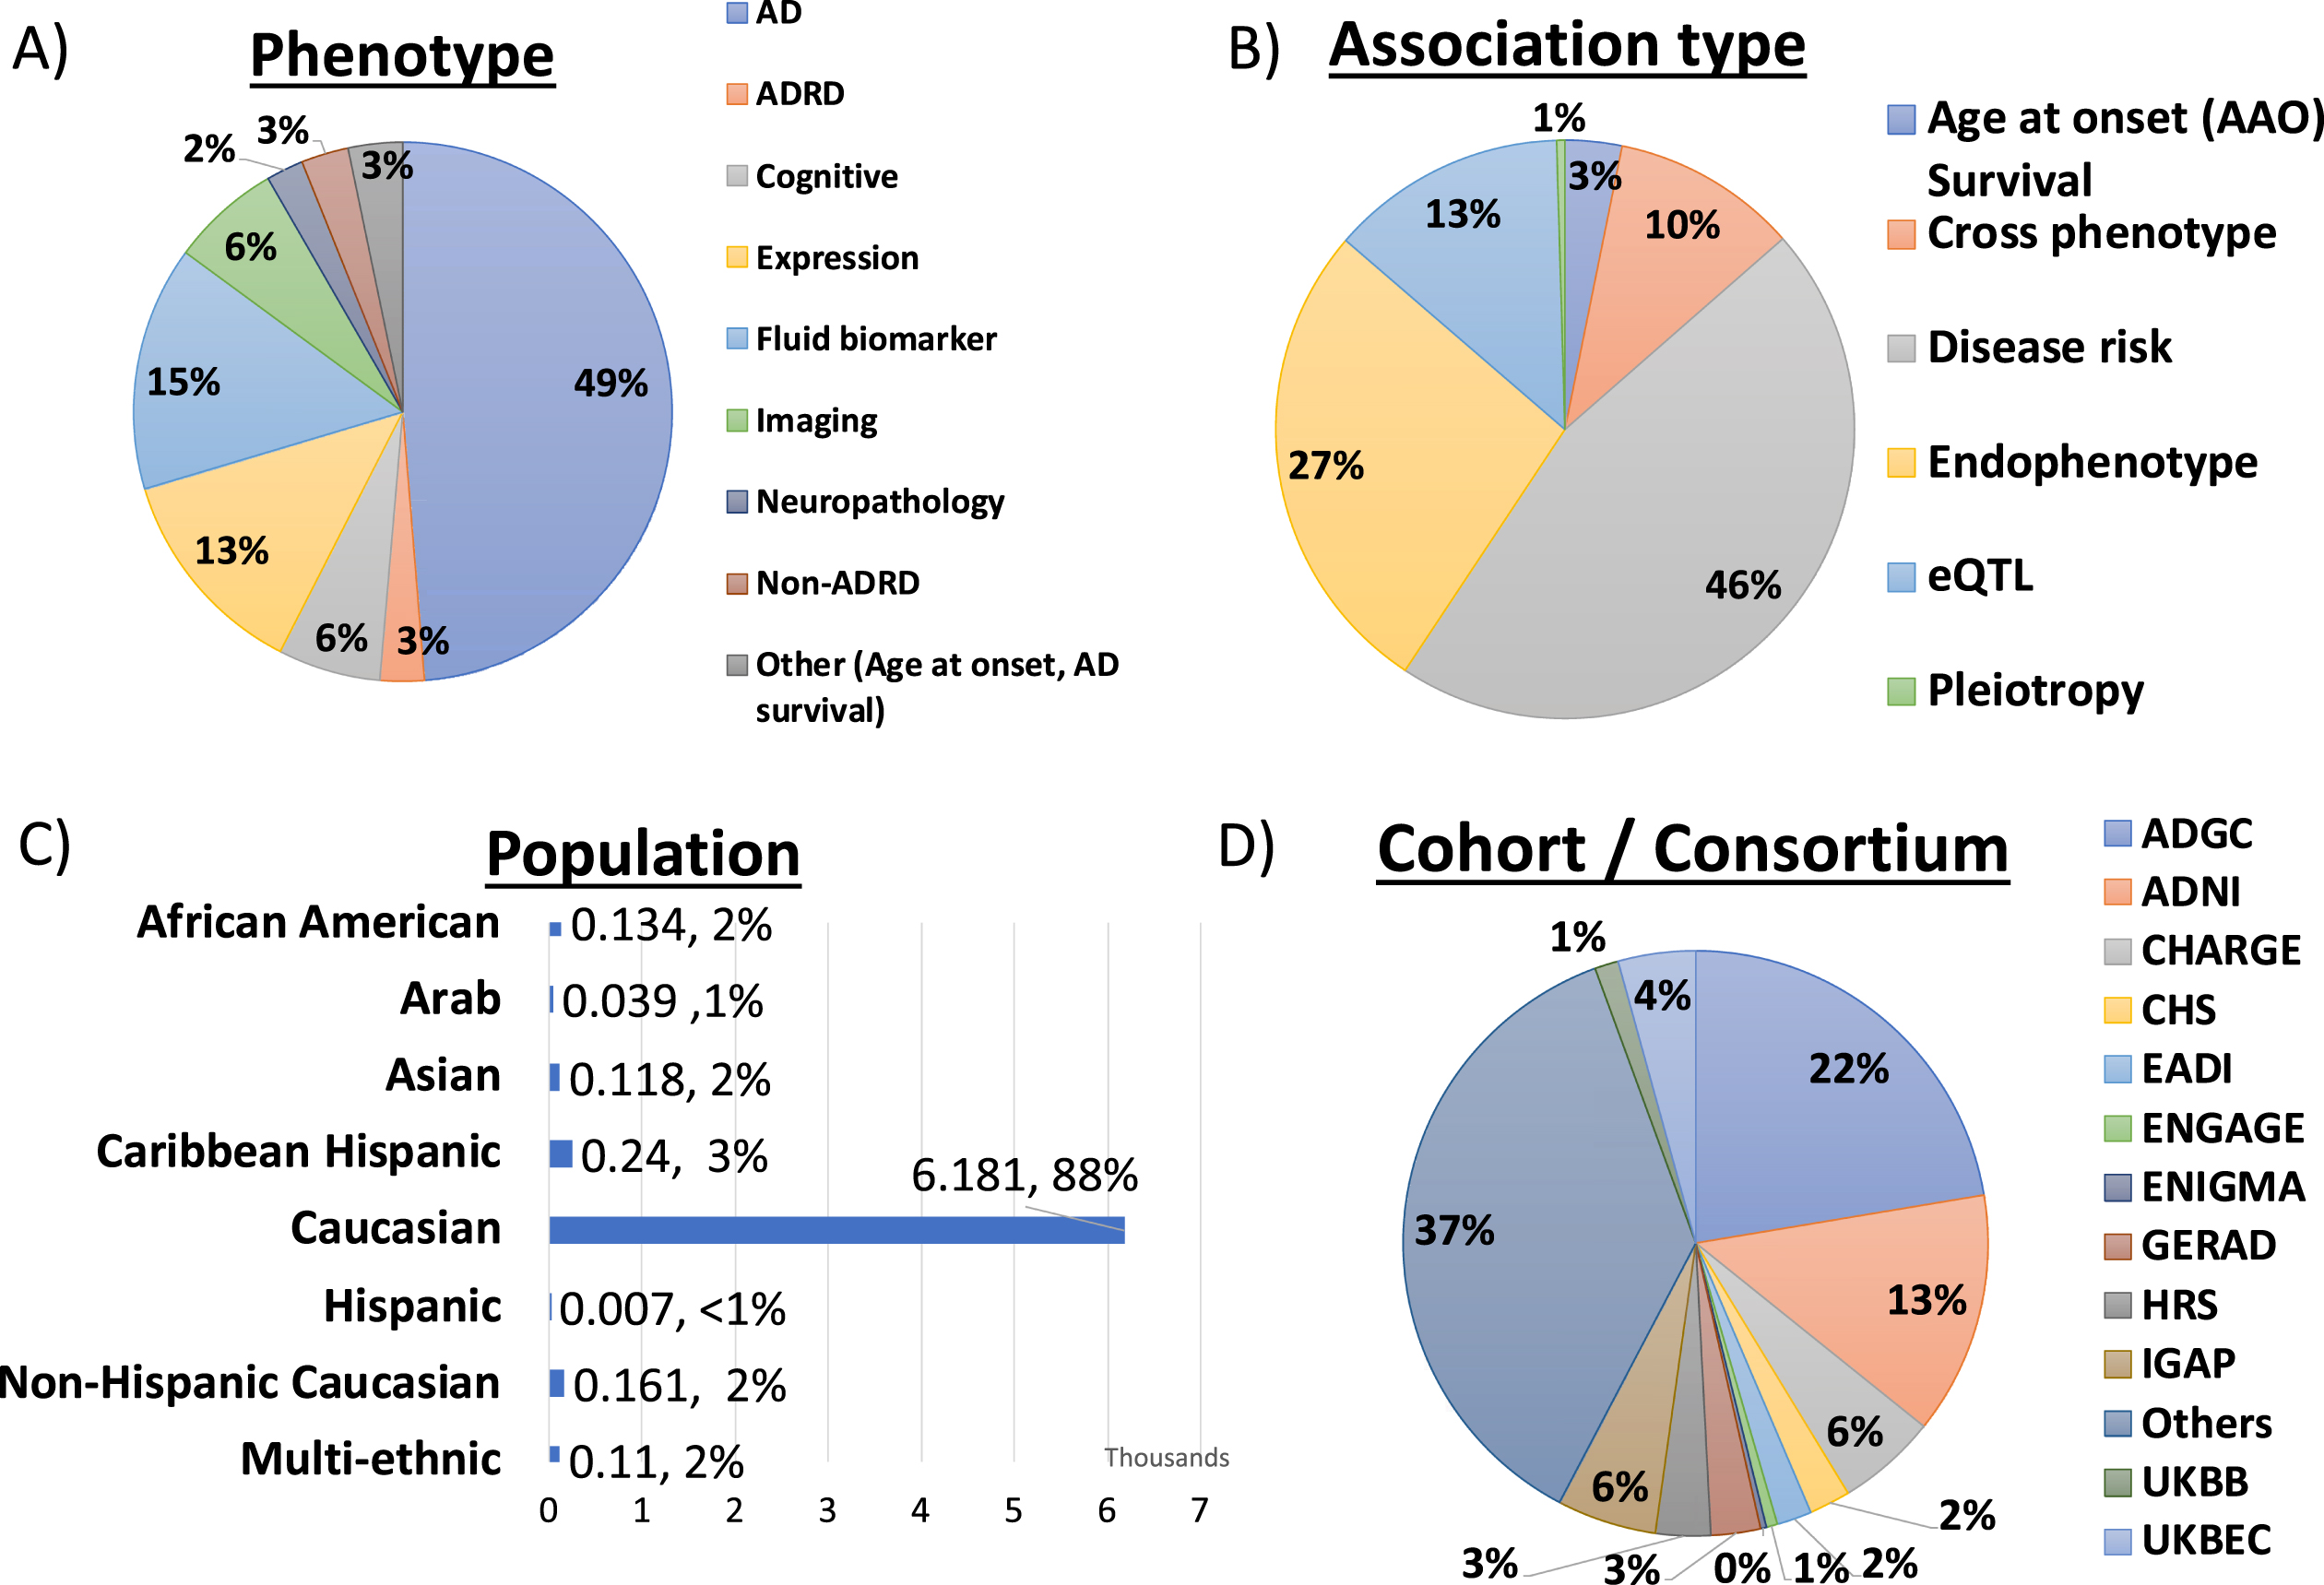
Summary of genetic association records in ADVP (N = 6990) by A) Phenotype, B) Association type, C) Population, and D) Cohort/Consortium.
All ADVP association records are described by our uniquely designed categories: As shown in Fig. 2A, ADVP records are associated with nine different phenotype categories, with roughly half of them related to AD diagnosis. 15% of the records are related to fluid biomarkers, 7% with imaging, and 6% with cognitive measures. With respect to analysis type categories, ADVP includes 3,199 (45.8%) association records reported in disease-risk analyses, of which 1,342 and 934 associations are reported by meta- and joint-analyses, respectively. 1,887 (26.9%) of the records are related to AD endophenotype and 924 (13.2%) eQTL AD associations (Fig. 2B). ADVP is the first to collect AD genetic associations at SNP level (6,437, 92.1%), gene level (320, 4.5%), as well as SNP and gene interactions (233, 3.3%). ADVP records present analyses results from seven populations as well as those from multi-ethnic analyses. ∼88% of the records are for Caucasian (Fig. 2C). Others include African American, Arab, Asian, Caribbean Hispanic, Hispanic, and Non-Hispanic Caucasian. ADVP records span analyses results published by ADGC using over 80 cohorts (Fig. 2D), including ADGC, Alzheimer’s Disease Neuroimaging Initiative (ADNI), Cohorts for Heart and Aging Research in Genomic Epidemiology (CHARGE) Consortium, European Association of Development Research and Training Institutes (EADI), European Network for Genetic and Genomic Epidemiology (ENGAGE) Consortium, Enhancing NeuroImaging Genetics through Meta-Analysis (ENIGMA) Consortium, The International Genomics of Alzheimer’s Project (IGAP), and others. See Supplementary Table 3 for details on cohorts included in ADVP.
Furthermore, ADVP provides annotation information for each genetic association (Section “Annotation”). In summary, all the genetic association records in ADVP were represented by >1,800 unique variants (based on genomic position) and >900 genomic loci. ADVP associations are mostly located in non-coding regions including intronic (52.9%), intergenic (15.2%), and promoter (5.9%) (Fig. 3A). ADVP records are also cross-referenced to NIAGADS Alzheimer’s Genomics database [26]. The functional impact of genetic variants was determined by the ADSP functional annotation pipeline [26 , 38] with customized ranking to generate the most damaging consequence for each variant [38]. Figure 3B shows the functional impact of the genetic variants in ADVP as explained by the VEP (Variant Effect Predictor).
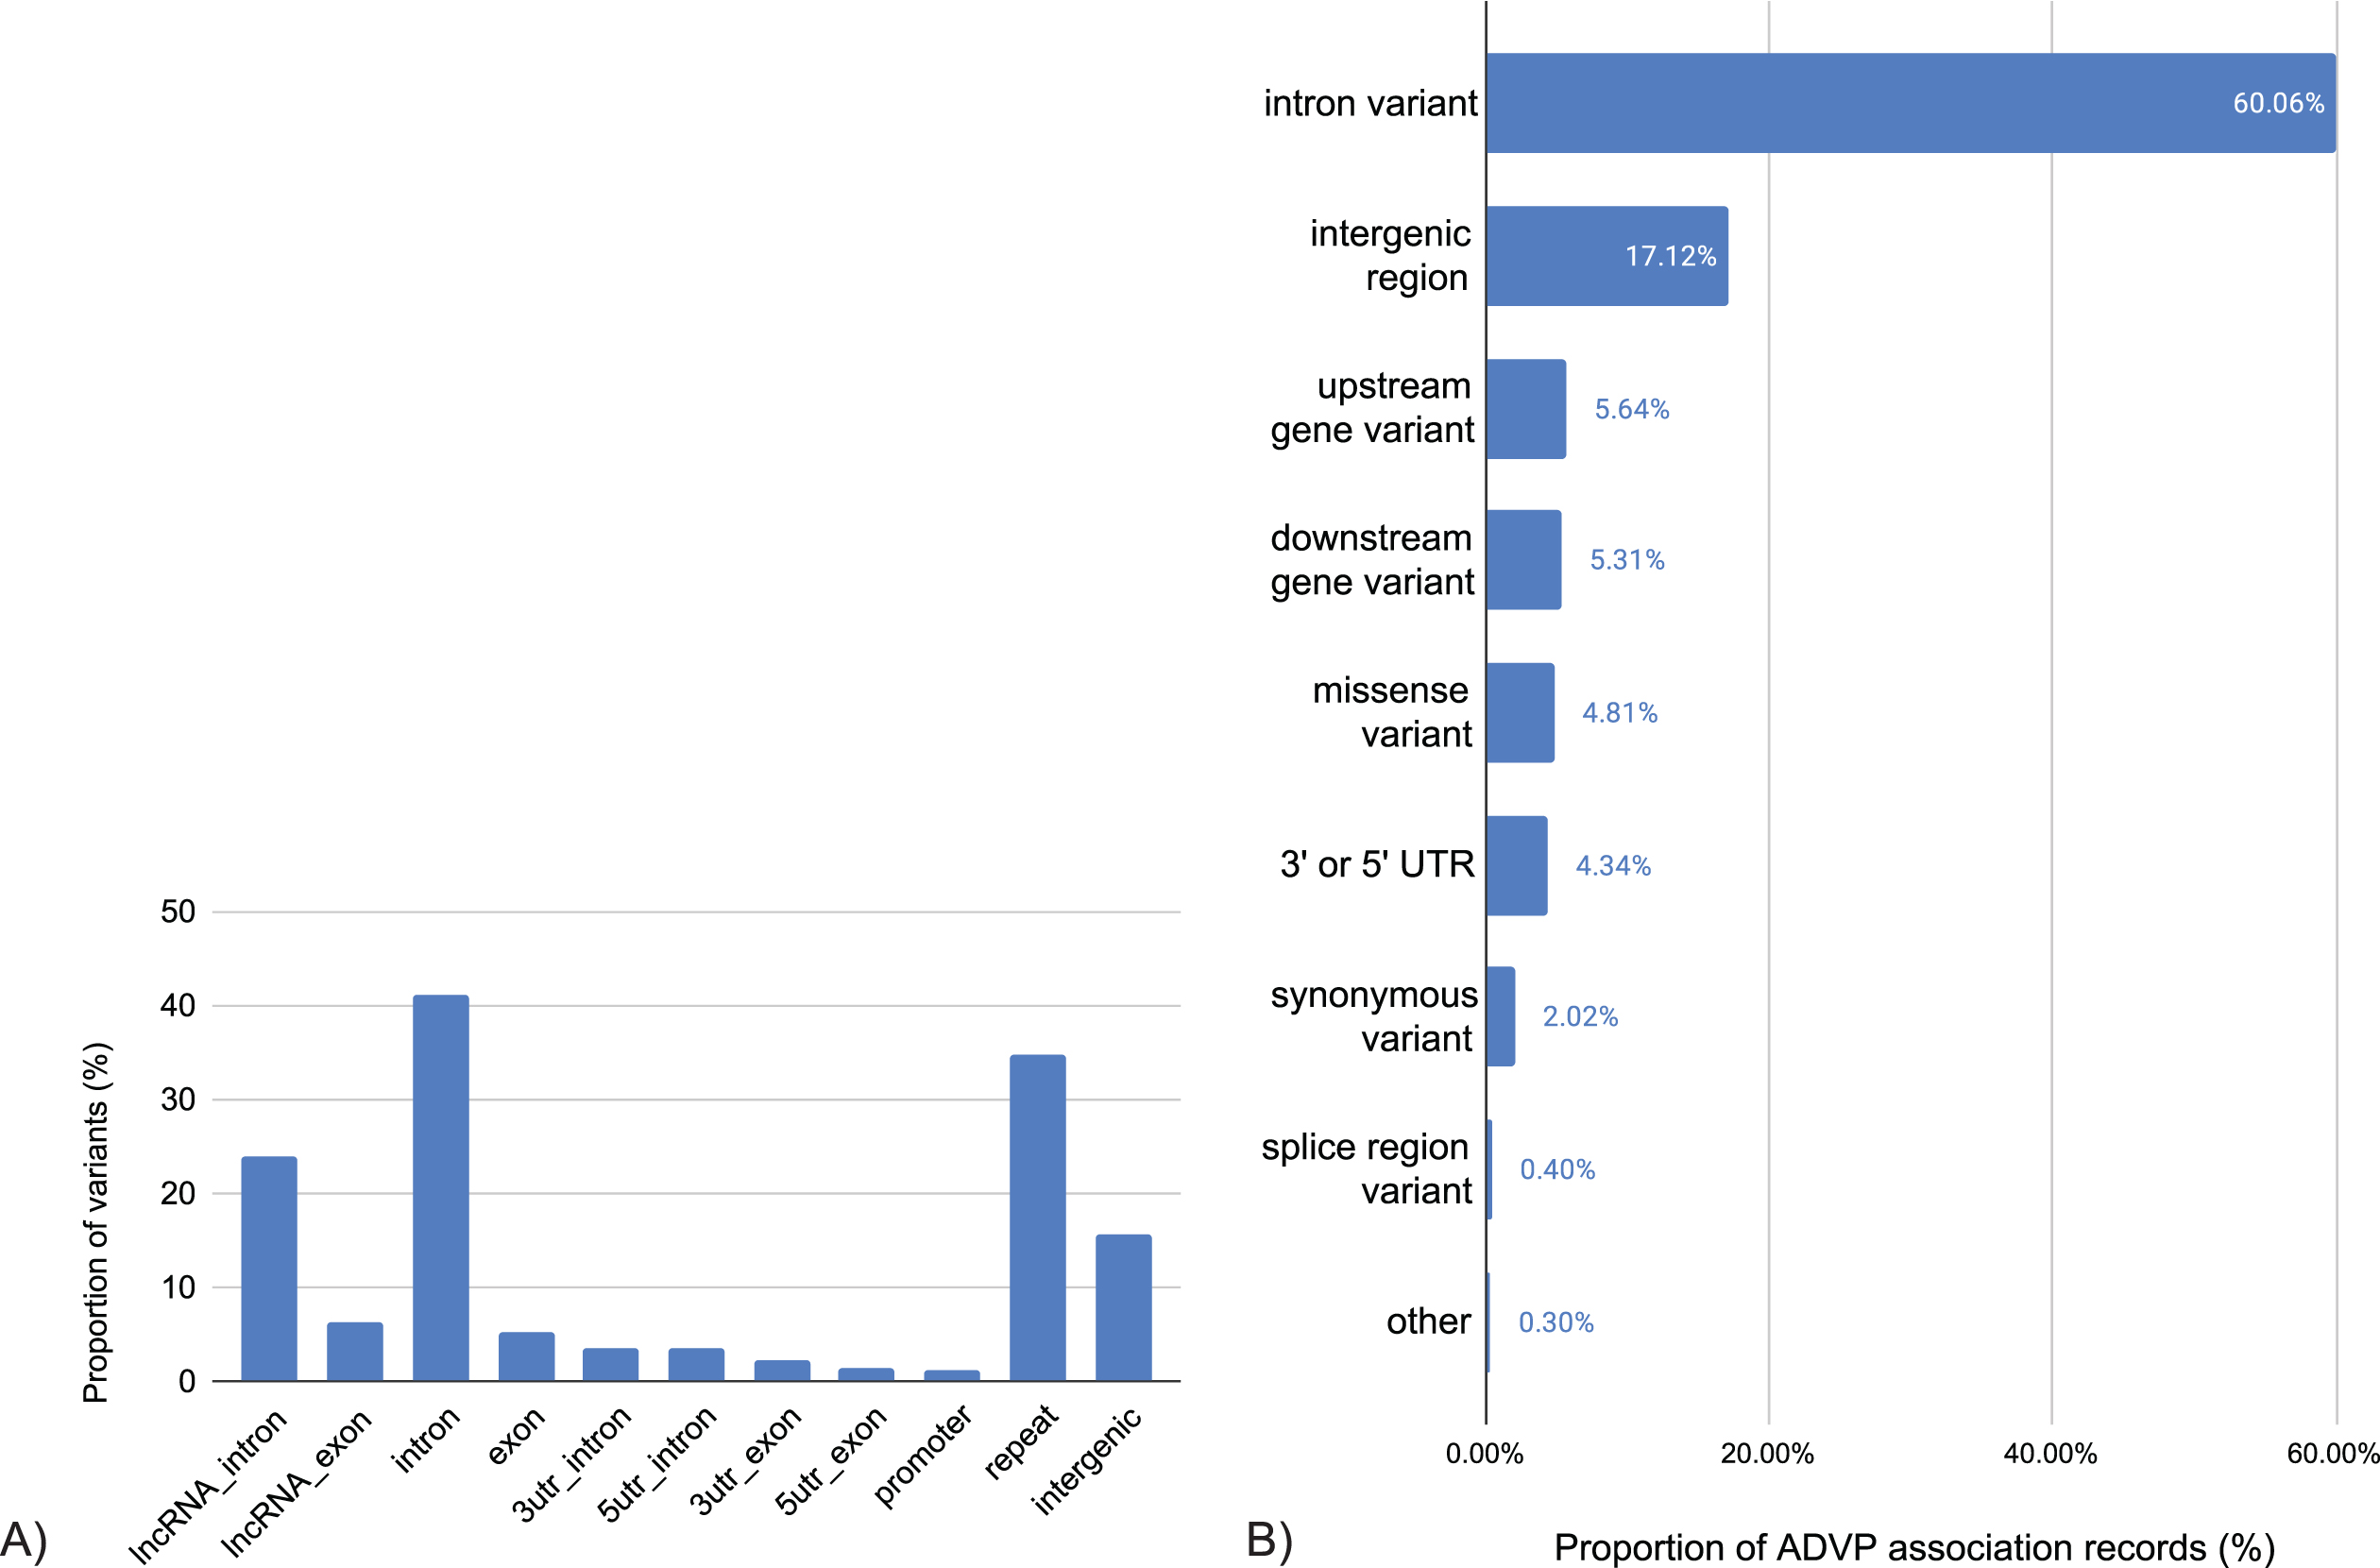
Summary of ADVP association records by genome annotation and most-significant functional consequence. A) Genomic localization of ADVP variants within mRNA, lncRNA, and repeat elements. Shown are proportion (%) of variants in each genomic element category; B) Most-significant predicted variant impact. Impact for variants is determined using ADSP functional annotation pipeline [38, 41]. The consequence for a variant is predicted and ranked based on multiple criteria including genomic location of a variant, genes, transcripts and protein sequences, biological type of transcript, transcript support level and other factors.
ADVP features: search, browse, and visualize
ADVP aims to provide a simple and unified resource to the scientific community, allowing investigators to search and browse AD genetic association information more easily. This is first done by displaying association records using a pre-selected set of most important data fields (Section “Description of association records”). Investigators can further select additional data fields via the column selector (Fig. 4A). All records are annotated with genomic and functional information, allowing investigators to explore various kinds of biological annotations (e.g., dbSNP [24], GenomicsDB [26], Ensembl [25], UCSC Genome browser [39], gnomAD [40], and functional consequences information [38, 41] for variants).
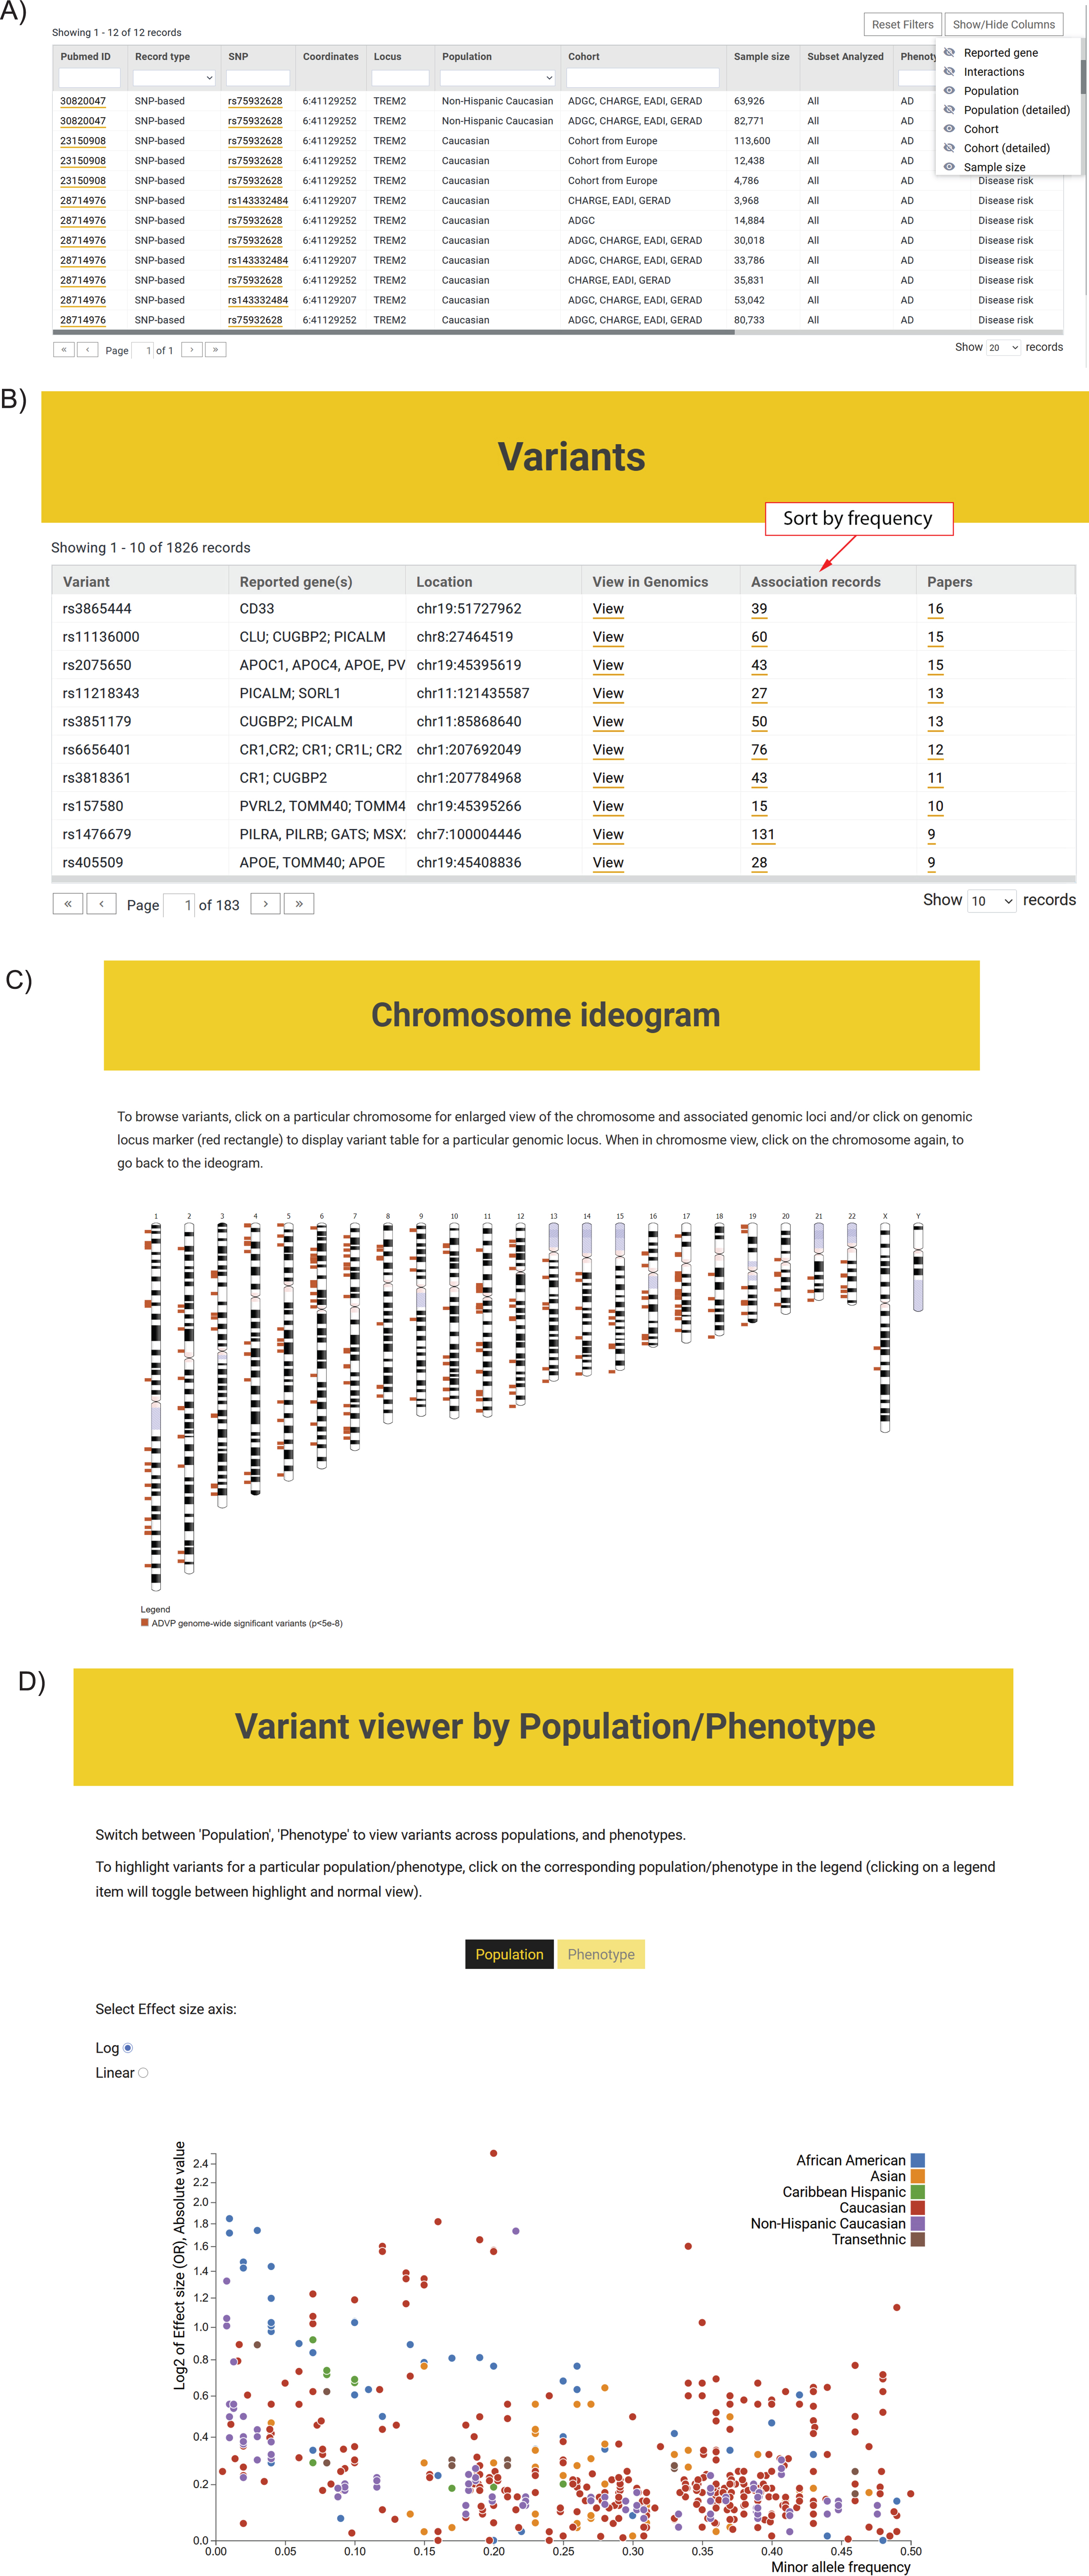
ADVP interface. A) Association records table. The displayed information can be customized via column/field selector and filtered using provided text and data filters; B) Top variants curated in ADVP. Variants are displayed according to the number of reporting publications by default; association records for variants and variant-related publications can be quickly accessed; C) Interactive chromosome ideogram-based view of association data; D) Interactive variant viewer by population and phenotype. Variants are arranged by their effect size (odds ratio; Y-axis) and allele frequency (X-axis) and color-coded by population and phenotype.
The ADVP search interface was designed based on focus group use cases. ADVP provides several ways to search for genetic association records: By publication – investigators can quickly identify and retrieve all association records curated by ADVP for a particular study using PMID, PMCID, first or last author names, year of publication or article title (https://advp.niagads.org/publications). By variant or gene of interest – investigators can search for the variant (https://advp.niagads.org/variants) or gene (https://advp.niagads.org/genes) of interest and browse all the associated ADVP records. Additionally, investigators can easily discover top variants or a gene with most association records or most publications via the summary counts for association records and papers (Fig. 4B, Supplementary Figure 2A). By region of interest – investigators can search and retrieve all genetic associations within the genomic regions of interest (https://advp.niagads.org/search). By integrative genome-wide plots – investigators can navigate the landscape of AD genetics associations using the interactive chromosome ideogram (https://advp.niagads.org/chromosome_ideogram, Fig. 4C) or interactive population/phenotype variant viewer (https://advp.niagads.org/plot, Fig. 4D).
Additionally, for each variant or gene, users can view the biological annotations and their functional evidence (e.g., dbSNP [24], gnomAD [40], UCSC Genome Browser [39], Ensembl [25], GenomicsDB [26]) (Supplementary Figure 2B).
ADVP use cases
ADVP is designed with various use cases in mind. First, ADVP can serve as a point of entry for investigators to explore the AD genetics literature. They can browse through variant and gene records, identify top associated loci for particular populations and phenotypes, or inspect top GWAS associations in the gene or genomic region of interest. Second, investigators can use ADVP to check their association analysis findings. They can further restrict the comparison by focusing on results from a specific population, cohort, or by comparing the strength of associations via p-values or phenotypes. Lastly, investigators can use ADVP to check if their findings have functional support from eQTL or other biological annotations (Supplementary Figure 2B).
Genetic architecture of AD-associated loci across populations
To show the diversity and breadth of ADVP data, we performed population-based analysis of AD associations in ADVP (Section “Population-based analysis of AD associations”). Across four major populations (African American, Asian, Caribbean Hispanic, Caucasian/Non-Hispanic white) with the most association records, 91 loci (Section “Population-based analysis of AD associations”) were identified in any of these 4 populations, whereas 10 of them were found in two or more populations, including BIN1, CD33, PICALM, SORL1, and ABCA7. The majority of AD loci (81/91 = 89%) were population-specific, i.e., found in only one population. This could partially be explained by the underlying genetic differences across populations but could also be contributed by variability in GWAS sample sizes across studies/populations, which could lead to the observed differences in association strength and heterogeneity of loci identified in each population. Across the four populations, the corresponding top SNP (Section “Population-based analysis of AD associations”), effect size and allele frequency on all these 91 loci are available in Supplementary Table 4.
We next explored the effect sizes and allele frequencies of all the AD-associated loci that were found in any of the populations (Fig. 5A; only non-APOE loci from 4 populations are shown), or those that were shared (i.e., found in two or more populations (Fig. 5B). ADVP data (Fig. 5) captures the diversity and population-specificity of the AD-associated loci. On one hand, the shared loci (Fig. 5B) tend to preserve their risk (e.g., ABCA7) or protective (e.g., PICALM [43]) roles. On the other hand, common loci (Fig. 5A) tend to exert smaller effects compared to population-specific loci, yet the effects of the common loci vary across populations (Fig. 5B) (i.e., are population-specific).
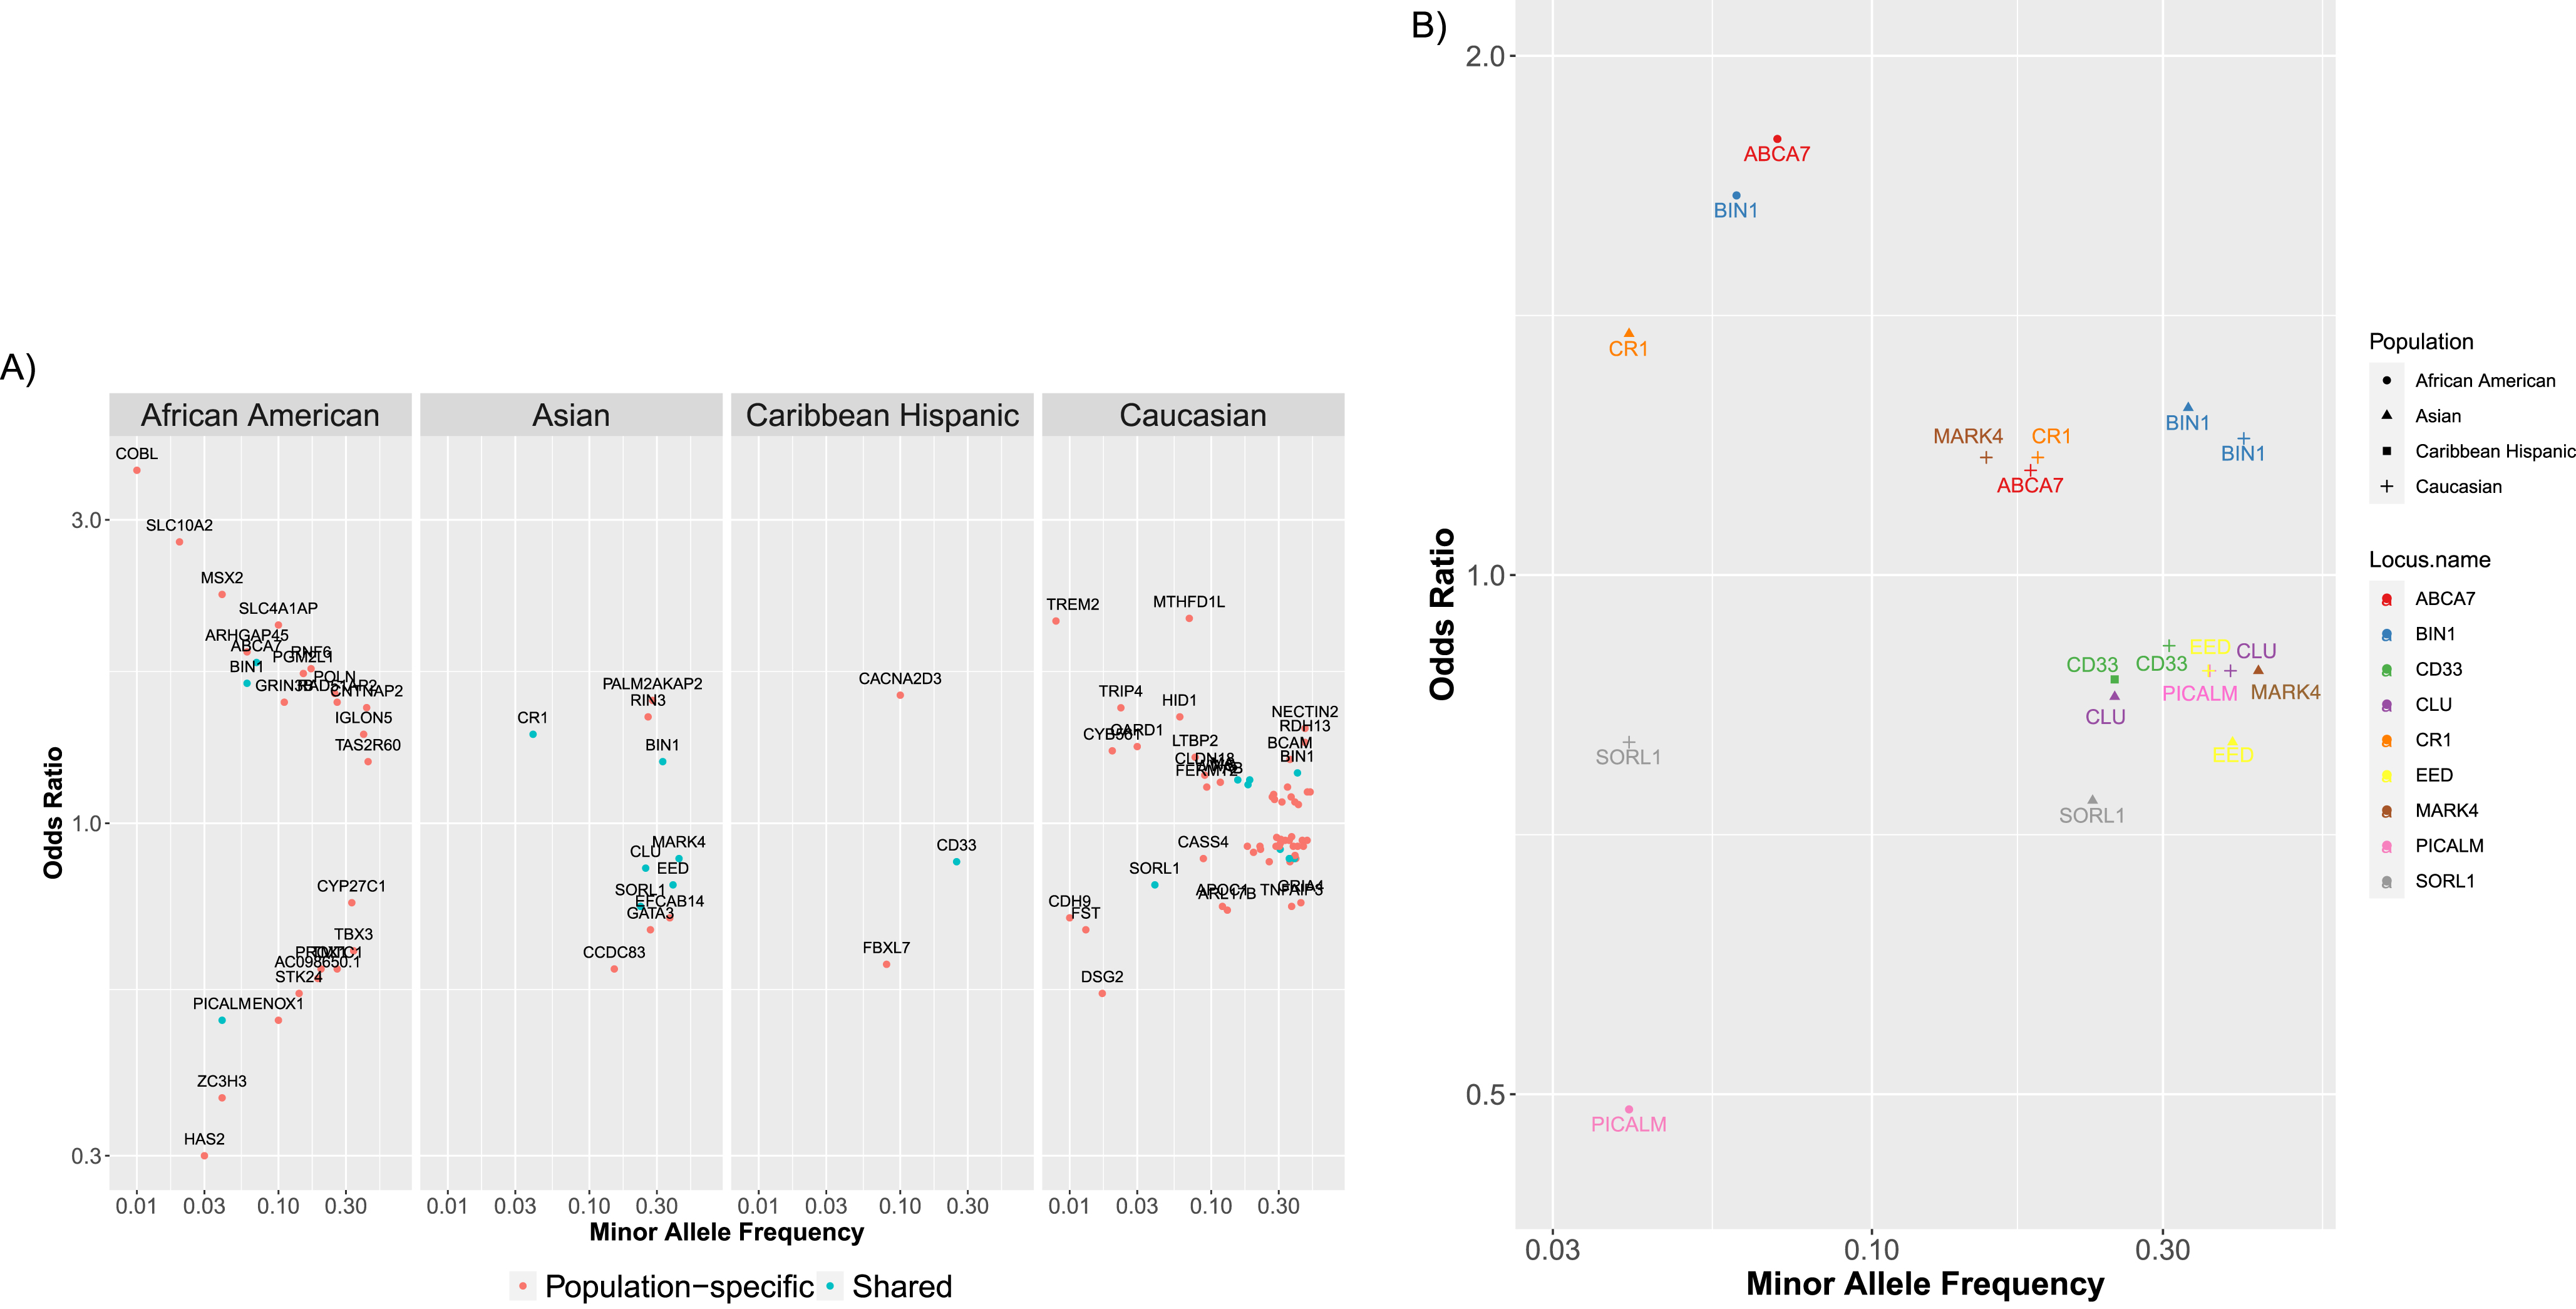
ADVP catalogs AD genetic associations across 8 populations (>80 cohorts). AD-associated (non-APOE) loci for four major populations (African American, Asian, Caribbean Hispanic, Caucasian/Non-Hispanic White) are shown in this figure. For each locus (point), shown are the minor allele frequency and odds ratio for the most significant variant in this locus. A) Shown are loci associated with AD in each of the major populations. Loci that are shared between populations (i.e., found in two or more major populations) are colored cyan (e.g., BIN1 in African-American and Asian); population-specific loci are shown in red (e.g., HAS2 in African-American). B) Shown are the shared AD loci (i.e., loci found in two or more major populations).
Functional analysis of ADVP variants
We next investigated the functional roles of ADVP variants. To do so, we analyzed all ADVP variants that are non-eQTL AD/ADRD associations (i.e., variants with unknown functional roles) in the Caucasian or non-Hispanic White populations. A total of 1,675 ADVP variants met these criteria and were analyzed.
First, to explore potential functional roles for the variants and potential causal genes for these variants, we asked if these variants regulate any genes in any of AMP-AD [44] eQTL datasets [45] obtained from three different brain regions (dorsolateral prefrontal cortex, cerebellum and temporal cortex) (see Materials and Methods and publication [45] for details of how this eQTL data was harmonized and processed).
31% of the analyzed ADVP variants were identified as significant eQTLs in at least one of the three AMP-AD eQTL datasets (FDR < 0.01), and 32% among these were eQTLs in all three brain regions. Altogether, these variants targeted 130 genes (including HLA region), of which 31 were also the nearest genes reported in ADVP. These target genes (e.g., ACE, PVR) were enriched in cell junction organization [46], and acetyltransferase activity (cholinergic system) [47], which recapitulated some of the molecular and cellular mechanisms underlying the pathogenesis of AD.
Second, we analyzed and ranked relevant tissue categories implicated by ADVP variants. To do so, we quantified the significance and enrichment of tissue-specific enhancer overlaps with ADVP variants (Section “Functional analysis of AD associations”). The ADVP variants were enriched in regulatory elements profiled by FANTOM5 and Roadmap Epigenomics (ChromHMM). Top tissues enriched in overlaps between ADVP variants and Roadmap enhancers included blood (OR = 3.7), digestive (OR = 3.5), brain (OR = 2.8), and skeletal (OR = 2.6) tissue categories that are relevant to AD. The overlaps between ADVP variants and enhancers were shown to be enriched in tissues known to be related to AD in various ways [48 –54]. For instance, the implicated immunity-related blood category is in line with recent work highlighting the role of neuroinflammation in AD pathogenesis and etiology [48, 54]. Digestive is related to the gut microbiome, which can be linked to AD behavior in mice [55]. The implicated skeletal category has also been previously linked with brain atrophy in AD [50].
In summary, analyses of genetic associations in ADVP revealed potential functional roles of the AD variants in relevant tissue/cell type context and recapitulated some of the known regulatory mechanisms underlying AD pathogenesis.
DISCUSSION
Here, we present ADVP, a portal to search, browse, and visualize the largest collection of systematically curated, harmonized, and annotated AD-specific genetic variants and associations (∼7,000 genetic associations in the current V1.0 release, February 2021). Among the main distinctive features of ADVP is the uniqueness of reporting harmonized AD variant and association information, integration with the genomic annotation, and functional information as well as extensive cohort/consortium level information.
ADVP uniquely includes associations for individual SNPs, genes, and SNP-SNP and gene-gene interactions and contains curated phenotypes that are not limited to disease risk, but also includes endophenotypes, fluid biomarkers, imaging, neuropathology, and other phenotypes. Moreover, ADVP curates and records AD and ADRD eQTL association findings (Fig. 2B).
In addition to the p-values and effect sizes reported for association records, ADVP puts particular emphasis on harmonizing meta-data curated from the publications. Both the curated and derived columns are stored in the database. These include phenotype, association type, gene symbols, study information (population, cohort, sample size, subset analyzed), and details of analyses (analyses type, imputation) (Fig. 4A). All these columns enable the investigators to interpret, compare, and view these records at different levels: phenotype (Fig. 2A), population (Fig. 2C), cohort (Fig. 2D), to name a few.
All ADVP records are annotated with the genomic context (upstream/downstream genes, and their distances) and their co-localized genomic element (Fig. 3). They are also annotated with genomic annotation and functional genomic information. The structured design of ADVP association data allows systematic integration with other genetic, genomics, and molecular databases.
Population-based and functional analyses of AD associations revealed the genetic architecture of AD-associated loci and points to tissue-specific regulatory mechanisms for AD. However, variability in GWAS sample sizes may contribute to the observed differences in associations and loci across different populations. On the other hand, ADVP will be able to capture more associations as GWAS sample sizes continue to increase. Broadening the ADVP coverage of population groups, as well as expanding functional data types and coverage will provide further insights in complex genetic architecture and biology underlying AD.
Lastly, we made substantial efforts to ensure high-quality of ADVP data contents. First, quality control at multiple levels is performed (Fig. 1, Section “Quality control steps”) to ensure the uniqueness of included genetic associations (no double counting / re-reporting of associations). Besides, variant information in ADVP has been cross-checked against other reference databases such as dbSNP.
ADVP will continuously be updated with regular versioned releases. Supported by NIAGADS [56], the Alzheimer’s human genetics data repository designated by National Institute on Aging, ADVP will add new publications on AD-related GWAS and corresponding associations in an ongoing manner.
In the future, ADVP data collections will consist of a broader range of genetic results: AD whole-genome/whole-exome sequencing analyses AD xQTL associations, where x = protein, methylation, epigenetics marks, or other molecular traits Other genetic variant types, such as insertions/deletions (indel), copy number variations (CNV), or structural variations (SV) as they become available AD related dementias (ADRD) and neurodegenerative disorders
Future ADVP functionality will include further collection and addition of functional genomic evidence supporting genetic associations.
To conclude, ADVP contains the largest collection of systematically curated, harmonized, and annotated literature-derived variants for AD to the best of our knowledge. The extensive and unique features in ADVP allow investigators to easily access, interpret, compare, and visualize the vast collection of AD genetics findings.
Footnotes
ACKNOWLEDGMENTS
The authors thank Brian Kunkle, Elizabeth Blue, Edoardo Marcora, Laura Cantwell, Lauren Kleidermacher, and Mitchell Tang for their contributions at various stages of this work. This work was supported by the National Institute on Aging [U24-AG041689, U54-AG052427, U01-AG032984, U01AG058654]; Biomarkers Across Neurodegenerative Diseases (BAND 3) (award number 18062), co-funded by Michael J Fox Foundation, Alzheimer’s Association, Alzheimer’s Research UK and the Weston Brain institute.
DATA AND CODE AVAILABILITY
All AD variant and association information is available through the ADVP website (https://advp.niagads.org). The code for processing and analysis of variant and association data is available at ![]() .
.