
Abstract
The locus coeruleus (LC), a tiny nucleus in the brainstem and the principal site of noradrenaline synthesis, has a major role in regulating autonomic function, arousal, attention, and neuroinflammation. LC dysfunction has been linked to a range of disorders; however particular interest is given to the role it plays in Alzheimer’s disease (AD). The LC undergoes significant neuronal loss in AD, thought to occur early in the disease process. While neuronal loss in the LC has also been suggested to occur in aging, this relationship is less clear as the findings have been contradictory. LC density has been suggested to be indicative of cognitive reserve and the evidence for these claims will be discussed. Recent imaging techniques allowing visualization of the LC in vivo using neuromelanin-sensitive MRI are developing our understanding of the role of LC in aging and AD. Tau pathology within the LC is evident at an early age in most individuals; however, the relationship between tau accumulation and neuronal loss and why some individuals then develop AD is not understood. Neuromelanin pigment accumulates within LC cells with age and is proposed to be toxic and inflammatory when released into the extracellular environment. This review will explore our current knowledge of the LC changes in both aging and AD from postmortem, imaging, and experimental studies. We will discuss the reasons behind the susceptibility of the LC to neuronal loss, with a focus on the role of extracellular neuromelanin and neuroinflammation caused by the dysfunction of the LC-noradrenaline pathway.
INTRODUCTION
The locus coeruleus (LC), a small nucleus situated in the posterior area of the rostral area of the rostral pons of the brainstem in the lateral floor of the fourth ventricle, is the principal site for brain synthesis of noradrenaline (NA). The LC has widespread efferents to the cerebral cortex, hippocampus, amygdala, thalamus, brainstem, and spinal cord. It also receives afferents from brain areas including the frontal cortex and lateral hypothalamus. The LC is known to have a number of psychological and physiological roles with the rostral and middle LC regulating the sleep wake cycle [1] attention [2], memory [3], mood and behavior [4], and the caudal LC regulating cardiovascular, respiratory, and gastrointestinal activities [5]. Growing evidence suggests there are changes in the locus coeruleus in aging and Alzheimer’s disease (AD). The aim of the current work was to review evidence from postmortem, imaging, and experimental studies with regard to these changes.
LC ANATOMY AND FUNCTION
The LC is a rod-shaped cluster of noradrenergic cells located bilaterally in the brainstem. In the healthy human brain, it is between 12 mm and 17 mm long and approximately 2.5 mm wide [6, 7]. LC cells start at the level of the inferior colliculi and extend down the dorsal pons, alongside the lateral floor of the fourth ventricle. Cells are most concentrated in the lower middle aspect of the LC which incidentally appears thinner as the neurons form a more compact cylindrical shape [6–8]. The estimated number of LC cells on each side varies hugely between studies and individuals. Studies reported between 22,000 to 52,000 pigmented neurons with an average of 19,000 to 35,000 neurons when taking in account both hemispheres [9–11]. This variability could partly be explained by the marker(s) used to identify the pigmented neurons and the number of brains investigated. One study looking at 63 brains, estimated the total number of neurons in the LC to be between 6,674 to 137,000 with an average of 48,900 neurons per hemisphere, with pigmented neurons representing 46%of the total of mid and large neurons of the LC cell population [12]. No asymmetries between the left LC and right LC [6–8, 14] and no gender differences [11] have been reported.
Most cells of the LC are large multipolar, pigmented cells with round or oval somas between 35μm and 45μm, with multiple, long dendrites and axons that join nearby noradrenergic fibers [6, 8]. Animal studies have shown that the LC projects to almost every brain region and spinal cord [15, 16]. The LC can therefore innervate the entire brain with NA which binds to G-coupled α1-, α2-, or β-adrenoreceptors found on neuronal cells including LC neurons, as well as microglia, astrocytes, and endothelial cells of blood vessels [17]. The long reaching unmyelinated projections of the LC can communicate both monosynaptically (i.e., neuron to neuron) or by volume transmission, in which neurotransmitters are also released from varicosities along the axon. Many of these varicosities do not make contact with other synapses so NA diffuses into the surrounding space where it is able to act on large volumes of neurons, glial cells and into the circulating blood [18]. Additionally, the LC can mediate the speed with which it releases NA with two distinct modes of firing, phasic (short-burst) transmission or tonic (steady release) transmission.
NA is the main neurotransmitter modulating sympathetic nervous system activity (Fig. 1) to prepare the body for ‘fight or flight’ in response to danger [19] and plays a major part in the regulation of wakefulness [20, 21], being virtually silent during rapid eye movement sleep [22, 23]. Additionally the LC-NA system has a complex role in regulating arousal [19, 24] as well as affecting memory and attention [22, 25–27]. The LC also controls pupil dilation, with pupil diameter being an indicator for level of arousal [28], task engagement [2, 29], and performance [30, 31]. Animal studies show the projections from the LC are spatially organized to some extent: rostral and middle areas of the LC regulate attention and circadian rhythms through projections to the cortex and hippocampus whereas the caudal part of the LC regulates respiratory, cardiovascular, and gastrointestinal activities [27, 32–36].
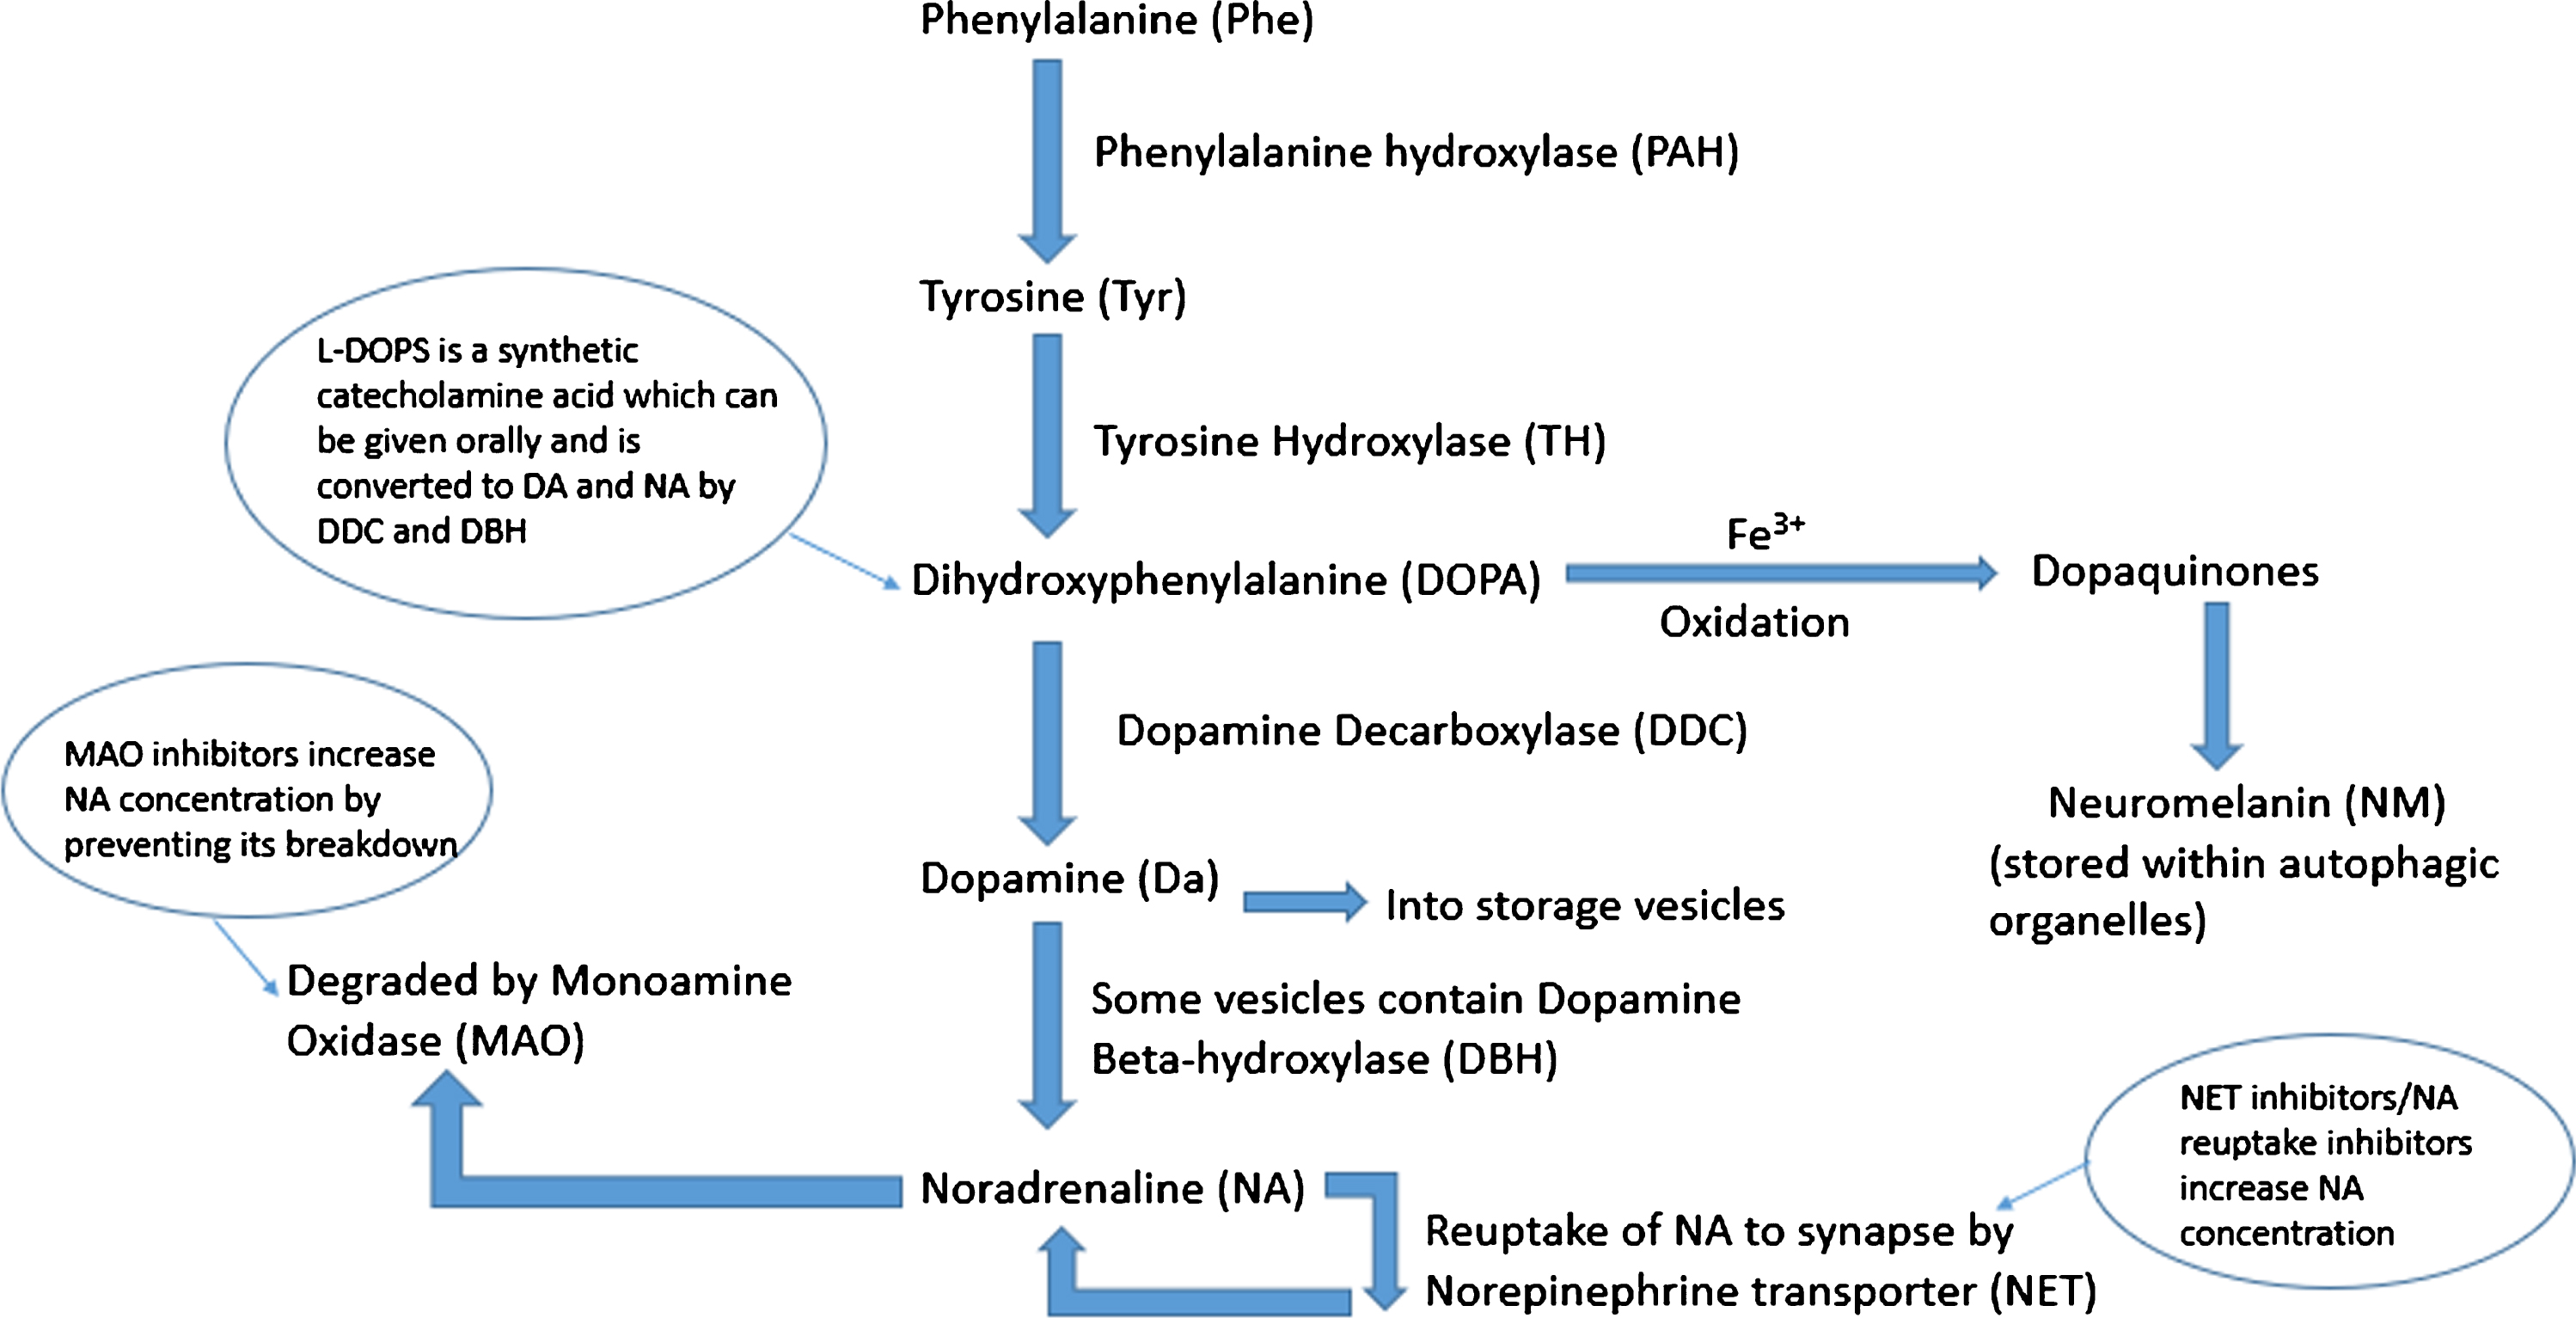
Schematic of noradrenaline synthesis in the locus coeruleus. Phenylalanine is converted to tyrosine (Tyr) by phenylalanine hydroxylase (PAH). This is then converted to dihydroxyphenylalanine (DOPA) by tyrosine hydroxylase (TH) which is in turn converted to dopamine (DA) by the enzyme dopamine decarboxylase (DDC). Dopamine is taken up into storage vesicles, some of which contain dopamine beta-hydroxylase (DBH) which converts dopamine to noradrenaline (NA). Noradrenaline is either taken back up to the synapse by noradrenaline transporter (NET) or degraded by monoamine oxidase (MAO). Excess cytosolic dopamine and noradrenaline is oxidized by iron catalysts into dopaquinones which are stored as neuromelanin contained within autophagic organelles.
Finally, NA has a role in regulating neuroinflammation in the brain. Microglia which make up 10–15%of all cells in the brain, are the resident immune cells of the central nervous system (CNS), surveying the brain parenchyma for damage or pathogens via their multiple, highly motile processes [37, 38]. Through their many receptors they can adopt a range of phenotypes depending on the signals they receive [39]. Microglia mainly express β2 adrenoreceptors [40] and NA has an anti-inflammatory effect on these glial cells, including the suppression of proinflammatory cytokines such as interleukin-1 (IL-1), IL-6, tumor necrosis factor alpha (TNF-α), and inflammatory nitric oxide (iNOS) [41–43]. NA has also been found to affect the motility of microglial processes [40] as well as to reduce oxidative stress [44].
LC neurons release other neuropeptides including galanin and neuropeptide Y and present receptors for a wide range of neurotransmitters including ATP, orexin, galanin, neuropeptide Y, and nicotinic acetylcholine receptors [45, 46]. The co-release of these peptides with NA may alter its effects, aiding the LC’s functional diversity. Additionally, the wide range of inputs to the LC may affect its firing patterns again modulating the release of NA. Therefore although the LC may be small, its complexity can account for its ability to control many functions [5].
Understandably LC dysfunction has been connected to a range of disorders including REM sleep disorder, schizophrenia, anxiety, and depression [47, 48]. However, this review will explore LC dysfunction in neurodegenerative disorders, in particular in AD of which the main risk factor is aging, focusing on human postmortem and brain imaging studies.
LC NEURONAL CHANGES IN AGING
While some postmortem studies report a decrease in LC neuronal number with old age [6, 49–51], which is more prominent in the rostral area of the LC [49, 52], many of these studies used biased quantification methods, employ small sample sizes [6], or only find a significant decrease in cell count when comparing very old brains, i.e., those aged over 90 years who often have significantly lower brain weights in general, to those under the age of 60 years [6, 49]. Other unbiased stereological methods studies or those that have ensured that all cases included in the analysis were pathologically normal at death, have not observed any age-related decrease in neuronal number [7, 53]. Notably stereological studies of the substantia nigra (SN) also find no evidence of loss in normal aging [54, 55].
In a study of 165 adults over the age of 55 who were assessed cognitively annually until death, slower cognitive decline was associated with increased LC neuronal density [56]. Another smaller study (n = 21) also found neuronal loss to correlate with cognitive decline in a number of tests of memory, perceptual speed, and visuospatial ability [11]. This again may count for some of the variation in cell number seen in old age; however, further research is needed as cognitive ability has rarely been compared to neuronal number and the relationship between LC integrity and cognitive reserve is not understood.
NEUROPATHOLOGICAL CHANGES IN THE HUMAN LC IN ALZHEIMER’S DISEASE
AD is a worldwide health problem, with a prevalence expected to increase globally from 50 million in 2019 to 152 million in 2050 (Dementia Factsheet September 2019, World Health Organization). Cognitive decline in AD is associated with progressive neuronal and synaptic loss which is evident both on MRI scans and at postmortem as global cerebral atrophy, most prominent in the hippocampus and temporal lobe [57]. The neuropathology of AD is characterized by an abnormal build-up of extracellular amyloid-β (Aβ) peptide as neuritic plaques [58] accompanied by intracellular hyperphosphorylated (p)-tau fibrils which accumulate as neurofibrillary tangles (NFTs) within neurons [59]. Changes in microglial morphology and signaling is also evident in AD contributing to the pathology [60–62]. Microglia are observed clustering around Aβ plaques in both humans [63, 64] and animal models [58], but they do not phagocytose the plaques as they do in cell cultures [65, 66]. Initially microglia were thought to exhibit an amoeboid phenotype with observable inclusions suggesting they were phagocytic and may be beneficial in controlling the growth of the plaque [67, 68]. Subsequently microglia have been observed to display a range of inflammatory phenotypes based on their microenvironment [62] suggesting a more direct role in neurodegeneration. In AD, microglial morphological changes are accompanied by secretion of pro-inflammatory and anti-inflammatory cytokines [69] such as TGF-β, IL-1, IL-6, IL-10, and TNF-α which contribute to synapse and neuron loss and accelerate disease progression [70]. In addition, a role for microglia in the onset of the disease has been reinforced by genome-wide association studies that have identified polymorphisms in genes related to inflammation and innate immunity to be associated with an increased risk of developing late onset AD [71–76]. However, a link between LC dysfunction and microglia in human AD remains to be confirmed.
The LC undergoes significant neuronal loss in AD with postmortem studies showing as much as an 80%reduction in cell number in people with AD compared to age-matched controls [50, 77–81] (Fig. 2). In contrast, there is no evidence of cell loss in the SN in AD [82] and cell loss in the LC is greater than that of the nucleus basalis [83] and correlates both with the duration and severity of AD [78, 84] and with the number of NFTs seen in the cingulate and temporal cortex [84], and is evident at the prodromal or mild cognitive impairment (MCI) stage of the disease [85]. Cell loss is more prominent in the rostral [6, 12] and middle portions of the LC [86, 87] with the caudal neurons remaining relatively intact mirroring the pattern of cell loss reported in typical aging. In AD, abnormalities in the appearance of LC cells, such as having swollen somata or shorter and fewer dendrites [88], as well as reductions in nucleolar volume and cytoplasmic RNA [81] have also been reported.
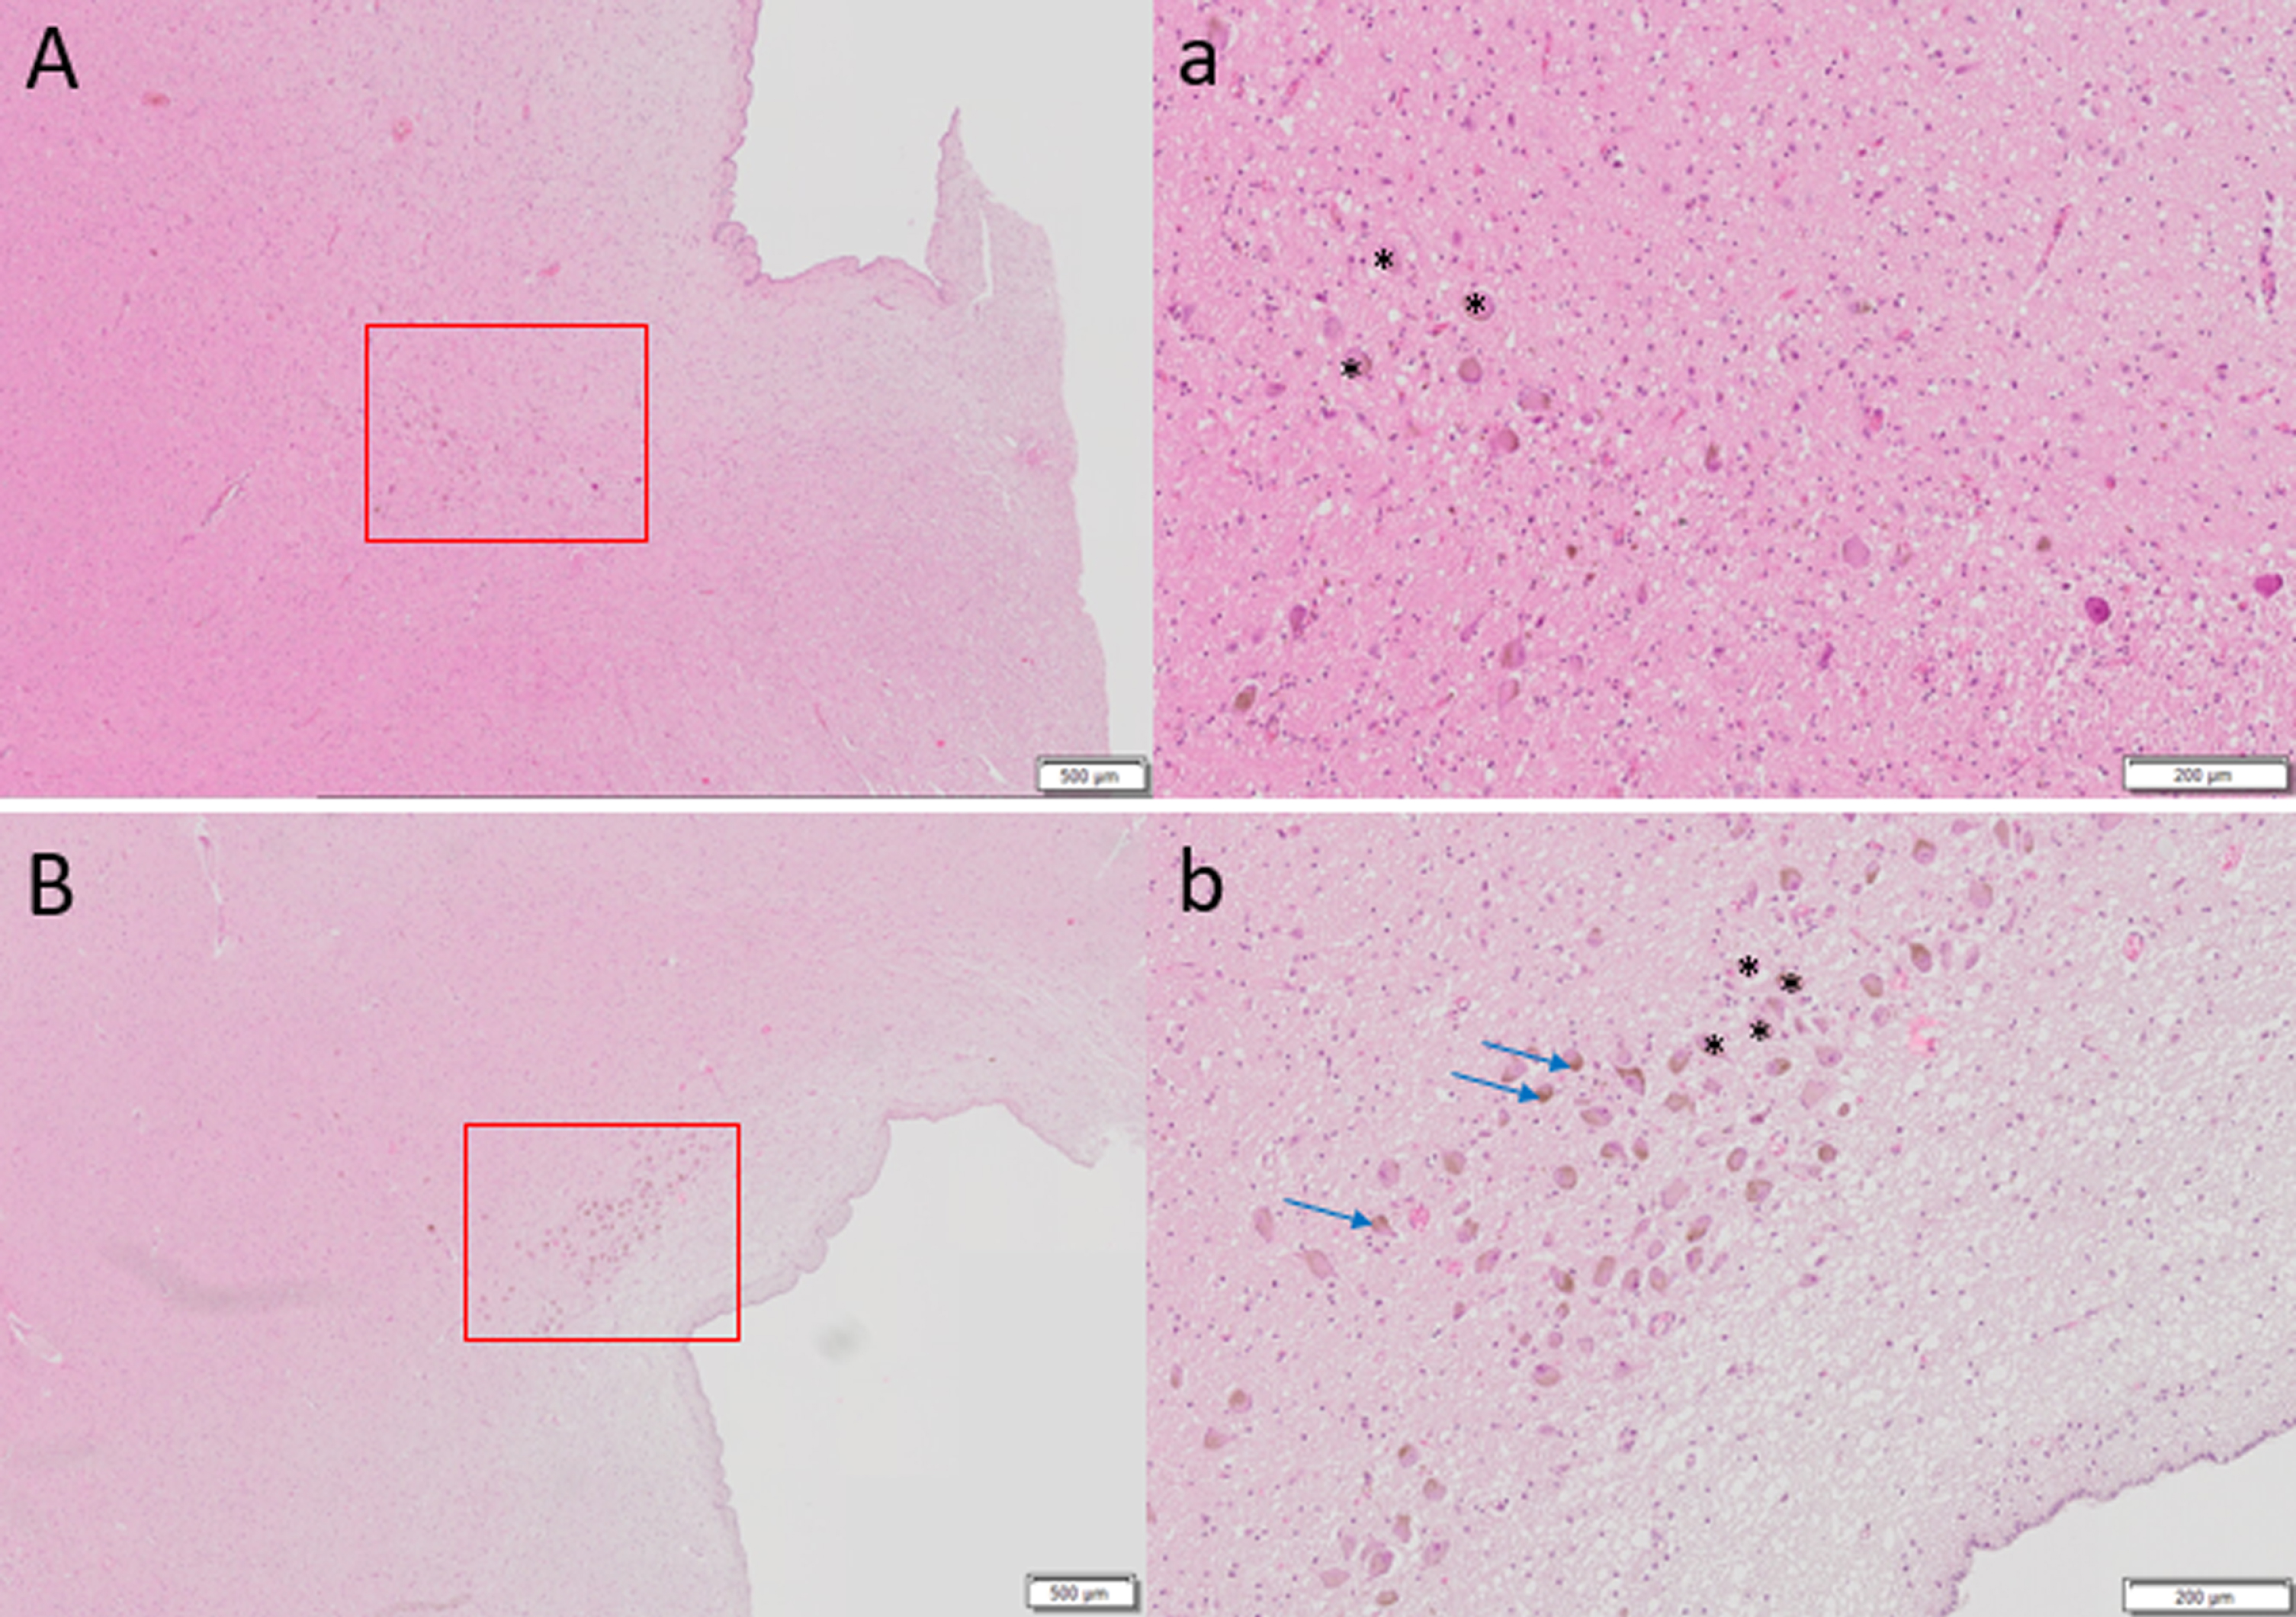
Hematoxylin and eosin staining of 6μm thick axial sections of pons to show locus coeruleus cells (denoted by *) of A) 87-year-old female with Alzheimer’s disease diagnosis at death, Braak stage 6 compared to control brain of B) 86-year-old female, Braak stage I. Far fewer LC cells are observed in A. Brown pigmented neuromelanin granules can be seen (blue arrows). Scale bar A, B = 500μm, scale bar a, b = 200μm.
TAU ACCUMULATION AND SELECTIVE VULNERABILITY OF THE LC NEURONS
The accumulation of NFTs in AD follows a progressive, predictable pattern throughout the disease process with regards to their severity and location in the cortex, known as Braak stages I-VI. At stage I, NFTs are observed in the transentorhinal cortex (parahippocampal gyrus); at stage II, NFTs are found in the entorhinal cortex; hippocampal coverage occurs at stage III which then additionally affects the basal, frontal and insular cortex by stages IV and V; by stage VI, the primary sensory and motor areas become affected [89]. Cognitive symptoms are not experienced until stage III or IV where the NFTs affect the hippocampus and therefore tau pathology occurs prior to symptom onset. Immunostaining human tissue with the antibody AT8 to visualize hyperphosphorylated tau (p-tau), has demonstrated that abnormal tau accumulates in the LC prior to NFTs being visualized in the transentorhinal cortex (Braak stage I), at an early age, i.e., before 30 years, decades before disease onset [90]. The LC seems to be particularly vulnerable to early tau pathology and stages a, b, and c have been added to the Braak staging system to describe the accumulation of p-tau in the LC and other subcortical nuclei preceding stages I-IV. This occurs both before cognitive impairment and the onset of LC cell loss which is not significant until Braak stage III [91].
The LC projects to the transentorhinal and entorhinal cortex, which are the first cortical regions to see high numbers of NFTs and undergo extensive neuronal loss during AD [57]. One theory posits that tau pathology originates in the LC and brainstem nuclei before spreading through the cortex via the LC’s diffuse projections because p-tau has a chronological, predictable topographic pattern. The prion hypothesis suggests abnormal tau proteins act as seeds which cause nearby normal tau to become hyperphosphorylated, therefore causing a spreading of misfolded tau protein throughout the brain. As the LC cells innervate the cortex, they could potentially enable the spread of pathology trans-synaptically from neuron to neuron [91]. However, the mechanisms behind the release of tau across the synapse are still not known. Though it is not yet possible to study p-tau pathology within the LC in humans in vivo or to measure its functional consequences, the development of tau PET ligands may mean this can be explored in the future.
LC neuronal loss correlates with tau accumulation, with one human study demonstrating an 8.4%decrease in LC volume with each increase in Braak stage [12]. More importantly both MCI and AD patients show more tau tangles in the LC (as well as the other brainstem nuclei), compared to those without cognitive impairment [92, 93]. The amount of tau pathology in the LC correlates with dementia severity [87] and continues to accumulate throughout the disease process [94]. However, what is not understood is why there is such a delay from p-tau first being observed in the LC to LC cell death occurring decades later. Does a threshold of p-tau accumulation have to be met in order to trigger cell death or is there another mechanism at play?
Another question that remains unanswered is why the LC is so vulnerable to cell loss and to tau accumulation. One suggestion known as the toxicant hypothesis [95] is that toxicants more readily enter the LC due to the high exposure of the LC neurons to the capillaries of the CNS (more so than any other neuronal network) and to the close proximity to circulating cerebrospinal fluid (CSF) in the 4th ventricle. One study looked at uptake of metallic mercury in someone who injected himself with mercury before committing suicide and detected heavy concentrations of mercury in only two regions, LC neurons and corticomotor neurons, with over 70%of LC neurons being affected [96]. Additionally, it is suggested that the nuclei’s poorly myelinated neurons make them less resistant to oxidative stress and therefore more susceptible to AD pathology [57].
DYSFUNCTION OF LC-NA SYSTEM IN AD
It follows that with the degeneration of LC neurons there will be a corresponding effect on the concentration of NA in the brain, which is predictably lower in those with AD compared to controls [97], particularly in the temporal lobes [80, 98–101], and shows direct correlation with LC cell count [84]. One positron emission tomography (PET) study on human brain slices showed reductions in the noradrenaline transporter ligand (S,S)-[18F]FMeER-D(2) in the LC and the thalamus in ten AD brains compared to ten controls which correlated with increases in Braak stage [102]. Reduction in NA in blood plasma has even been observed in AD patients and correlates with lower cognitive scores and higher Aβ1–42 CSF levels [103]. Although lower NA levels have not always been observed [104], the reduction in NA in the temporal cortex was reported in vivo from five individuals with AD that underwent a diagnostic craniotomy [105]. It is worth noting that despite the neuronal loss and the lower NA expression, an increased activity of the remaining noradrenergic neurons was reported in AD patients, as visualized by the higher expression of the NA metabolite, -methoxy-4-hydroxyphenylglycol (MHPG) [105, 106]. This was interpreted as a compensatory mechanism to the NA loss. The apparent discrepancies in the assessment of NA level in AD patients, e.g., no change or decrease, might be linked to the severity of the disease and/or the duration of dementia at the time of the analysis. Indeed, in the early stages of the disease, a compensatory mechanism might be able to take place, while in the late stages of the disease, the number of remaining neurons does not compensate for the loss.
Nevertheless, LC cell loss and abnormalities in noradrenergic innervation of the brain may explain the behavioral and psychological symptoms associated with AD such as depression, sleep disturbance, and anxiety [107]. Reductions in NA would also be expected to cause dysfunction in the sympathetic nervous system and is thought to be the cause of the reduced darkness reflex of the pupil in response to light in those with AD [108].
Autophagy, a key homeostatic process in which cytosolic components are degraded and recycled through lysosomes, has been shown to be accelerated by stimulation of β2-adrenoreceptors [109]. A lack of NA may therefore mean cells are less able to repair and remove accumulating abnormal intracellular tau [91]. Additionally, NA has anti-inflammatory influences on murine microglia which have been exposed to fibrillar Aβ inhibiting IL-1 secretion which is associated with APP production [110]. Therefore, a reduction in NA levels may imply that IL-1 and other pro-inflammatory molecules are not sufficiently suppressed and may contribute to disease progression [42]. Cultured cortical and LC cells are protected (though not fully) from Aβ induced cell loss by β-adrenergic stimulation by NA which increases expression of the brain-derived neurotrophic factor BDNF. Consequently a decrease in NA concentration may remove this neuroprotective effect [111, 112].
ANIMAL MODELS OF LC DYSFUNCTION IN AD
The rat has been used as an animal model in a number of fundamental studies examining the role of LC in physiological and pathological conditions [113–116]. The TgF344-AD rat expressing disease-causing mutant amyloid precursor protein (APPsw) and presenilin-1 (PS1ΔE9)g344-19 has been used to study LC in AD [117–119]. However, in this review, we decided to focus on the LC changes observed in the main experimental models used in AD, the mouse.
Mice with genetic mutations resulting in an overproduction of amyloid, typically used to model AD in mice (Table 1), have been shown to have 25%less LC cells than age-matched wild-type mice, whereas their SN dopaminergic cells are unaffected [120, 121]. Likewise gene expression for dopamine beta-hydroxylase (DBH) and tyrosine hydroxylase (TH) is also significantly reduced [122]. One study showed the volume of the LC to be reduced in Tg2576 mice aged 8 months, however surprisingly, an initial increase in positively stained DBH cell density between 6.5 months to 8 months was also observed, suggesting an initial compensatory strategy which is unsuccessful in preventing an overall loss of LC cells [123]. Surviving LC neurons have larger cell bodies and short thick broken dendrites when compared to wild-type mice [120, 122], all of which is similarly seen in postmortem studies of AD in humans [88]. However other studies using PDAPP and 5xFAD have not shown a significant reduction in LC cell number compared to wild-type mice [122, 124].
Summary of the main transgenic mouse models and techniques described in this review used to study Alzheimer’s disease and locus coeruleus degeneration
AD, Alzheimer’s disease; DBH, dopamine beta-hydroxylase; DSP4, N-(2-chloroetyl)-N-ethyl-2-bromobenzylamine; LC, locus coeruleus; MAPT, microtubule-associated protein tau; NA, noradrenaline.
Injection of DSP4 (N-(2-chloroetyl)-N-ethyl-2-bromobenzylamine), a neurotoxin selective for noradrenergic LC neurons in APP/PS1 mice, results in greater accumulation of Aβ in brain areas that the LC projects to [125, 126] as well as being associated with a 70–80%reduction of NA in the forebrain and hippocampus [127]. Furthermore, DSP4 injections are also associated with greater cognitive impairments in spatial memory as measured by the Morris water maze task [125, 128]. APP/PS1 mice crossed with DBH -/- or Ear2-/-mice show enhanced impairment in spatial memory tasks and long-term potentiation compared to APP/PS1 mice [129, 130]. This supports a role for NA specifically in memory loss in AD, rather than involvement of the LC in other neurotransmitter systems. Interestingly, increasing NA concentration in mice slowed the rate of neurodegeneration [131] and administration of L-threo-dihydroxyphenylserine (L-DOPS) to increase NA levels in DBH-/-APP/PS1 mice, showed some improvement in spatial memory task performance, though these mice did not perform as well on the task as APP/PS1 mice without NA depletion [129, 130].
Experimental studies suggests that reduced NA decreases tight-junction proteins, affecting the permeability of the blood-brain barrier potentially interfering with the clearance of Aβ and other toxins [132]. This suggests another route by which an impaired LC could participate in AD onset.
In addition due to the anti-inflammatory effects of NA, decreased NA levels are expected to affect the regulation of pro-inflammatory cytokines which is then theorized to cause further noradrenergic cell loss in the LC resulting in a negative feedback loop [133]. Both 5xFAD mice and P301S tau mice show microglial and astrocyte activation in the LC compared to wild-type mice [122, 128]. Both DSP4 injections into APP23 mice [126] or administration of beta-adrenergic antagonists [134] cause greater glial inflammation in LC projection areas compared to wild-type mice. In mice, NA maintains the clearance of Aβ by microglia and also suppresses Aβ induced cytokine production [110, 135].
Overall, these studies suggest that a reduction in NA participates in the progression of AD and accumulation of Aβ. Though this remains to be confirmed in humans, NA might be a potential target for pharmacological treatment. The murine findings on LC degeneration are summarized in Table 2.
Summary of studies using transgenic mouse models to explore locus coeruleus degeneration in Alzheimer’s disease
Aβ, amyloid-β; DBH, dopamine beta hydroxylase; DSP4, N-(2-chloroetyl)-N-ethyl-2-bromobenzylamine; IHC, immunohistochemistry; mth, month; TH, tyrosine hydroxylase; L-DOPS, L-threo-dihydroxyphenylserine; NET, noradrenaline transporter; SN, substantia nigra; VTA, ventral tegmental area.
NEUROMELANIN: SYNTHESIS AND NEUROPROTECTIVE ROLE
A distinguishing feature of the LC is that most cells contain a high concentration of a dark black-brown, granular pigment called neuromelanin (NM). Although found in many neurons, it is only in the LC and the SN that NM is found at such high concentrations that it can be visualized macroscopically, with both brain areas being named after this feature: Locus coeruleus being Latin for ‘blue place’ and substantia nigra being Latin for ‘black substance.’
While most research has focused on the analysis of NM in the SN, most likely due to methodological difficulties in isolating NM from the LC due to its size and location; NM in both locations is thought to be structurally similar. Granules are approximately 30μm in size, are insoluble and located within double-membrane organelles in the cytoplasm of the cell body and absent from dendrites [136, 137]. Electron microscopy studies show NM to have a pheomelanin core, an eumelanin surface, a lipid component and a protein matrix of mainly lysosomal proteins [136, 139]. The mechanisms for NM synthesis are not fully understood, though it is generally accepted that NM is synthesized by the oxidative polymerization of excess dopamine and NA [137]. However, it is unclear why NM only appears in some dopaminergic/noradrenergic neurons, suggesting production is in some way regulated, as it is for peripheral melanins [140, 141]. In addition, the catecholaminergic neurons of rodents and rabbits do not contain NM and while NM is seen in primates in a similar distribution to humans, the intensity of NM pigmentation is greatly reduced compared to humans [140, 142–145]. The lack of NM in common laboratory animals again makes it difficult to explore its function. Interestingly when human tyrosinase is injected into the SN of mice, a dark pigment which appears to be similar to human NM appears ipsilateral to the injection site after 2 months [146].
It has been proposed that NM synthesis removes excess cytosolic dopamine/NA which is oxidized by iron catalysts to quinones and semiquinones, which are permanently stored within autophagic organelles as NM, thus preventing cellular damage by oxidative stress [137], see Fig. 1. NM synthesis was experimentally induced in rat and PC12 neuronal cell cultures by exposing them to L-DOPA, which increases DA/NA production. Interestingly, when desferrioxamine, an iron chelator, was added to the cell cultures prior to L-DOPA, NM synthesis was inhibited suggesting that iron is required for NM to accumulate [137].
NM is therefore proposed to be neuroprotective as it has a strong affinity to metals such as iron, copper and zinc which are present in NM at much higher concentrations than in surrounding tissue [147, 148]. In microglia, oligodendrocytes and most non-catecholaminergic neurons, iron is mainly stored in the protein ferritin in an inactive state. However ferritins are poorly expressed in both LC and SN neurons and instead iron and other metals are bound to NM in an inactive form protecting the brainstem from oxidative stress [147].
NEUROMELANIN ACCUMULATION IN PHYSIOLOGICAL AGING
With age, NM accumulates within organelles in the LC until cells die. It is first detected in both the LC and SN at around 3 years of age [149, 150]. Prior to the age of 25, there are more tyrosine hydroxylase positive neurons in the LC than NM containing neurons; however, by age 50, almost all LC cells contain the pigment [8, 85]. The concentration of NM in the LC and SN is similar in healthy aging and although it accumulates with age in both areas, it accumulates at higher concentrations in the LC earlier than in the SN [147].
In the SN from the age of 3, the number of NM granules and space occupied by the granules in the cytoplasm gradually increases and the color of the pigment darkens with age until approximately the age of 20. Later, the optical density of the pigment continues to increase with age but the volume taken up by the pigment in the cell does not change [141]. These phased changes again suggest that NM synthesis is a regulated process. Although similar experiments to explore this in LC cells have not yet been performed it is expected that a similar chronological pathway is occurring.
NEUROMELANIN AND NEURONAL LOSS IN THE LC
NM loss has been found to be associated with LC cell loss [101], which may result in surplus iron not being chelated, inducing oxidative stress and tissue damage and thus contributing to neurodegenerative disorders [151]. As NM is only found in high quantities in the human LC and to a much lesser extent in the LC of animals, this may explain why neurodegeneration is not observed in non-primates [143] and is a limitation of transgenic mouse models in studying the role of the LC in AD.
It has been theorized that as LC cells degenerate, the insoluble NM is released into the extracellular space [148] where it could act as a pro-inflammatory stimulus triggering cytokine secretion. Extracellular NM deposits have been observed in the SN in older but not younger postmortem cases [152] and within microglia suggesting toxicity from NM deposits [101]. In human and rat microglial cultures, NM is quickly phagocytosed by microglia and associated with a dose-dependent overexpression of pro-inflammatory cytokines, e.g., TNF-α, IL-Iβ, and iNOS [153, 154]. However, 1-month old microglial cultures are less efficient in phagocytosing NM than younger microglia [153] supporting the idea that aged microglia will be less effective in removing extracellular NM. Similarly when human NM was injected into the rat SN and cortex, it resulted in microglial activation in both areas [155] and approximately 40%of the dopaminergic neurons were lost in the SN, with the areas showing greatest microglial activation being the areas that underwent greatest cell loss [153]. The mechanism behind the degradation of NM by microglia as well as the outcome of the toxic metals issue from degenerated LC cells remains unknown. Nevertheless, this supports the concept that a positive feedback loop caused by extracellular NM could accelerate the loss of neurons in the SN [155] and potentially also in the LC, but similar experiments such as injecting NM into the LC or looking at exposing noradrenergic neurons to NM in cell cultures have not yet been performed.
IMAGING NEUROMELANIN WITH NEUROMELANIN-SENSITIVE MRI
Using MRI to look at the structure and connectivity of the brainstem nuclei in vivo has previously been challenging due to their small size and complex organization. However, NM has paramagnetic properties giving it a short T1 relaxation time [156]. As a consequence, NM appears hyperintense compared to the surrounding pons/midbrain allowing visualization of the LC and SN in participants [156, 157] (Fig. 3). This method is known as neuromelanin-sensitive MRI (NM-MRI). The LC signal on NM-MRI correlates with LC volume postmortem [158, 159] and is considered a reliable method to explore LC signal in vivo.
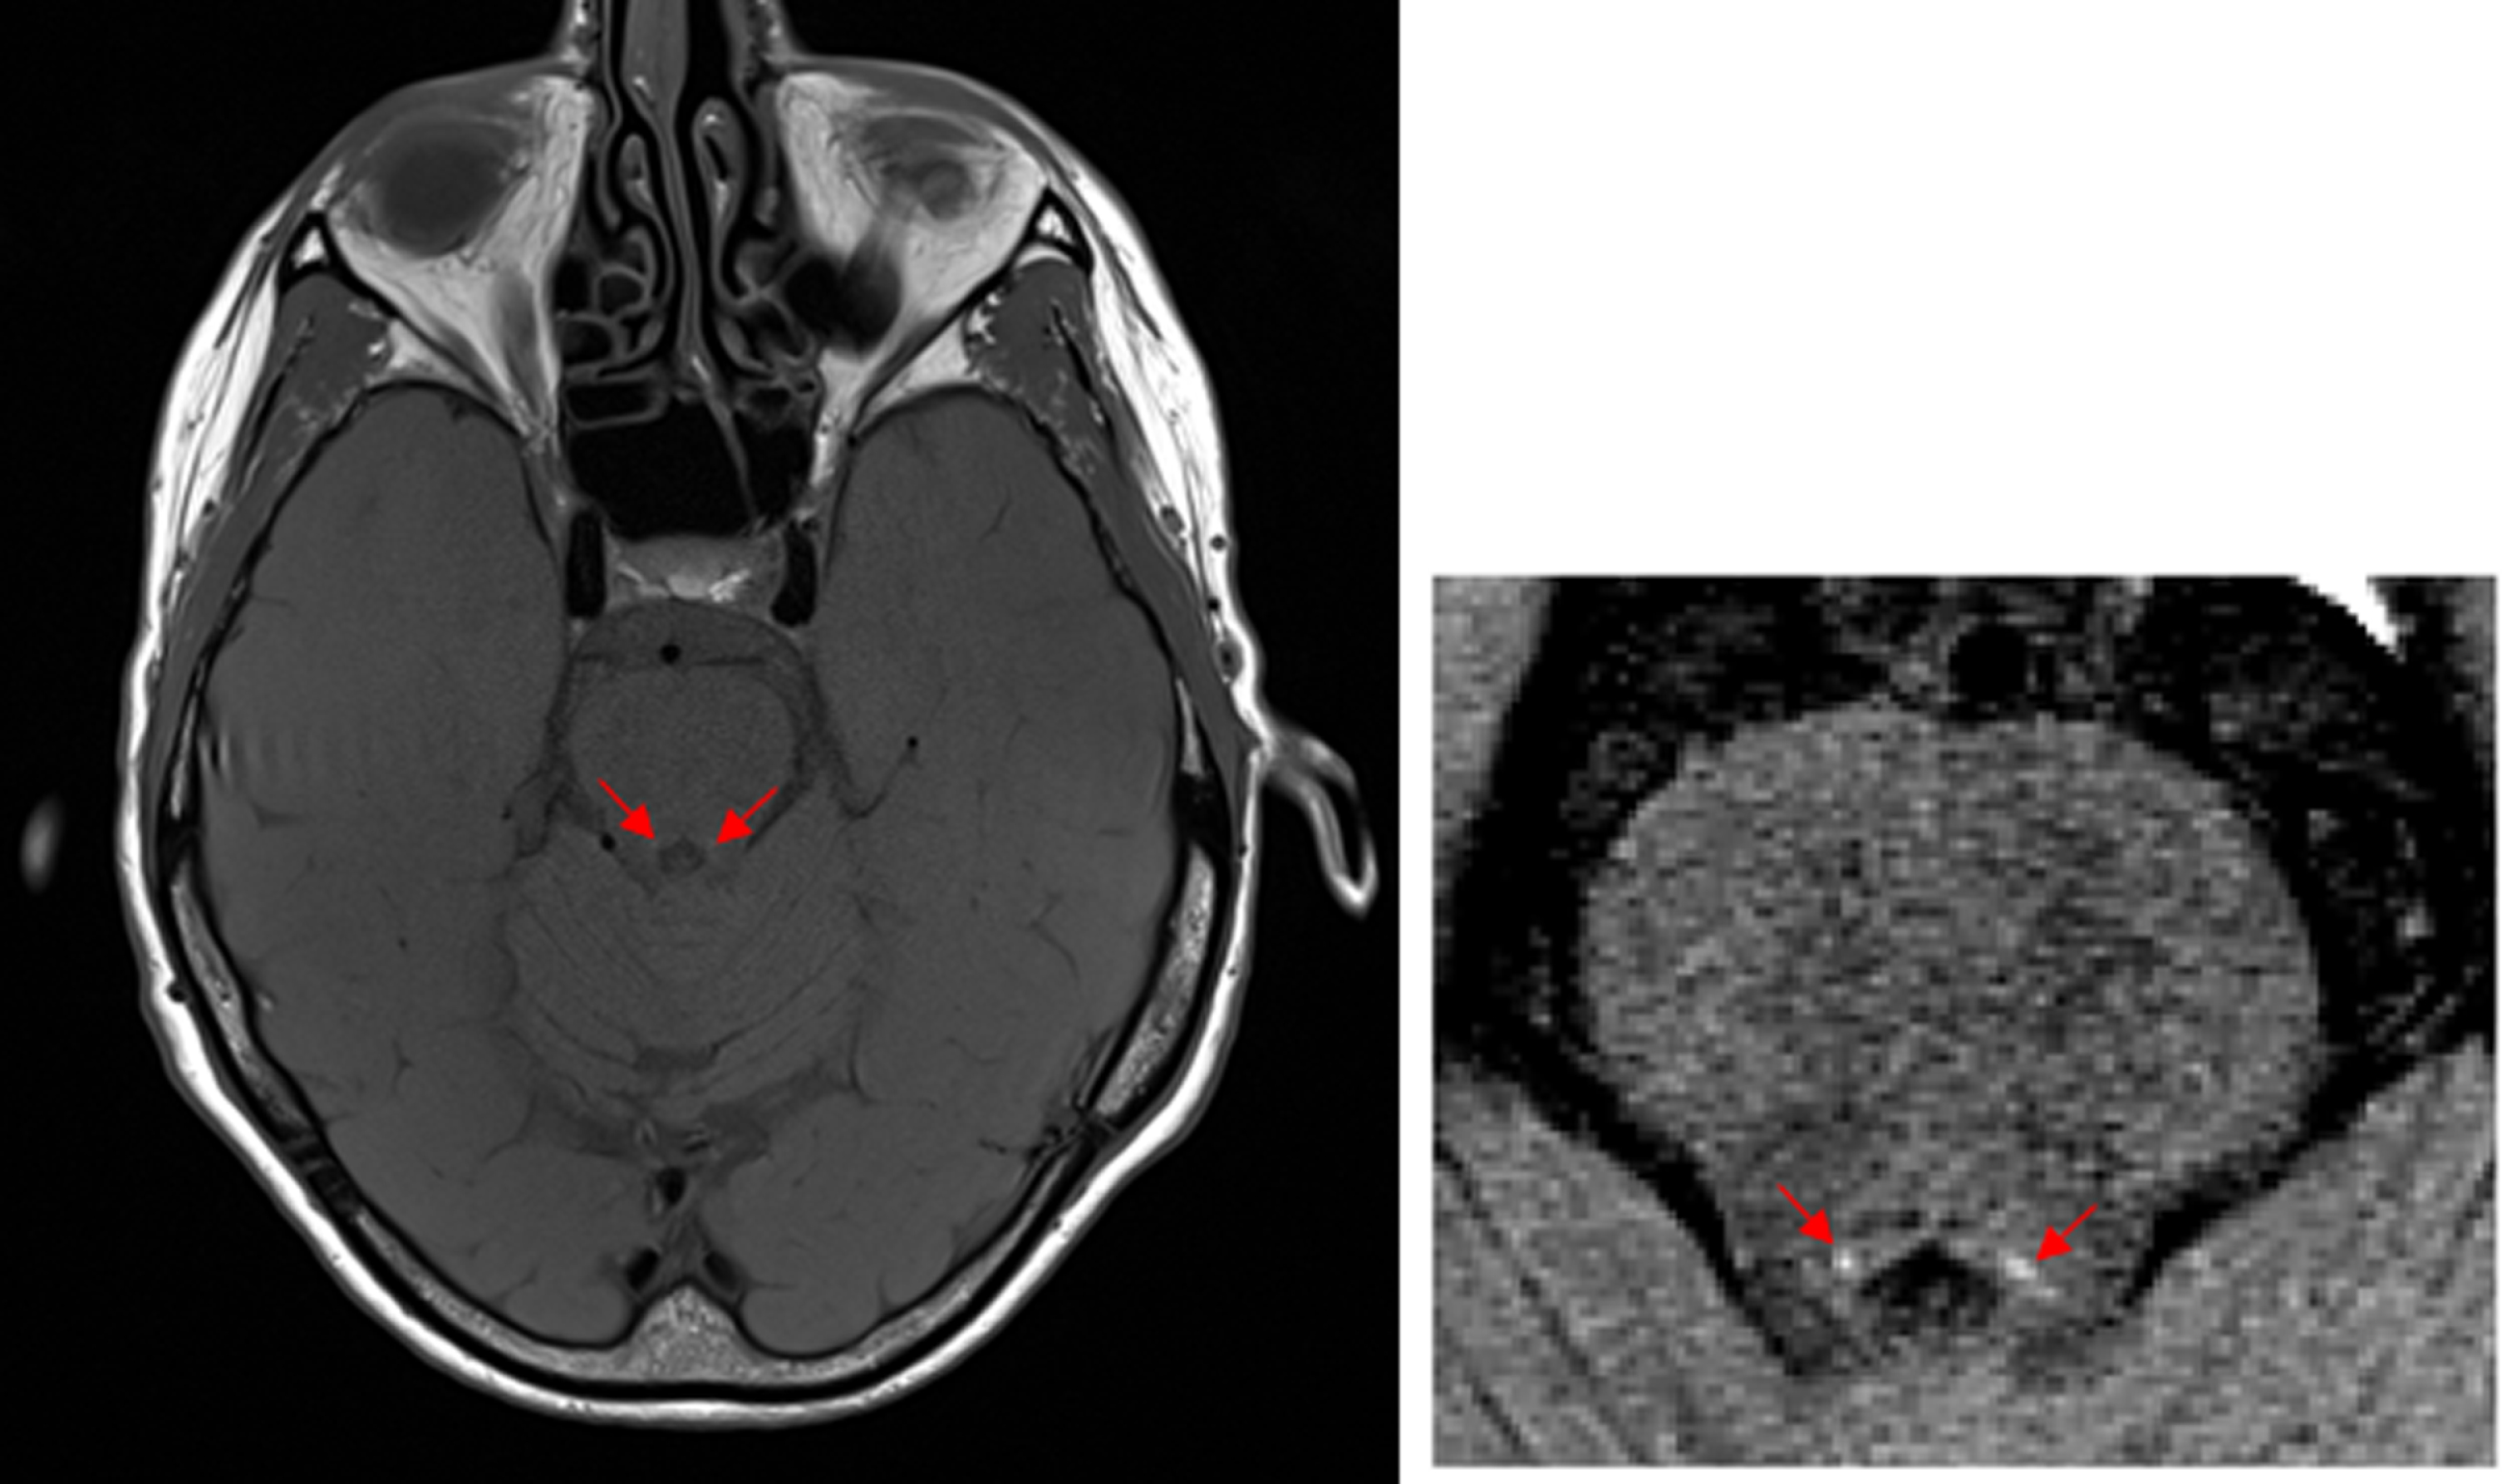
NM-MR axial image of a 69 year old female with no cognitive impairment obtained on 3Tesla Siemens Skyra MRI scanner at the level approximately 7mm below the inferior colliculi, in which the LC can be observed as two hyperintense areas (red arrows) [184].
Generally the signal intensity of the LC is stronger in the middle part of the nucleus [160–162] and typically researchers identify the axial slice of the brainstem which is approximately 7 mm below the inferior colliculi, to measure the intensity values of the LC [163, 164], though one study suggests better results are obtained when sampling slightly lower at 10 mm below the inferior colliculi [165]. The relative signal intensities of the LC and SN are most frequently assessed using the peak signal intensity of the area and comparing it to a relevant reference area to calculate a contrast ratio (CR), for the LC this reference area is typically the pons tegmentum (PT). The most frequently used formula for calculating the CR is (signal intensity of LC—mean signal intensity of the PT)/mean signal intensity of the PT, as shown in Fig. 4, though this varies between studies with some dividing by the standard deviation of the PT [166] producing similar results. However the PT might be subject to age-related decline and so may not be the most reliable reference region [167], though better alternatives are yet to be found. While some groups have used a semi-automated method to identify the location of the LC [168], most have used a manual approach, such as using multiple raters completing blinded analysis, and averaging three calculations to overcome any attributable human error. Again, this variance makes it difficult to compare studies. Furthermore, by always measuring peak signal intensities rather than looking at overall signal or differences in several aspects of the LC, any differences between patient groups and healthy controls could be masked.
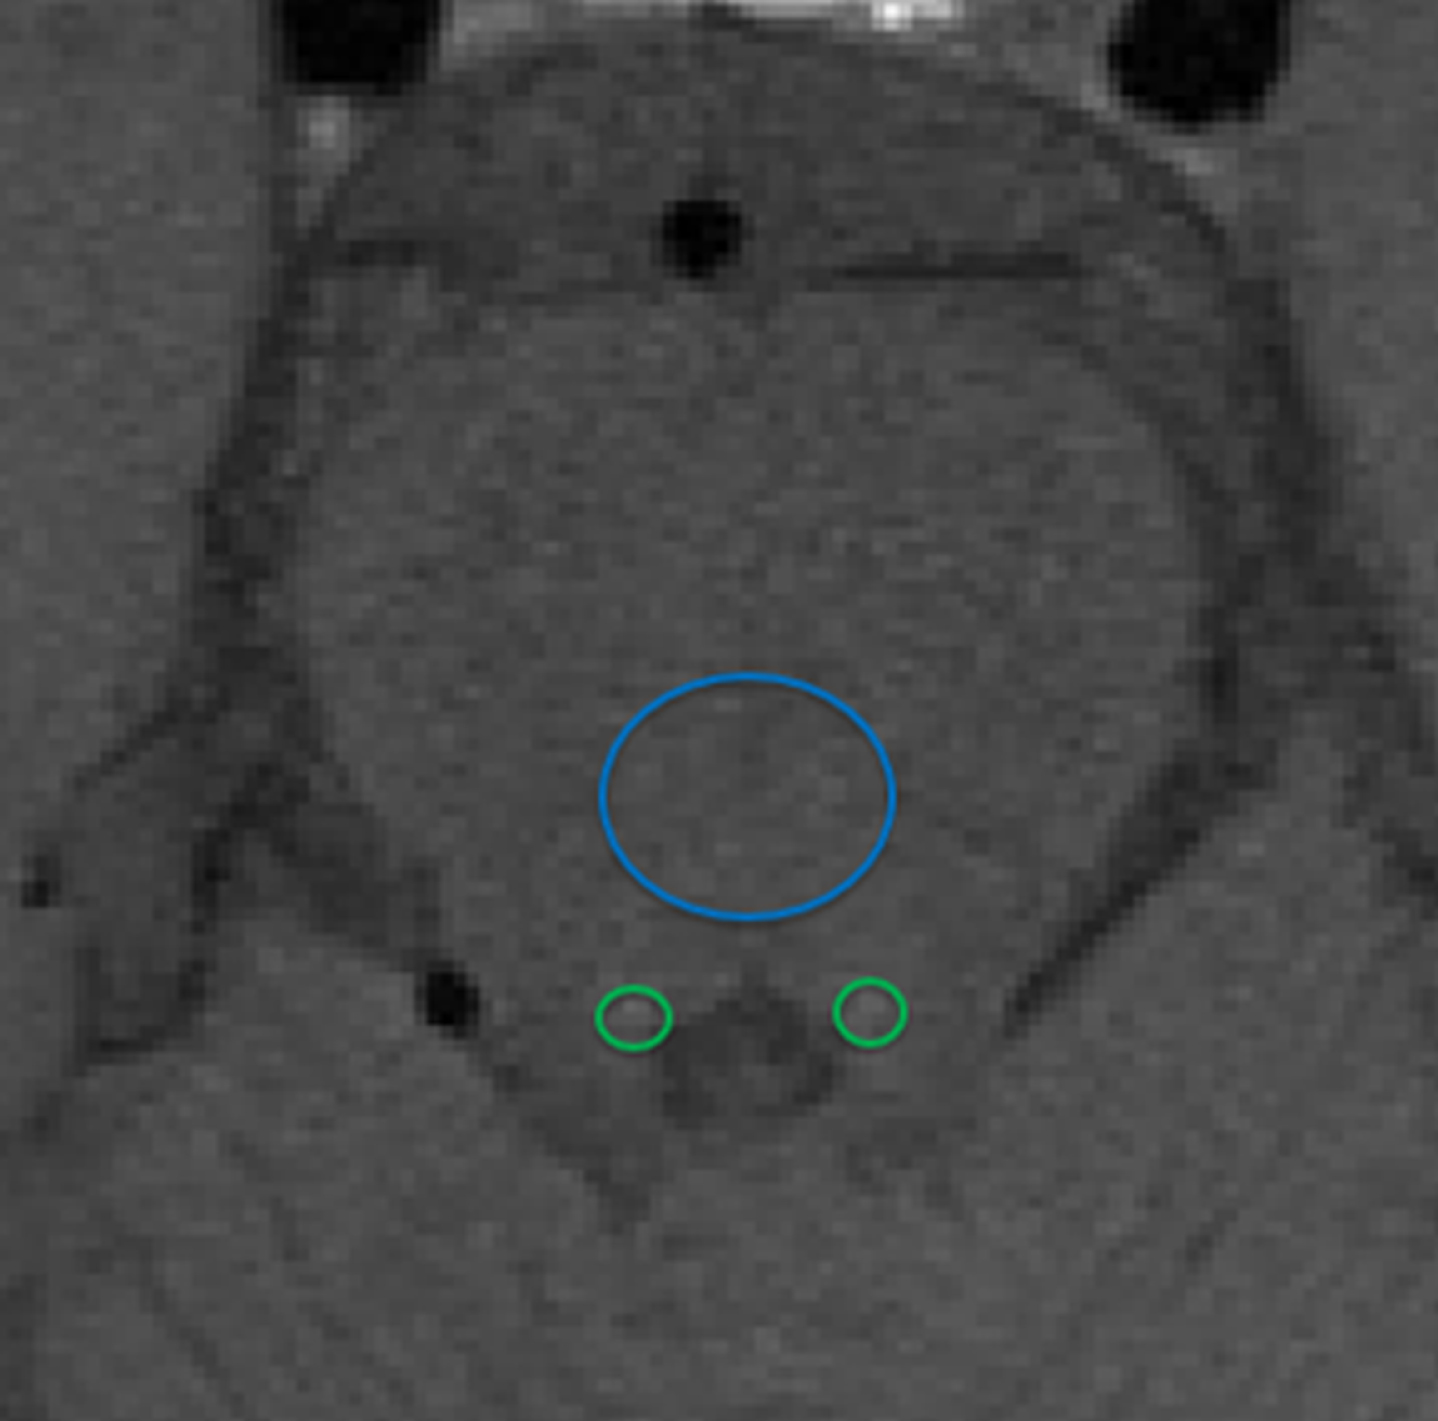
MR image to show how locus coeruleus (LC) signal intensity (SI) is typically calculated as a contrast ratio using the pons tegmentum as a reference are (blue circle). Regions of Interest are placed around the LC (green circles). The average SI of the mean right LC and mean left LC (LCSI) minus the mean signal of the pons tegmentum (SIPT) divided by the signal intensity of the pons tegmentum: (LCSI –SIPT)/SIPT provides the contrast ratio.
One limitation of NM-MRI is its low spatial resolution compared to the size of the LC resulting in a long acquisition time. Additionally, results are confounded by noise from the cardiac system which pulses through the brainstem if imaged at 3Tesla or below [169]. However the protocol does have good test-retest reproducibility [170]. Furthermore, the images can be acquired in different ways: while most use a fast spin echo T1 weighted acquisition protocol [160, 172], others have performed gradient echo imaging with magnetization transfer (MT) contrast [168, 173] or FLASH (spoiled gradient echo) imaging [161], with proponents of both arguing that this enables better visualization of the LC. Differences in acquisition methods makes it difficult to compare studies with the complication of co-morbidities such as smoking which can enhance the signal due to nicotine increasing LC firing rate [174].
NEUROIMAGING STUDIES OF NM/LC IN AGING
In healthy participants, the signal of the LC measured using NM-MRI increases with age until approximately age 60 and then slowly decreases [159, 175], mirroring some postmortem observations. Some authors have suggested that these age differences can only be observed in the rostral part of the LC [161, 176]. There have been mixed findings when it comes to age effects in both imaging and postmortem studies and the uncertainty around the age effect should be considered when looking at LC signal [171]. As these studies are only single time-point studies and individuals are not followed up it is not known whether these individuals are truly a ‘healthy’ population to study typical aging. Another challenge of the imaging studies which may explain the discrepancies in the findings is the small sample sizes and different acquisition measures, lacking reproducibility and comparison. Additionally, LC signal is positively correlated with cognitive reserve, measured by years of education, occupation, and verbal intelligence and more recently memory performance across a variety of tasks [163, 177]. While some have found no gender differences [171], others have observed a higher LC signal in men compared to women [163], potentially due to comorbidities such as smoking.
NEUROIMAGING NM/LC IN AD
To date, NM-MRI’s main application has been to explore differences in the signal from the SN and LC in Parkinson’s disease [170]. Both areas show a significant reduction in signal intensity [178, 179], though reductions in the signal of the SN correlate more closely with Parkinson’s disease diagnosis, duration and severity [172, 180], in line with postmortem evidence. Furthermore, the signal of the SN correlates with manual counts of NM containing neurons which again supports this as a useful technique to look at NM concentration in vivo.
As LC cell loss is evident in AD brains, a reduction in LC signal in AD patients would be expected on NM-MRI, indeed volumetric reduction of the brainstem is observed in AD compared to cognitively normal individuals [182] To our knowledge, six in vivo studies using NM-MRI have studied the LC in AD. One reported no significant difference in LC signal intensity, though it employed a small sample size (n = 6) [180]; whereas four of the other studies showed a significant reduction in signal in AD patients [164, 183–185] when compared to healthy controls, which also correlated with an increase in CSF Aβ levels [185]. Additionally, LC signal was reported to be lower in those with MCI compared to controls [164], but this has not always been observed [185]. The other study analyzed left and right LC signal intensities separately and found that while there was a trend for AD participants to have lower LC contrast ratios than control participants, this was only significant for the left LC on the slice 10 mm below the inferior colliculi [165], suggesting that right and left sided differences should be taken into account. However, postmortem studies have shown the LC to be bilaterally symmetrical [6–8, 13] and the researchers employed a different method for calculating the LC contrast ratio (taking the maximum signal intensity values for each side and dividing by the left and right sides of the pons, respectively) as well as having a relatively small sample size. Only one of the studies used age and gender matched controls and excluded participants who were taking medications that may alter the noradrenergic system, e.g., serotonin and noradrenaline reuptake inhibitors [184]. Overall when LC signal is observed to be reduced in AD patients, it is the rostral and middle parts of the LC that are significantly different whereas the caudal section appears unchanged [185].
Following a review of all NM-MRI and LC papers, it is clear that studies with larger sample sizes are needed to confirm whether a signal intensity decrease in the LC is observable in AD, with the aim to clarify whether NM-MRI is a viable early-stage biomarker [170]. LC volume measurements are highly reproducible when repeated across multiple scans in young people [170], implying that if there are changes in LC signal over time in AD, analysis could be performed longitudinally in a non-invasive method with the LC viewed as a potential predictor of the disease evolution or as an indicator in the context of treatment to delay or halt the neurodegeneration. However, in order to utilize LC imaging as a biomarker, it is essential that we improve our understanding of the pathophysiological mechanisms underlying the LC changes in AD by performing robust postmortem human studies for validation.
IMAGING NORADRENERGIC DEFICITS USING POSITRON EMISSION TOMOGRAPHY (PET)
Functional changes of noradrenaline can be visualized by PET imaging using (S,S)-[11C]MeNER [carbon-11 labeled (S,S)-2-(α-(2-Methoxyphenoxybenzyl)morpholine], a ligand with high affinity for noradrenaline transporters [175], indicative of its availability. The PET ligand [11C]-MeNER has been utilized in patients with Parkinson’s disease allowing assessment of the NM denervation [176] and linking the NM reduction with specific non-motor symptoms of Parkinson’s disease [177]. In AD, it has been used in one postmortem autoradiographic study, where a decreased signal was observed in LC and the thalamus associated with increasing Braak stages [98]. It would be of interest to compare the LC degeneration using NM-MRI with measure of noradrenergic deficits with the [11C]-MeNER tracer in AD patients. The use of complementary imaging modalities will help to elucidate the function and pathophysiological mechanisms associated with LC dysfunction and degeneration in future studies.
CONCLUSION
While many studies do suggest that LC neuronal loss gradually occurs with age after the age of 60, mixed findings cause considerable uncertainty, reinforcing the need for further research to clarify the profile of LC degeneration in physiological aging. Although significant LC degeneration occurs early in AD and hyperphosphorylated tau deposition is present in the LC, a causal link between tau accumulation and LC cell death which occurs decades later, has not yet been elucidated. Studies have highlighted a role for both NA depletion and NM accumulation in the neuroinflammatory response, resulting in further LC degeneration. Of note, neuroinflammatory changes within the LC and their consequences in the brain areas affected by AD (e.g., cortex) have not been explored. Understanding these relationships may inform on whether the pharmacological elevation of NA would be successful in slowing disease progression and at what time points it should be administered. The impact of NM accumulation over time both within LC neurons and in the extracellular space has been largely overlooked, mainly due to 1) methodological issues with studying this in such a small brain region and 2) the use of animal models which do not replicate NM accumulation as observed in humans. The relationship between NM accumulation and tau accumulation in the LC remains unknown.
NM-sensitive MRI is proposed to be a relatively new, inexpensive, and reliable tool for studying LC/NM loss in vivo. However, longitudinal imaging studies to assess how an individual’s LC signal changes over time and how it is associated with their cognitive performance are required in both healthy individuals to build a profile for healthy aging, and in those with AD to explore whether the MRI protocol could be of diagnostic use and whether LC changes can be used as a biomarker for early AD detection. Indeed, if NA manipulation was to delay AD pathology, then early detection and monitoring of LC degeneration in vivo using NM-MRI as a biomarker would be essential.