
Abstract
Background:
Microglia contribute to Alzheimer’s disease (AD) pathogenesis by clearing amyloid-β (Aβ) and driving neuroinflammation. Domestic dogs with age-related dementia (canine cognitive dysfunction (CCD)) develop cerebral amyloidosis like humans developing AD, and studying such dogs can provide novel information about microglial response in prodromal AD.
Objective:
The aim was to investigate the microglial response in the cortical grey and the subcortical white matter in dogs with CCD versus age-matched cognitively normal dogs.
Methods:
Brains from aged dogs with CCD and age-matched controls without dementia were studied. Cases were defined by dementia rating score. Brain sections were stained for Aβ, thioflavin S, hyperphosphorylated tau, and the microglial-macrophage ionized calcium binding adaptor molecule 1 (Iba1). Results were correlated to dementia rating score and tissue levels of Aβ.
Results:
Microglial numbers were higher in the Aβ plaque-loaded deep cortical layers in CCD versus control dogs, while the coverage by microglial processes were comparable. Aβ plaques were of the diffuse type and without microglial aggregation. However, a correlation was found between the %Iba1 area and insoluble Aβ 42 and N-terminal pyroglutamate modified Aβ(N3pE)-42. The %Iba1 area was higher in white matter, showing phosphorylation of S396 tau, versus grey matter. Perivascular macrophage infiltrates were abundant in the white matter particularly in CDD dogs.
Conclusion:
The results from this study of the microglial-macrophage response in dogs with CCD are suggestive of relatively mild microglial responses in the Aβ plaque-loaded deep cortical layers and perivascular macrophage infiltrates in the subcortical white matter, in prodromal AD.
INTRODUCTION
Alzheimer’s disease (AD) poses a major social as well as financial burden on society. Despite decades of research, no effective therapies exist, leaving AD as a progressive, irreversible, and eventually fatal neurodegenerative disease [1, 2]. Neuroinflammation is considered to play an important role in the AD pathogenesis [3]. Genome-wide association studies (GWAS) have identified several single nucleotide mutations in microglial-expressed genes, which increases the risk of developing late-onset sporadic AD [3, 4]. Additionally, in patients suffering from AD, it has been shown that not only the severity of tau pathology [5, 6], but also microglial activation, provides a better correlate with disease severity than the degree of cerebral amyloidosis [7, 8]. Microglial activation is accordingly regarded critical for the development of AD and potentially for driving disease progression [9, 10]. The majority of studies on microglia in AD pathogenesis relies on transgenic mouse models representing the rare familial early-onset AD [11, 12]. This, as well as the limited lifespan of mice compared to humans, makes it relevant to study the microglial response to the extracellular accumulation of amyloid-β (Aβ) in other animal models. Domestic dogs can with advancing age spontaneously develop dementia, a condition referred to as canine cognitive dysfunction (CCD) [13, 14]. Compared to the transgenic mouse models, dogs with CCD may better reflect the highly prevalent, sporadic late-onset AD [13, 15].
Neuropathologically, dogs with CCD are characterized by cortical atrophy and ventricular enlargement [13], development of diffuse amyloid plaques [15, 16], and cerebral amyloid angiopathy [15, 17–20], whereas neuritic plaques and neurofibrillary tangles (NFTs) are only documented in very few studies [17–19, 21]. The processing of the canine amyloid-β protein precursor (AβPP) provides cleavage products with an amino acid sequence identical to Aβ in humans, the most prevalent being Aβ142 and Aβ1–40 [16, 23]. While the majority of studies of CCD neuropathology has focused on the cerebral amyloidosis [15, 16], only few studies have reported on the microglial response to the accumulation of Aβ in dogs with CCD [18, 24]. Thus, microglial activation has been described in the neocortex and hippocampal formation in dogs with CCD [18, 24], with a single study also reporting on dystrophic forms of microglia [18], as also described in patients with AD [25].
The aim of the present study was to potentially identify hitherto undiscovered pathogenic mechanisms of relevance for the development of sporadic AD by studying the microglial response to Aβ accumulation in domestic dogs with CCD. As the dog brain due to its large size and gyrencephalic structure is very similar to the human brain, has a higher ratio between white and grey matter compared to the mouse models, we investigated the microglial response in the grey as well as the white matter of prefrontal cortex from dogs with CCD, and correlated the microglial response to cognitive status and to the Aβ accumulation. Microglia were visualized by immunohistochemical staining for the ionized calcium binding adaptor molecule 1 (Iba1), as used in most other studies of microglia in CCD [18, 20], and in AD [25, 26], whereas Aβ accumulation was evaluated by using the 6E10 antibody recognizing human and canine Aβ, and thioflavin S which stains fibrillar Aβ. The occurrence of NFT pathology was assessed with phospho-site specific anti-tau antibodies. The prefrontal cortex was chosen as the region of interest because Aβ accumulation is first observed here in dogs developing CCD [27].
MATERIAL AND METHODS
Dog brain samples and cognitive score
Ten brains from family-owned domestic dogs with CCD (15.3 (11.7, 16.3) years (median (min, max)) and five brains from age-matched control dogs (13.7 (9.9, 15.4) years)) were included in the study (Table 1 and Supplementary Table 1). Brains came from deceased dogs participating in longitudinal cohort studies of aged dogs with and without CCD at the University Hospital for Companion Animals, Department of Veterinary Clinical Sciences, University of Copenhagen. Ten of the dogs also participated in a study by Schütt et al. [15]. All dogs were investigated with physical and neurological examinations, standard hematology, and blood biochemistry, including C-reactive protein, fibrinogen, and thyroid profile, and for some magnetic resonance imaging (MRI) of the brain. Cognitive status was assessed using a validated questionnaire, the Canine Cognitive Dysfunction Rating Scale (CCDR) [27], as previously described [15]. Cases were defined by a CCDR score≥50 (defining CCD) and by excluding other possible differential causes (intra- or extracranial disorders) that may mimic signs of CCD. Controls were defined by a CCDR score < 40 (defining normal cognitive status). Apart from one dog having periodontitis, observed at the inclusion visit and treated, other signs of infectious disease were not observed. The ten CCD dog owners donated their dogs for postmortem investigation at the time where euthanasia was decided for ethical reasons. For seven dogs, worsening of clinical signs and cognitive deterioration was the direct cause that prompted the owners to have their dog euthanized. For the remaining three dogs, one died spontaneously in advanced age (16 years). Autopsy showed that the dog suffered from cardiac insufficiency. One dog was diagnosed with a primary lung tumor and progressive respiratory problems during the course of CCD, which motivated euthanasia. Finally, one dog suffered from arthrosis-associated pain, which worsened, and together with progression of cognitive deterioration, this contributed to a decision of euthanasia. For controls, the cause for euthanasia was age-related non-brain, non-infectious disabilities such as chronic osteoarthritis or non-central nervous system (CNS)-related neoplasia. A written consent was signed by the owners for participation in the longitudinal clinical studies, scientific postmortem investigations, and publication of results. An overview of included dogs is provided in Supplementary Table 1. The dogs were treated according to the European and Danish legislation on the protection of animals used for scientific purposes (Directive 2010/63/EU). The study was approved by the Danish Animal Experiments Inspectorate (License: 2015-15-0201-00810) and the local Ethical Committee of the Department of Veterinary Clinical Sciences, University of Copenhagen.
Gender, age, and CCDR score of the 15 dogs examined
CCD, canine cognitive dysfunction; CCDR, canine cognitive dysfunction rating scale. Age and CCDR scores are given as median with the 25th and 75th percentiles in brackets. 1p = 0.14, Mann-Whitney test. 2p = 0.0003, Mann-Whitney test.
Human brain tissue
Frontal cortex tissue from two autopsy-confirmed AD patients was obtained from the Maritime Brain Tissue Bank, Department of Medical Neuroscience, Faculty of Medicine, Dalhousie University, Canada. Written, informed consent forms were obtained for both subjects (BB02-003:78-year-old female, and BB15-042:82-year-old male), in accordance with the Declaration of Helsinki. The paraffin-embedded human brain tissue was part of a tissue array used in a previously published article [28]. Approval was obtained from the Nova Scotia Health Authority Research Ethics Board in Halifax, Canada and Danish Biomedical Research Ethical Committee for the Region of Southern Denmark (Project Id. S-20160036 and S-20070065, respectively).
Fixation and tissue processing of brain tissue
Canine brain tissue
Dogs were euthanized by an overdose of intravenously injected pentobarbital (magistral preparation or Euthanasol vet., Dechra). Brains were isolated within two hours of euthanasia. In the case of the dogs also participating in Schütt et al. [15], the right hemispheres were isolated and immersion fixed in 10%neutral buffered formalin at room temperature (RT) for three to eight days, upon which they were sliced and trimmed into blocks that were processed and embedded in paraffin, as previously described [15]. For the remaining dogs, the brain was in toto immersion fixed in formalin for at least 2 weeks and then embedded in agar in a metal form enabling sectioning in serial parallel 6 mm coronal slices. Depending on the size of the slices, these were subdivided into smaller specimens to fit standard cassette size. These were then processed by routine methods for histology and were sectioned at 4-5μm.
Human brain tissue
The processing of the paraffin-embedded brain tissue in tissue arrays and tissue sections has been previously described [28]. Fresh-frozen middle frontal gyrus of the two autopsy-confirmed AD patients was cut into 20μm-thick sections using a Leica CM3050S cryostat (Leica Biosystems). Sections were stored at –80°C until use.
Immunohistochemistry
Antibodies and reagents
Microglia-macrophages were visualized using polyclonal rabbit anti-Iba1 (Wako, C19-19741) and monoclonal mouse anti-CD68 (Cluster of Differentiation 68) (Abcam, ab783, clone PG-M1 and Abcam, ab955, clone KP1). Aβ was visualized by biotinylated mouse anti-Aβ IgG1 (clone 6E10) raised against residues 1–16 of human Aβ (BioLegend, SIG-39340) and phosphorylated tau by using either biotin-labeled monoclonal mouse anti-PHF tau (S202, T205) (Thermo Scientific, MN1020B, clone AT8) or monoclonal rabbit anti-tau (S396) (Abcam, ab109390, clone EPR2731). EnVision + System-HRP Labelled Polymer Anti-Rabbit (DAKO, K4003) or Alkaline Phosphatase (AP) Anti-Rabbit (Sigma A3812) were used for detection of Iba1 and tau (S396), EnVision + System-HRP Labelled Polymer Anti-Mouse (Dako, K4001) for detection of CD68 and tau (S202, T205), and HRP-Streptavidin (SA) (RPN1231V, GE Healthcare UK Limited) for detection of biotinylated mouse anti-Aβ, respectively. Rabbit IgG (Dako X903), mouse IgG1 (Dako, X0931), and biotinylated mouse IgG1 (Invitrogen, MG115) were used for substitution control.
Staining procedures for Aβ and Iba1
Sections were deparaffinized and rehydrated in xylene and graded concentrations of ethanol (99%, 96%, 70%) followed by rinsing in distilled water. Heat-induced epitope retrieval (HIER) [29] with Tris EGTA (TEG) buffer was used for demasking. Sections were rinsed twice in TEG at RT, then boiled in TEG in a microwave oven at 700 W for 2×4 min followed by 10 min at 540 W and cooling. Sections used for the Aβ staining were additionally demasked in 70%formic acid (Merck) at RT for 30 min. Next, sections were rinsed in Tris-buffered saline (TBS) followed by rinsing in 1%Triton X in TBS (TBST). Sections were incubated with 10%fetal bovine serum (FBS) in TBS for 30 min prior to incubation with the primary antibody diluted 2μg/mL in 10%FBS in TBS, first for 30 min at RT and then overnight (o.n.) at 4°C. Next day, sections were rinsed in 1%TBST followed by TBS and then immersed in H2O2 in TBS with methanol (1:8:1) for 10 min blocking of endogenous peroxidase activity. Next, sections were rinsed in TBS followed by 1%TBST and incubation with EnVision + for 60 min at RT and o.n. at 4°C for Iba1, and HRP-SA for 2 h at RT for Aβ. Development was performed by 3’-diaminobenzidine (DAB) (50 mg) diluted in 100 mL TBS with 33μL H2O2 for 3–10 min. One set of sections stained for Iba1 were counterstained with Mayer’s hematoxylin and coverslipped with Aquatex® (Merck). Sections stained for Aβ were dehydrated in ethanol (70%, 96%, 99%) followed by xylene and coverslipped with Pertex® (Histolab). A uniform staining was ensured by including all sections in the same staining experiment. In the case of the staining for Aβ, sections from APPswe/PS1ΔE9 mice were included as control [12]. Specificity was controlled by substitution of the primary antibody with biotinylated mouse IgG1 or rabbit IgG on sections of dog and mouse brain tissue.
Staining procedures for CD68 and phosphorylated tau
Sections were processed as described above until the primary antibody was added. The primary antibody was diluted to 1μg/mL in 10%FBS in TBS, first for 30 min at RT and then o.n. at 4°C. Next day, sections were rinsed in 1%TBST followed by TBS and blocking of endogenous peroxidase activity, as described above, rinsing in TBS and 1%TBST, followed by incubation with EnVision + for 2 h at RT. Development was performed by DAB (50 mg) diluted in 100 mL TBS with 33μL H2O2 for 30 min for CD68 (KP1, PG-M1) and 15 min for phosphorylated tau (AT8, EPR2731). Sections were then washed in TBS, dehydrated in ethanol (70%, 96%, 99%) followed by xylene, and coverslipped with Pertex®. As control for the CD68 and the tau staining, paraffin sections of normal human brain tissue and sections of frozen postmortem brain tissue from AD patients were included, respectively. Specificity was controlled by substitution of the primary antibody with mouse IgG1 or rabbit IgG on dog and human brain sections.
Double staining for Aβ and Iba1
Sections were deparaffinized and rehydrated as described above. Demasking was performed with HIER [29] with citric acid buffer. Sections were boiled 5–7 min at 700 W and the container was supplemented with distilled water and then boiled for another 5–7 min followed by cooling. Sections were immersed in 98%formic acid (VWR Chemicals, 20320.295) at RT for 30 min. Next, sections were rinsed in TBS followed by blocking of endogenous peroxidase activity, as described. Sections were rinsed in TBS followed by rinse in 1%TBST. Sections were incubated with 10%FBS in TBS for 30 min at RT prior to incubation with a mixture of the rabbit anti-Iba1 and the biotinylated mouse anti-Aβ (6E10) antibodies in a concentration of 1 and 2μg/mL in 10%FBS in TBS, respectively. First, sections incubated 30 min at RT, then o.n. at 4°C. The next day, sections were rinsed in 1%TBST and incubated with a mixture of HRP-SA and AP anti-rabbit antibody in 10%FBS in TBS for 2 h at RT. Sections were rinsed in TBS followed by development of HRP-SA in DAB and rinsing in TBS. Next, endogenous AP activity was blocked by immersion of sections into 1 mM tetramisole hydrochloride (Sigma) in 50 mM Tris-HCl in 15 min, whereafter the development of the AP-signal was performed in 100 mL Tris-HCl-MgCl2 (pH 9.5) added 340μL BCIP (Sigma, 5%in N,N-dimethylformamide, Merck) and 450μL NBT (Sigma, 7%in 70%N,N-dimethylformamide). Sections were rinsed in TBS and coverslipped with Aquatex®.
Thioflavin S histochemistry
Sections with dog brains were deparaffinized and rehydrated in xylene and graded concentrations of ethanol (99%, 96%, 70%) followed by rinsing in distilled water. Together with fresh frozen human AD sections, they were then fixed in neutral buffered formalin for 24 h at 4°C. The next day, sections were rinsed in dH2O, dried, and defatted in chloroform (Sigma, C2432-1) and ethanol (1:1), and hydrated through graded concentrations of ethanol (99%, 96%, 70%) till dH2O. Next, sections were immersed in 0.25%potassium permanganate (Merck, 1.05082.0250, in dH2O), rinsed in dH2O, and incubated in 1%oxalic acid (Sigma, 75688-50G, in dH2O). Following rinsing in dH2O, sections were incubated with 0.25%sodium borohydride (Sigma, S-9125), rinsed in dH2O, and transferred to a 0.2%thioflavin-S solution (Sigma, T1892-25G, in 50%ethanol) for 8 min. Sections were finally immersed in 80%ethanol, rinsed in dH2O, and labelled with DAPI (327nM, Invitrogen, D3571, in dH2O) for nuclear staining. Sections were coverslipped with Fluorescence Mounting Medium (Agilent Technologies, S3023). For control, parallel sections without thioflavin-S were included. Images were obtained on an Olympus DP70 digital camera mounted on an Olympus BX52 microscope connected to a PC with Olympus DP-software. Co-localization of thioflavin S and DAPI nuclear staining was analyzed by use of FITC (U-MWIBA N1511000) and DAPI (U-MWU2) filters. Merging of images was done using Adobe Photoshop® 2021 (Adobe Inc., USA).
Image analysis of %Aβ and %Iba1 area
ImageJ [30] was used to analyze the images of Aβ and Iba1 stainings from 7 CCD dogs and 5 controls (Table 2). The three most recently included CCD dogs were not enrolled in this part of the study (see Supplementary Table 1). Images were obtained of the blinded sections with an Olympus BX53 microscope with an Olympus DP73 camera using the software Visiopharm Integrator System version 4.6.1.630 and exported to ImageJ [30] 1.52d (Rasband, W.S., ImageJ, NIH, USA, version 1.8.0_211), in which the total area was defined as the entire section, and the cortical grey matter and the subcortical white matter were delineated. The %area covered with 6E10 immunoreactive (6E10+) Aβ plaques, was obtained for the grey and white matter and both subregions, with the exception of the control dogs, in which it was not possible to distinguish between white and grey matter. Artefacts were excluded and a few sections included the ventricles and basal ganglia, which were also excluded from the analyses. The %area covered with Iba1 immunoreactive (Iba1+) microglia and/or macrophages was assessed as described for Aβ.
CCDR score, age, %Aβ, and Iba1 area in the control and CCD dogs used for image analysis
CCD, canine cognitive dysfunction; CCDR, canine cognitive dysfunction rating scale; GM, grey matter; WM, white matter. Data are given as medians with IQRs (interquartile ranges) in brackets. 1In these control dogs, the %Aβ area in the entire section (GM-WM) was used for statistical analyses. 2Statistical analysis was performed with one-sided, two-tailed, Mann-Whitney. 3Mann-Whitney, p = 0.05 for %Aβ area in GM versus WM in CCD dogs.
Modified Sholl’s analysis of Iba1+ microglial cell bodies and cellular processes
In order to assess the density of Iba1+ microglial cell bodies and microglial processes both in the neuropil areas overlapping and surrounding Aβ plaques and in neuropil areas between Aβ plaques in CCD (n = 7) and control dogs (n = 5) (Table 2 and Supplementary Table 1), a modified Sholl’s analysis was applied [31]. The analysis was performed in ImageJ and the plugin “Concentric Circles” was applied to place a grid consisting of five concentric circles on each image. The radius was increasing with 40μm for each circle. Images were captured on an Olympus BX 53 microscope mounted with an Olympus DP73 camera using a Visiopharm Integrator System (VIS) version 4.6.1.630. The number of Iba1+ cells and the number of intersections of Iba1+ microglial processes within the concentric circles were counted in six areas overlapping and surrounding Aβ plaques and six areas between Aβ plaques. Iba1+ microglia touching a circle were included in the smallest circle. The analysis was performed by two investigators, who were blinded to dog ID.
Definition of an Iba1+ microglial cell body
In the normal adult brain, microglia typically have an oval to elongated cell body containing a somewhat smaller oval to elongated nucleus, measuring about 10μm x 3μm [32, 33]. In the included sections, it was not possible to obtain a good counterstaining of the nucleus, which therefore remained unstained. Thus, the criteria for counting a microglial cell were: 1) an unstained nucleus surrounded by a rim of Iba1+ cytoplasm, or 2) an Iba1+ cell body with the dimensions of a microglial cell, in both cases with one or more Iba1+ cellular processes emanating from the cell body. In some dogs it showed to be difficult or not possible to distinguish between a transversely sectioned Iba1+ microglial cell body and the Iba1+ spheroid swellings, that were occasionally observed on the microglial processes. If unable to distinguish if the Iba1+ structure was a cell body or a spheroid, the Iba1+ structure was counted as a microglial cell every second time. Data are given as the average of the values obtained by the two investigators. Values were normalized prior to averaging.
Definition of an Iba1+ microglial process
Microglial processes were counted when transecting one of the concentric circles of the grid. Processes were counted regardless of the cell soma being present or not in the specific section.
Scoring of Iba1+ perivascular macrophage infiltrates
The density of infiltrates of Iba1+ perivascular macrophages [34] was scored in the subcortical white matter (controls, n = 5; CCD, n = 7). Scoring was done by three investigators, who were blinded to dog ID and disease status, by use of a Leica DMR, an Olympus BX41, and an Olympus BX45 microscope. The density was scored on a scale from 0–3, where 1 represented the perivascular macrophage infiltrate density observed in the control dog, 0 was given if perivascular macrophage infiltrate density was lower than in the control, 2 represented intermediate density, and 3 represented very high density of perivascular macrophage infiltrates. One representative control dog was used for baseline and not blinded. In addition, three blinded sections with the score 1 and three blinded sections with the score 3 were used for standardization of the scoring. A mean score was calculated and used for the graphic illustration and statistical analysis.
Statistics
Dog ages, CCDR scores, and %Iba1 and %Aβ areas are presented as medians with 25th and 75th percentiles or interquartile ranges (IQRs). Comparisons were performed using unpaired, two-tailed Mann-Whitney test, while Spearman’s correlation was used to test for the relation between categories. Data from Sholl’s analysis are presented as mean±SEM and analyzed by two-way ANOVA for the factors ‘disease status’ and ‘distance from center’, followed by Tukey’s post hoc analysis and unpaired, two-tailed Student’s t-test. Graphs were prepared by GraphPad Prism version 8.1.1, which was also used for the statistical analysis. Statistical significance was set as *p < 0.05. **p < 0.01, ***p < 0.001, ****p < 0.0001.
RESULTS
Aβ plaques are primarily present in the deep cortical layers
By microscopic evaluation, 6E10+ Aβ plaques could be observed in both CCD cases and controls (Fig. 1). Aβ plaques were primarily observed in the deep cortical layers V and VI (Fig. 1A, B, D, E). Aβ plaques were also detected in the more superficial layers IV, III, and II, but only rarely in layer I. Different types of plaques were observed, but larger diffuse plaques with a cloud-like morphology were predominant (Fig. 1C). In some dogs, these plaques appeared to have a denser center (Fig. 1F). No classic dense-core plaques with neuritic changes were observed. The size and number of plaques varied among dogs and one CCD dog and one control only had five Aβ plaques. Additionally, demarcated 6E10+ Aβ aggregates were occasionally observed, as 6E10+ Aβ deposits were in association with blood vessels representing cerebral amyloid angiopathy in both CCD dogs and controls (data not shown).
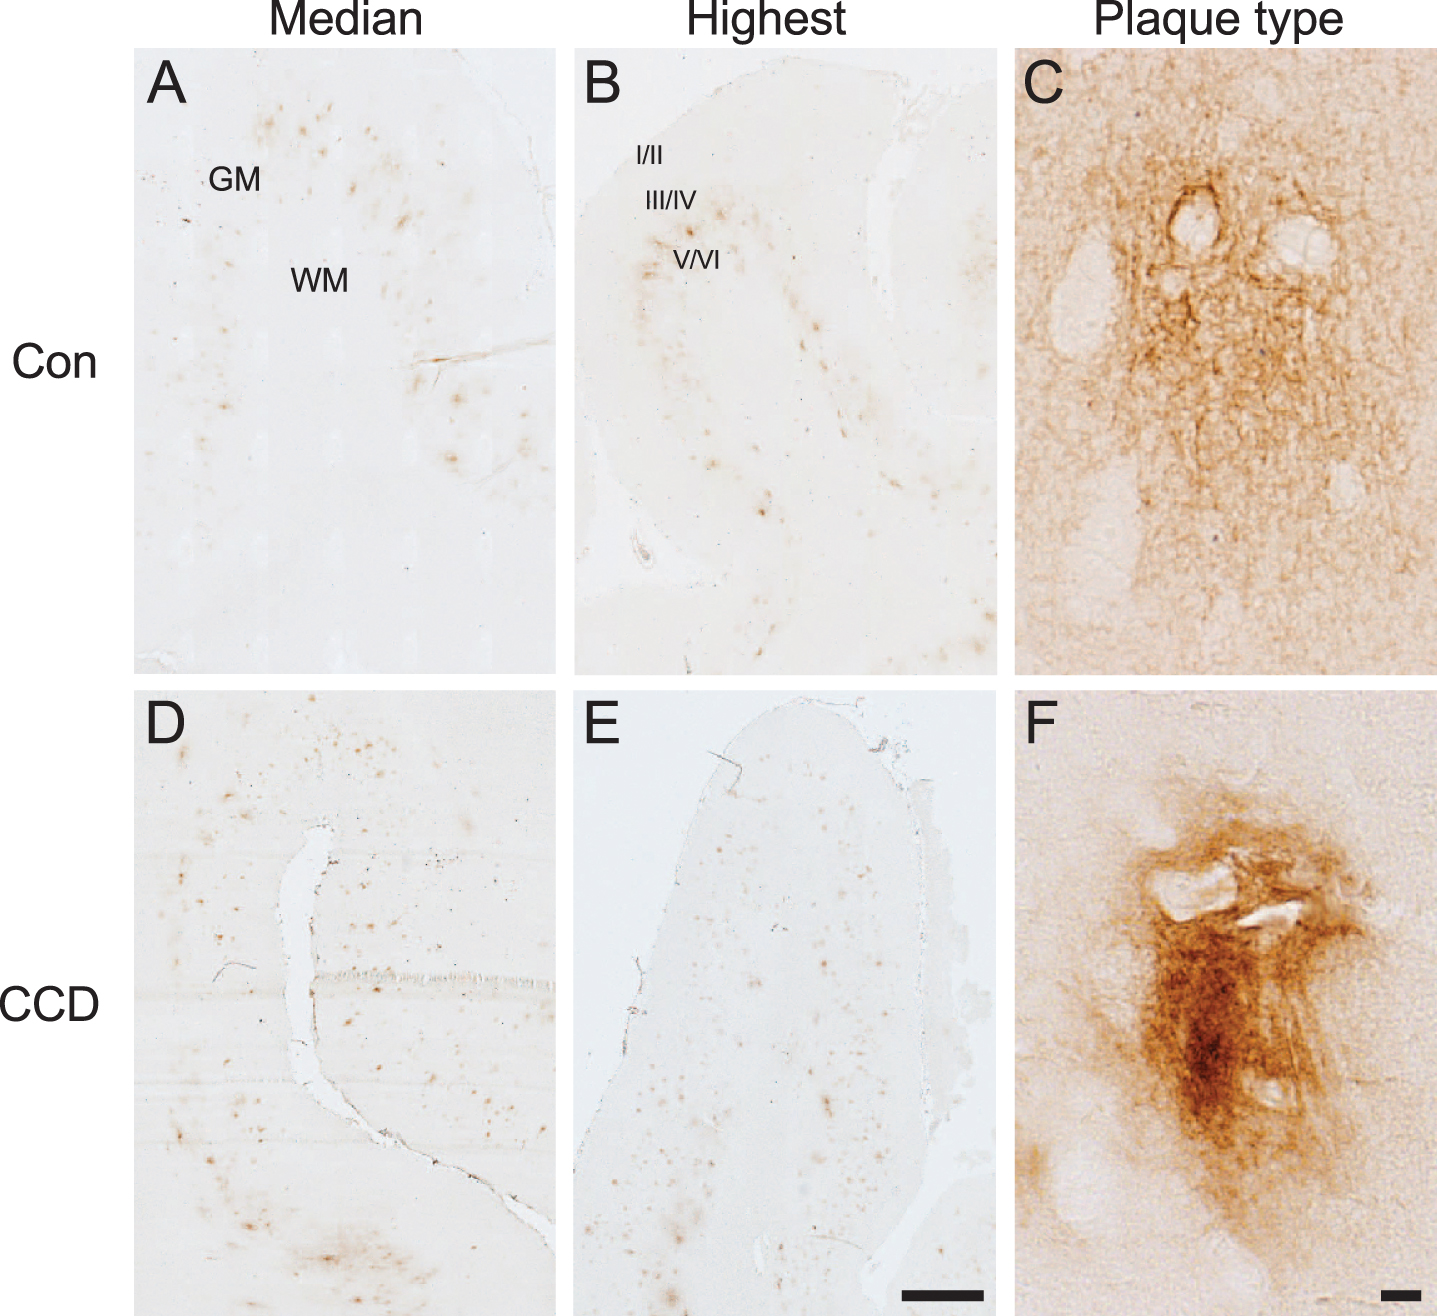
Aβ plaque appearance in frontal cortex of CCD and control dogs. Photomicrographs of 6E10+ Aβ plaques in control dogs (A, B, C) and dogs with CCD (D, E, F). A, B, D, E) Overviews showing sections representing the median Aβ plaque area (A, D) and the highest Aβ plaque area (B, E), based on the quantifications of the %Aβ area. The Aβ plaques were typically observed in cortical layer V and VI. C, F) Different Aβ plaque types were observed, including plaques with a cloud-like morphology (C), and plaques with a denser center (F). Note the unstained neuronally-shaped cells amidst the 6E10+ Aβ plaques in both C and F. GM, grey matter; WM, white matter; Con, control; I/II, layer I and II; III/IV, layer III and IV; V/VI, layer V and VI. Scale bars: 1000μm (A, B, D, E), 10μm (C, F).
Image analysis data were collected from the first seven enrolled CCD dogs and from the five control dogs (Table 2). For most control cases, the border between grey and white matter could not be distinguished with certainty, therefore the %Aβ area was assessed for the combined grey and white matter. For CCD dogs it was assessed separately for the grey matter and white matter (Table 2). Comparison of the %Aβ area in the combined grey and white matter between CCD dogs and control dogs showed no statistically significant difference (p = 0.11, Mann-Whitney) (Table 2). In the CCD dogs, the difference in %Aβ area between grey matter and white matter was marginally significant (p = 0.05, Mann-Whitney) (Table 2), thereby supporting the finding of the Aβ plaques being primarily present in the grey matter, and especially in the deep cortical layer V and VI.
Consistent with the absence of dense-core plaques among the 6E10+ Aβ plaques, we observed no thioflavin-S+ plaques in neither CCD nor control dogs, as opposed to the thioflavin-S+ plaques in the AD tissue (Supplementary Figure 1). We did see scattered thioflavin-S+ vessels in several brains, mainly in the meninges, occasionally also in cortex from both CCD and control dogs (Supplementary Figure 1).
Microglial response in the cortical grey matter and subcortical white matter
In cortical grey matter, microscopic evaluation indicated that the density of Iba1+ microglia increased through cortical layer I-VI, in both CCD and control dogs (Fig. 2A). In CCD dogs, there was a tendency towards the microglia being hypertrophic, making the microglial cell bodies and processes more visible (Fig. 2A, D, top). Additional signs of microglial activation included microglial rod cell transformation, and the occurrence of spheroid swellings reminiscent of phagocytic pouches, which could be observed in both CCD dogs and controls (Fig. 2D, bottom). Occasional aggregates of hypertrophic microglia could also be observed regardless of disease status (not shown).
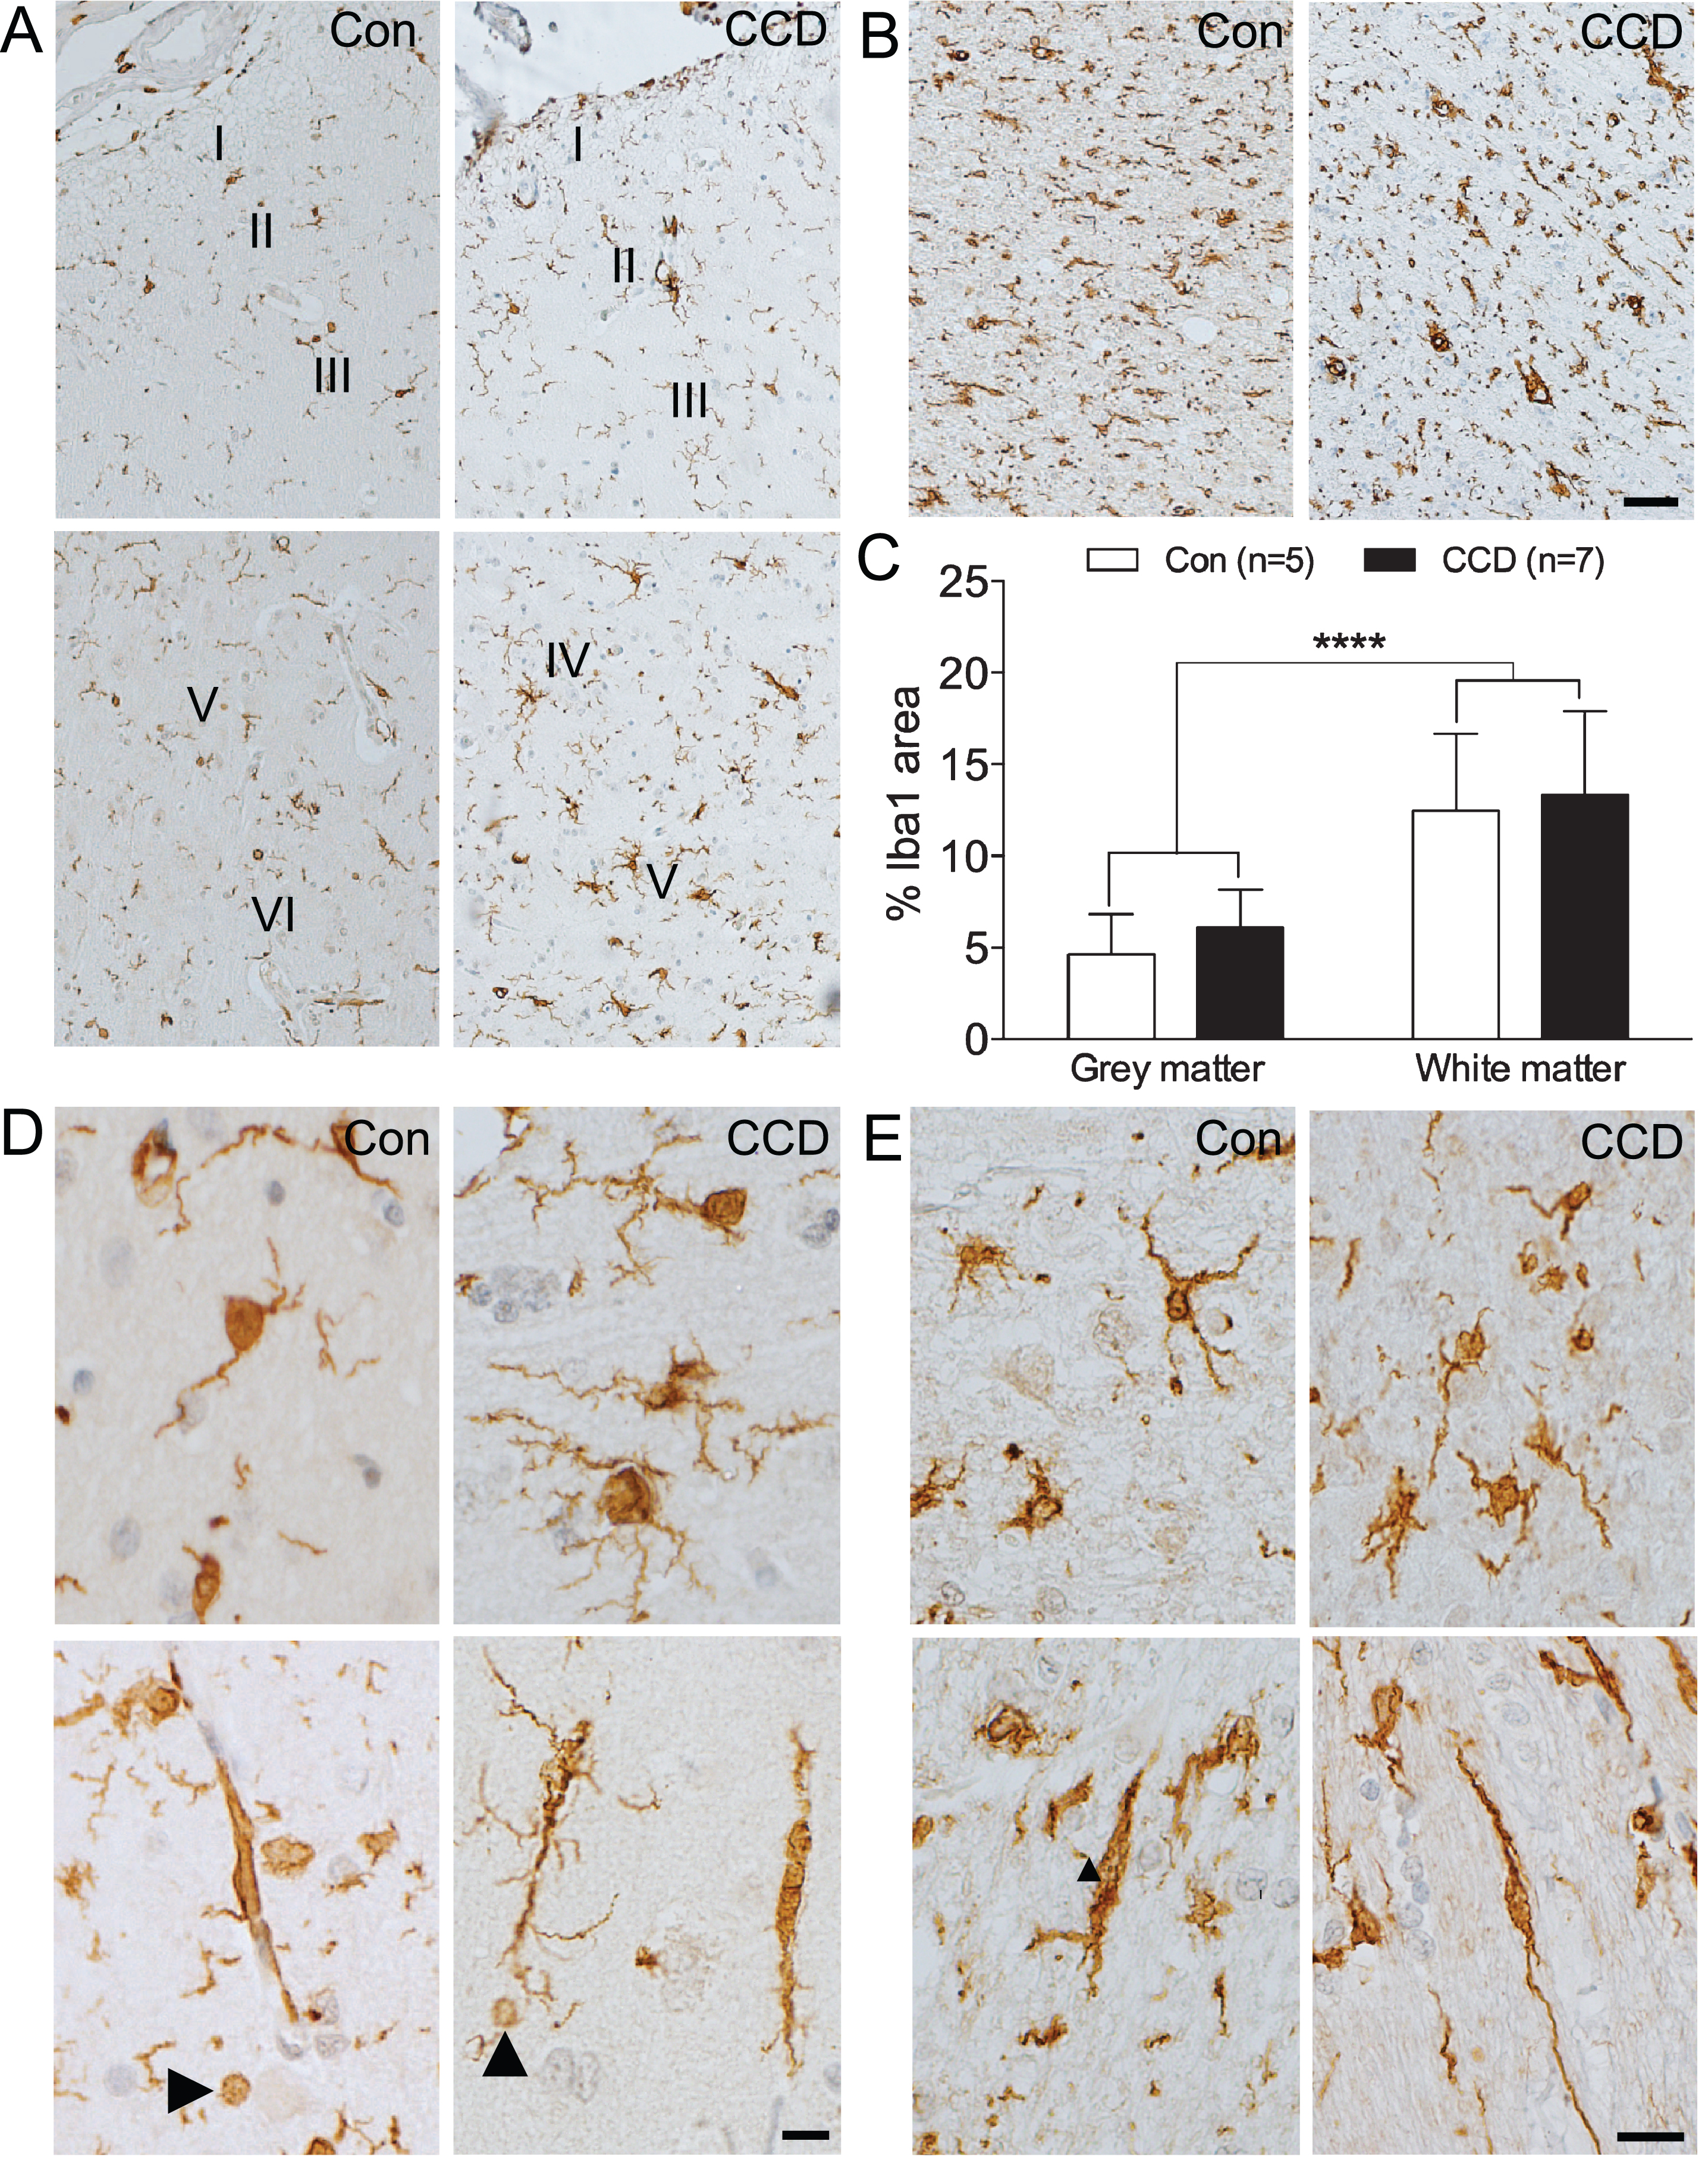
Microglial response increases through cortical layers and in subcortical white matter. Microglia were visualized by immunohistochemical staining for Iba1. A, B) Microglial density increases with the cortical layer (A) and is even higher in the subcortical white matter (B) in both control and CCD dogs. C) Bar diagram illustration of the %Iba1 are in grey and white matter in control (n = 5) and CCD dogs (n = 7) (see text for details). p < 0.0001, Mann-Whitney. Bars indicate medians and error bars the 25th and 75th percentiles. D) Ramified microglia (top) and microglial rod-cells (bottom) in cortical grey matter in control and CCD dogs. Arrowheads point at Iba1+ microglial spheroids. E) White matter microglia in control and CCD dogs. Microglia with a rod-like morphology (bottom). Con, control; I-VI, layer I-VI. Scale bars: 50μm (A, B), 20μm (D, E).
In the white matter of the CCD dogs, the microglia appeared less uniformly distributed compared to the control dogs (Fig. 2B, E, top). Rod-like, longitudinally branched microglia were observed in both CCD and control dogs (Fig. 2E, bottom). Noticeably, the density of Iba1+ microglia in the white matter appeared higher than in the grey matter, in both CCD dogs and controls (compare Fig. 2B with Fig. 2A).
Comparison of the %Iba1 area measured by image analysis showed no difference between CCD and control dogs, in neither grey matter (p = 0.20, Mann-Whitney) nor white matter (p = 0.64, Mann-Whitney) (Table 2, Fig. 2C). In line with the microscopic analysis, the %Iba1 area in the white matter was significantly higher than in the grey matter in both control and CCD dogs (p < 0.0001, Mann-Whitney, n = 12/group) (Fig. 2C).
Microglial response in the Aβ plaque-loaded deep cortical layers
A modified Sholl’s analysis was used to examine whether and how the microglia in layer V and VI responded to the Aβ plaques in CCD and control dogs (Fig. 3A, B). As shown in Fig. 3C, the number of Iba1+ microglia was overall slightly higher in the CCD dogs at all distances, which was confirmed by the two-way ANOVA showing an effect of disease status [F(130,12) = 7.35, p = 0.0001], and, as expected, of the distance from the center [F(130,4) = 17.35, p < 0.0001], on the number of Iba1+ microglia (Fig. 3C). Post-hoc test showed that the number of Iba1+ microglia in the outer circle between 160μm and 200μm surrounding Aβ plaques in CCD dogs was higher than surrounding Aβ plaques in controls (p < 0.05, Tukey’s) (Fig. 3C). Focusing on the CCD dogs, there was no statistically significant difference in the number of Iba1+ microglia in any of the circles surrounding Aβ plaques compared to the circles between Aβ plaques (p > 0.05, all comparisons, Tukey’s) (Fig. 3C). Overall, the total number of Iba1+ microglia counted in the CCD dogs was 31 %higher than in controls, which was statistically significant (Student’s t-test, p < 0.05) (Fig. 4A).
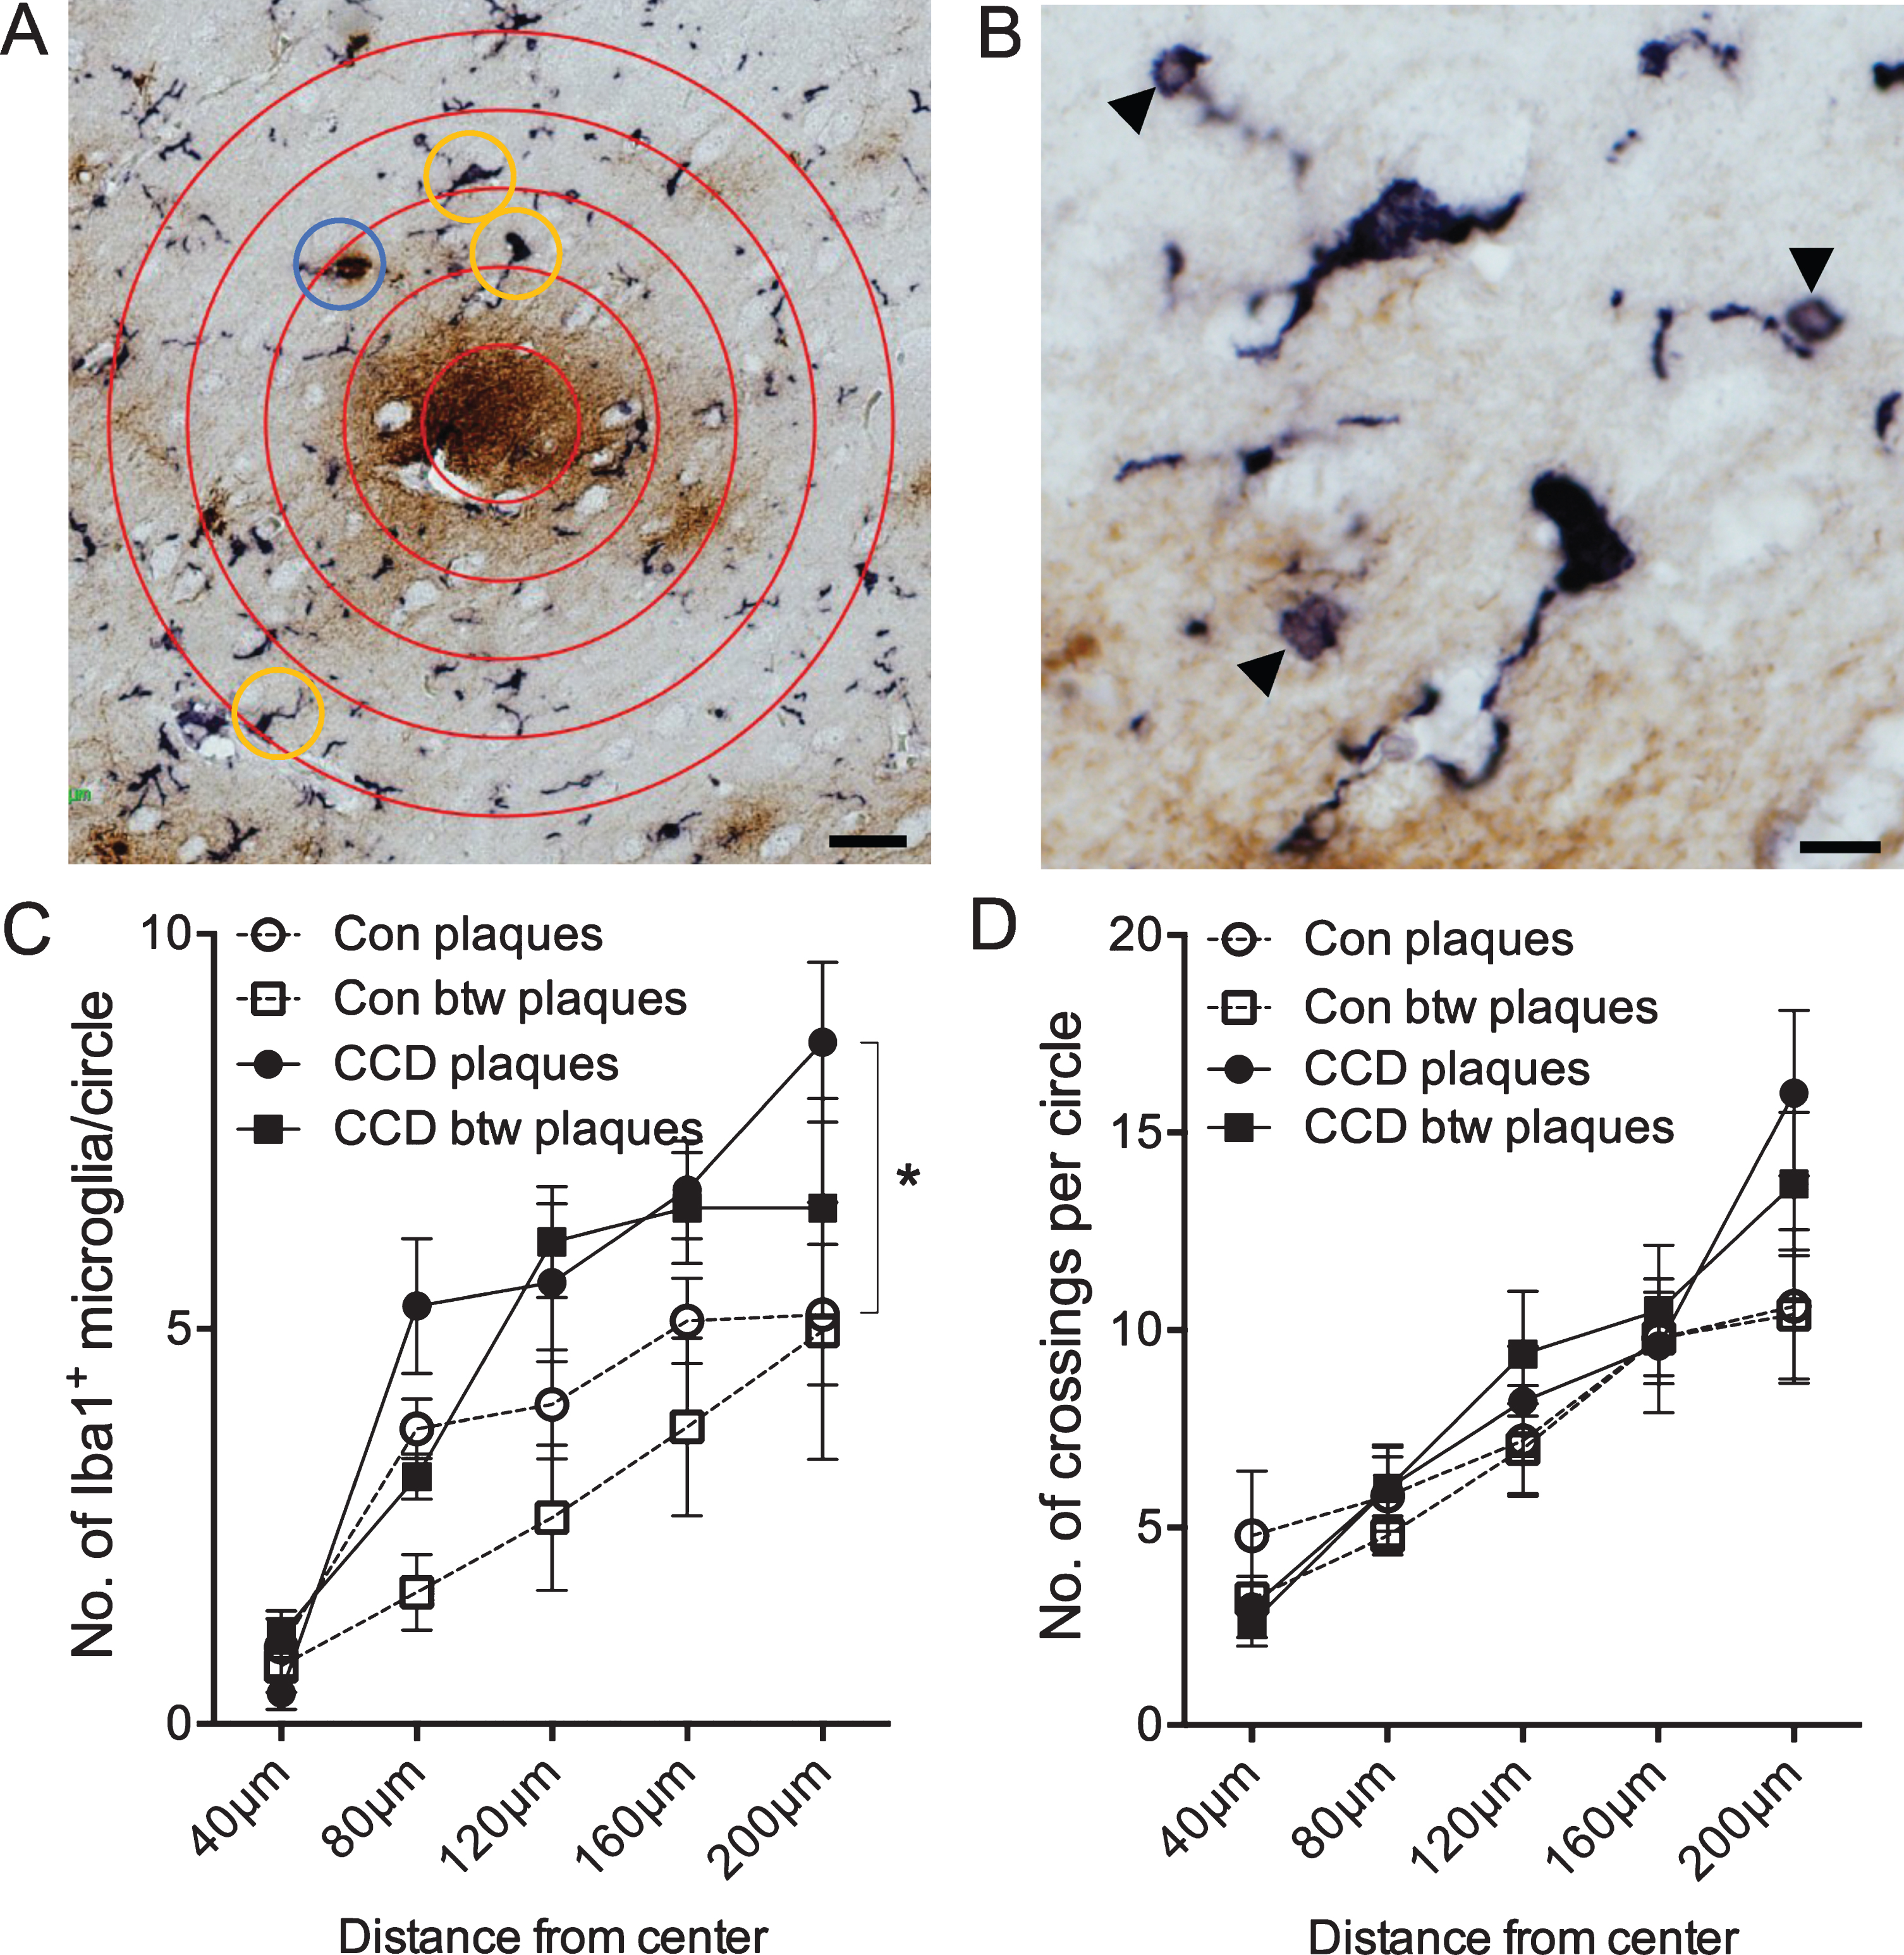
Microglial response to Aβ plaques depends on disease status and distance from center of plaque. Double chromogenic staining for microglia (Iba1, bluish-black) and Aβ (6E10, brown). A) Sholl’s analysis was used to determine differences in microglial response in neuropil areas surrounding plaques and between plaques (not shown). Yellow circles indicate Iba1+ microglial cells that were counted. The blue circle indicates an Iba1+ structure, that was only counted every second time, as investigators were doubt if the structure was a microglial cell. B) Higher magnification of the two microglia in the upper part of image A. Arrowheads point at Iba1+ microglial spheroids. C) Number of Iba1+ microglia in the circles surrounding plaques or in plaque-free areas (between (btw) plaques) in control dogs and dogs with CCD. p < 0.05, Tukey’s post-hoc. D) Number of crossings between Iba1+ microglial processes and the circles surrounding plaques or in plaque-free areas (btw plaques) in control dogs and dogs with CCD. Data-points show the means, and error bars show the SEM-values. Con, n = 5; CCD, n = 10. *p < 0.05, Student’s t-test. Scale bars: 40μm (A), 10μm (B).
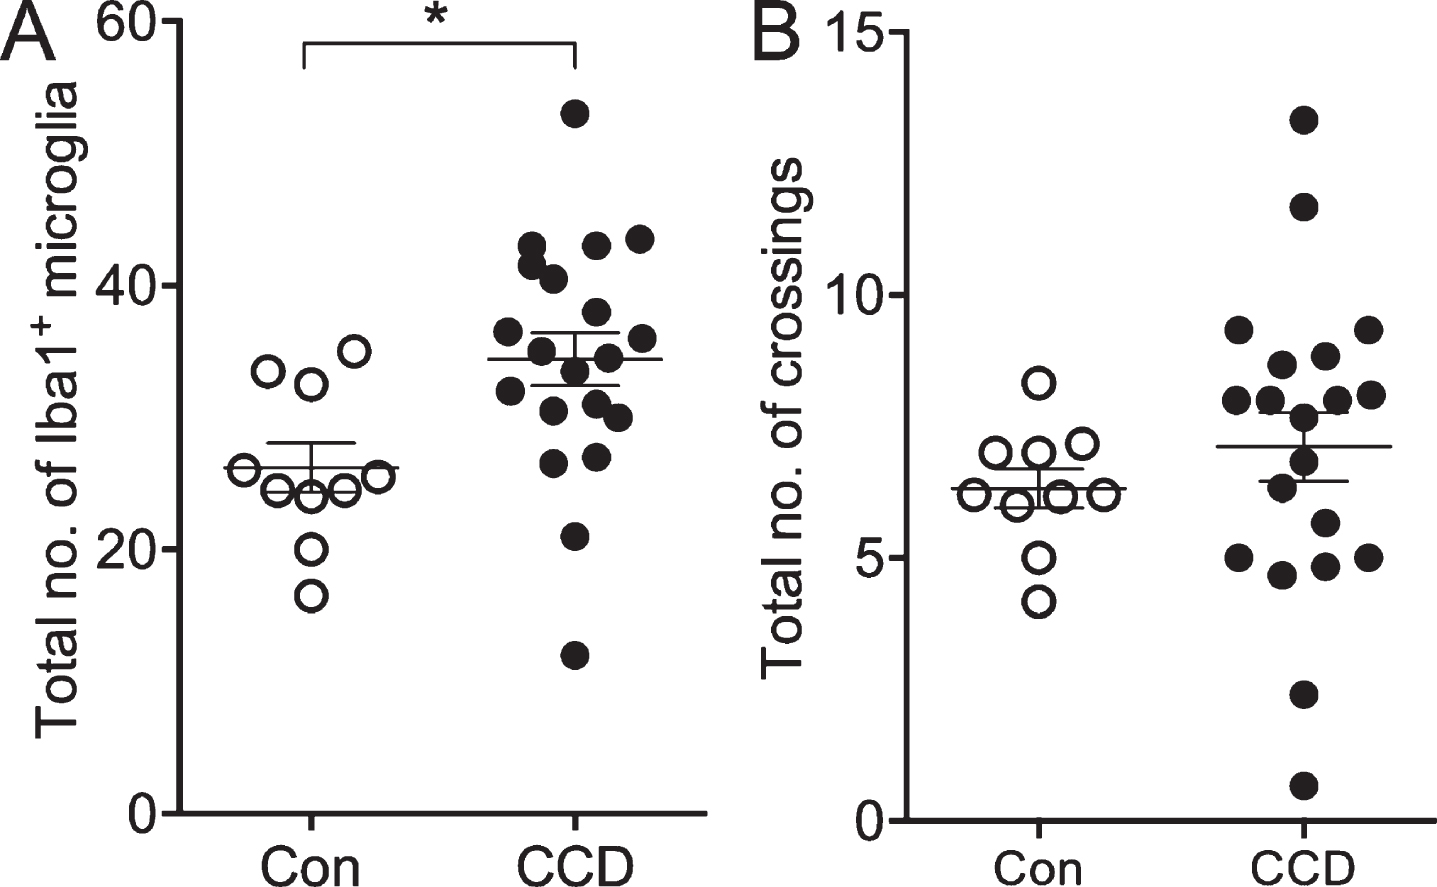
The number of microglia, not the number of crossings by microglial processes, correlates with disease status. A) The total number of Iba1+ microglia within the circles surrounding 6E10+ Aβ plaques and in circles between Aβ plaques. B) The total number of crossings of the Iba1+ microglial processes with circles surrounding Aβ plaques and circles between Aβ plaques. Con, n = 5; CCD, n = 10. *p < 0.05, Student t-test.
The coverage of the microglial processes given by the number of crossings of the Iba1+ microglial processes with the concentric circles showed no effect of disease status [F(130,3) = 1.0, p = 0.40], but, as expected, an effect of the distance to center [F(130,4) = 20.99, p < 0.0001] (Fig. 3D). No difference was observed when comparing the total number of crossings (Student’s t-test, p > 0.05) (Fig. 4B).
Altogether, the results from the Sholl’s analysis demonstrate a general approx. 30%increase in the number of Iba1+ microglia, and an unchanged coverage of Iba1+ microglial processes in layer V and VI of CCD cases compared to controls. The results also demonstrate an absence of microglial aggregation around the Aβ plaques both in CCD dogs and in controls.
Nature of microglial Iba1+ spheroid swellings
The double staining for Iba1 and Aβ allowed a detailed examination of the Iba1+ spheroid swellings on the microglial processes in both CCD and control dogs. Although observed on microglial processes in close association with the Aβ plaques, it could not be determined whether the spheroids also stained for Aβ (Fig. 3B). Assuming that the spheroid swellings might represent phagolysosomal structures, we also stained the dog brain tissue using the KP1 and PG-M1 clones for human CD68, including sections of human brain tissue as control. Both clones visualized microglial lysosomal structures in the human tissue, as expected, with the KP1 staining being superior to the staining with the PG-M1 clone (Supplementary Figure 2). The dog tissue remained unstained, regardless of the antibody used (Supplementary Figure 2).
Relation between CCDR score, Aβ pathology, and microglial response in the cortex
Next, we examined the potential relation between the CCDR score, the %Aβ area, and the %Iba1 area in the cortex of the CCD dogs (Table 2). The CCDR score neither correlated with the %Aβ area (Fig. 5A) nor the %Iba1 area (Fig. 5B) (p = 0.82 and p = 0.78, respectively, Spearman). Additionally, the CCDR score did not correlate with the number of Iba1+ microglia in cortical layers V and VI (p = 0.60, Spearman) (data not shown), and neither did the %Iba1 area correlate with the %Aβ area (p = 0.35, Spearman) (Fig. 5C).
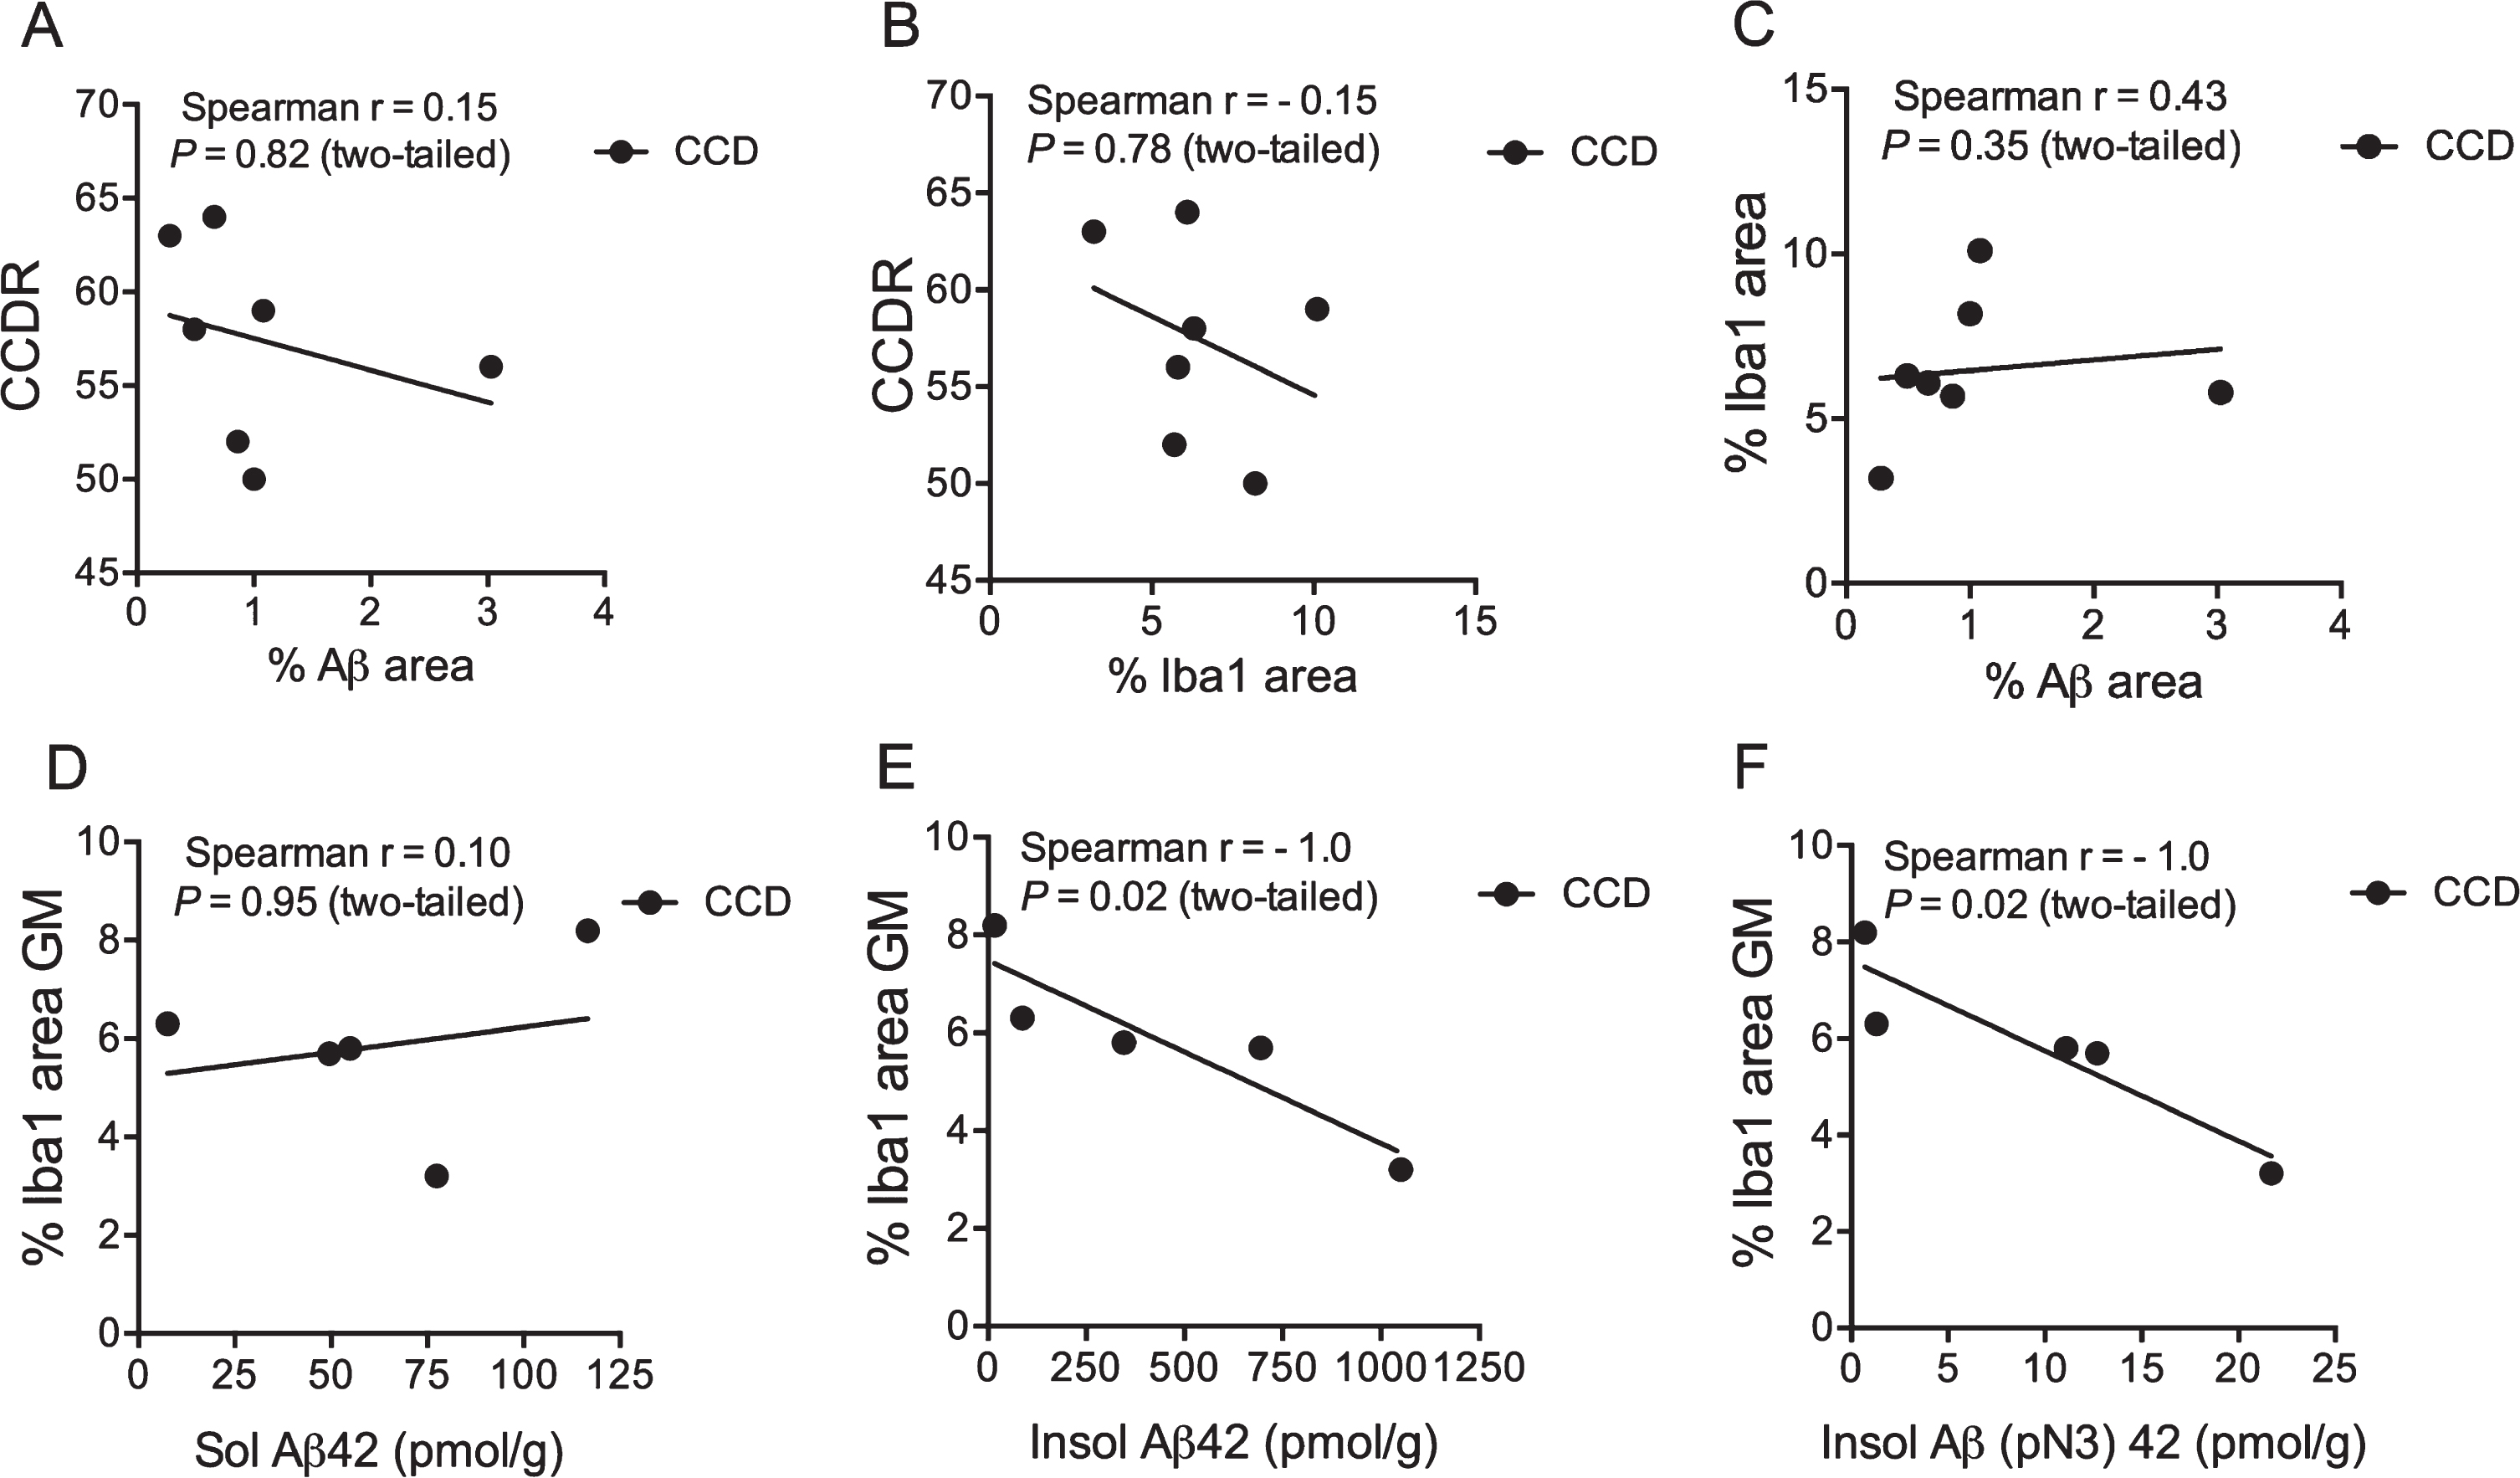
Microglial response correlates with insoluble Aβ42 and Aβ(N3pE)-42. A-C) Correlation analysis showed no correlation between the CCDR score for CCD dogs and the %Aβ area (A), or the %Iba1 area (B). Neither did the %Iba1 area correlate with the %Aβ area (C). D-F) No correlation was observed when comparing %Iba1 area in grey matter with soluble Aβ42 (D), but the %Iba1 area in grey matter correlated with the insoluble Aβ42 level (E) and Aβ(pN3)42 (F). p = 0.02, both datasets, Spearman.
Relation between microglial-macrophage response and insoluble Aβ42 and Aβ(N3pE)-42
Schütt et al. [15] previously reported on the presence of soluble and insoluble Aβ42, and insoluble N-terminal pyroglutamate modified Aβ (Aβ(pN3)-42 (pmol/g)) in the prefrontal cortex of CCD dogs. The %Iba1 area was therefore correlated to the Aβ42 values from the study by Schütt et al. [15] for the five CCD dogs (TRSC 5, 6, 7, 16, and 19) that had both analyses performed. The %Iba1 area in the cortical grey matter of these dogs was found to correlate to the insoluble Aβ42 and insoluble (pN3)–42 (p = 0.02, both datasets, Spearman) (Fig. 5E, F), but not to soluble Aβ42 (Fig. 5D). Additionally, there was no correlation between the total number of Iba1+ microglia in layer V and VI and the levels of soluble Aβ42 and insoluble Aβ42 and Aβ(pN3)–42 in the same dogs (data not shown).
Perivascular macrophage infiltrates are abundant in the subcortical white matter
Blood vessels surrounded by Iba1+ perivascular macrophages were abundant in the subcortical white matter in both CCD dogs and controls (Fig. 6A-D), while they were either rare or absent in the cortical grey matter (compare with Fig. 2A). There was a tendency toward a higher density and a more uneven distribution of perivascular macrophage infiltrates in CCD dogs compared to controls (Fig. 6A, B). Furthermore, comparison of scores for perivascular macrophage infiltrates in subcortical white matter in CCD versus control dogs showed a statistically marginally higher perivascular macrophage score (p = 0.06) (Fig. 6E). The scores for grey matter perivascular macrophage infiltrates were comparable in CCD and controls (data not shown).
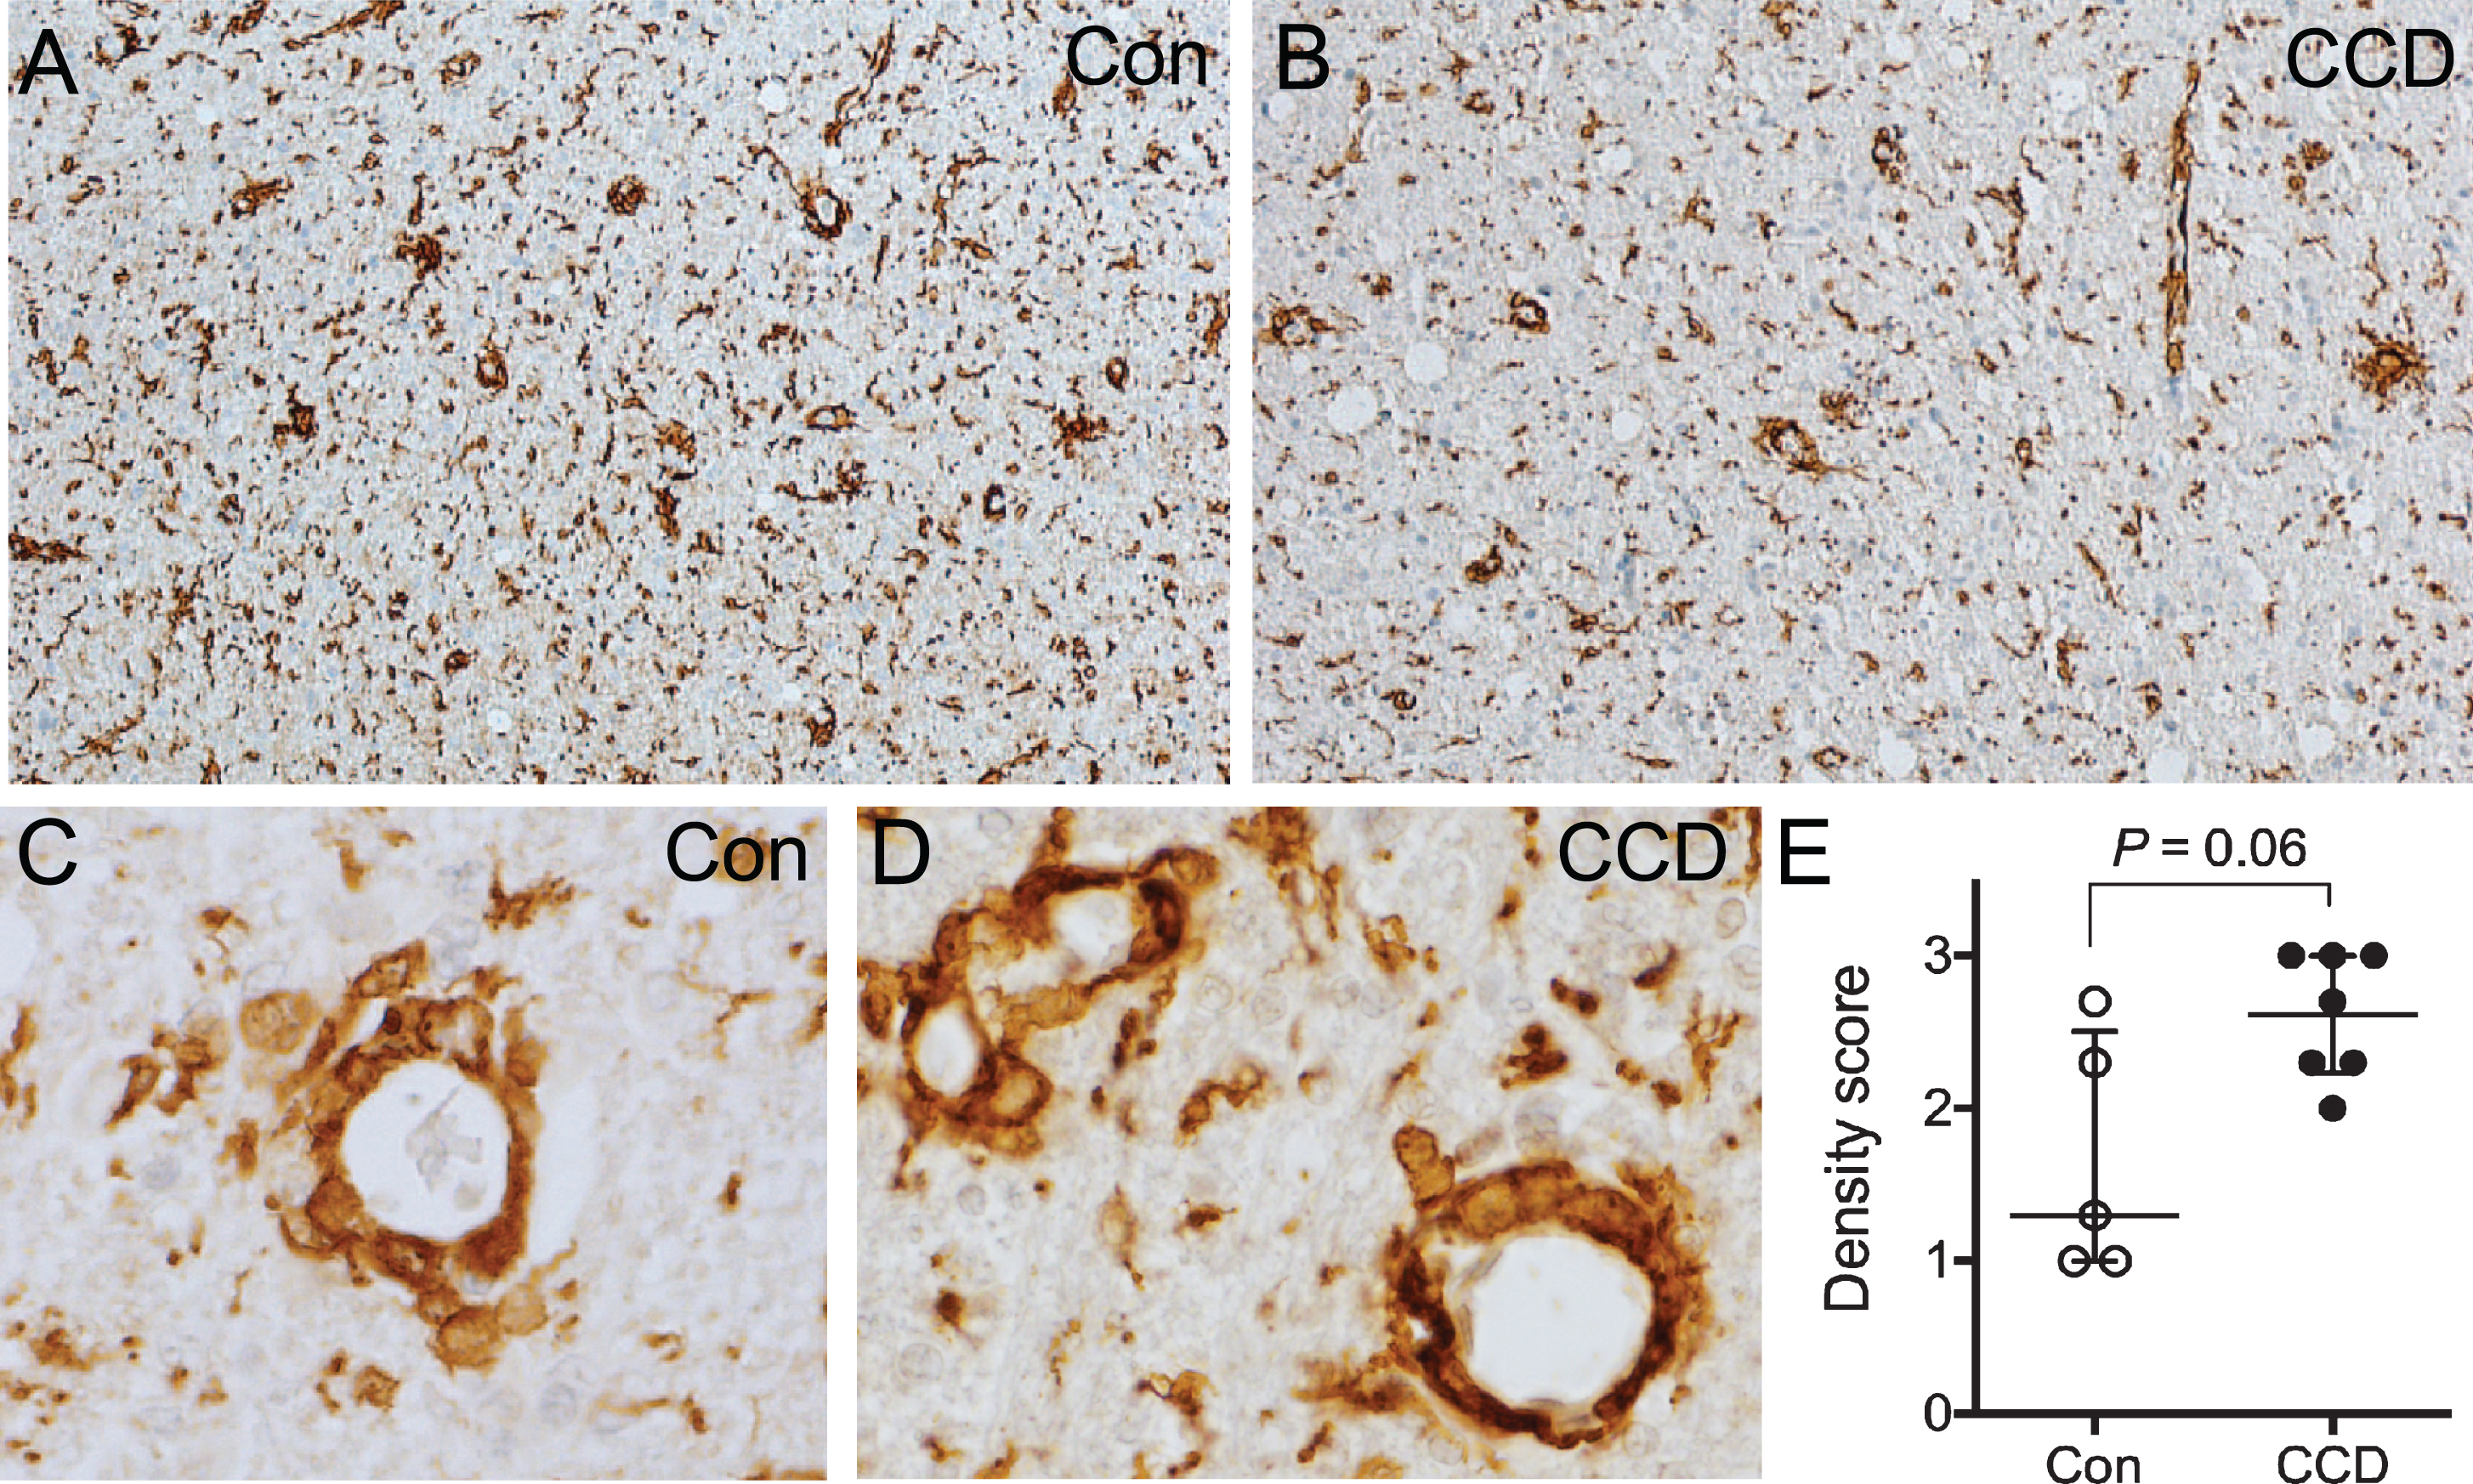
Perivascular macrophage infiltrates in the subcortical white matter. A, B) Overview of the subcortical white matter showing Iba1+ perivascular macrophages in a control dog (A), and a CCD dog (B). C, D) High magnification of vessels surrounded by Iba1+ perivascular macrophages in a control dog (C) and a CCD dog (D) in subcortical white matter. E) Scoring of Iba1+ perivascular macrophages in subcortical white matter revealed a tendency towards a stronger perivascular macrophage infiltration in CCD dogs (Mann Whitney, p = 0.06). Con, n = 5; CCD, n = 7.
Distribution of phosphorylated tau in CCD and controls dogs
Finally, we performed an immunohistochemical staining for NFT pathology using the AT8 antibody recognizing the S202 and T205 phospho-epitopes and the EPR2731 antibody recognizing the S396 phospho-epitope on human tau (Fig. 7 and Supplementary Figures 3 and 4). Some of the dogs were previously shown not to contain AT8+ NFTs and neuropil threads [15]. These dogs remained unstained, as did the remaining dogs (Supplementary Figure 3A), whereas the AD tissue contained abundant AT8+ NFTs and neuropil threads (Supplementary Figure 3B). In comparison, the S396 antibody gave a distinct visualization of fiber-like structures in the subcortical white matter extending into layers VI and V, in most of the CCD and most of the control dogs (Fig. 7A). In several dogs, both CCD and controls, a faint staining of neuronal- and oligodendrocyte-like cells in the deep cortical layers was also observed, and in two control dogs, the white matter oligodendrocytes were very intensely stained (Fig. 7A). This staining pattern should be compared to the S396 staining of the AD tissue (Fig. 7B), which was comparable to the staining for AT8 (Supplementary Figure 3), showing abundant NFTs and neuropil threads in the cortex.
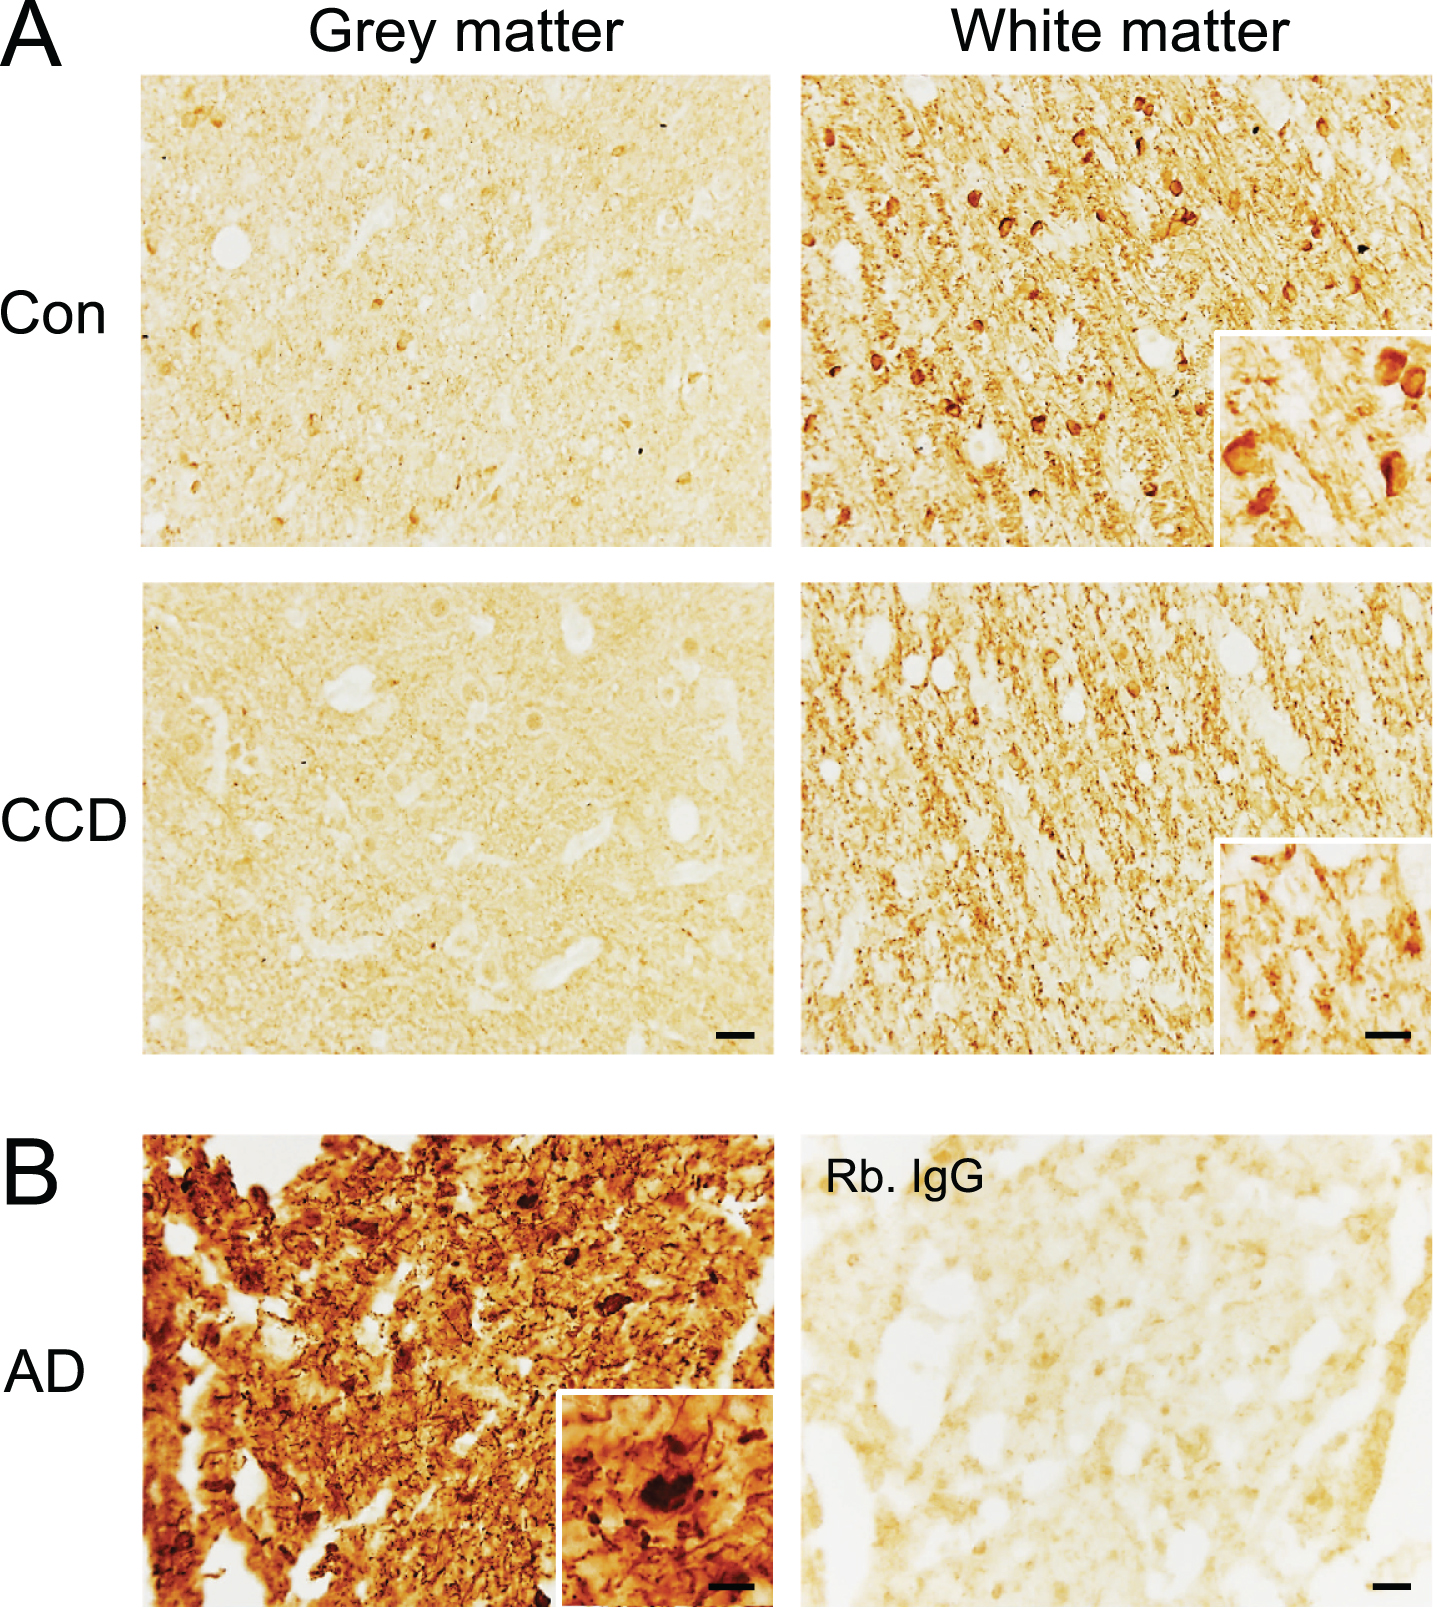
Phosphorylation of the S396 phospho-epitope of tau in white matter in the frontal cortex of CCD and control dogs. Sections of frontal cortex from CCD and control dogs (A) and AD patients (B) stained for S396. A) Phosphorylation of S396 tau was observed as a fiber-staining in the subcortical white matter, while a fainter signal was observed in the grey matter. A dense signal also observed was oligodendrocyte-like cells (inserts) in some dogs. Rabbit IgG controls shown in Supplementary Figure 4 were blank. B) Hyperphosphorylated S396 tau in AD grey matter showing typical neuropil threads and NFTs (insert). Rabbit IgG is almost blank. AD, Alzheimer’s disease; CCD, Canine cognitive dysfunction; Con, control. Scale bars: 20μm (inserts: 10μm).
DISCUSSION
Aged dogs with CCD express a clinical phenotype and neuropathological features that in many aspects correlate to prodromal sporadic AD. The present study focused on the microglial response in the prefrontal cortical grey matter and subcortical white matter in dogs with CCD compared to age-matched controls. A main finding was a general increase in the number of microglia in the deep cortical layers V and VI, which, as previously reported by us and others, also contained the majority of the Aβ plaques [15, 35]. Of note, this increase was observed in the absence of microglial aggregation around the Aβ plaques, which is otherwise reported to occur both in AD and in mouse models of AD [10, 37]. Although statistically significant, the approximately 30%increase in microglial numbers in layers V and VI of CCD cases was obviously too small to impact the %Iba1 area, which was recorded for the entire cortex and found similar in CCD cases and controls. These findings are consistent with a low-grade activation of the microglia especially in the Aβ plaque-loaded layers V and VI.
An additional interesting finding was the correlation between the %Iba1 area in cortical grey matter and the levels of insoluble Aβ42 and post-translationally modified Aβ(pN3)–42 in the prefrontal cortex, previously quantified by enzyme-linked immunosorbent assay (ELISA) and shown to co-localize with Aβ plaques in the five CCD dogs that were investigated in the previous and present study by our group [15]. In our former study, Aβ(pN3)–42 was shown to occur mainly in the condensed type of plaques. Aβ(pN3)–42 could be observed in walls of leptomeningeal blood vessels and, more rarely, in the walls of cortical blood vessels [15]. Aβ(pN3)–42 also co-localizes with Aβ plaques in AD, where Aβ(pN3)–42 has been suggested to increase tau hyperphosphorylation and tau-dependent neurotoxicity [38, 39]. Aβ(pN3)–42 was recently found to be abundant in Aβ40-containing coarse-grained plaques especially in people with early onset, familiar AD, and shown to be associated with intense neuroinflammation and vascular pathology in AD [40].
The absence of microglial aggregation around the Aβ plaques in the CCD dogs is different from the aggregation that can be observed around plaques in AD [36, 37] and in transgenic mouse models of AD [12, 41–43]. A plausible explanation is that the Aβ plaques observed in the dogs were of the diffuse type as previously reported [15, 35]. Classical dense-core plaques were not observed and are not a hallmark of CCD [15, 35], likely reflecting that CCD better mirrors prodromal than end-stage AD. Both in AD [36, 37] and in mouse models of AD [12, 43], the aggregation of microglia typically occurs around the dense-core plaques. Studies of transgenic mice modelling familial early onset AD mainly points to that Aβ deposition into plaques induces microglial activation [12, 44], indicating that substances released from the plaques, and/or the physical injury induced by the plaques, attract and activate the microglia [45, 46]. At the same time, however, Aβ plaque-associated microglia have also been reported to produce AβPP [26, 47] and suggested to actively contribute to Aβ accumulation [48].
The analysis of the sections double stained for Iba1 and Aβ showed that the microglial processes were carrying spheroid swellings reminiscent of phagocytic pouches. We previously reported on the occurrence of 6E10+ Aβ-containing microglial phagocytic pouches in the cortex of APPswe/PS1ΔE9 transgenic mice [26]. Microglial clearance of Aβ is in general known to take place through receptor mediated phagocytosis (fibrillar Aβ) or fluid-phase pinocytosis (soluble Aβ) [49]. Upon ingestion of fibrillar Aβ into the phagosomes, these structures fuse with protease-containing lysosomes [22, 50], leading to the degradation of Aβ. The absence of 6E10+ Aβ within the microglial spheroids observed in layers V and VI may be explained by insufficient sensitivity of the chromogenic double staining. We previously reported the presence of Iba1+ spheroid swellings and CD68+ lysosomes in frontal cortex tissue from AD cases [26], which were similar in size to the Iba1+ spheroids observed in the present study. This suggests that at least some of the microglia in layers V and VI were indeed phagocytically active in the CCD dogs. However, as the Iba1+ spheroids were also observed in the controls, more studies are required to elucidate on the pathophysiological significance of these structures.
As the dogs included in this study were not experimental animals, but family-owned dogs that were not euthanized until the condition had progressed to a stage significantly impacting quality of life, it was not possible to isolate effects on microglia that were attributable to the process of aging. Still, an observation, which may relate to aging, is that %Iba1 area in the subcortical white matter is significantly higher as compared to the grey matter in both CCD dogs and controls. This is in line with the demonstration of an age-dependent increase in microglial activation given by their expression of major histocompatibility complex class II antigen (HLA-DR) and CD68 already in middle-aged people [51]. This was also detectable by positron emission tomography (PET) imaging using [11C]-(R)-PK11195, a ligand that binds to the low affinity benzodiazepine receptor, which is upregulated in activated microglia [51]. Imaging studies of AD patients have shown that white matter changes correspond to rapid cognitive decline in patients with prodromal AD [52, 53], and that preclinical young study participants known to carry mutations for early-onset autosomal-dominantly inherited AD can have a regionally selective white matter degeneration years before symptom onset associated with microglial activity [54]. Furthermore, postmortem studies report a higher microglial activity in the white matter of entorhinal and temporal regions in patients with early compared to late onset sporadic AD [55], and further show that the microglial activity in sporadic AD resembles that observed in aged patients with clinically silent AD [51]. In combination, this suggests a disease-effect, on top of an age-effect, in AD [55].
Although, a larger percentage of the subcortical white matter was occupied with Iba1 immunoreactivity than was the case for the grey matter in both CCD dogs and controls, it is to our knowledge not known, if this translates into a higher density of microglial cells in the white matter. It has been estimated for mice that the proportion of microglia is 5%when compared to other cell types in the cortex as well as in the corpus callosum [56]. Morphologically, several microglia in the white matter of the dogs participating in the present study were longitudinally branched cells, as compared to the radial arrangement of cellular processes characteristic of the microglia in the cortex of the same dogs. The white matter microglia thereby showed morphological resemblance with the microglial rod cells in the cortex, that were observed in the grey matter of some CCD dogs and some controls and which is considered to reflect selective neuronal degeneration [57]. White matter microglia have been shown to be longitudinally branched also in the white matter of normal 3-month-old mice [56], meaning that this morphology neither can be attributed to neurodegeneration nor aging.
Perivascular macrophages represent a field of increasing research interest. Microscopic evaluation gave the impression of stronger perivascular macrophage infiltration in the subcortical white matter of CCD dogs compared to controls, and the statistical analysis revealed a tendency (p = 0.06) toward more abundant perivascular macrophage infiltrates in CCD dogs. Inclusion of more dogs, in particular control dogs might strengthen this observation. In mouse models of AD, perivascular macrophages in the cortical grey matter have been reported to contribute to the clearance of the Aβ deposits along the vasculature, but also to contribute to neurovascular dysfunction due to production of reactive oxygen species [58, 59] and to accelerate dysregulation of the blood-brain barrier [59]. Having the aforementioned studies in mind, we carefully evaluated the subcortical white matter for Aβ deposits as evidence of cerebral amyloid angiopathy, which was not observed in neither CCD nor control dogs, in spite of abundant perivascular macrophage infiltrates. Considering the reason for perivascular macrophage infiltrates in the dogs, it is tempting to attribute the infiltration to underlying infectious etiology. However, there were no clinical or paraclinical indications that neither the CCD nor the control dogs had infectious or non-infectious diseases that could have influenced the results.
We found no correlation between cognition and the %Aβ area. This result is consistent with our previous study and other studies in dogs [15, 60], but contradicted by others [20, 62]. Our findings are in accordance with studies on humans reporting that cognitive decline in AD is not related to the Aβ load [36, 63]. We also investigated a possible association between microglial activation and cognitive status in dogs with CCD and found no correlation. To our knowledge only two studies have previously investigated this, where one confirmed an association whereas the other did not [24, 64]. In patients with AD, it has been found that microglial activation determined by PET imaging using [11C]-(R)-PK11195 and quantitative morphometry of CD68+ microglia in the temporal cortex correlates with cognitive decline, while amyloid load does not [36, 63]. In the present study, Iba1, not CD68, was chosen for investigations, as Iba1 allows high quality visualization of the microglial cell body and the microglial processes [25]. Interestingly, the human orthologue of Iba1, allograft inflammatory factor 1 (Aif1), is involved in innate immune networks featuring several GWAS-established risk genes of AD [65]. Aif1 is one of several genes associated with the dynamics of the microglial actin cytoskeleton which is affected by aging in humans [66].
Classical NFTs and neuropil threads have not been observed in the majority of studies using immunostaining with anti-tau antibodies, including the AT8 antibody recognizing the S202 and T205 phospho-epitopes, or Gallyas silver staining (reviewed by Schutt et al. [15]). However, a recent study provided quantitative documentation of hyperphosphorylation of tau at the S396 phospho-epitope in axons, neurons, and oligodendrocytes in dogs with CCD as compared to age-matched controls [67], thereby significantly adding to earlier reports of a diffuse staining of neurons and astrocytes [19, 68]. In our study, we observed distinctly stained S396+ fiber-like structures especially in the white matter, which in some dogs occurred in parallel with a distinct staining of oligodendrocyte-like cells, while neuronal somata in grey matter were less distinctly stained. The S396 phospho-epitope is hyperphosphorylated relatively early in AD compared to the S202 and T205 phospho-epitopes, which are hyperphosphorylated at more progressed disease stages [69–72]. As observed in the present study, the staining patterns with the S396 and AT8 antibodies are almost indistinguishable in grey matter in tissue sections from AD patients, both showing abundant neuropil threads and NFTs. Taken together, the available information points toward the presence of neuronal axons with hyperphosphorylated tau potentially being involved in prelesion axonal dysfunction in the dogs developing CCD.
The present study had several limitations, the most obvious being the limited number of dogs and the limited number of brain sections examined in both CCD cases and controls, thus having a negative impact on the power. The subjectiveness of the criteria used for the scoring of the density of perivascular macrophage infiltrates posed another limitation, which we tried to meet by having three separate investigators to blindly carry out the scoring. Additionally, the use of thicker sections would have allowed a more sophisticated analysis of microglial morphology, potentially revealing differences in microglial soma size and in the branching of the microglial processes in CCD and control dogs, that could not be investigated in the 4-5μm thick sections used in the present study. Finally, the interaction between the microglia and post-translationally modified Aβ(pN3)-42 and the significance of the phosphosite-specific phosphorylation of tau in CCD and control dogs require further investigation.
CONCLUSIONS
Due to similarities in clinical manifestations and neuropathology, dogs with CCD are of interest as a model of prodromal sporadic AD. We investigated microglial-macrophage responses in CCD brains and found indications that microglia are actively involved in the pathology of CCD. Bearing in mind the need for novel approaches to collect information on disease mechanisms of prodromal and early-stage AD, where therapeutic interventions to prevent further deterioration of the condition may still be possible, the CCD dog model provides an interesting contribution to AD research.
Footnotes
ACKNOWLEDGMENTS
We would like to thank the dedicated dog owners who made this project possible by donating their dogs for postmortem investigation. Technicians Janne Skalshøi and Sussanne Petersen are acknowledged for excellent technical assistance with histopathology. DVM, PhD Hanne Gredal and DVM Maja Allpass are acknowledged for assistance with some of the dogs during the clinical part of the project. This study was supported by the Danish Council for Independent Research (grant number DFF –4184-00061), Fondet for Sygdomsbekæmpelse hos vore Familiedyr/Danish Kennel Club (grant number 2019-0004), and Danish Council for Independent Research (grant number DFF –12-126835).