
Abstract
Background:
Postoperative cognitive dysfunction (POCD), a syndrome of cognitive deficits occurring 1–12 months after surgery primarily in older patients, is associated with poor postoperative outcomes. POCD is hypothesized to result from neuroinflammation; however, the pathways involved remain unclear. Unbiased proteomic analyses have been used to identify neuroinflammatory pathways in multiple neurologic diseases and syndromes but have not yet been applied to POCD.
Objective:
To utilize unbiased mass spectrometry-based proteomics to identify potential neuroinflammatory pathways underlying POCD.
Methods:
Unbiased LC-MS/MS proteomics was performed on immunodepleted cerebrospinal fluid (CSF) samples obtained before, 24 hours after, and 6 weeks after major non-cardiac surgery in older adults who did (n = 8) or did not develop POCD (n = 6). Linear mixed models were used to select peptides and proteins with intensity differences for pathway analysis.
Results:
Mass spectrometry quantified 8,258 peptides from 1,222 proteins in > 50%of patient samples at all three time points. Twelve peptides from 11 proteins showed differences in expression over time between patients with versus without
POCD (q < 0.05), including proteins previously implicated in neurodegenerative disease pathophysiology. Additionally, 283 peptides from 182 proteins were identified with trend-level differences (q < 0.25) in expression over time between these groups. Among these, pathway analysis revealed that 50 were from 17 proteins mapping to complement and coagulation pathways (q = 2.44*10–13).
Conclusion:
These data demonstrate the feasibility of performing unbiased mass spectrometry on perioperative CSF samples to identify pathways associated with POCD. Additionally, they provide hypothesis-generating evidence for CSF complement and coagulation pathway changes in patients with POCD.
Keywords
INTRODUCTION
Postoperative cognitive dysfunction (POCD) is a perioperative neurocognitive disorder often defined by a decrease of at least one standard deviation in measured cognitive function from baseline to 1–12 months after surgery. POCD, also referred to as neu-rocognitive disorder, postoperative when accompanied by subjective cognitive complaints or impaired ability to perform activities of daily living, occurs in up to 40%of older surgical patients [1–3] and is associated with decreased postoperative quality of life [4, 5], poor long-term cognitive outcomes [6], and elevated 1-year mortality [7]. With an aging population and over 16 million patients undergoing surgery each year in the U.S., POCD and other perioperative neurocognitive disorders constitute a growing public health concern [8].
Currently, prevention and treatment of POCD and other perioperative neurocognitive disorders remain limited by our incomplete understanding of their underlying mechanisms. These conditions are hyp-othesized to result from dysregulated immunity, including postoperative neuroinflammation, partly because neuroinflammation has been associated with cognitive deficits in preclinical models and several other neurocognitive disorders including Alzheimer’s disease (AD) (reviewed) [9], multiple sclerosis [10, 11], and autoimmune encephalitis [11]. Indeed, pat-ients with POCD exhibit elevated cerebrospinal fluid (CSF) inflammatory cytokines [12–14], microglial activation [15], blood-brain barrier dysfunction [16], and exacerbation of pre-existing AD-related pathology [14, 18]. Many POCD biomarker studies have utilized targeted assays measuring specific proteins and inflammatory markers in blood and/or CSF samples before and after surgery [18–22]. However, these targeted assays limit investigation to pre-specified proteins of interest and lack the ability to identify novel proteins or pathways that may be involved in POCD.
In contrast to targeted assays, mass spectrometry-based approaches offer proteome-wide characterization by comparing peptide fragment intensities after a proteolytic preparation step. These intensit-ies provide relative concentration measurements for thousands of peptide analytes, which are subseque-ntly matched to their parent proteins. Mass spect-rometry-based proteomics has the ability to identify novel protein targets and pathways underlying disease states in a hypothesis-independent, “unbiased” manner. Additionally, it can identify specific post-translational modifications, such as phosphorylation, that may be used to assess protein activation and signal cascade involvement [23].
Unbiased proteomic analyses have previously been used to identify novel biomarkers for mild cognitive impairment [24], AD [24–26], frontotemporal dementia [27, 28], Parkinson’s disease [29], amyotrophic lateral sclerosis [28], HIV-related cognitive impairment [30], amygdala dysfunction [31], and chronic traumatic encephalopathy [32]. Recently, these methods have also been applied to postoperative delirium, revealing several preoperative CSF candidate biomarkers of postoperative delirium. Yet, to our knowledge, no other study has utilized unbiased mass spectrometry-based proteomics to identify novel CSF protein biomarker or pathway changes after surgery in older adults with perioperative neurocognitive disorders. In this pilot study, we examined the feasibility of using this approach to measure changes in CSF protein levels from patients with POCD compared to healthy controls in order to identify pathways that may contribute to POCD pathogenesis for further investigation in larger future studies
METHODS
Overview and patient selection
The protocol for this case-control study was app-roved by the Duke University Medical Center Institutional Review Board as part of a parent obser-vational cohort study registered with clinicaltrials. gov (NCT01993836) on November 25, 2013. All me-thods were carried out in accordance with relevant guidelines and regulations. All subjects gave written informed consent. For the parent study, we enrolled 140 English-speaking patients age 60 and above who were undergoing non-cardiac, non-neurologic sur-gery scheduled for at least 2 h under general anesthesia. All patients received propofol for anesthetic induction and either propofol or isoflurane for anesthetic maintenance. There were no exclusions for preoperative cognitive status; however, all patients had to be able to complete our cognitive test battery.
Cognitive testing
All patients included in the parent study underwent neurocognitive assessment at baseline and 6 weeks after surgery using our established neurocognitive test battery [6, 33–35] including the Randt Short Story Test, the Wechsler Memory Scale Modified Visual Reproduction Test, the Digit Span and Digit Symbol tests from the Revised Wechsler Adult Intelligence Scale, and the Trail Making Test, Part B. The scores from these tests were reduced to uncorrelated factor scores by factor analysis with orthogonal rotation, which were derived in a previous study of similar non-cardiac surgical patients [36]. This approach derived four factor scores that correspond to four cognitive domains: verbal memory; abstraction and visuospatial orientation; visual memory; and attention and concentration. Postoperative cognitive dysfunction was defined as a ≥1 standard deviation decrease in one or more of these four cognitive domain from baseline to 6 weeks after surgery as previously described [6, 37–42]. The 6-week time point was selected because it falls within the 1–12-month window that POCD/neurocognitive disorder, postoperative occurs, and the 6-week time point has been previously been used extensively in prior studies [6, 37–42]. Continuous Cognitive Index (CCI) scores were subsequently calculated for each patient by averaging their cognitive scores across all four domains and mean normalizing the results to zero. Thus, the CCI represents a single global measurement of cognitive function, with a positive score indicating above average overall cognitive testing performance and a negative score indicating below average performance compared to the reference study population [36].
Patient selection for proteomic analyses
From the patients in the parent MADCO-PC study, eight subjects with POCD, defined by a > 1 standard deviation decrease in at least one of four cognitive domains from before to six weeks after surgery, and six subjects without POCD at six weeks after surgery were selected for inclusion in this proteomics study. Prior work has questioned this definition of POCD because patients with a > 1 SD drop in one cognitive domain may nonetheless have a > 1 SD increase in another cognitive domain [43], calling into doubt whether such patients should really be considered to have cognitive dysfunction. Thus, to ensure that patients selected with POCD did have a true overall drop in cognition, and that those without POCD truly did not have even a minor overall drop in cognition (such as a < 1 SD drop in cognition across multiple domains), we added an additional constraint for selecting samples for each group. For the POCD group, we selected patients who had an overall drop in their continuous cognitive index (the mean of the four cognitive domain scores) from before to 6 weeks after surgery, in addition to a > 1 standard deviation decrease in at least one of four cognitive domains from before to six weeks after surgery. Likewise, for the non-POCD group, we selected patients who had an overall improvement in their continuous cognitive index from before to six weeks after surgery (perhaps reflective of a normal learning effect upon retesting), in addition to no drop of > 1 SD in any single cognitive domain over this time period. We prioritized selection of patients with similar age and years of education for both groups to avoid potential confounding from these factors (Table 1).
Patient Characteristics
Patient Characteristics
Patient characteristics for the POCD and non-POCD groups. Values are presented as mean±standard deviation, with p-values where appropriate. There were no significant differences in age, years of education, baseline CCI, CCI change at six weeks, or APOE genotype distribution between POCD and non-POCD groups. P-values for age, years of education, baseline CCI, and CCI change at six weeks calculated with two-tailed t-tests. p-value for APOE genotypes calculated using a Fisher’s exact test.
CSF and blood sample collection
Participants underwent baseline CSF and blood sampling within a month prior to surgery. Repeat CSF samples were obtained 24±2 h after the start of surgery and 6±3 weeks after surgery [33, 44]. CSF was collected using our protocol for minimizing pain and adverse events associated with lumbar puncture [40, 45]. Briefly, participants’ lower backs were scrubbed with sterile iodine, and 20%benzocaine was applied by spray canister. After waiting 10 min for the local anesthetic to take effect, up to 5 mL of 1%lidocaine was injected subcutaneously at the targeted lumbar interspace. Subsequently, a 25-gauge spinal needle was inserted through 20-gauge introducers at the same interspace to extract approximately 10 mL of CSF using aseptic techni-ques. The puncture site was then covered with a bandage, and the patient was instructed to remain supine for at least 30 min to minimize the risk of post-dural puncture headache [45].
CSF and blood sample processing
CSF and blood supernatant aliquots were stored at –80°C, and initial blood samples were used for APOE genotyping by the Duke University DNA Analysis Facility (Durham, NC) using Applied Biosystems TaqMan SNP genotyping assays (10 ng DNA/assay) and an Applied Biosystems 7500 Fast Real-Time PCR system.
CSF samples (n = 42; one collected from each patient at each time point) were delivered to the Duke Proteomics and Metabolomics Shared Resource on dry ice, and gently thawed on ice. Coomassie Plus Bradford assays (Thermo Fisher Scientific, Waltham, MA, USA) were performed to determine protein concentrations, which varied from less than 0.125μg/μL to greater than 2μg/μL. 20μL of human plasma was mixed with 730μL of Sample Dilution Buffer (Agilent Technologies, Santa Clara, CA, USA) as a CSF-mimic positive control. For experimental samples, 600μL of human CSF was mixed with 150μL High Concentration Buffer (Agilent), such that the total volume for all samples (positive control and experimental samples was 750μL. The diluted samples were then centrifuged through a 0.22μm cellulose acetate centrifugal spin filter unit (Agilent) for 3 min at 15,000 rpm and 4°C. The filtered samples were transferred to Maximum Recovery LC glass v-bottom vials (Waters Corporation, Milford, MA, USA). 725μL of each sample was immunodepleted to remove the high abundance plasma proteins using a MARS-14 LC column (Agilent) and an Agilent 1100 HPLC according to the manufacturer’s protocol.
Following immunodepletion, samples were buffer exchanged with 50 mM ammonium bicarbonate using Amicon 10 MWCO (EMD Millipore, Burlington, MA, USA). Immunodepletion was quality-con-trol checked by analysis of pre-versus post depletion samples on 4–13%Bis-Tris NuPAGE gel (Thermo) in MES buffer, and a Bradford protein assay of pre-versus post-depletion samples to confirm protein removal was consistent; protein removal via immunodepletion was on average 88.5%. Samples were then normalized to 8μg each and supplemented to 0.1%w/v Rapigest detergent (Waters) for digestion. Samples were reduced with 10 mM dithiothreitol for 10 min at 80°C, alkylated with 20 mM iodoace-tamide at room temperature in the dark for 30 min, and digested with 1:50 trypsin:protein (Promega Sequencing Grade) overnight at 37°C. After digestion, samples were acidified to 1/2/97 v/v/v TFA/MeCN/water and heated at 60°C for 1 h to hydrolyze Rapigest. 1 pmol ADH1_YEAST MassPrep standard (Waters) was added to each sample as a surrogate sta-ndard. Finally, a study pool QC (SPQC) sample was made by combining 5μL of each digested sample.
Quantitative analysis of CSF proteins
Quantitative one-dimensional LC-MS/MS was performed on 2μL (500 ng) of the protein digest per sample from all subjects in singlicate, with rep-licate analyses of the SPQC interspersed throughout at even intervals. Samples were analyzed using a nanoAcquity UPLC system (Waters) coupled to a Q Exactive Plus Orbitrap high resolution accurate mass tandem mass spectrometer (Thermo) via a nanoe-lectrospray ionization source. Briefly, the sample was first trapped on a Symmetry C18 300 mm×180 mm trapping column (5μL/min at 99.9/0.1 v/v H2O/MeCN), after which the analytical separation was performed using a 1.7μm Acquity HSS T3 C18 75 mm×250 mm column (Waters) using a 90 min gradient of 5 to 40%MeCN with 0.1%formic acid at a flow rate of 400 nL/min with a column temperature of 55°C. Data collection on the Q Exactive Plus mass spectrometer was performed in a data-dependent MS/MS manner, using a 70,000-resolution precursor ion (MS1) scan followed by MS/MS (MS2) of the top 10 most abundant ions at 17,500 resolution. MS1 was accomplished using AGC target of 1*106 ions and max accumulation of 60 msec. MS2 used AGC target of 5*104 ions, 60 ms max accumulation, 2.0 m/z isolation window, 27 V normalized collision energy, and 20 s dynamic exclusion. The total analysis cycle time for each sample injection was approximately 2 h, and the experiment totaled 51 injections.
Samples were run in a randomized block design, and the QC Digest Pool was analyzed after every 6th sample within the group as well as at the beginning and end of the study. Following the analyses, the data was imported into Rosetta Elucidator v4.0 (Rosetta Biosoftware, Inc., Seattle, WA, USA), and all LC-MS files were aligned based on the accurate mass and retention time of detected ions (“features”) using Rosetta Elucidator PeakTeller algorithm. The relative peptide abundance was calculated based on area-under-the-curve of aligned features across all runs. The dataset had 67,076 quantified features and HCD fragmentation was performed to generate approximately 1.62 M MS/MS spectra for sequencing by database searching.
Peptide identification and inclusion
The MS/MS data was searched against the UNIPROT protein sequence database with Homo sapiens species taxonomy, which also contained several surrogate standards sequences and common laboratory contamination proteins, as well as a reversed sequence “decoy” database for false discovery rate determination. Amino acid modifications allowed in database searching included fixed deamidation on Asn and Gln (*), carbamidomethyl Cys (**), and oxi-dation on Met (***). The data was searched with 5 ppm precursor, 0.02 Da product ion tolerance, and tryptic enzyme specificity, allowing up to two missed cleavages. Data was processed to the peptideTeller data curation algorithm to determine false discovery rate and was annotated at 0.5%peptide false discovery rate.
The raw peptide intensities were then scaled across all samples using robust mean scaling. To detect outliers, principal component analysis was performed for the scaled peptide intensities. By comparing principal components 1 and 2, one sample was found outside the cluster of the rest of samples. Therefore, this sample was excluded as an outlier. Additionally, two samples were processed in duplicate to ensure agreement; peptide intensities from these samples were averaged for analysis. Peptide intensities that were missing (i.e., below the lower limit of detection) or below the 5th percentile of the non-missing intensities of each peptide were imputed with the 5th percentile of the non-missing intensities of that same peptide. Peptides that required imputation in more than 10 samples were excluded. To remove unstable peptides or those with poor precision, peptides with greater than 40%coefficient of variation across the QC pool were also excluded. Finally, the intensities of all the peptides and proteins were log2 transformed before statistical analysis.
Statistical analysis
Descriptive statistics were computed for key dem-ographic and patient characteristics variables including age, sex, years of education, cognitive measures, and APOE genotypes by frequency (percentage) for categorical variable and mean (standard deviation, SD) for continuous variables. Two sample t-tests and Wilcoxon rank sum tests were conducted to compare the log2 transformed intensity difference of each peptide and protein between subjects who did and who did not have POCD at each time point (baseline, 24 h post-operation, and 6 weeks post-operation. To correct for multiple testing, q-values were computed for each peptide and protein at each time point [46]. Finally, to detect POCD effect on peptide intensity over time, linear mixed models were fitted for intensities of each peptide regressed on the fixed effects of group (i.e., POCD versus no POCD) from 24 h and 6 weeks after surgery, time, and interaction of group and time with random intercept and slope of time. Again, q-values of POCD effect were computed for each peptide and protein to correct for multiple testing. Proteins containing peptides meeting q < 0.25 were considered as candidates with probable POCD association.
Pathway analysis
Pathway analysis was conducted using the Dat-abase for Annotation, Visualization and Integrated Discovery with the Kyoto Encyclopedia of Genes and Genomes pathway database. This pathway analysis was performed on genes encoding proteins that contained top candidate peptides (q < 0.25) selected from our linear mixed model (described above). Significant pathways were determined by Benjamini-Hochberg false discovery rates (FDR) less than 0.05 (q < 0.05) from the pathway analysis [47].
RESULTS
Patient characteristics
Of the 14 patients included in the study, 8 developed POCD at 6 weeks after surgery, while 6 did not. Baseline/preoperative patient characteristics are listed in Table 1. The two groups were generally similar; there was no significant difference in age, years of education, baseline cognitive index, or APOE genotype distribution between groups (p > 0.35 for all). CCI change from before to 6 weeks after surgery was worse in the POCD group than the non-POCD group, as expected (–0.147 versus 0.173, p = 0.013).
Initial CSF analysis identified 8258 peptides that mapped to 1,222 proteins. 11 peptides were removed because they required imputation in 10 or more samples, and a small fraction (8.5%) of peptides were removed due to > 40%variability in the SPQC replicates across the course of the study. Therefore, the final quantitative dataset consisted of 7,542 peptides and 1,180 proteins for statistical analysis (Supplementary Material). No peptides from any of the three time points were found to be significantly different between the two groups after accounting for multiple testing with a threshold of q < 0.05, an unsurprising finding given the large number of peptides measured and small sample size.
Repeated measures and pathway analyses
Our linear mixed model analysis on peptide intensity over time did not detect any peptides that showed a statistically significant interaction of group by time at 24 h post-surgery but identified 12 peptides from 11 different proteins with statistically significant differences after FDR adjustment (q < 0.05) for the interaction term of group by time at 6 weeks post-surgery (Supplementary Table 1). Here, pre-surgery time was the reference. The 12 significant peptides accounted for approximately 7.3%of the 165 total peptides identified from those 11 proteins and inc-luded two different peptides from the copper carrying protein ceruloplasmin. Because our pilot study may have been underpowered to detect differences in other peptides, proteins, and pathways within a mixed model, we also examined peptides with q-values < 0.25 as previously described [48]. There were 283 unique peptides with q < 0.25 in these linear mixed models, which mapped to 182 unique parent proteins (Supplementary Table 1). These 283 peptides accounted for approximately 10.5%of the 2,694 total peptides identified derived from these 182 unique proteins.
To identify pathways that may be involved in the pathogenesis of POCD, the genes coding for these 182 proteins were mapped to functional pathways using the Kyoto Encyclopedia of Genes and Genomes pathway database (Table 2), and pathway analysis was conducted using the Database for Annotation, Visualization, and Discovery [49, 50]. This led to identification of nine pathways statistically associated at p < 0.05 with subsets of the 182 featured pro-teins (Supplementary Table 1). False discovery rates were also calculated for these pathways to account for type-1 error due to multiple comparisons. Kyoto Encyclopedia of Genes and Genomes pathway hsa 04610: Complement and coagulation cascades was found to be the most highly associated pathway, con-taining 50 of the total 283 peptides. These 50 peptides mapped to 17 different proteins (false discovery rate = 2.44*10–13; Table 3). Finally, functional analysis was repeated using only the 12 peptides significant at q < 0.05 rather than q < 0.25 (Supplementary Table 1) to assess whether they alone contributed to any known pathway; however, this did not reveal any significant pathway association.
Functional pathway associations
A list of Kyoto Encyclopedia of Genes and Genomes pathways associated with subsets of the 182 proteins that contained significant peptides in our analysis.
Peptides with q < 0.25 for time-group interaction at six weeks in the linear mixed model
Proteins in the Kyoto Encyclopedia of Genes and Genomes pathway hsa04610: Complement and coagulation cascades pathway with q < 0.25 for time-group interaction in the linear mixed models.
To further study the role of complement in the pathogenesis of perioperative neurocognitive disorders, complement proteins with peptides that had trend-level significance (q < 0.25) in the linear mixed model (factors C1, C1s, C2, C3, C5, C6, C8b, C9, B, H, and plasma protease C1 inhibitor) were examined further. Though none of the individual peptides or proteins showed a statistically significant difference in intensity between the POCD and non-POCD groups at any single time point, trends in complement peptide and protein intensities were revealed (Figs. 1and 2 , Supplementary Figures 1–9). Notably, even with high peptide intensity variance across each group, the mean preoperative intensities for all complement peptides were consistently lower in patients who developed POCD than those who did not. Despite no significant differences between groups at this timepoint for any individual peptide, the probability of all 36 complement and related peptides randomly exhibiting this trend would be 0.5∧36, or 1.455*10–11. When clustered by protein, the probability of this pattern occurring in the 12 complement proteins by chance would be 0.5∧12, or 2.441*10–4.
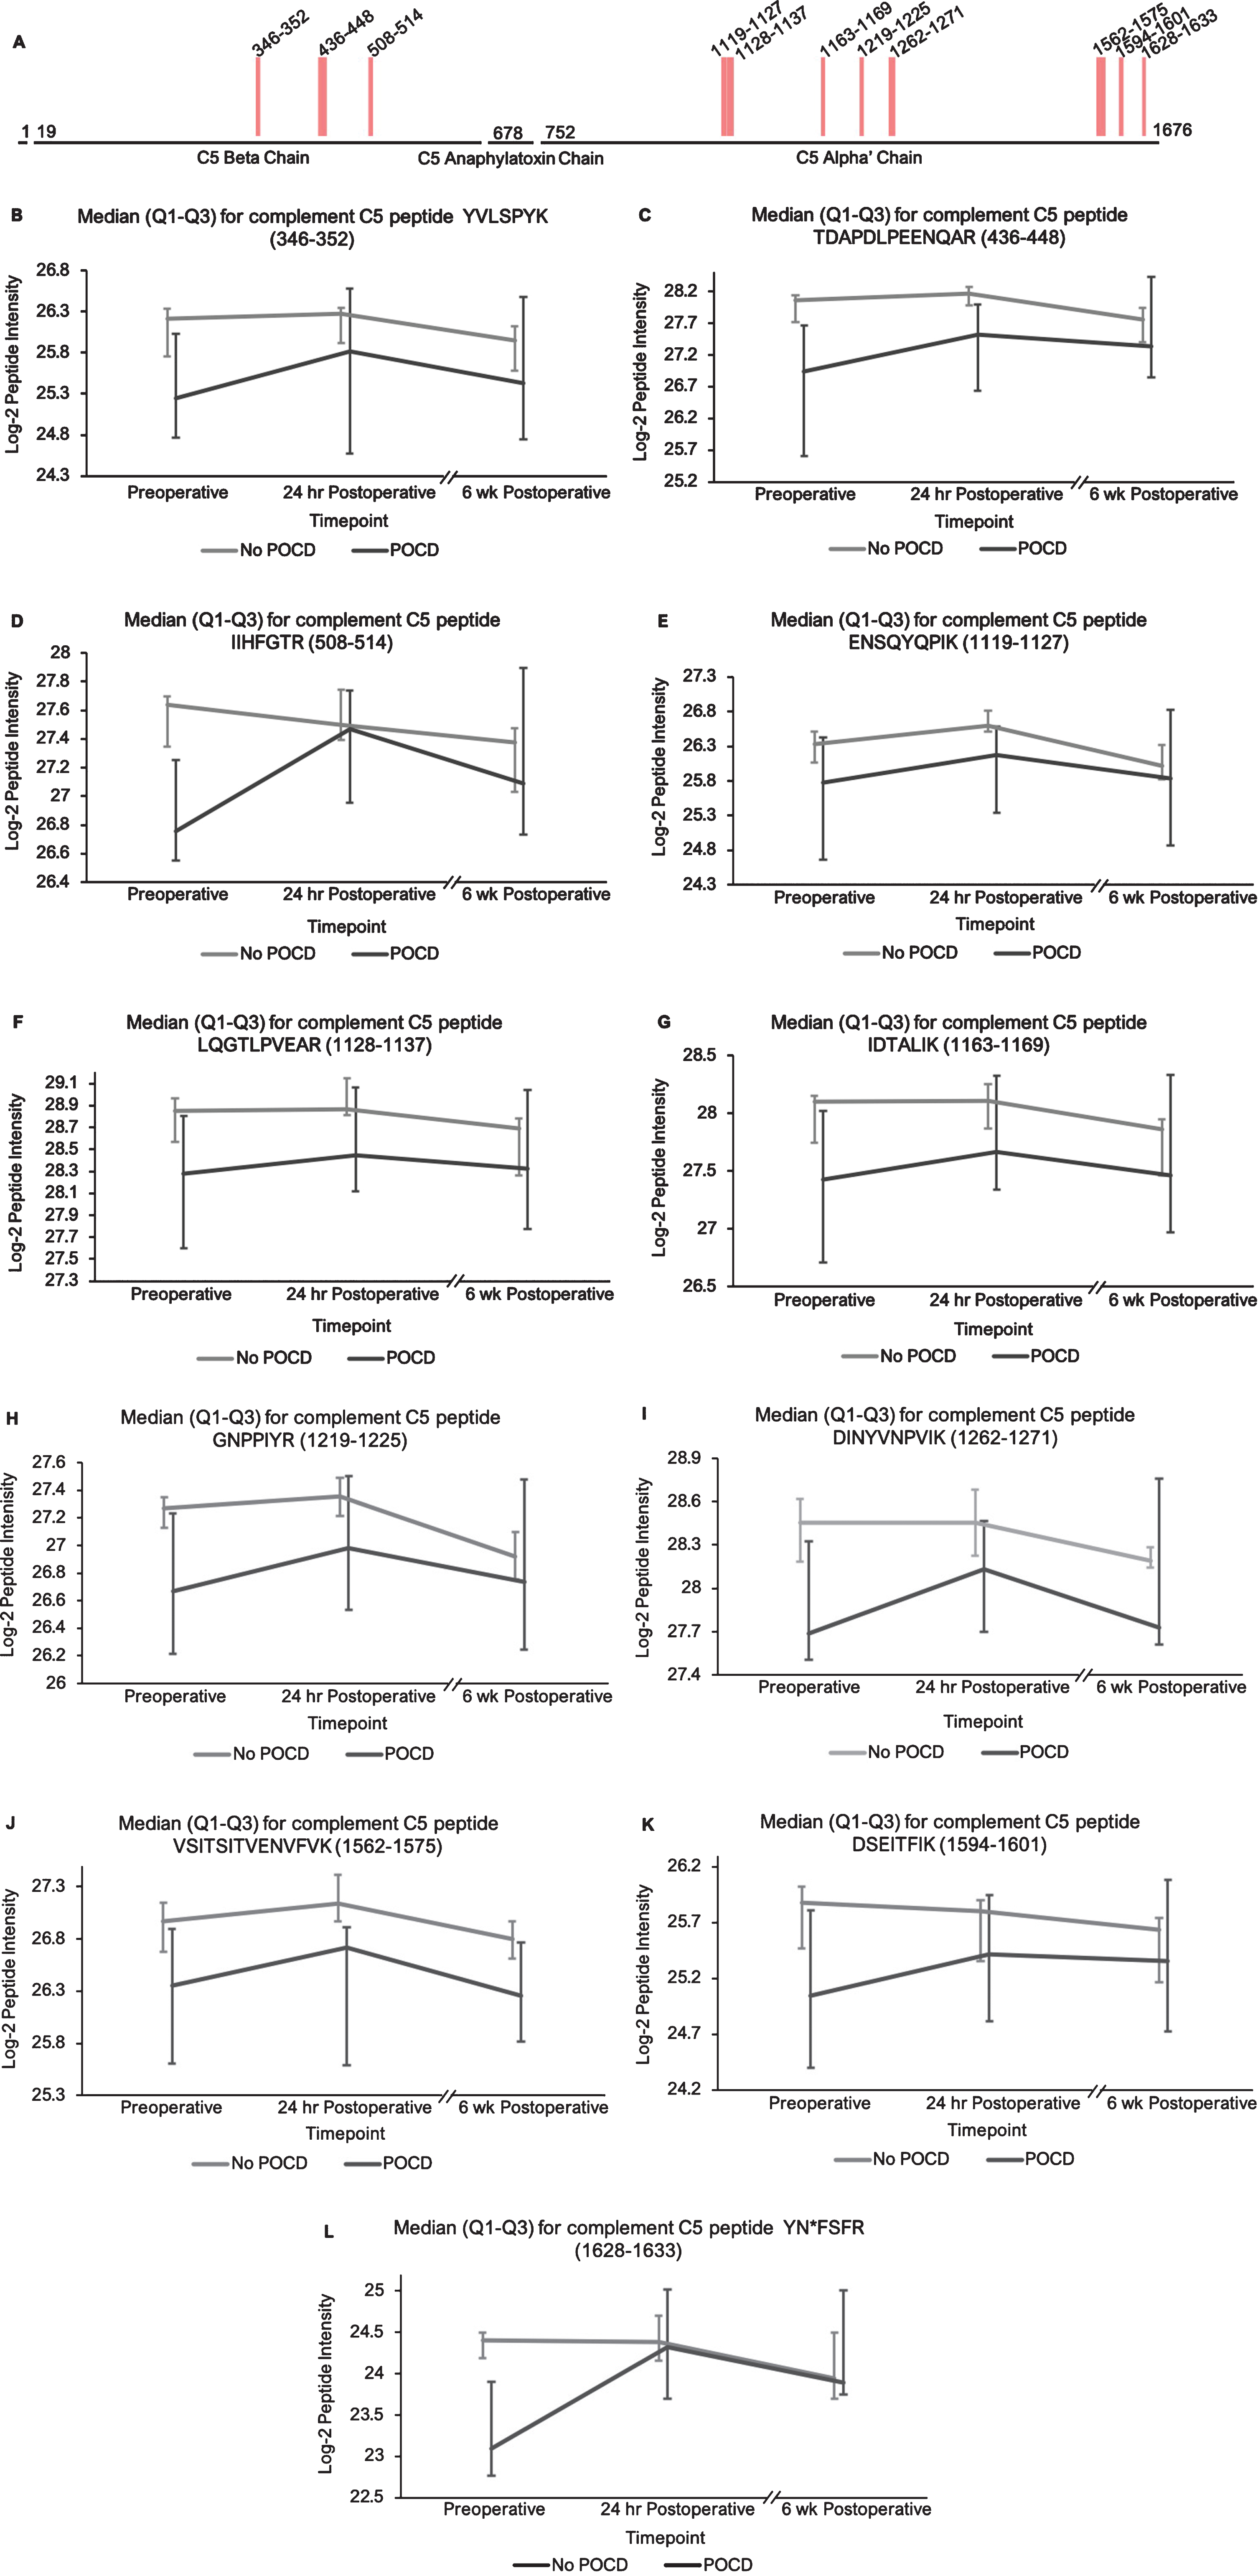
Complement C5 peptide locations and intensity trends. A) A map of complement C5 showing the locations of its 11 peptides with (q < 0.25) in the linear mixed models. Peptides 1–3 are located on the beta subunit, and 4–11 are located on the alpha subunit. B-L) Graphs comparing median C5 peptide intensities between POCD and non-POCD groups across all three time points. Vertical bars represent interquartile range.
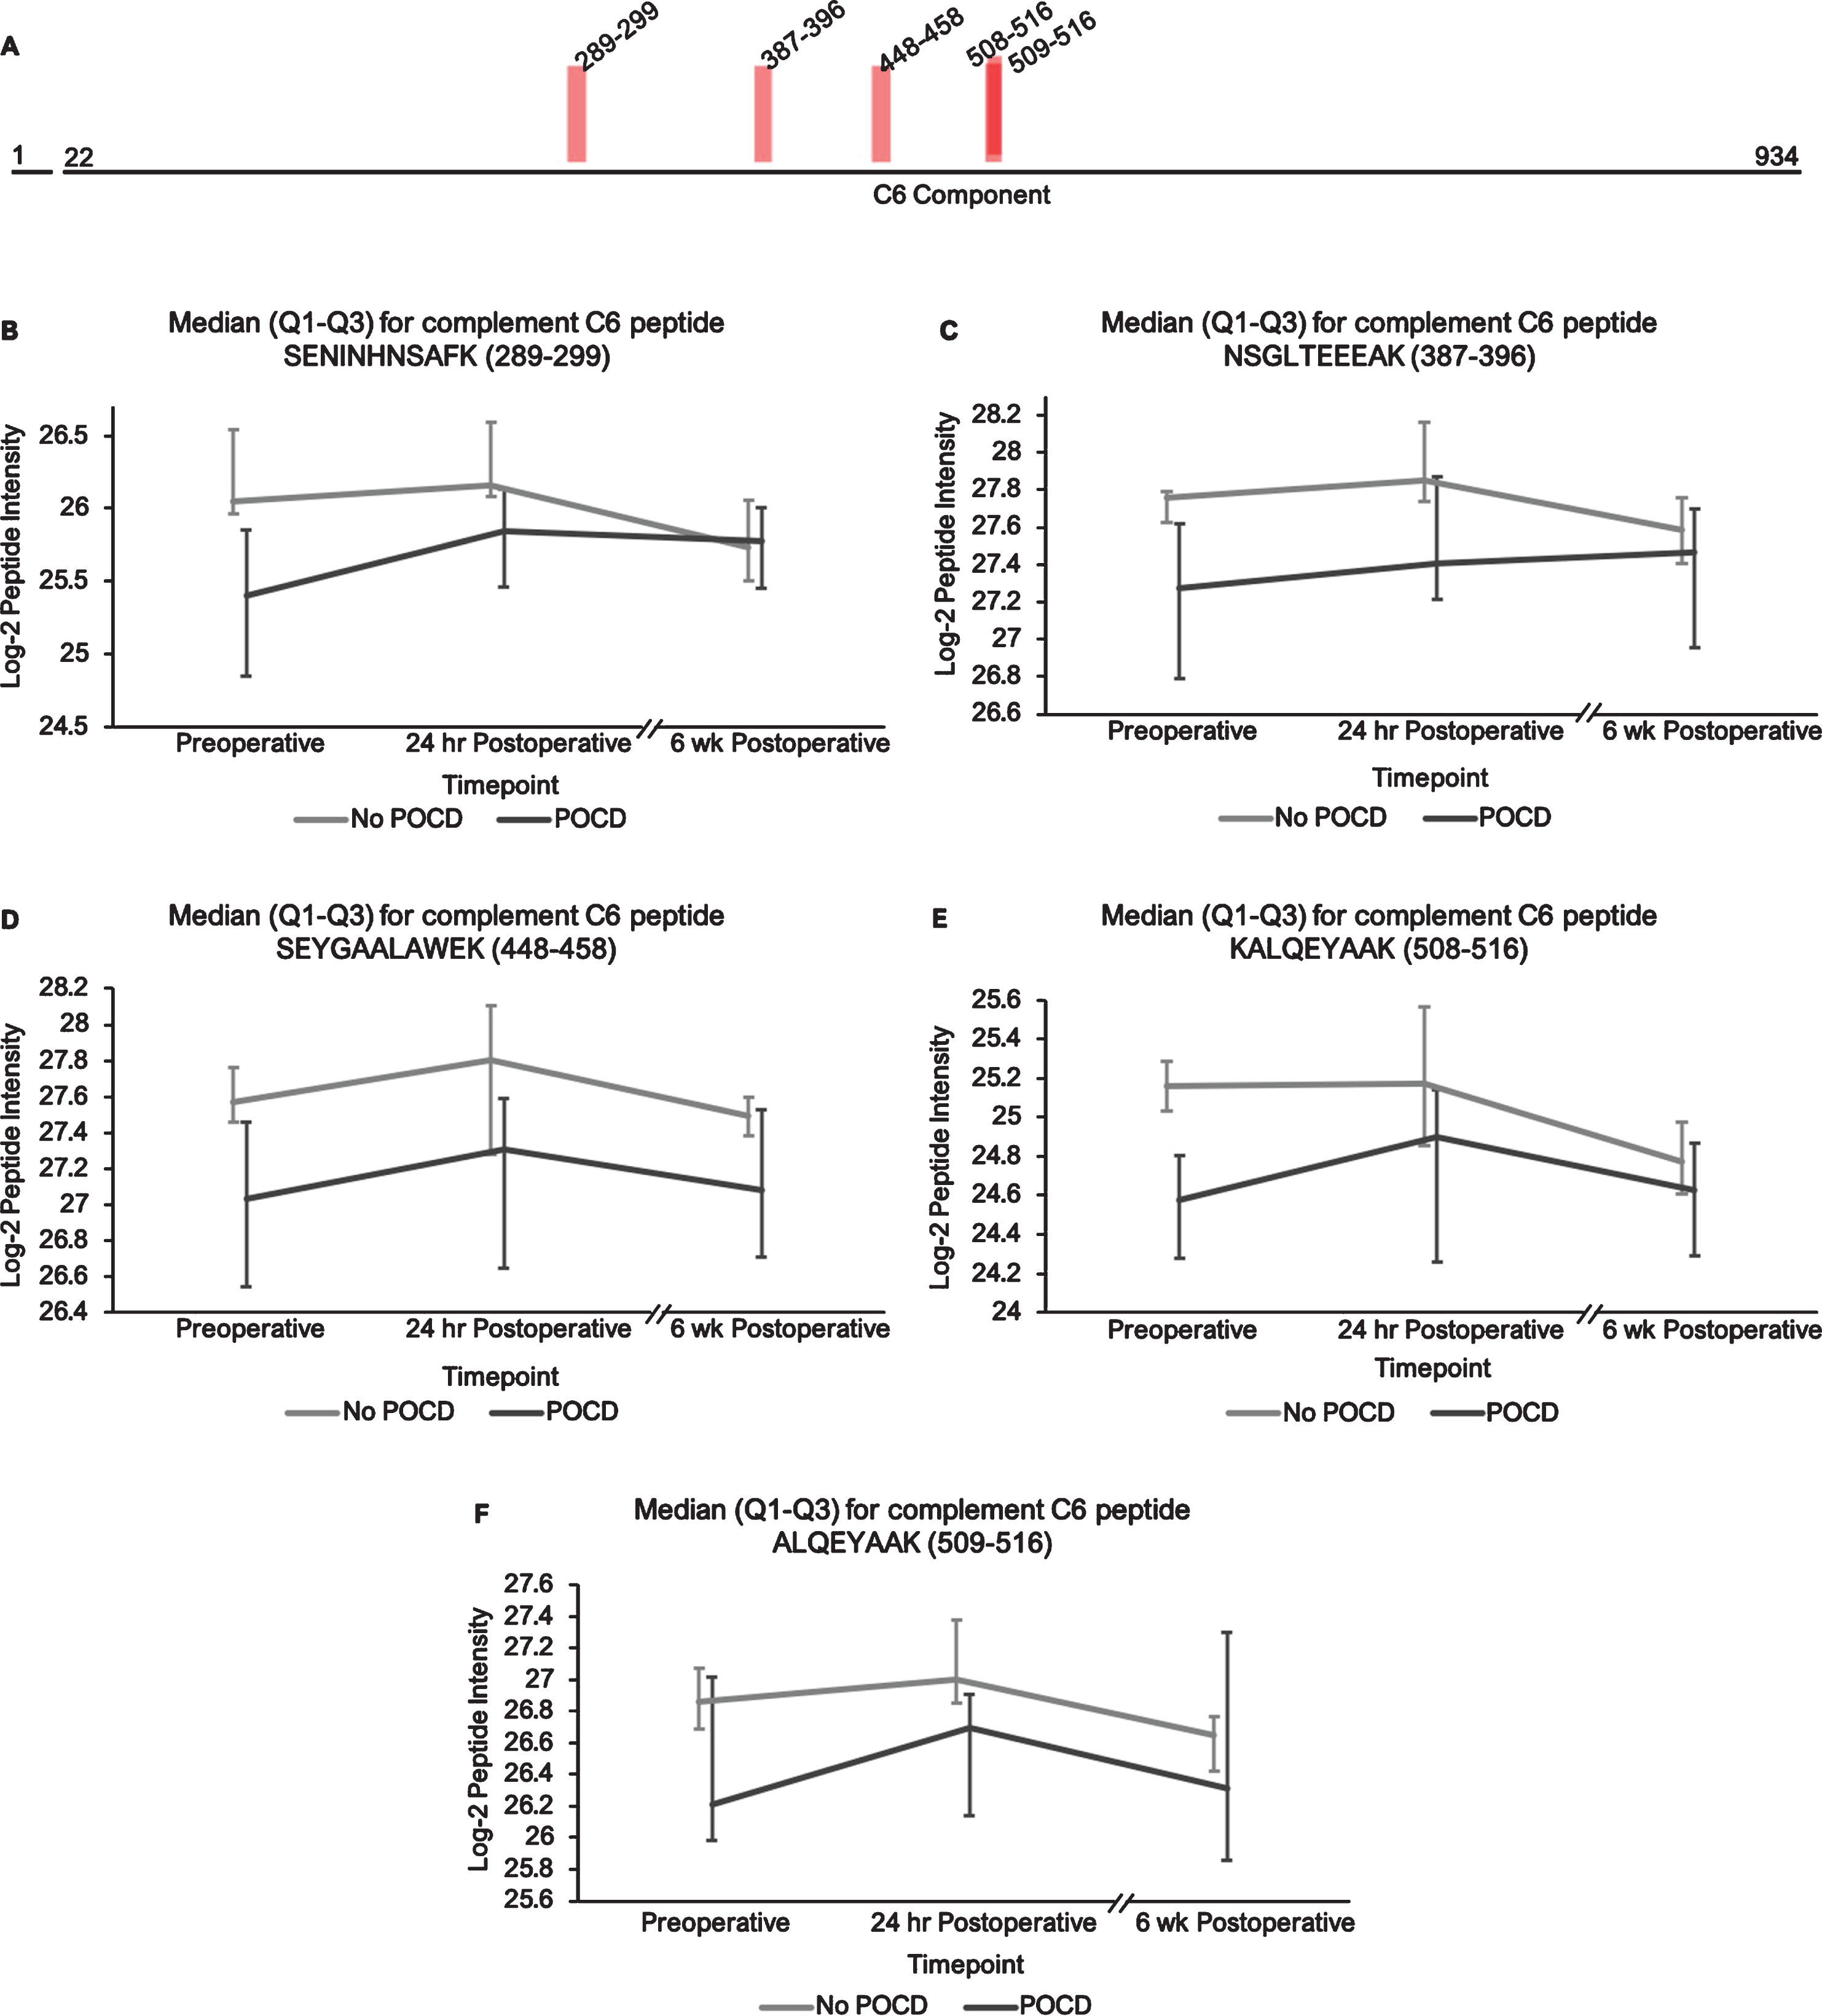
Complement C6 peptide locations and intensity trends. A) A map of complement C6 showing the locations of its five peptides with q < 0.25 in the linear mixed models. B-F) Graphs comparing median C6 peptide intensities between POCD and non-POCD groups across all three time points. Vertical bars represent interquartile range.
Additionally, the patients who developed POCD exhibited overall rising trends in all complement proteins except complement factor H from baseline to 6-week time points, while patients without POCD exhibited decreasing intensity trends across the entire set of complement proteins over this time frame. For example, complement C5 was found to have 11 peptides approaching significance (q < 0.25) in our linear mixed model (Fig. 1A-L), with similar trends for peptides from both its alpha and beta subunits. Likewise, the five peptides from complement C6 (Fig. 2A-F), three peptides from complement C8b (Fig. 3A-D), and six of the eight peptides from complement factor B (Fig. 4A,B-I) with q < 0.25 were found to have similar patterns of convergence across the three time points between patients with and without POCD. Peptides from complement C2 (Supplementary Figure 1A-C), factor 1 (Supplementary Figure 2A-C), C1s, C3, C9, and plasma protease C1 inhibitor (Supplementary Figure 3A-J) also had similar trends. Among the non-complement proteins in this pathway with trend-level significance at q < 0.25, fibrinogen (Supplementary Figure 4A, B), antithrombin-III (Supplementary Figure 5A-C), and kallikrein (Supplementary Figure 6A, B) exhibited this convergence pattern, while kininogen-1 (Supplementary Figure 7A, B), plasminogen (Supplementary Figure 8A-G), and coagulation factor V (Supplementary Figure 9A-D) did not.
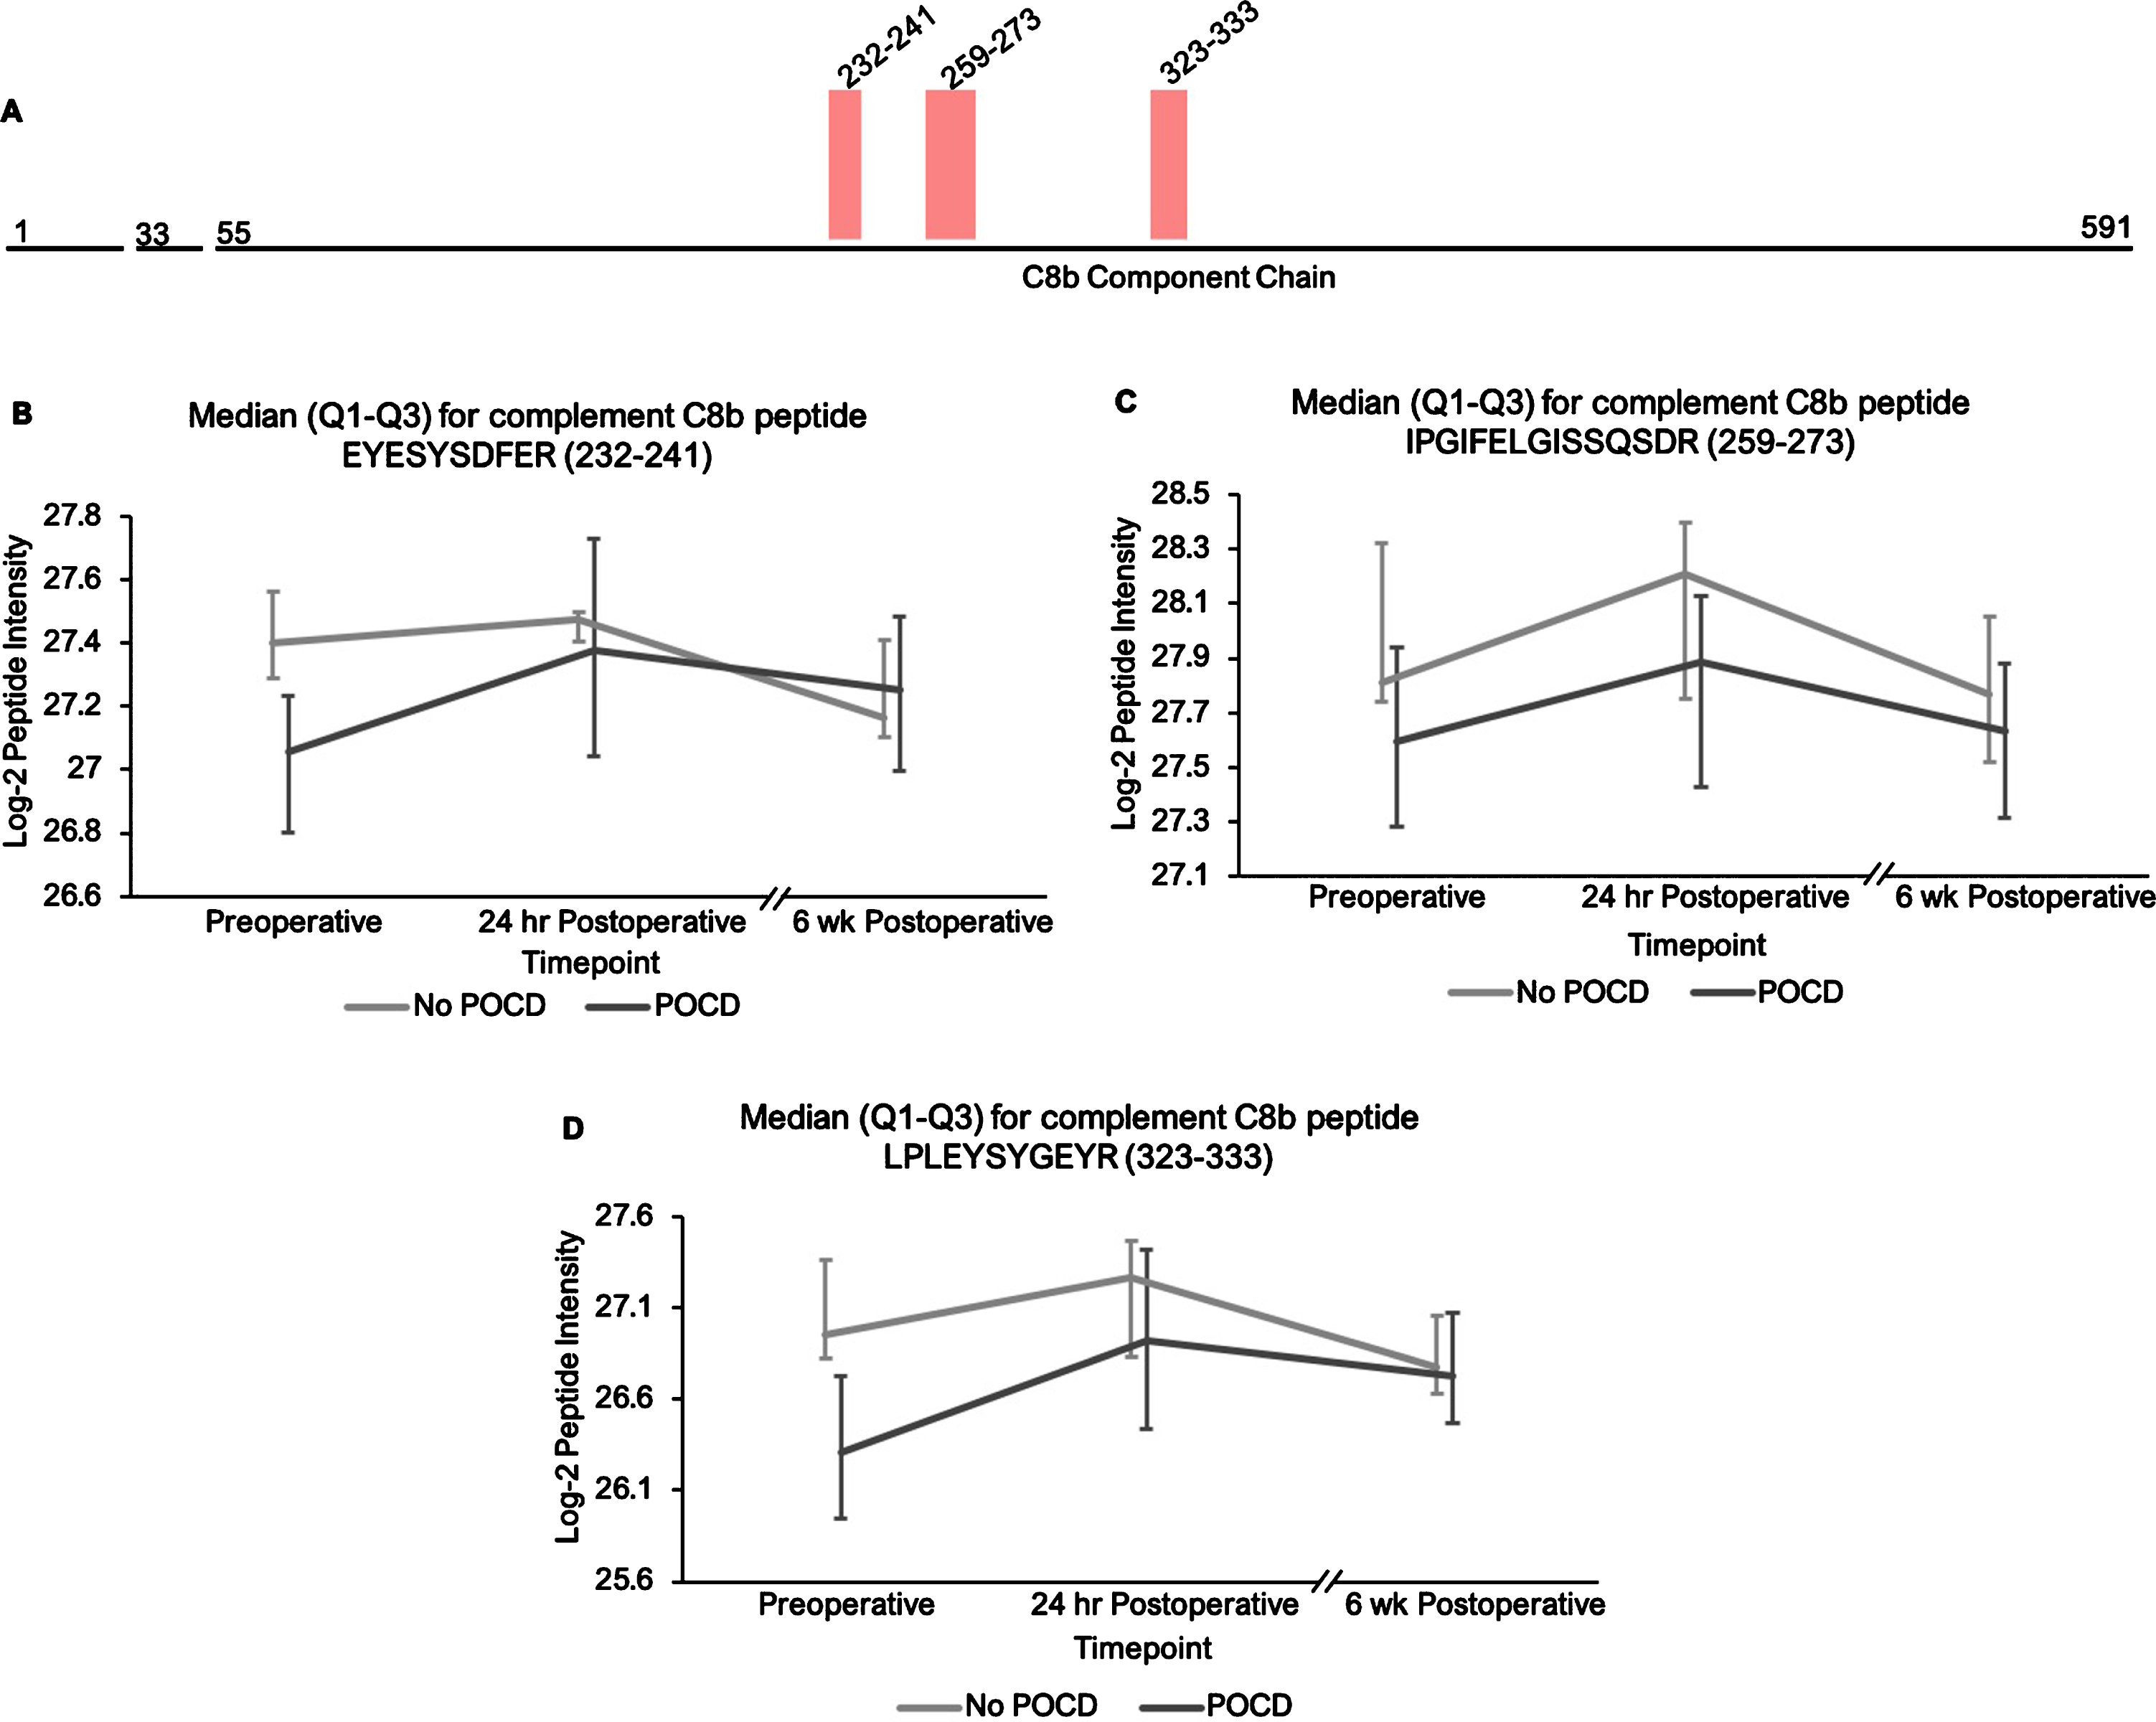
Complement C8b peptide locations and intensity trends. A) A map of complement C8b showing the locations of its three peptides with q < 0.25 in the linear mixed model. B-D) Graphs comparing median C8b peptide intensities between POCD and non-POCD groups across all three time points. Vertical bars represent interquartile range.
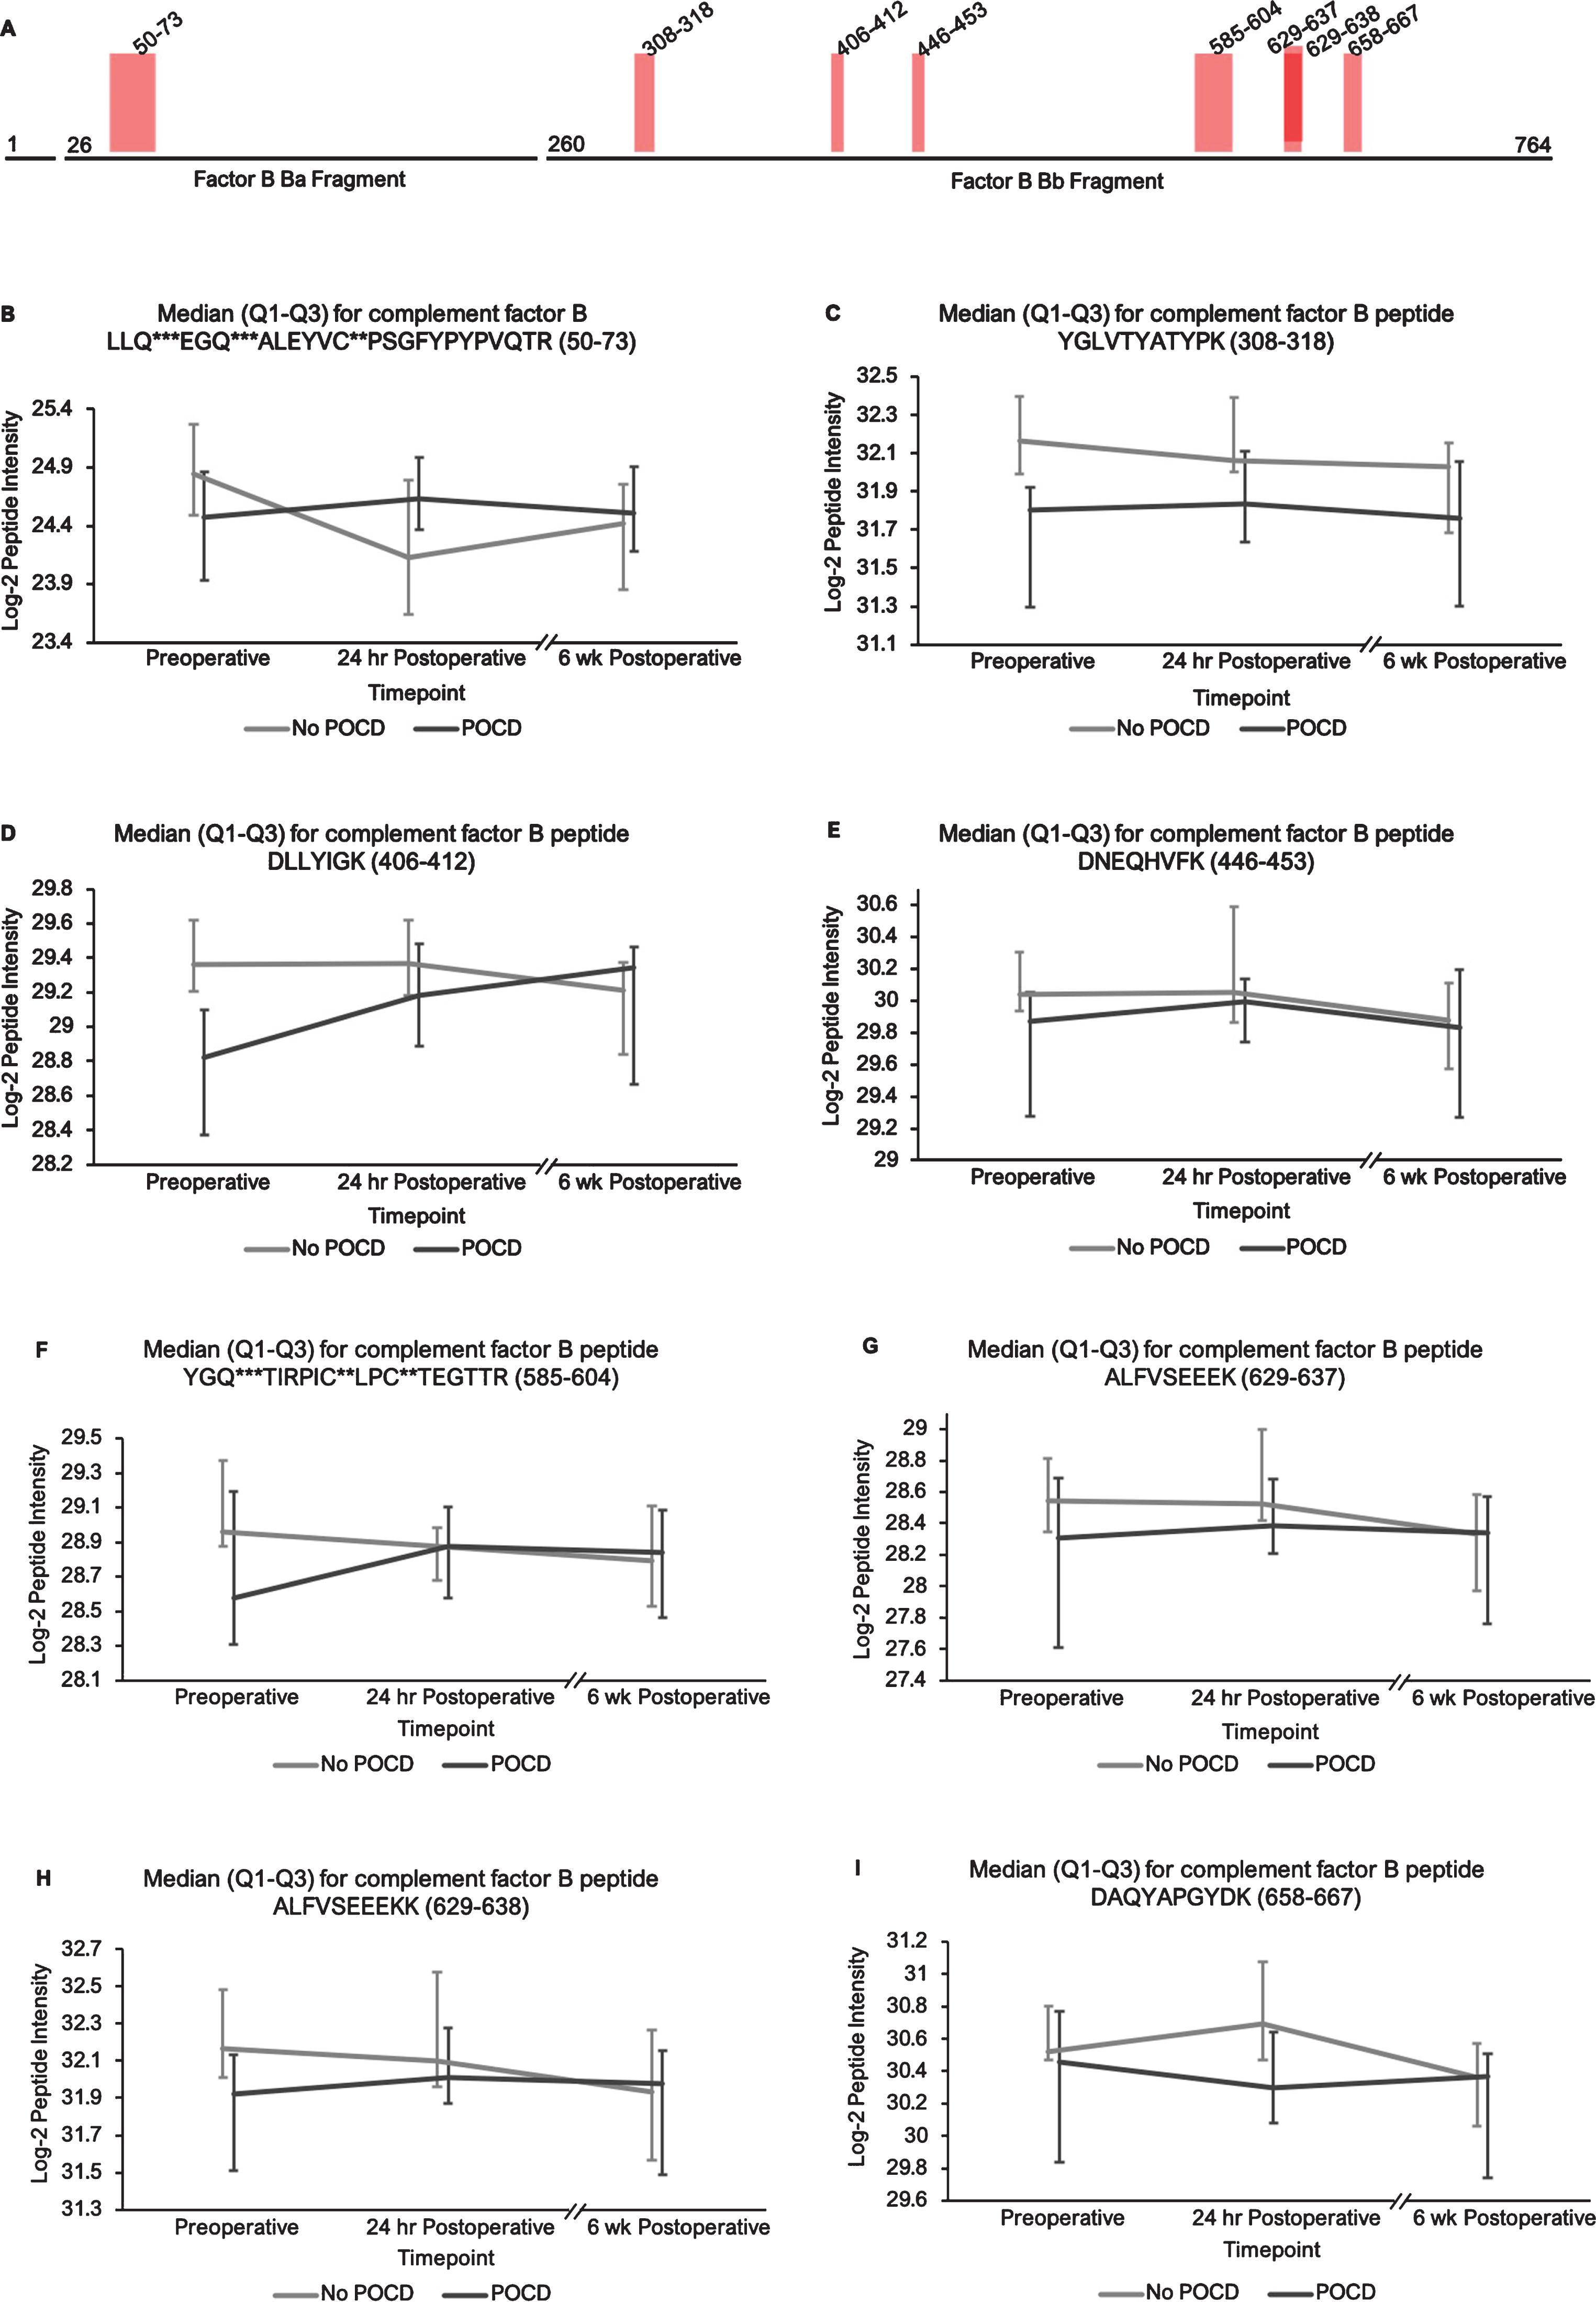
Complement factor B peptide locations and intensity trends. A) A map of complement factor B showing the locations of its eight peptides with q < 0.25 in the linear mixed model. Seven of the eight peptides represent portions of its Bb fragment. B-I) Graphs comparing median factor b peptide intensities between POCD and non-POCD groups across all three time points. Vertical bars represent interquartile range. Post-translational modifications: *Deamidation, **Carbamidomethylation, ***Oxidation.
DISCUSSION
This pilot study represents one of the first unbiased proteomic analyses on pre- and postoperative CSF samples from older surgical patients with versus without perioperative neurocognitive disorders. We identified peptides from 11 proteins with statistically significant intensity changes (q < 0.05) between patients with versus without POCD in our FDR-adjusted linear mixed model. Pathway analysis revealed trend-level differences in 50 peptides from 17 complement and coagulation-related factors, suggesting a possible role for these pathways in POCD pathogenesis. Since we planned this study to evaluate the CSF proteome without focusing specifically on either these 11 proteins or the complement pathway, our findings illustrate the strength of unbiased CSF proteomic analyses for identifying potentially novel pathways in the pathogenesis of perioperative neurocognitive disorders. Additionally, our findings on the variability of CSF peptide levels in older surgical patients may prove useful for guiding power calculations when planning future studies.
We identified 12 peptides from 11 proteins that satisfied the stringent significance threshold of q < 0.05 (Supplementary Table 1) in our linear mixed model examining an interaction between groups (POCD versus no POCD) and postoperative time points. Several of these 11 proteins have been previously implicated in other neurocognitive disorders. First, cystatin C appears to play a neuroprotective role in AD, possibly through inhibition of cerebral amyloidosis [51, 52]. Furthermore, low cystatin C levels and certain cystatin C polymorphisms have been identified as predisposing factors to AD (reviewed) [53] and contribute to poor cognitive outcomes in Parkinson’s disease [54], after ischemic strokes [55], and in HIV-associated neurocognitive disorder [56]. Similarly, multiple peptides representing the copper and iron-handling protein ceruloplasmin were found to vary significantly between groups at q < 0.05. Copper storage and regulation abnormalities have been implicated in the pathogenesis of AD (reviewed) [57] and HIV-associated neurocognitive disorder [58], and alterations in ceruloplasmin activity have been associated with increased AD risk [59, 60]. Finally, the axonal secretory sorting receptor secretogranin-III, represented by a single peptide with q < 0.05, has been implicated in the mechanisms driving amyloid-mediated neurodegeneration in AD [61]. To our knowledge, these proteins have not previously been previously associated with POCD. Targeted proteomic studies to determine their roles in perioperative neurocognitive disorders are thus warranted.
Our ability to identify additional proteins and pathways associated with POCD in this pilot study was limited by a high degree of variance in peptide intensities among the participants, and there was no peptide that showed intensity differences between groups at any single time point. Despite this limitation, analysis of our results revealed two noteworthy trends. First, among all complement proteins containing peptides with significantly different intensities in our mixed models, the mean baseline peptide levels were lower in patients who later developed POCD. Second, over the course of six weeks, there was a clear trend toward convergence of these peptide intensities for all of the proteins except complement factor H, which further diverged by the six-week time point. The consistency of these trends supports their validity despite considerable peptide variance and the relatively small study size. These data may prove useful for planning future studies using unbiased proteomic analyses on perioperative CSF samples. For example, a power analysis on complement C5 and C6 peptide intensities, with α= 0.0001 to account for multiple testing, indicates that group sizes of > 31 patients would have 80%power to reveal significant differences between baseline peptide intensities (calculated for C6 peptide KALQEYAAK, with a difference of 1.419*107 between means).
The hypothesis that complement plays a role in perioperative neurocognitive disorders aligns with current animal models of surgery-induced neuroinflammation and cognitive decline [62]. Indeed, surgery activates the systemic complement pathway in animal models and cardiac surgery patients. Complement regulates brain development and homeostasis by driving microglial synaptic phagocytosis [63], and in murine models, complement-dependent synaptic pruning is critical for optimizing cognitive performance by reducing excessive synapse numbers that can cause epilepsy [64, 65]. However, abnormal CNS complement activity has also been revealed in several neurocognitive disease states as a neuroinflammatory trigger for microglial activation and neuronal damage [66–68]. A role for complement in perioperative neurocognitive disorders would fit with the theory that these disorders are driven by neuroinflammation [1, 69]. Indeed, murine model studies have shown that levels of complement C3, an initiator of the complement cascade, and levels of the receptor for its cleavage product (C3aR) are elevated after orthopedic surgery, and these increases have been shown to contribute to cognitive dysfunction in mouse POCD models [62]. Similarly, elevated baseline CSF C3 levels have been associated with higher rates of postoperative delirium in hip fracture patients [70], and critically-ill patients with delirium have been found to exhibit upregulated CSF complement levels [71]. Our results generally fit with these prior studies, though we identified the largest difference in complement protein-derived peptides between patients with versus without POCD before rather than after surgery. In contrast, the mouse studies described above largely showed complement protein and pathway differences after surgery that correlated with cognitive outcomes. These temporal differences could reflect species differences between mice and humans, or the fact that most laboratory mouse strains are genetically inbred, while most human populations are considerably more genetically diverse. Nonetheless, it is premature to conclude that there is a significant mouse versus human difference in the temporal role of CNS complement in perioperative neurocognitive disorders based on the data from only 14 patients studied here. Larger future human studies will be necessary to more carefully delineate the temporal role of complement in human perioperative neurocognitive disorders.
In addition to the complement peptides that dif-fered between groups, several non-complement factors with known pro-inflammatory and/or hemostatic functions were identified by our linear mixed models as trending toward significance (q < 0.25) between the patients with versus without POCD over the six-week period. Notably, fibrinogen and its cleavage products are known to contribute to inflammation in the CNS by a variety of mechanisms including microglial activation [72, 73], neuronal damage [74], interactions with amyloid-β [75], and disruption of the blood-brain barrier [76]. In fact, alterations in CNS fibrinogen biology have been implicated in the pathogenesis of neurological, neurocognitive, and psychiatric disorders including multiple sclerosis [77], traumatic brain injury [78], AD [73, 79], and depression [80]. Likewise, coagulation factor V, a central mediator of hemostasis, has been previously linked to delirium pathogenesis [81]. Further, plasminogen has been shown to potentiate neuroinflammation [82, 83] and AD-related pathology [82], and elevated serum kininogen has been associated with depression [80]. As with complement, our data provide hypothesis-generating evidence for a potential relationship between POCD and dysregulation of these inflammatory and hemostatic factors.
Several limitations apply to this study. First, alth-ough the CSF analyses presented here suggest differential changes in peptides levels from complement and coagulation-related proteins between patients with versus without POCD, it is possible that these changes could reflect non-causal associations. In ess-ence, these pathways may be markers of POCD ra-ther than causative factors. Second, like other mass spectrometry-based analyses, the intensities measured in this study reflect relative peptide levels rather than quantitative concentration measurements. Thus, while our unbiased approach has identified candidate proteins with suspected involvement in POCD, precise protein levels and inter-protein comparisons will require additional targeted studies (i.e., proteomic studies with internal controls designed for precise quantification) or quantitation of specific analytes with ELISA-based assays. Furthermore, aside from several quality validation tests and two samples run in duplicate, all other mass spectrometry sample measurements in this study were run in singlicate, increasing the possibility that technical variation may affect our measurements. Third, non-protein small-molecule inflammatory mediators such as prost-anoids, leukotrienes, and reactive oxygen species, which could contribute to POCD, cannot be assessed with the proteomic approach used here. Indeed, we recently found significant 24 h postoperative changes in CSF levels of arachidonic acid pathway members using a “lipidomics” approach [84], so future studies should examine the interplay between CSF lipid and protein mediators in perioperative neurocognitive disorders. Likewise, the immunodepletion protocol used here to remove high-abundancy plasma proteins, which can interfere with the detection of low abundance proteins, may also have prevented identification of any highly abundant proteins involved in POCD pathogenesis. Future studies attempting to examine the role of high abundance proteins in perioperative neurocognitive disorders may thus benefit from avoiding immunodepletion. Fourth, the results of this exploratory study are preliminary, and larger, properly powered future studies are needed to thoroughly assess the role of these proteins and pathways in POCD and/or other perioperative neurocognitive disorders. Such studies will be expensive; the proteomic assays and immunodepletions used in this report cost just under $700 per sample (or slightly below $29,000 for all 42 CSF samples) in addition to the costs of enrolling these patients in the MADCO-PC study, collecting CSF, and data analysis. Nonetheless, there are savings related to economy of scale, and the present cost of performing these assays may drop to $500 or less per sample if hundreds of samples are run in bulk. Thus, performing unbiased proteomics on CSF samples across three different time points from two groups of 32 patients each (i.e., one group with and one group without POCD) may incur approximately $100,000 in assay costs alone. Fifth, it is unclear whether the differential changes in CSF protein levels observed in this study are dri-ven primarily by changes in expression, activity, or turnover initiated within the CNS, versus peripheral inflammation and activation of the coagulation and complement cascades after surgery that crosses the blood-brain barrier into the CNS. Further research comparing postoperative changes in both the CSF and plasma proteomes at multiple simultaneous time points may help evaluate these two different possib-ilities.
In conclusion, this pilot study suggests that un-biased CSF proteomic analyses can be used to study potential mechanisms underlying perioperative neurocognitive disorders and provides preliminary hypothesis-generating evidence to support future investigation of CNS complement and coagulation pathway activation in these conditions. Additionally, the data reported here may guide sample size calculations for future studies to definitively investigate the role of CSF complement and coagulation pathway changes in POCD and other perioperative neurocognitive disorders.
Footnotes
ACKNOWLEDGMENTS
We thank all of the patients who participated in the MADCO-PC study. We also thank Jessica Hu for genotyping assistance, and Wenjing Qi for statistical assistance.
This study was supported by a Duke Anesthesi-ology DREAM Innovation Grant (to MB), NIH R03 AG050918 (to MB), NIH T32GM008600, and a mentored research award from the International Anesthesia Research Society (to MB). MB also acknowledges additional support from NIH grants K76AG057022, P30AG028716, and UH3AG056925, and from the Duke Anesthesiology Department.