
Abstract
Background:
With the more widespread use of 18F-radioligand-based amyloid-β (Aβ) PET-CT imaging, we evaluated Aβ binding and the utility of neocortical 18F-Flutemetamol standardized uptake value ratio (SUVR) as a biomarker.
Objective:
18F-Flutemetamol SUVR was used to differentiate 1) mild cognitive impairment (MCI) from Alzheimer’s disease (AD), and 2) MCI from other non-AD dementias (OD).
Methods:
109 patients consecutively recruited from a University memory clinic underwent clinical evaluation, neuropsychological test, MRI and 18F-Flutemetamol PET-CT. The diagnosis was made by consensus of a panel consisting of 1 neuroradiologist and 2 geriatricians. The final cohort included 13 subjective cognitive decline (SCD), 22 AD, 39 MCI, and 35 OD. Quantitative analysis of 16 region-of-interests made by Cortex ID software (GE Healthcare).
Results:
The global mean 18F-Flutemetamol SUVR in SCD, MCI, AD, and OD were 0.50 (SD-0.08), 0.53 (SD-0.16), 0.76 (SD-0.10), and 0.56 (SD-0.16), respectively, with SUVR in SCD and MCI and OD being significantly lower than AD. Aβ binding in SCD, MCI, and OD was heterogeneous, being 23%, 38.5%, and 42.9% respectively, as compared to 100% amyloid positivity in AD. Using global SUVR, ROC analysis showed AUC of 0.868 and 0.588 in differentiating MCI from AD and MCI from OD respectively.
Conclusion:
18F-Flutemetamol SUVR differentiated MCI from AD with high efficacy (high negative predictive value), but much lower efficacy from OD. The major benefit of the test was to differentiate cognitively impaired patients (either SCD, MCI, or OD) without AD-related-amyloid-pathology from AD in the clinical setting, which was under-emphasized in the current guidelines proposed by Amyloid Imaging Task Force.
Keywords
INTRODUCTION
Mild cognitive impairment (MCI) is a syndromal stage of cognitive continuum, i.e., intermediate stage between cognitively unimpaired and dementia [1]. It is typically diagnosed using clinical judgment and/or on cognitive performance test, with evidence of decline from baseline. However, the criteria are prone to both false positive and false-negative errors [2]. The heterogeneity of the MCI construct could not be overemphasized [3, 4]. MCI might present by cognitive impairments that are not primarily amnesic, or even by neurobehavioral disturbance [1]. In addition, the neuropathological profile of MCI was complex and mixed in pathologies [5–7]. These studies suggested intermediate levels of neuritic plaques and neurofibrillary tangles in MCI [7], or reflected an intermediate stage not always at the level associated with a neuropathological diagnosis of Alzheimer’s disease (AD) [6]. Although MCI is a transitional phase of conversion to dementia, non-progression has been common [8]. Several key factors moderated the rates of deterioration, such as the classification of MCI, subtype of MCI and the clinical setting. Notably, amyloid-β (Aβ) deposition seems to play an important role in MCI progression to AD [9, 10].
The incorporation of biomarkers in establishing etiologic likelihood and predicting MCI progression to AD dementia have been advocated [4, 12]. Recently, a biological definition of AD proposed that the in vivo presence of fibrillar Aβ would classify the patient in the category of AD pathologic change, with or without evidence of tau or neuronal degeneration [1]. Positron emission tomography (PET) imaging is an in vivo imaging technique for detection of amyloid pathology [4, 11–13]. A meta-analysis of longitudinal studies for detecting conversion of MCI subjects to AD dementia or other forms of dementia using 11C-labelled Pittsburgh Compound B (11C-PIB) PET at baseline showed moderate sensitivities (83–100%) and low to moderate specificities (46–88%) [14]. With the advent of 18F-PET ligands (i.e., Florbetapir, Florbetaben, and Flutemetamol) for Aβ, similar research is ongoing, although the number of included studies is still limited [15–17].
Dichotomous classification of amyloid PET scans (11C- or 18F-) using visual rating as positive or negative, is a commonly employed method. A previous 18F-flutemetamol study based on visual assessment found a sensitivity of 93.1%and a specificity of 93.3%in discriminating AD from healthy volunteers based on clinical diagnosis [18]. However, in clinical routine binary visual assessment, the earliest in vivo amyloid deposits in specific neocortical association areas were suboptimal [19, 20]. A distinct subgroup of pathologically diagnosed pre-AD with very early phases of Aβ deposition can be subdivided into 18F-Flutametamol amyloid PET positive and amyloid PET negative cases [19]. Hence, direct quantification might improve the use of amyloid imaging as a biomarker, as regionally restricted amyloid deposits in specific neocortical association areas were missed in binary visual assessment or semi-quantitative classification based on supra-threshold global cortical signal [20]. Quantification also provides additional information about regional and global tracer uptake, and might have utility for image assessment over time and across different centers [21].
The appropriate use criteria (AUC) for amyloid PET proposed by Amyloid Imaging Task Force [22] justified the use of amyloid imaging in patients with unexplained MCI, possible AD (atypical or etiologically mixed) and early onset progressive dementia. A recent study found that current AUC are not sufficiently able to discriminate between patients who will and will not benefit from amyloid PET [23]. The authors suggested that current AUC is predisposed toward selecting MCI with AD pathological change and AD phenotypes, which needs to initiate AD drugs or trial participation. In clinical practice, amyloid PET has particular value in demonstrating the absence of AD pathology. A change in diagnosis from possible AD to non-AD dementia (such as vascular dementia [VaD]) can alter patient management such as drug modification and prognostication. As subjective cognitive decline (SCD), MCI, AD, and non-AD dementias are clinical constructs, we hypothesized that amyloid has a putative role in subtyping and differentiating these entities [5–7]. In this study, we investigated the efficacy of non-selective use of 18F-Flutemetamol PET-CT in patients with cognitive impairment consecutively recruited from a university memory clinic. Firstly, we evaluated the heterogeneity of in-vivo amyloid binding in cognitively impaired clinical syndromes including SCD, MCI, AD, and non-AD dementias. Secondly, we hypothesized that the neocortical amyloid retention as measured by standardized uptake value ratio (SUVR) be useful as a quantitative biomarker to differentiate 1) MCI from AD, and 2) MCI from other non-AD dementias.
METHODS
Participants
Cognitively impaired/dementia subjects were consecutively referred by the geriatricians of the memory clinic of a university hospital to participate in a combined 18F-Flutemetamol PET amyloid/MRI study during the period from June 2017 to June 2019. Based on the inclusion criteria, all subjects were required to be 55 years old or over and had an informant such as a caregiver. Any subject with a history of stroke, head injury, seizure, migraine, cancer within 5 years, active infection, renal or other organ failure, psychiatric illness, regular alcohol or drug abuse, deafness or other physical barrier was excluded from the study. Informed consent obtained from all non-demented participants, and from the next of kin/caregivers of demented subjects. Approval of the research protocol by the local Institutional Review Board (IRB) was obtained.
All the subjects underwent clinical evaluation, neuropsychological test, magnetic resonance imaging (MRI) including structural, MR angiography, Arterial Spin Labeling MR perfusion, and 18F-Flutemetamol PET-CT scanning. The duration between MRI and PET-CT scanning was within one week.
Clinical and neuropsychological assessment
Each subject had clinical assessment and underwent the local version of Montreal Cognitive Assess-ment (HK-MoCA) [24].
18F-Flutemetamol PET-CT imaging acquisition
All subjects were required to fast for at least 6 h and rest in a dimmed room waiting for tracer injection. A bolus of 18F-flutametamol was administered intravenously (within 40 s) to the patients at a dosage of 185 Mbq (approximately 5 mCi). The scanning started at 90 min after injection, using an integrated in-line PET/CT scanner with 3D list mode. Filtered back-projection reconstruction was used with a slice thickness of 2 to 4 mm, matrix size of 128 *128 with the pixel size of 2 mm. A full width half-maximum (FWHM) post-smoothing filter was applied, of not more than 5 mm. The duration of the scan lasted 30 min [18, 25].
MRI acquisition
MR images were acquired by a 3T clinical scanner (Philips Healthcare, Achieva) using a 32-channel head coil at the university imaging center. MRI sequences with parameters as follows: Three-dimen-sional (3D) T1-weighted MPRAGE using repeti-tion time (TR) = 6.8 ms, echo time (TE) = 3.2 ms, thickness = 1.2 mm, flip angle = 8, field of view (FOV) = 256×240×204 (mm), matrix = 256×240; 3D FLAIR using TR = 6.8 ms, TE = 3.2 ms, thick-ness = 1.2 mm, field of view (FOV) = 250×250×184 (mm), matrix = 208×207; 2D Pseudo-contin-uous ASL (PCASL) with background suppression using single shot EPI to cover the whole brain with parameters: TR = 4500 ms, flip angle 90, FOV = 240×240×119 (mm), matrix = 80×77, slices thickness = 7 mm, labeling duration = 1650 ms, post-labeling delay (PLD) = 2000 ms. In addition, MR angiography (MRA) of head, resting state functional MRI, susceptibility- and diffusion-weighted images were also acquired. The scanning time of each subject was 45 min in total.
PET/MRI imaging analysis
The final images for each subject consisted of fused MRI (3D MPRAGE) and 18F-Flutemetamol PET images. The post-processing procedure included realignment, co-registration and normalization using semi-automatic commercially available software (Cortex ID software, GE Healthcare Ltd., USA). The scans were interpreted as positive (abnormal) or negative (normal) by a neuroradiologist (HKFM) who had successfully completed an electronic training program developed by GE Healthcare for the interpretation of 18F-Flutemetamol images [26].
In addition, quantitative analysis of 16 region-of-interests (ROIs) was made by Cortex ID software, including bilateral prefrontal, anterior cingulate, precuneus/posterior cingulate, parietal, lateral temporal, occipital, sensorimotor, and mesial temporal regions. Normalized for injected dose and body weight of each subject, standardized uptake values (SUVs) were calculated in all regions. The standardized uptake value ratio (SUVR) was the ratio between two SUVs of different regions but within a single scan, which avoided the bias of injected activity, the body weight and the volume to mass conversion factor and referenced to pons in our data. The composite SUVR representing the global Aβ burden was the average SUVR value of the area-weighted mean for the 16 cortical ROIs. Cortex ID also offered regional z-scores as compared with normal database for 18F-flutemetamol.
Dementia/cognitively impaired subtype classification
A final diagnosis of the dementia subject such as AD, VaD, mixed dementia (MD), frontotemporal dementia (FTD), Lewy-body dementia (DLB), and progressive supranuclear palsy (PSP) was made by consensus of a panel consisting of 1 neuroradiologist (HKFM) and 2 geriatricians (YFS, PC, or JSKK). Such classification was based on the following findings, i.e., clinical (baseline and follow-up), neuropsychological (HK-MoCA), amyloid PET-CT, structural MRI, MRI angiography, and ASL-MRI (Table 1).
Database with subtypes classification incorporated with clinical and PET/MRI findings
The panel made the diagnoses of SCD according to Jessen [27] and MCI according to Peterson [28]. Subtypes of MCI were determined by amyloid positivity or negativity, and presence or absence of microvascular/microvascular MRI changes. For dementia patients, a definitive diagnosis of AD was made based on clinical criteria by McKhann [13] plus a positive amyloid scan, whereas definitive diagnosis of VaD was based on clinical criteria by Román [29], plus a negative amyloid scan, microvascular MRI changes, or macrovascular MRA abnormalities. Mixed dementia was diagnosed if the patient fulfilled both AD and VaD criteria. Diagnoses of other rarer dementias were made such as semantic and logopenic variants of primary progressive aphasia according to Montembeault [30], behavioral variant of AD according to Ossenkoppele [31], posterior cortical atrophy according to Crutch [32], dementia with Lewy bodies according to McKeith [33], and progressive supranuclear palsy according to Hoglinger [34]. MR perfusion patterns by PCASL could provide supplementary information on a case-by-case basis.
Statistical analysis
The statistical analysis was by SPSS software (SPSS version 23.0.0, Chicago, IL, USA). The mean SUVR values (and their standard deviations) in all regions with normality of distribution were validated by the Shapiro-Wilk test. The categorical group difference (such as gender) was by Chi-square test. The group differences of continuous variables including HK-MoCA score and age were by One-Way ANOVA. The level of significance was classified with star labeling between two groups ( * p < 0.05; ** p < 0.01; *** p < 0.001; **** p < 0.0001).
The statistical evaluations among groups were by ANCOVA test controlling for age and sex. Bonferroni was used as post-hoc multiple comparisons to establish differences of mean value in each global binding and specific regional binding.
Receiver-operating-characteristic (ROC) analysis with area under ROC curve (AUC) was to evaluate the optimal cortical regions to discriminate MCI from AD or non-AD dementias (OD). The accuracy of single ROI, as well as various combinations of ROIs, was from the logistic regression analysis. The corresponding Youden index (= sensitivity+specificity - 1), optimal cutoff, sensitivity, and specificity were calculated. All p values are two-sided.
RESULTS
Between July 2017 and June 2019, 109 patients consecutively recruited from the memory clinic to participate in the study. The final cohort consisted of 13 SCD, 22 AD, 39 MCI, 17 VaD, 14 MD, 2 DLB, 1 PSP with dementia, and 1 FTD (Table 1). The etiologic sub-types of major diagnostic categories also listed (according to final diagnoses made by expert panel). For MCI, underlying etiologies included AD pathologic change, vascular, DLB, and PSP components. AD patients further classified into typical and non-typical sub-types. Non-typical AD included three early-onset (EOAD) and four atypical (1 behavioral variant AD, 2 posterior cortical atrophy, and 1 logopenic variant of primary progressive aphasia) AD. Furthermore, VaD, MD, DLB, PSP, and FTD (semantic variant of primary progressive aphasia) subjects were subsequently grouped together as non-AD dementias (OD) group (n = 35).
Findings on demographic characteristics, and neuropsychological test scores of SCD, MCI, AD, and OD were in Table 2. There were no significant differences in age between all groups, except that OD had significantly higher age than SCD, MCI, and AD. There was no significant difference in sex among all sub-groups. The HK-MoCA scores were not significantly different in MCI and SCD but were significantly higher in both groups than AD and OD.
Demographics
aOD compares with SCD ***. bOD compares with MCI ***. cOD compares with AD **. dSCD compares with AD ****. eSCD compares with OD **. fMCI compares with AD ****. gMCI compares with OD **.
The 18F-Flutemetamol SUVR values (with SD) in both global and regional levels were presented in Table 3 according to the four groups, i.e., SCD, MCI, AD, and OD. With adjustment for age and sex, AD had significantly higher global Aβ retention than SCD (p < 0.0001), MCI (p < 0.0001), and OD (p < 0.001), while the remaining three groups showed no significant difference. Similarly, except mesial temporal region, all regional amyloid retention in AD was higher than the other three groups, but no significant difference among the three groups.
The mean values of global and regional binding according to diagnostic group (mean with SD)
* p < 0.05; ** p < 0.01; *** p < 0.001; **** p < 0.0001.
The global and regional 18F-Flutemetamol SUVR in MCI (amyloid-positive and amyloid-negative sub-types), AD (typical and non-typical), and OD (amyloid-positive and amyloid-negative subtypes) are shown in Supplementary Table 1. The composite and regional SUVR of amyloid-positive MCI (0.69±0.12) showed no significant difference from typical AD (0.76±0.10), non-typical AD (0.75±0.09), and amyloid-positive OD (0.70±0.12). Similarly, amyloid-positive OD showed no significant difference from typical and non-typical AD. Conversely, amyloid-negative MCI (0.42±0.04) showed no significant difference from amyloid-negative OD (0.45±0.06), but significant differences from typical and non-typical AD, amyloid-positive MCI, and amyloid-positive OD. In view of small number of SCD subjects, the amyloid-positive (3/13) and amyloid-negative (10/13) subtypes were not included in the comparison.
Based on the established threshold (SUVR of 0.62) used for differentiating positive and negative scan in global binding [21], approximately 28%MCI subjects had positive global Aβ burden while 91%AD and 31%of OD subjects had positive PET scan (Fig. 1A). In Fig. 1B, applying the global cut-off derived from our study (0.58), 31%MCI, 95%AD, and 34%OD had positive amyloid burden.
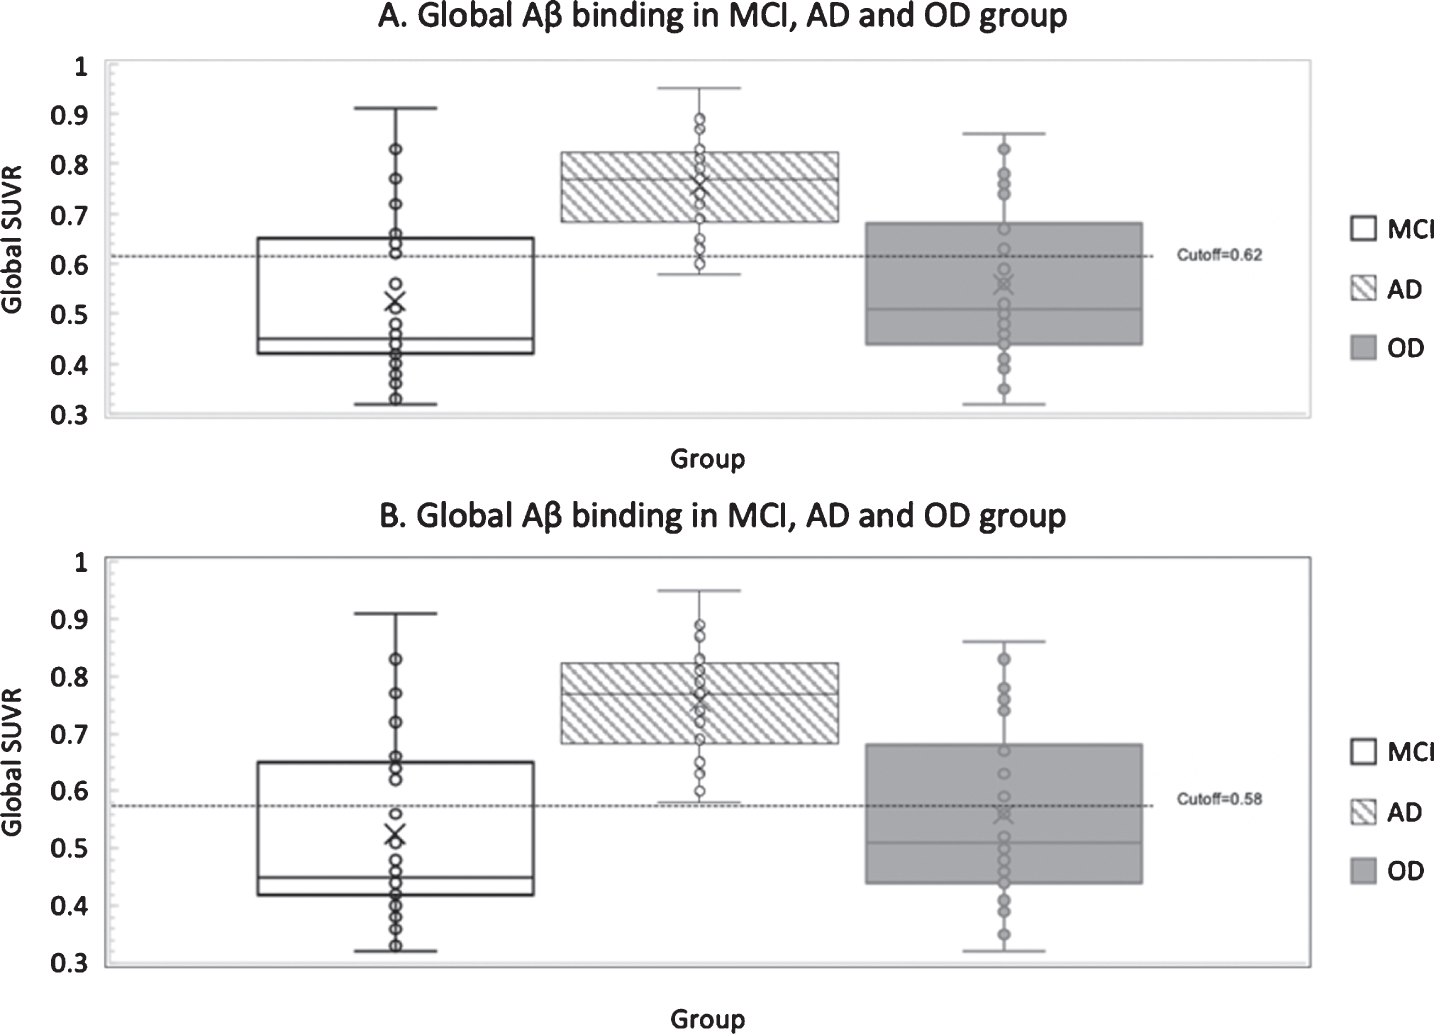
A) mean global Aβ binding in MCI, AD, and OD groups with given threshold (0.62); B) mean global Aβ binding in MCI, AD, and OD groups with calculated optimal cut off (0.58).
Figure 2 showed the comparison between visual, and composite quantitative SUVR, i.e., based on established SUVR threshold of 0.62 [21] or optimal cut-off derived from current study of 0.58 in the classification of disease groups. The visual method had the highest positive detection, with high concor-dance between the visual and quantitative classification. The percentage concordance between visual read, and quantitative SUVR at the threshold of 0.58 (current study) and 0.62 (according to Thurfjell) was summarized in Table 4. In 109 subjects, the concordance was 92.7%(101/109) and 89.9%(98/109) at the threshold of 0.58 and 0.62, respectively. The Cohen’s kappa of visual versus quantitative threshold of 0.58 and 0.62 were 0.853 and 0.799, representing strong and moderate to strong agreement, respectively.
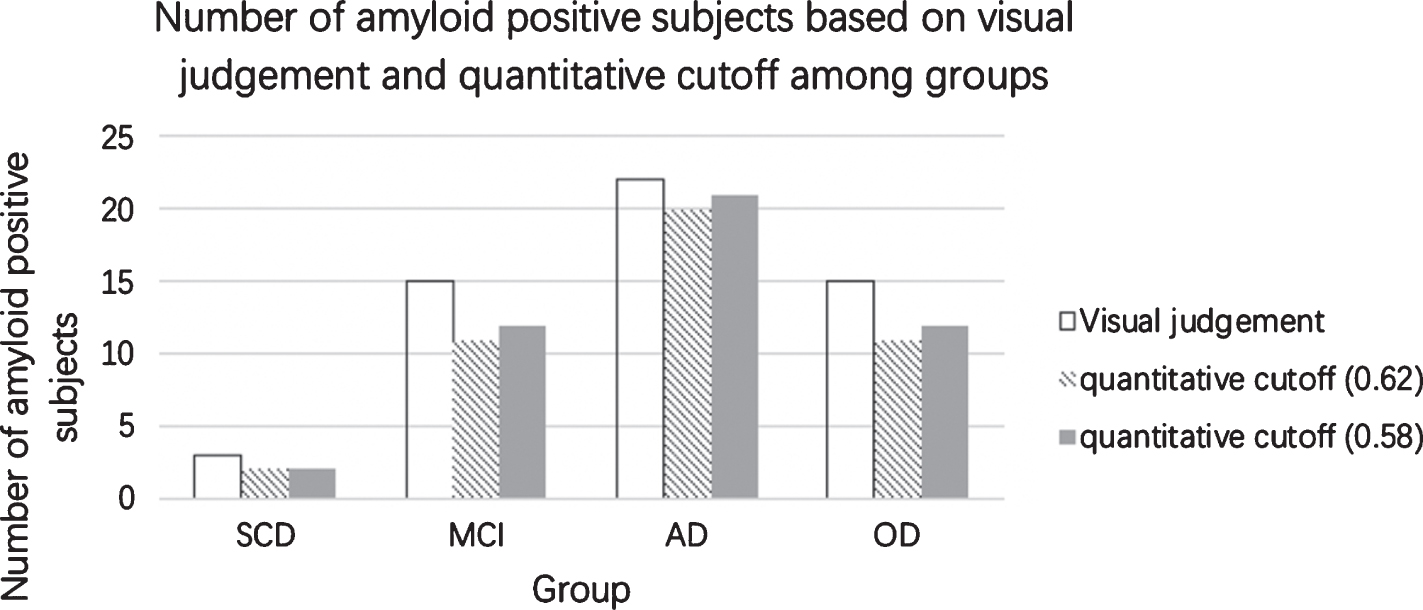
Number of amyloid positive subjects based on visual judgement and quantitative cutoff among groups.
Concordance between visual method and quantitative threshold
In the ROC analysis, using global SUVR (with cut-offs of 0.58 and 0.46, respectively), AUC-0.868, Sensitivity-100%; Specificity-69%, Accuracy-79%, and AUC-0.588, Sensitivity-74%; Specificity-51%, Accuracy-59%were achieved in differentiating MCI from AD, and MCI from OD, respectively (Table 5).
Sensitivity, specificity, cutoff, Youden index, accuracy, and AUC values of the optimal single and combined ROIs based on the AUC between groups
Using regional SUVR in differentiating MCI from AD (Table 5), the largest AUC was 0.896 in the left occipital region (100%sensitivity, 72%specificity, 82%accuracy). The left lateral temporal region presented the second largest AUC of 0.888 (96%sensitivity, 74%specificity, 79%accuracy), and followed by left parietal region with AUC of 0.885 (100%sensitivity, 67%specificity, and 80%accuracy).
For the differentiation of MCI and OD (Table 5), the right occipital region was optimal with the largest AUC value of 0.608 (86%sensitivity, 41%specificity, and 61%accuracy). The left occipital region and left precuneus/posterior cingulate had relatively close AUC values to right occipital region, being 0.602 and 0.590, respectively.
For the differentiation of MCI and AD groups, combining left lateral temporal and left occipital lobes yield the highest AUC (0.901) as compared to other single ROI or combined ROIs. The sensitivity, specificity and accuracy were 86%, 85%and 57%respectively. The corresponding optimal cutoff was 0.42. In differentiating between MCI and OD groups, the highest AUC value (0.608) was by using right occipital lobe only (Table 5).
Supplementary Figures 1, 2, 3 showed the ROC curves in discriminating between MCI and AD, MCI and OD, and OD and AD respectively.
DISCUSSION
Amyloid binding in SCD, MCI, AD, and non-AD dementia
We found that AD had significantly higher global and regional (except mesial temporal) Aβ retention than SCD, MCI, and OD, while the rest of the three groups showed no significant difference. However, the composite and regional 18F-Flutemetamol SUVR of amyloid-positive MCI showed no significant difference from typical AD, non-typical AD, and amyloid-positive OD.
Similar to a neuropathological study [5], multiple underlying etiologies were found in the current MCI cohort, including AD pathologic change (23%), purely vascular (38%), mixed AD and vascular (13%), other underlying causes such as DLB (3%) and PSP (3%), and non-specific with the clinical syndrome only (20%). It was typical to find a bi-variate distribution for amyloid in the MCI population [35], with approximately half of the subjects evidencing a higher level of amyloid resembling AD and half showing lower levels similar to healthy controls. 38.5%of MCI was amyloid-positive in our cohort by visual rating, including AD pathologic change, mixed AD pathologic and vascular changes, and DLB.
An interesting finding of current study was that 18F-Flutemetamol PET demonstrated no significant difference in magnitude (Supplementary Table 1) or topological distribution (Supplementary Figure 4) of amyloid burden between amyloid-positive MCI and AD (including typical and non-typical subtypes). This was in contradistinction to the findings in pathological studies, which suggested intermediate levels of neuritic plaques and neurofibrillary tangles in amnesic MCI [6, 7]. This discrepancy may be explained by the fact that different plaque types exist [36, 37] and the amyloid tracer binding does not necessarily reflect the density of neuritic plaques. False-positive cases had mainly diffuse amyloid plaques, i.e., plaques without neuritic pathology or dense amyloid core [38, 39].
Controversies in MCI studies still exist, such as the threshold necessary for the burden to be pathological, the existence of neural tolerance or compensation effects, the effects of the severity and location of the pathology, the presence of disease comorbidity, brain reserve and age [6]. A previous study [19] showed that 18F-Flutemetamol PET-CT was not sensitive enough to detect initial stages of amyloid pathologies in pathologically diagnosed pre-AD (non-demented individuals with AD pathology). Hence, visually or supra-threshold amyloid-positive MCI patient by 18F-Flutemetamol PET-CT could represent very late stage of the syndrome or prodromal AD [3].
Moreover, the global and regional amyloid burden in amyloid-positive OD (including mixed AD and VaD, and DLB) showed no significant difference from amyloid-positive MCI, and AD. Hence, the presence of disease comorbidities in OD might not influence the progressive accumulation of amyloid.
Taken together, we should recognize the heterogeneity of amyloid binding by 18F-Flutemetamol PET-CT in clinical syndromes like MCI and OD, which included amyloid-positive and amyloid-negative patients. Such amyloid-positive MCI (AD and mixed types) and OD (mixed and DLB types) had similarly high 18F-Flutemetamol SUVR as AD, suggesting a late stage of the disease. As the majority of MCI (61.5%) and OD (57.1%) were amyloid-negative, the use of 18F-Flutemetamol PET-CT could easily differentiate such patients from AD. The SUVR overlap of amyloid-positive MCI (or prodromal AD) and amyloid-positive OD (predominantly mixed AD/vascular dementia) with AD might lead to false-positive results but could be remedied by clinical evaluation. Indeed, the clinical management of prodromal AD and mixed dementia did not differ drastically from pure AD. In clinical practice, amyloid PET has particular value in demonstrating the absence of AD pathology, but such an indication was not mentioned ‘or underemphasized’ in the AUC proposed by Amyloid Imaging Task Force [23]. The subsequent discussion showed the efficacy (mainly negative predictive value) of the quantitative SUVR in differentiating cognitively impaired subjects (such as SCD, MCI, or OD) without AD pathology from AD in a real-life clinical setting.
Another important finding was that no significant difference in magnitude of global and regional amyloid burden in typical versus non-typical (early onset and atypical) AD patients (Supplementary Table 1). We found high amyloid binding in posterior cingulate/precuneus, lateral temporal, anterior cingulate, and parietal regions in AD. In accordance with prior studies, highest amyloid binding was seen in the precuneus [10, 40–43] and anterior cingulate [42, 43] in typical AD.
Previous studies reported in early onset AD that left superior temporal and cuneus [44], lateral temporal [40, 46], parietal [46–48], and occipital [45, 48] regions demonstrate increased Aβ. Non-memory AD phenotypes with ‘atypical’ clinical presentations have been recognized and are more frequently seen in patients with early onset of AD [49]. Posterior cortical atrophy (occipitotemporal or biparietal variants) includes presentation with higher cortical visual dysfunction, or a constellation of parietal dysfunctions such as dyspraxia and dyscalculia. Fluent and non-fluent aphasia syndromes, logopenic progressive aphasia, and prominent executive dysfunction (behavioral or frontal variant) could be presentations of AD. In our cohort of non-typical AD consisting of 3 early-onset and 4 atypical (1 behavioral variant AD, 2 posterior cortical atrophy, and 1 logopenic variant of primary progressive aphasia) patients, a higher amyloid burden in the occipital regions were present, although not statistically different from typical AD. However, larger sample size is required to validate the finding.
In view of small sample size of SCD subjects, due caution in interpretation was required. The amyloid-positivity (3/13) was only 23%in our cohort, in contradistinction to a prior study showing much higher (8/14 = 57%) amyloid PIB positivity [50]. Unlike other studies [51], our study showed a similar global neocortical amyloid uptake in SCD and MCI. In our SCD cohort, 8 had no related clinical history (2 being amyloid-positive), while 3 had depression (one being amyloid-positive), 1 with family history of dementia, and 1 with alcoholic abuse. There was significant association between SCD and depression [52] and higher risk of developing MCI/dementia when depression and SCD co-occurred [53]. Therefore, it is important to ascertain the presence of premorbid psychiatric conditions in SCD patients recruited in different studies prior to any comparison.
Visual versus 18F-Flutemetamol supra-threshold SUVR cut-off in differentiation of patient groups
There was a high concordance of detection of amyloid positivity by visual and optimal cut-off threshold of 0.58 (used in current study) and the established cut-off threshold of 0.62 [21] in all patient groups, being 93%and 90%respectively.
Thurfjell et al. [21] achieved in a 99.4%(171/172) concordance between quantitative and visual characterization of 18F Flutametamol scans. However, in their test cohort of 172 subjects, 59 were healthy volunteers (34.3%), which would facilitate a higher concordance.
The quantitative threshold derived from current study (0.58) was the same as one of the 3 thresholds adopted in Thurfjell’s study (i.e., 0.62, 0.58, and 0.56). In their study, there was no significant difference in concordance by using 0.58 and 0.62 as threshold.
Efficacy of 18F-flutemetamol PET in differentiating MCI from AD, and MCI from OD
In this study, quantitative global and regional Aβ binding by 18F-flutemetamol PET could be employed to discriminate between AD and MCI. Our results concurred with a prior study using quantitative evaluation. Using 11C-PIB, Jack and colleagues [43] reported an AUC value of 0.85 in discriminating amnesic MCI from AD using global retention. The AUC result of 0.869 in the current study (Table 5) was on par with their study, albeit in a more real-life setting since our MCI cohort was composed of different subtypes (Table 1), and cognitively impaired subjects were consecutively recruited.
The high efficacy, i.e., 100%sensitivity, 69%specificity, and 79%accuracy (Table 4) could be due to two reasons: 1) only 15/39 (38.5%) subjects in our MCI cohort were amyloid positive on visual rating, and 2) mean SUVR of MCI was lower than AD (0.53±0.16 versus 0.76±0.10, Table 2). The prevalence of amyloid positivity in this cohort was lower than that of a prior meta-analysis, which found 54.6%for age of 75 [54]. In addition, higher amyloid load in AD than MCI [10, 43], and in amnesic MCI (aMCI) than non-amnesic MCI (naMCI) subjects [55] were previously reported.
Regional binding in left lateral temporal, and left occipital cortices achieved high AUC (0.888 and 0.896, respectively) in differentiating between MCI and AD (Table 5). Combining two ROIs (left lateral temporal with left occipital), the AUC value (0.901) was higher than using left lateral temporal or occipital lobe alone. The occipital neocortex is affected by Aβ deposition later than the basal part of the frontal and temporal lobes according to the hierarchical regional progression pattern [20, 57]. Since amyloid deposition in the occipital lobe (visual isocortex) represent a late stage of the AD (Stage C, Braak & Braak classification), it was not surprising that the region provided the best discrimination of AD from MCI.
Although amyloid-positive MCI (AD and mixed types) had similarly high 18F-Flutemetamol SUVR as AD, the majority of MCI (61.5%) were amyloid-negative. Hence, the occipital regional SUVR might provide the best discrimination of AD from MCI as a whole group than other regions. It is rather surprising to find amyloid binding in the occipital cortex in amyloid-positive MCI as such deposition should occur along with the advancement of AD. However, Jack et al. proposed that subject-specific lag in time between biomarker evidence of in-situ AD pathophysiology and the emergence of cognitive impairment is probably mediated by differences in cognitive reserve [58]. Hatashita et al. [9] found that in MCI patients with long conversion, cortical PIB SUVR at baseline did not significantly differ from that in MCI patients with short conversion. The factors related to cognitive reserve or other downstream factors could affect cognitive decline and long duration of progression from MCI to AD.
The efficacy of 18F-flutemetamol binding in the discrimination of MCI and OD groups was much less satisfactory using global and regional SUVR (Table 5 and Supplementary Figure 2). The reason was due to a similar heterogeneity of MCI and OD in composition and greater overlap in SUVR between the two groups (Fig. 1A and 1B). Comparable to a prior study on probable AD [5], we found presence of mixed pathologies. The proportion of amyloid-negative non-AD dementia in our OD cohort (i.e., 20/35) was 57.1%. The majority was due to VaD as in the real-life setting [59, 60].
In a nutshell, quantitative global or regional SUVR by 18F-flutemetamol PET differentiated MCI from AD with high efficacy, but lower efficacy from non-AD dementias, in the setting of a specialized memory clinic for patients with cognitive impairment. The most significant finding was the high (approaching 100%) negative predictive value (NPV) of quantitative 18F-flutemetamol PET in differentiating MCI from AD using appropriate cut-off (Table 5). A previous 18F-flutemetamol PET quantitative study [61] reported a sensitivity of 89%and a specificity of 80%, based on progression from amnesic MCI to AD at 2 years of follow-up. Another similar study [62] found a sensitivity of 64%and a specificity of 69%, at 3 years of follow-up. Our study on the use of 18F-flutemetamol SUVR as a biomarker might be more relevant and applicable in a busy clinical setting, instead of a delayed verification approach based on long-term follow-up and clinical diagnosis.
In other clinical settings, studies have found amyloid PET could increase diagnostic confidence and alter management plan in MCI/dementia [63–67]. A meta-analysis on the impact of amyloid PET imaging in the memory clinic [68] revealed at a pooled effect of change in diagnosis of 35.2%(95%CI 24.6–47.5). However, such studies did not provide efficacy indices for the diagnostic test to be usable clinically.
Our study has the following limitations: Firstly, the sample size is limited. However, the study conducted in a real-life clinical setting and patient recruitment was consecutive. Secondly, final diagnosis of each subject was not by histopathology as gold standard. The widespread use of both in vivo amyloid and tau PET imaging for characterization of AD and its phenotypes would be a good substitute of histopathology in the future [1, 12]. To avoid misunderstanding, we want to emphasize that the final diagnosis was mainly based on clinical criteria, supported by structural MRI (microvascular MRI changes or macrovascular MRA abnormalities), imaging biomarkers (such as MR perfusion pattern, hippocampal atrophy and amyloid PET-CT), and neuropsychological (HK-MoCA) scores. Amyloid positivity was a criterion to differentiate AD-related pathologic change from non-AD pathology. In reality, the amyloid status might not influence the final diagnosis. For example, a diagnosis of DLB was made on clinical ground with support by MR perfusion, since such patients might be amyloid positive or negative.
Thirdly, no APOE ɛ4 status was determined, which closely correlated with dysregulation of amyloid deposition [69]. Finally, multimodal imaging may be better than single modality and should be further investigated [61, 70].
In summary, cognitive impaired subjects such as SCD, MCI, and non-AD dementia show heterogeneity in amyloid binding, as compared to AD. Nonetheless, amyloid-positive MCI, AD (typical and non-typical) and amyloid-positive non-AD dementia showed no significant difference in amyloid burden and topology. There is a high concordance of visual versus supra-threshold SUVR cut-off in detection of amyloid positivity using 18F-Flutemetamol PET-CT. Quantitative global or regional 18F-flutemetamol SUVR differentiated MCI from AD with high efficacy (NPV approaching 100%), but lower efficacy from non-AD dementias. In a real-life clinical setting (busy memory clinic), the major benefit of the test was to differentiate cognitively impaired patients (either SCD, MCI, or OD) without AD-related-amyloid-pathology from AD, which was under-emphasized in the current AUC proposed by Amyloid Imaging Task Force.