
Abstract
Background:
It has been proposed that amyloid-β (Aβ) plays a causal role in Alzheimer’s disease (AD) by triggering a series of pathologic events—possibly including neuroinflammation—which culminate in progressive brain atrophy. However, the interplay between the two pathological molecular events and how both are associated with neurodegeneration is still unclear.
Objective:
We aimed to estimate the spatial inter-relationship between neurodegeneration, neuroinflammation and Aβ deposition in a cohort of 20 mild AD patients and 17 healthy controls (HC).
Methods:
We resorted to magnetic resonance imaging to measure cortical atrophy, using the radiotracer 11C-PK11195 PET to measure neuroinflammation levels and 11C-PiB PET to assess Aβ levels. Between-group comparisons were computed to explore AD-related changes in the three types of markers. To examine the effects of each one of the molecular pathologic mechanisms on neurodegeneration we computed: 1) ANCOVAs with the anatomic data, controlling for radiotracer uptake differences between groups and 2) voxel-based multiple regression analysis between-modalities. In addition, associations in anatomically defined regions of interests were also investigated.
Results:
We found significant differences between AD and controls in the levels of atrophy, neuroinflammation, and Aβ deposition. Associations between Aβ aggregation and brain atrophy were detected in AD in a widely distributed pattern, whereas associations between microglia activation and structural measures of neurodegeneration were restricted to few anatomically regions.
Conclusion:
In summary, Aβ deposition, as opposed to neuroinflammation, was more associated with cortical atrophy, suggesting a prominent role of Aβ in neurodegeneration at a mild stage of the AD.
Keywords
INTRODUCTION
Alzheimer’s disease (AD) is considered the most common form of dementia and the presence of amyloid-β (Aβ) plaques and neurofibrillary tangles composed of hyperphosphorylated tau proteins are its key neuropathological hallmarks, leading to progressive brain atrophy [1, 2]. In addition, neuroinflammation, mediated by the activation of microglial cells, is also believed to be a pathological element of the disease [3, 4]. The activation of microglia cells is the intrinsic brain immune response to the pathological mechanisms occurring in the brain [5]. However, the exact role of microglia activation in the disease, as well as its time course and its interplay with Aβ and cortical atrophy remains unclear. Nevertheless, in general it is suggested that microglial activation may play a protective role in the beginning of the disease by clearing Aβ, remodeling synapses and releasing growth factors [6–9]. But exceeding a certain level of activation it may became deleterious to the brain through cytokine release, which might promote tau hyperphosphorylation [10–12]. The comprehension of the role of neuroinflammation in AD is important as a biomarker for monitoring disease detection and progression, as well as for the development of therapeutic strategies.
A well-accepted theory proposes that abnormal Aβ accumulation causes synaptic dysfunction and neuronal loss, for which the exact mechanisms are still controversial [13], resulting in cognitive decline and dementia [2, 13]. In turn, an alternative amyloid cascade/neuroinflammation theory postulates that the activation of microglia as response to Aβ deposition leads to the release of neurotoxic substances, resulting in tau phosphorylation and neurodegenerative changes [10, 12]. In fact, work on postmortem AD brains have found increased activated microglia near to amyloid plaques [14–18], as well as an association between these two processes [16], implying microglia in the pathogenesis and/or progression of the pathology.
Different radiotracers have been developed which are capable to measure Aβ retention or activated microglia through positron emission tomography (PET), in vivo. The radiotracer 11C-PK11195 is a ligand to the Peripheral Benzodiazepine Receptor (PBR, also known as the ’18 kDa Translocator Protein’ or ‘TSPO’), a receptor abnormally expressed by the mitochondria of activated microglia [19]. 11C-Pittsburgh Compound-B (PiB) allows detection and quantification of Aβ plaque aggregation, because it binds to fibrillar Aβ plaques found in the AD brain [20]. Whereas a widespread 11C-PiB cortical uptake has been consistently found in AD brains [20–23] results across studies on 11C-PK11195 PET tracer remain controversial [24, 25]. Of those that found a significant presence of microglia activation, only a part has found it associated with Aβ uptake [26–28].
Considering the current debate concerning the role of neuroinflammation in AD, new studies are of utmost importance, namely in early AD stages, since the majority of the AD studies have focused on mild-to-moderate AD patients. Although the literature suggests that both microglial activation and Aβ deposition may lead to brain atrophy, it remains uncertain whether and how patterns of metabolic alterations correlate between them, i.e., how Aβ relates with neuroinflammation and if they interact in promoting cortical neurodegeneration.
In the present study we aimed to address this issue by measuring grey matter (GM) volume to assess cortical atrophy using MRI, in conjunction with mapping Aβ deposition resorting to 11C-PiB PET imaging and microglia tracer 11C-PK11195 PET to evaluate brain neuroinflammation, in AD patients at a relatively early-stage and healthy matched subjects (gender, age, and education). To achieve this goal, we have first tested the between group differences in terms of GM volume, Aβ load, and neuroinflammation, and thereafter we computed voxel-wise regression analysis and region of interest (ROI)-based correlation analysis to investigate the spatial relationships between the three modalities of brain imaging. Clarifying these relationships in AD could provide important insights into disease mechanisms and improve therapeutic approaches.
METHODS
Participants
For the present study, we recruited 41 individuals: 20 patients with early diagnosis (less than 2 years) of AD, at the mild stage of dementia according to Clinical Dementia Rating (CDR = 1), and 21 HC matched for age, sex, and education. We selected AD patients with a probable diagnosis supported by biological biomarkers (CSF and PiB-PET) from the Memory Clinic of the Centro Hospitalar e Universitário de Coimbra (CHUC), who were submitted to a comprehensive neuropsychological assessment, including: Cognitive instruments as the Mini-Mental State Examination (MMSE) with Portuguese normative data, the Montreal Cognitive Assessment (MoCA) and a comprehensive neuropsychological battery with normative data for the Portuguese population (BLAD) exploring memory and other cognitive domains.
The AD diagnosis was made according to the Diagnostic and Statistical Manual of Mental Disorders –fourth edition (DSM-IV-TR) [29] and the National Institute of Neurological and Communicative Disorders and Stroke- Alzheimer’s Disease and Related Disorders (NINCDS-ADRDA) [30]. Detailed clinical information about the AD group can be found in a previous work [31].
To the control group we recruited 21 healthy volunteers from the community without neurologic or psychiatric disorders, no severe visual or auditory impairment, and eligible to an MRI exam. In order to guarantee a normal cognitive status, this group was also submitted to a brief cognitive assessment. Thus, all HC had no significant memory complaints (Subjective Memory Complaints Questionnaire – SMC ≤3) [32, 33], had a normal general cognitive function as tested by the MoCA (mean±sd, 24.88±4.24) [34] preserved daily living activities (Lawton & Brody scale –L&B for Female = 8; for Male = 5) [35, 36], and no evidence of [37, 38] moderate or severe depressive symptoms (30-item Geriatric Depressive Scale –GDS-30, mean±SD 6.41±6.20). All participants underwent 11C-PK11195 PET and 11C-PiB PET imaging. Four participants from the control group were found positive for the 11C-PiB PET exam, being excluded from the subsequent analysis. In fact, about 30% of the normal elderly individuals’ evidence significant levels of Aβ deposition short of clinically cognitive decline [39]. Thus, all AD patients were 11C-PiB PET positive while all the controls which were considered in this study were 11C-PiB PET negative. All subjects included in the study performed 3 visits to ICNAS-UC (Institute of Nuclear Sciences Applied to Health, University of Coimbra), where all imaging procedures were performed, in the first visit patients underwent MRI acquisition, while in the second and third visits, participants underwent 11C-PiB PET and 11C-PK11195 PET scans, respectively, with a maximum interval of 5 weeks between examinations.
The study was approved by the Ethics Committee of the Faculty of Medicine, University of Coimbra. All subjects participated voluntarily and gave their informed written consent for the study, following the tenets of the Declaration of Helsinki, after clarification of the nature and possible implications of the study.
MRI imaging
In the first visit, MRI data were collected using a Siemens Magnetom TIM Trio 3 Tesla scanner (Siemens, Munich, Germany) with a phased array 12-channel birdcage head coil. For all the participants, the MRI data acquisition protocol consisted of 3D structural MR imaging scans using a T1-weighted MPRAGE (magnetization-prepared rapid gradient echo) magnetic resonance imaging pulse sequence (TR 2530 ms; TE 3.42 ms; TI 1100 ms; flip angle 7°; 176 single-shot interleaved slices with no gap with isotropic voxel size 1×1×1 mm; FOV 256 mm).
MRI data were pre-processed in SPM12 (Version 12, Wellcome Trust Centre for Neuroimaging, London, UK), and executed in MATLAB software (version 8.1.0 R2013a, The Mathworks, MA) through its computational anatomy toolbox (CAT12) (http://dbm.neuro.uni-jena.de/cat/), which allows fully automatic cortex segmentation for the posterior voxel-based morphometry (VBM) analysis.
In a first step, T1-weighted images were normalized to a template space and automatically segmented into GM, white matter (WM), and cerebrospinal fluid (CSF), relying on prior probability tissue maps, assigning to each voxel a value representing the proportion of the corresponding tissue type [40]. To the spatial normalization, the subject’s brain was aligned to a standard MNI template, resorting to the high-dimensional registration DARTEL algorithm [41], using linear affine transformation and further non-linear warping. Thereon, in order to restore tissue volumes modified during normalization processing, Jacobian modulation was applied [42]. At the end of the automatic segmentation procedure, normalized GM maps were smoothed by an 8 mm FWHM kernel, helping to improve the inaccurate nature of the anatomical standardization.
PET acquisition
The 11C-PiB PET and 11C-PK11195 PET were acquired using a Philips Gemini GXL PET/CT scanner (Philips Medical Systems, Best, the Nether-lands), during the second and third visits, respectively. In each visit, the participants performed the respective dynamic 3-dimensional PET scan of the entire brain (90 slices, 2 mm slice sampling) and a low-dose brain CT scan, for attenuation correction. The dynamic 11C-PiB PET image consists of 24 frames (total duration of 90 min: 37 frames: 4×15s+ 8×30s + 9×60s + 2×180s + 14×300s) and the dynamic 11C-PK11195 image of 22 frames (total duration of 60 min: 4×30s + 4×60s + 4×120s +4×240s + 6×300 s). The 11C-PiB PET or 11C-PK11195 PET image acquisition sessions started immediately after the intravenous bolus injection of approximately 555 MBq of 11C-PiB or 370 MBq of 11C-PK11195. To minimize head movement, the patient’s head was restrained with a soft elastic tape. The PET images were reconstructed to a 128×128×90 matrix, with 2 mm isotropic voxel dimension, using the LOR RAMLA algorithm (Philips PET/CT Gemini GXL) with attenuation and scatter correction.
PET image pre-processing and quantitative analysis
The PET image pre-processing and quantitative analysis pipeline was analogous for both type of PET data and was performed independently for the 11C-PiB PET and 11C-PK11195 PET sessions. Prior to pre-processing and quantitative analysis, the dynamic PET data used in this work were submitted to a frame-by-frame visual inspection to ensure that no coarse artifacts (e.g., related to radiotracer preparation, image acquisition and reconstruction, head motion) were present. In this work, given the sample size and the potential of confounding associations due to correlations between the GM volume and partial volume correction, we did not apply partial volume correction to the dynamic PET data. For each session, a sum image was obtained using all the frames of the dynamic PET. The sum image was used to estimate a rigid transformation between the 11C-PiB PET image space or 11C-PK11195 PET image space and the T1 anatomical MRI space of each participant. The rigid transformations were determined using 3D Slicer 4.8.1 (http://www.slicer.org) [43]. The individual MRI scans were spatially normalized to the to the Montreal Neurological Institute (MNI) template using DARTEL algorithm [41] in SPM12.
The voxel-level quantitative analysis of 11C-PiB PET images and 11C-PK11195 PET images was implemented in the MNI space using in-house made software. The individual 11C-PiB standard uptake value ratio (SUVR) map was computed by summing voxel-level signal from 40 to 70 min post-injection, and dividing by the mean signal from the individual’s reference region, the cerebellar grey matter (essentially the cerebellum without the cerebellar peduncles) [44–46]. The individual 11C-PK11195 Binding Potential (BP) maps were generated using the MRTM2 (Multilinear Reference Tissue Model 2) [47]. The reference region was determined by the algorithm SVCA4 (Supervised Cluster Analysis with 4 classes: grey matter without specific binding, white matter, blood, grey matter with specific binding) [48] which selected a group of grey matter voxels showing a time-activity curve representing the kinetic activity of normal grey matter without 11C-PK11195 specific binding. The SUVR and BP maps were then transformed and resampled to the corresponding native MRI space using spatial transformations estimated in previous steps of the pipeline. Prior to SPM and BPM (see below) analysis PET datasets were smoothed with an 8 × 8 × 8 mm FWHM Gaussian filter.
Statistical analysis
A total of 20 mild stage AD patients and 17 matched HC were considered for both VBM-GM and 11C-PiB PET SUVR statistical parametric mapping analysis. For the 11C-PK11195 PET BP analysis only 19 AD and 17 HC were considered, since one AD patient gave up the exam.
After assessing for data normality using the Shapiro-Wilk test, T-test for unpaired samples or its non-parametric version, the Mann-Whitney test, were used for between-groups comparisons of the demographic and neuropsychological data. Fisher’s Exact Test was used for comparing categorical variables (Sex). For the statistical analysis of these variables, we used IBM SPSS Statistics (version 22.0). The tests were performed two-tailed, and a threshold of p < 0.05 was set for statistical significance.
In a first approach, in order to test whether GM volume, 11C-PK11195 BP and 11C-PiB SUVR were different between AD and HC groups we performed at voxel-level group comparisons by computing two-sample t-tests in SPM12. For the VBM data, TIV (total intracranial volume) was used as a covariate to account for the difference in brain sizes.
Biological Parametric Mapping (BPM) [49], a MATLAB toolbox integrated in SPM5, was used to examine the local associations between GM volume, Aβ, and neuroinflammation. The BPM toolbox was used in MATLAB (version 7.12 (R2011a)). The BPM computes the General Linear Model (GLM) at each voxel and allows multiple regressions as either correlations tests between more than one imaging modality, while allowing for inclusion of non-imaging covariates. In a first step, we have computed an ANCOVA entering the VBM-GM images as the primary modality and the corresponding 11C-PiB SUVR images as the covariate image (imaging regressor). This analysis allowed testing for differences between AD and HC groups in grey-matter volumetric data (VBM-GM) controlling for differences in 11C-PiB SUVR data, and thus to detect the GM differences in AD that were not explained by between group differences in Aβ levels. Secondly, we computed two multiple regression analysis in the AD group: 1) entering GM-VBM as the dependent variable and the corresponding 11C-PiB SUVR data as the imaging regressor, to investigate the effects of 11C-PiB SUVR levels on GM volume; 2) entering VBM-GM as the dependent variable and the corresponding 11C-PK11195 BP data as the imaging regressor, to investigate the regions where GM volume associated with microglia activation. We performed both regressions controlling for age and the presence of outliers (bi-square robust regression), and a GM mask (the average of all 20 AD subjects) was applied in order to remove any voxels that did not belong to the GM tissue, and thus limiting the problems with multiple comparisons. Posteriorly, we have repeated the same regression analysis but merging both groups (17 HC and 20 AD).
In addition, the correlation between the 11C-PiB SUVR images and 11C-PK11195 BP images was calculated on a voxel-by-voxel basis with the BPM correlation design in the AD group, in order to examine the regions showing associations between both pathological molecular measures.
Moreover, we have also complemented the whole brain voxel-by-voxel analysis with the more sensitive analysis at the ROI level. Firstly, we investigate associations between VBM-GM and 11C-PK11195 BP data, and between 11C-PiB PET and 11C-PK11195 PET data in the regions that revealed microglia activation in AD patients, in order to examine associations between GM and microglia, and between the latter and Aβ load in these regions. As such, the clusters that revealed higher microglia activation in AD were used to define masks that were then applied to extract the regional mean values of 11C-PiB SUVR, VBM-GM, and 11C-PK11195 BP in AD subjects.
Secondly, we performed ROI-based correlation tests in a set of anatomically defined regions from the AAL (Automated Anatomical Labeling) atlas [50] for right and left hemispheres individually namely: frontal superior, frontal middle, frontal inferior orbital, insula, cingulum anterior, cingulum posterior, hippocampus, parahippocampal, amygdala, lingual, occipital middle, occipital inferior, fusiform, parietal inferior, angular, precuneus, temporal superior, temporal middle, temporal inferior regions. We have extracted for each ROI the mean values of each data modality: 11C-PiB SUVR, VBM-GM, and 11C-PK11195 BP, to each AD patient in MRI native space. Given the normal distribution of the data, as assessed by the Shapiro-Wilk test, Pearson correlation tests were computed between VBM-GM and 11C-PiB SUVR, VBM-GM, and 11C-PK11195 BP, and between 11C-PiB SUVR and 11C-PK11195 BP in each ROI. We conducted this analysis in IBM SPSS Statistics (version 22.0).
The distinct statistical power of each image modality prevented us to use the same statistical thresholds levels across the various voxel-wise analysis. For example, the signal relative to 11C-PK11195 PET uptake is lower than the signal of 11C-PiB PET uptake, resulting in part from the lower density of activated microglia with regard to Aβ plaques, and also due to the lower signal to-noise ratio of 11C-PK11195 PET tracer. Thus, we were more liberal regarding the statistical thresholds for the 11C-PK11195 PET data analysis, to prevent Type II errors. Nonetheless, the statistical thresholds used are in line with the literature, we opted by thresholds that let us prevent the above-mentioned type of error and being too conservative.
The resulting statistical T-maps and the correspondent unthresholded effect size (Cohen’s d) maps determined using CAT12 toolbox, were overlaid on the T1-weighted template in the axial plane.
RESULTS
Concerning the demographic data, no evidence of a difference in age, sex or education was found between groups but, as expected, a significant difference was found regarding MoCA scores (Table 1).
Demographics features of all participants
AD, patients with Alzheimer’s disease; HC, healthy controls; SD, standard deviation; MMSE, Mini-Mental State Examination; MoCA, Montreal cognitive assessment; CDR, Clinical Dementia Rating; Data are expressed as mean±SD, except for female/male ratio.
VBM
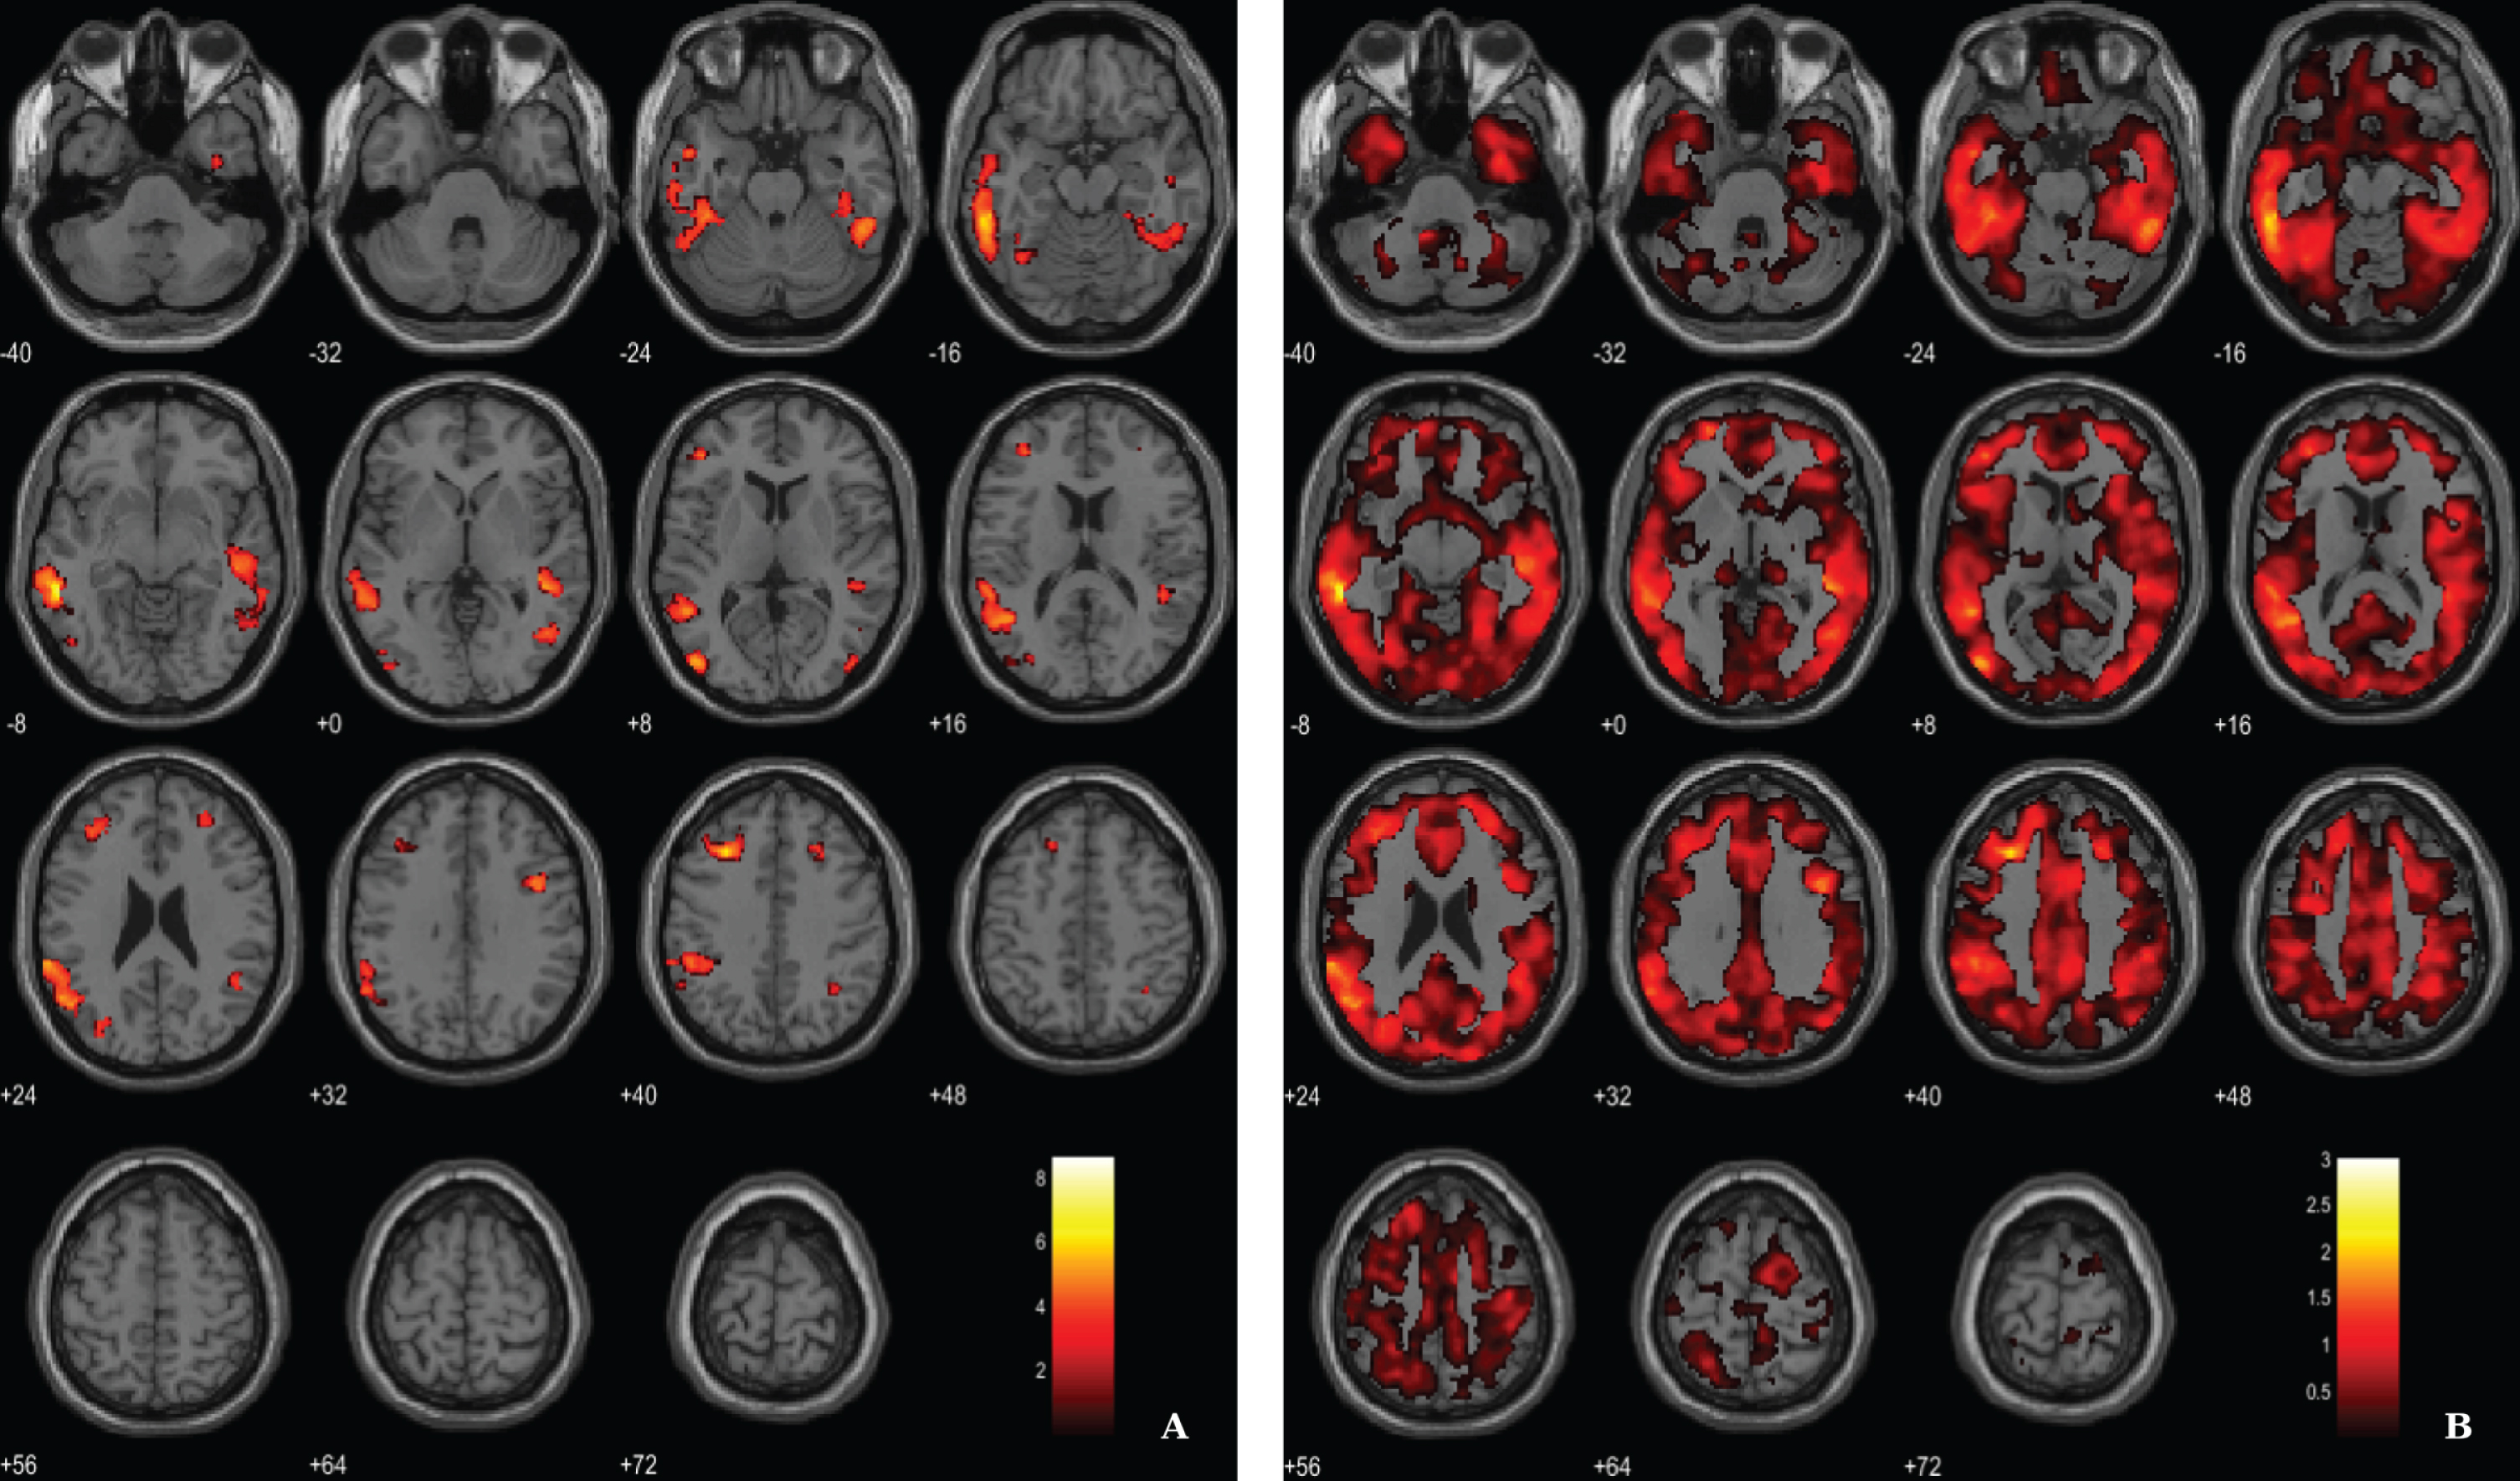
For the between-groups comparisons of VBM data we used a voxel-wise statistical threshold of p < 0.005, false discovery rate corrected (FDR), with and extent threshold of 100 voxels. The resulting clusters were considered significant using a statistical threshold of p < 0.05 (FDR corrected, cluster level). Results show, as expected, a significant diffuse pattern of volume loss in AD brains (Fig. 1). Evident GM atrophy was seen in regions known preferentially affected in the disease, as following: middle and inferior temporal areas, regions from the medial temporal lobe and cingulate areas. Information about the significant peak points, number of voxels and respective p-value as well as MNI coordinates are provided in Table 2.
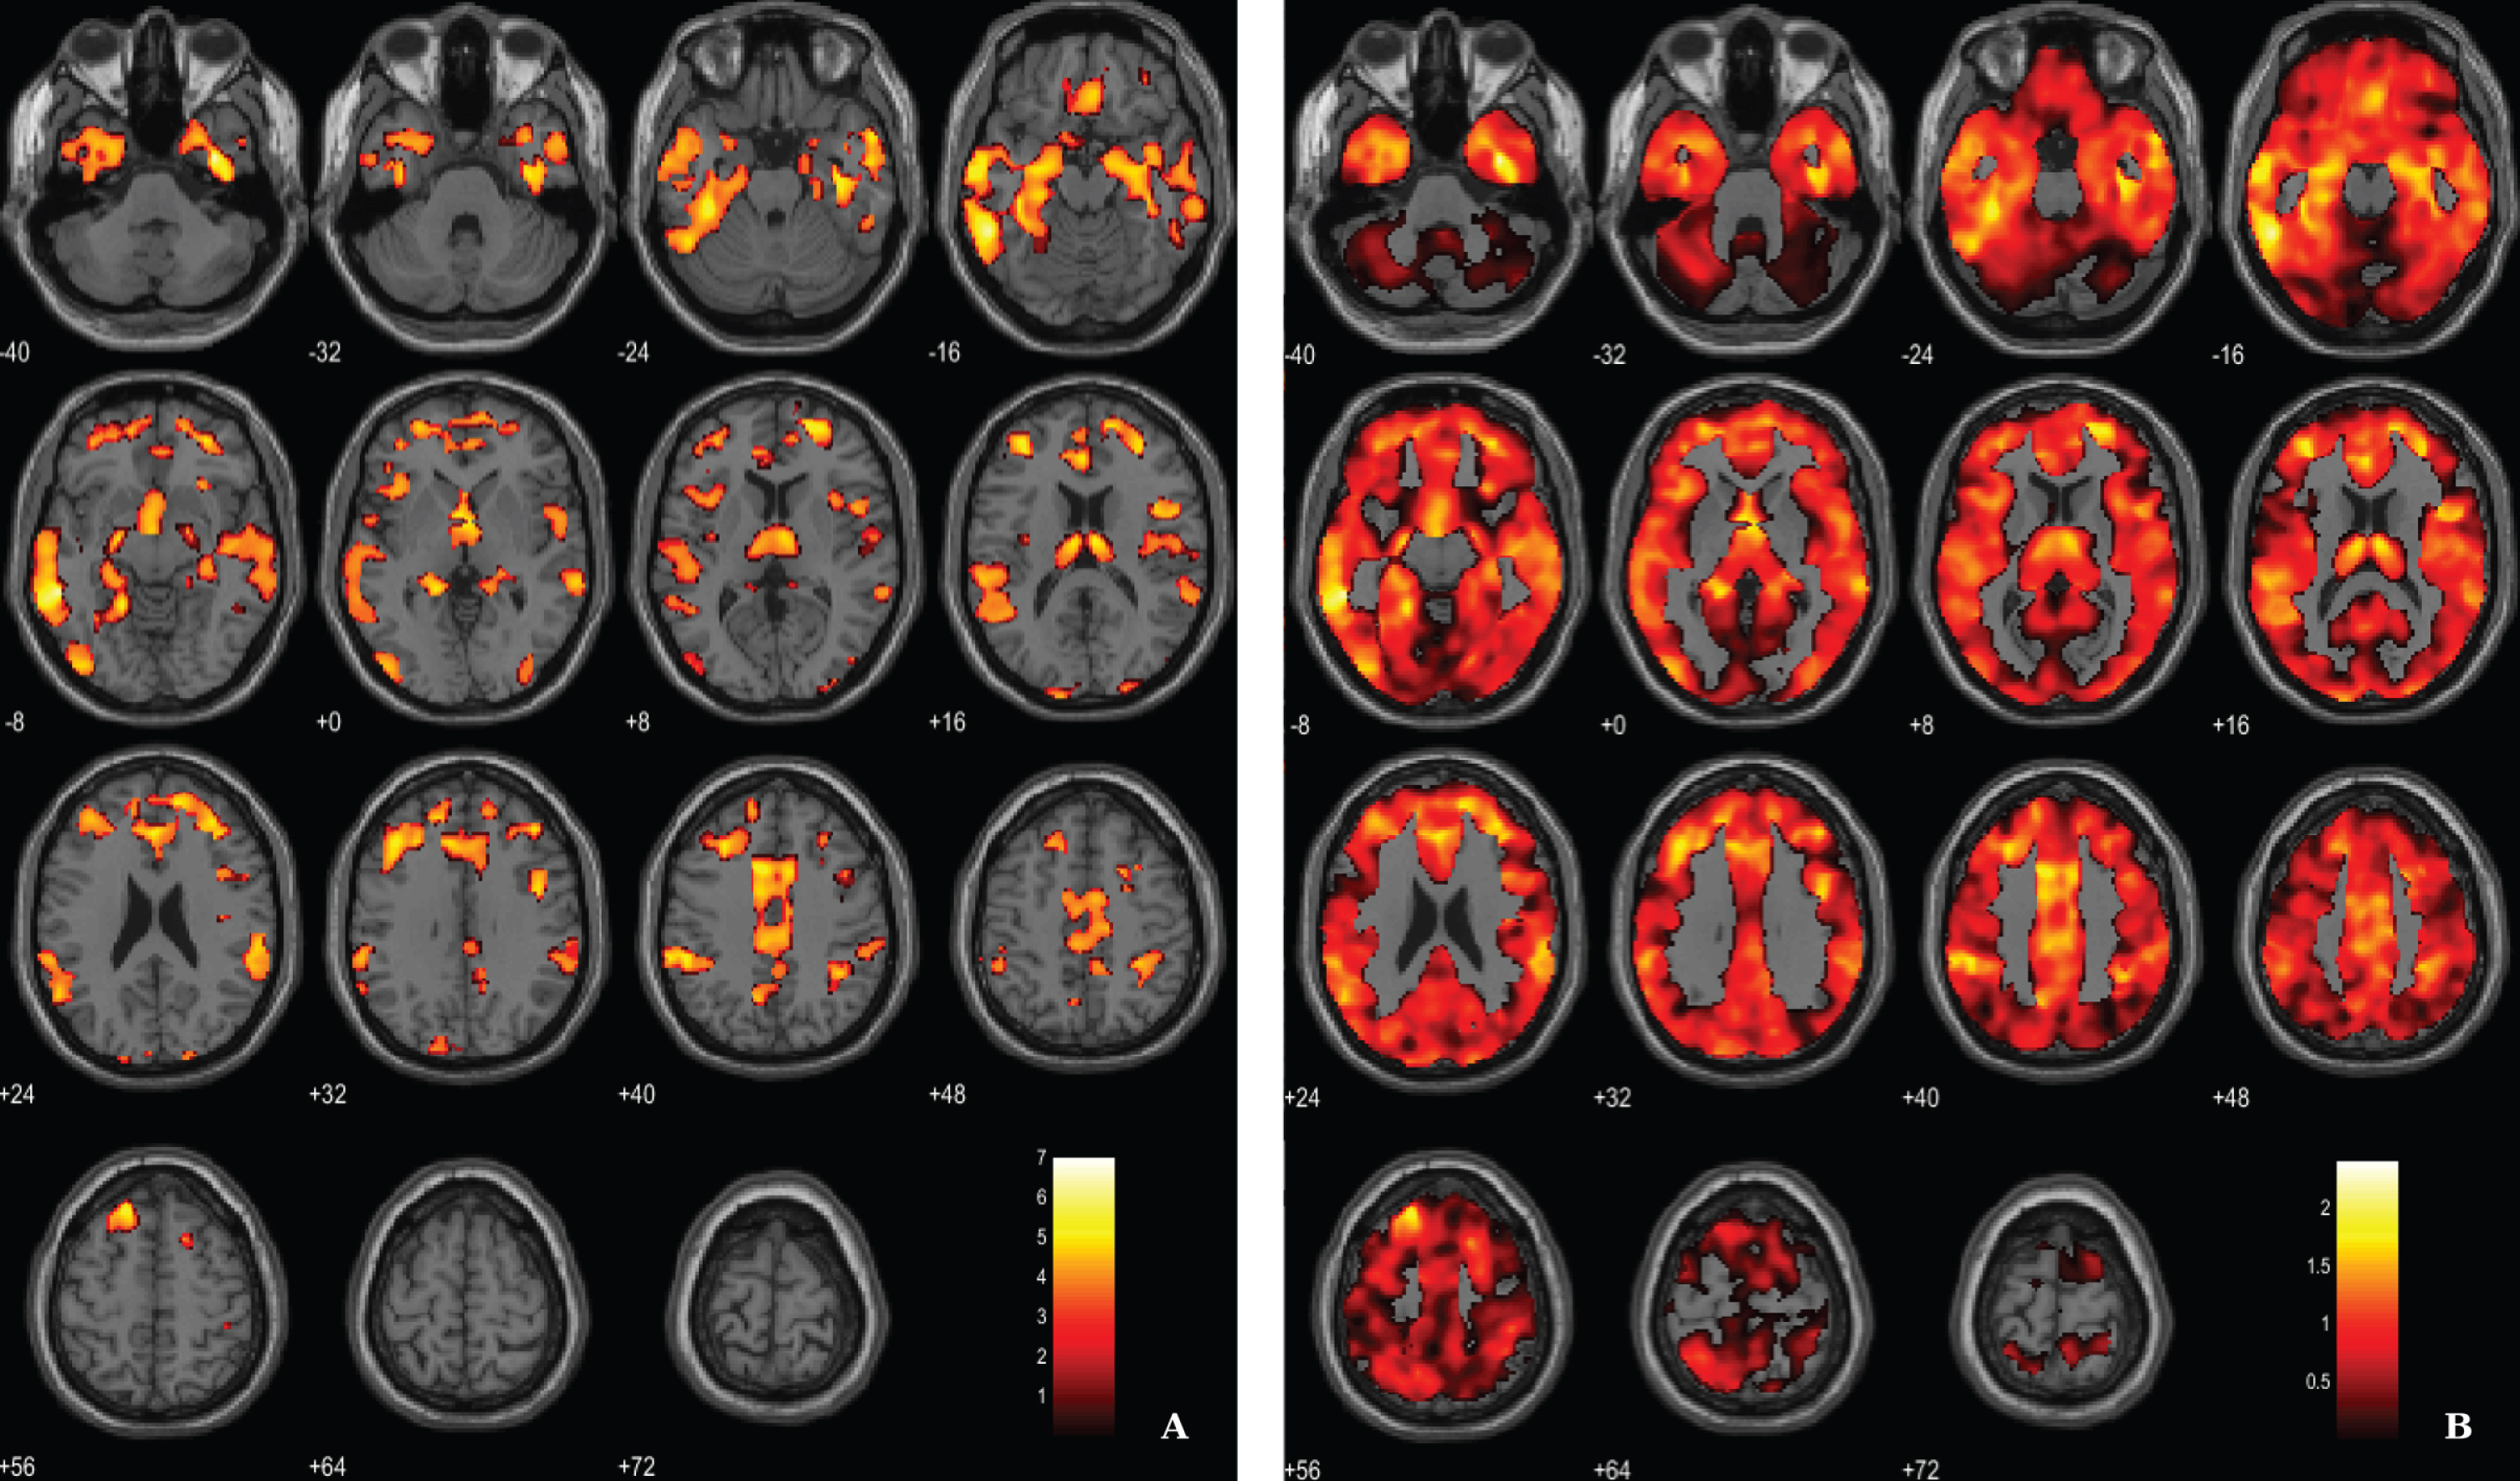
Voxel-based between-group comparison of GM maps superimposed on the T1-weighted template in the axial plane for the AD < HC contrast. A) Thresholded T-map (p < 0.005, FDR corrected at voxel-level, cluster size > 100 voxels). B) Unthresholded effect size (Cohen’s d) map.
Regions of significantly reduced GM volume in AD patients compared to HC
BA, Broadman areas; clusters were considered significant using a voxel-wise statistical threshold of p < 0.005 (FDR corrected for multiple comparisons) with an extent threshold of 100 voxels.
11C-PiB PET
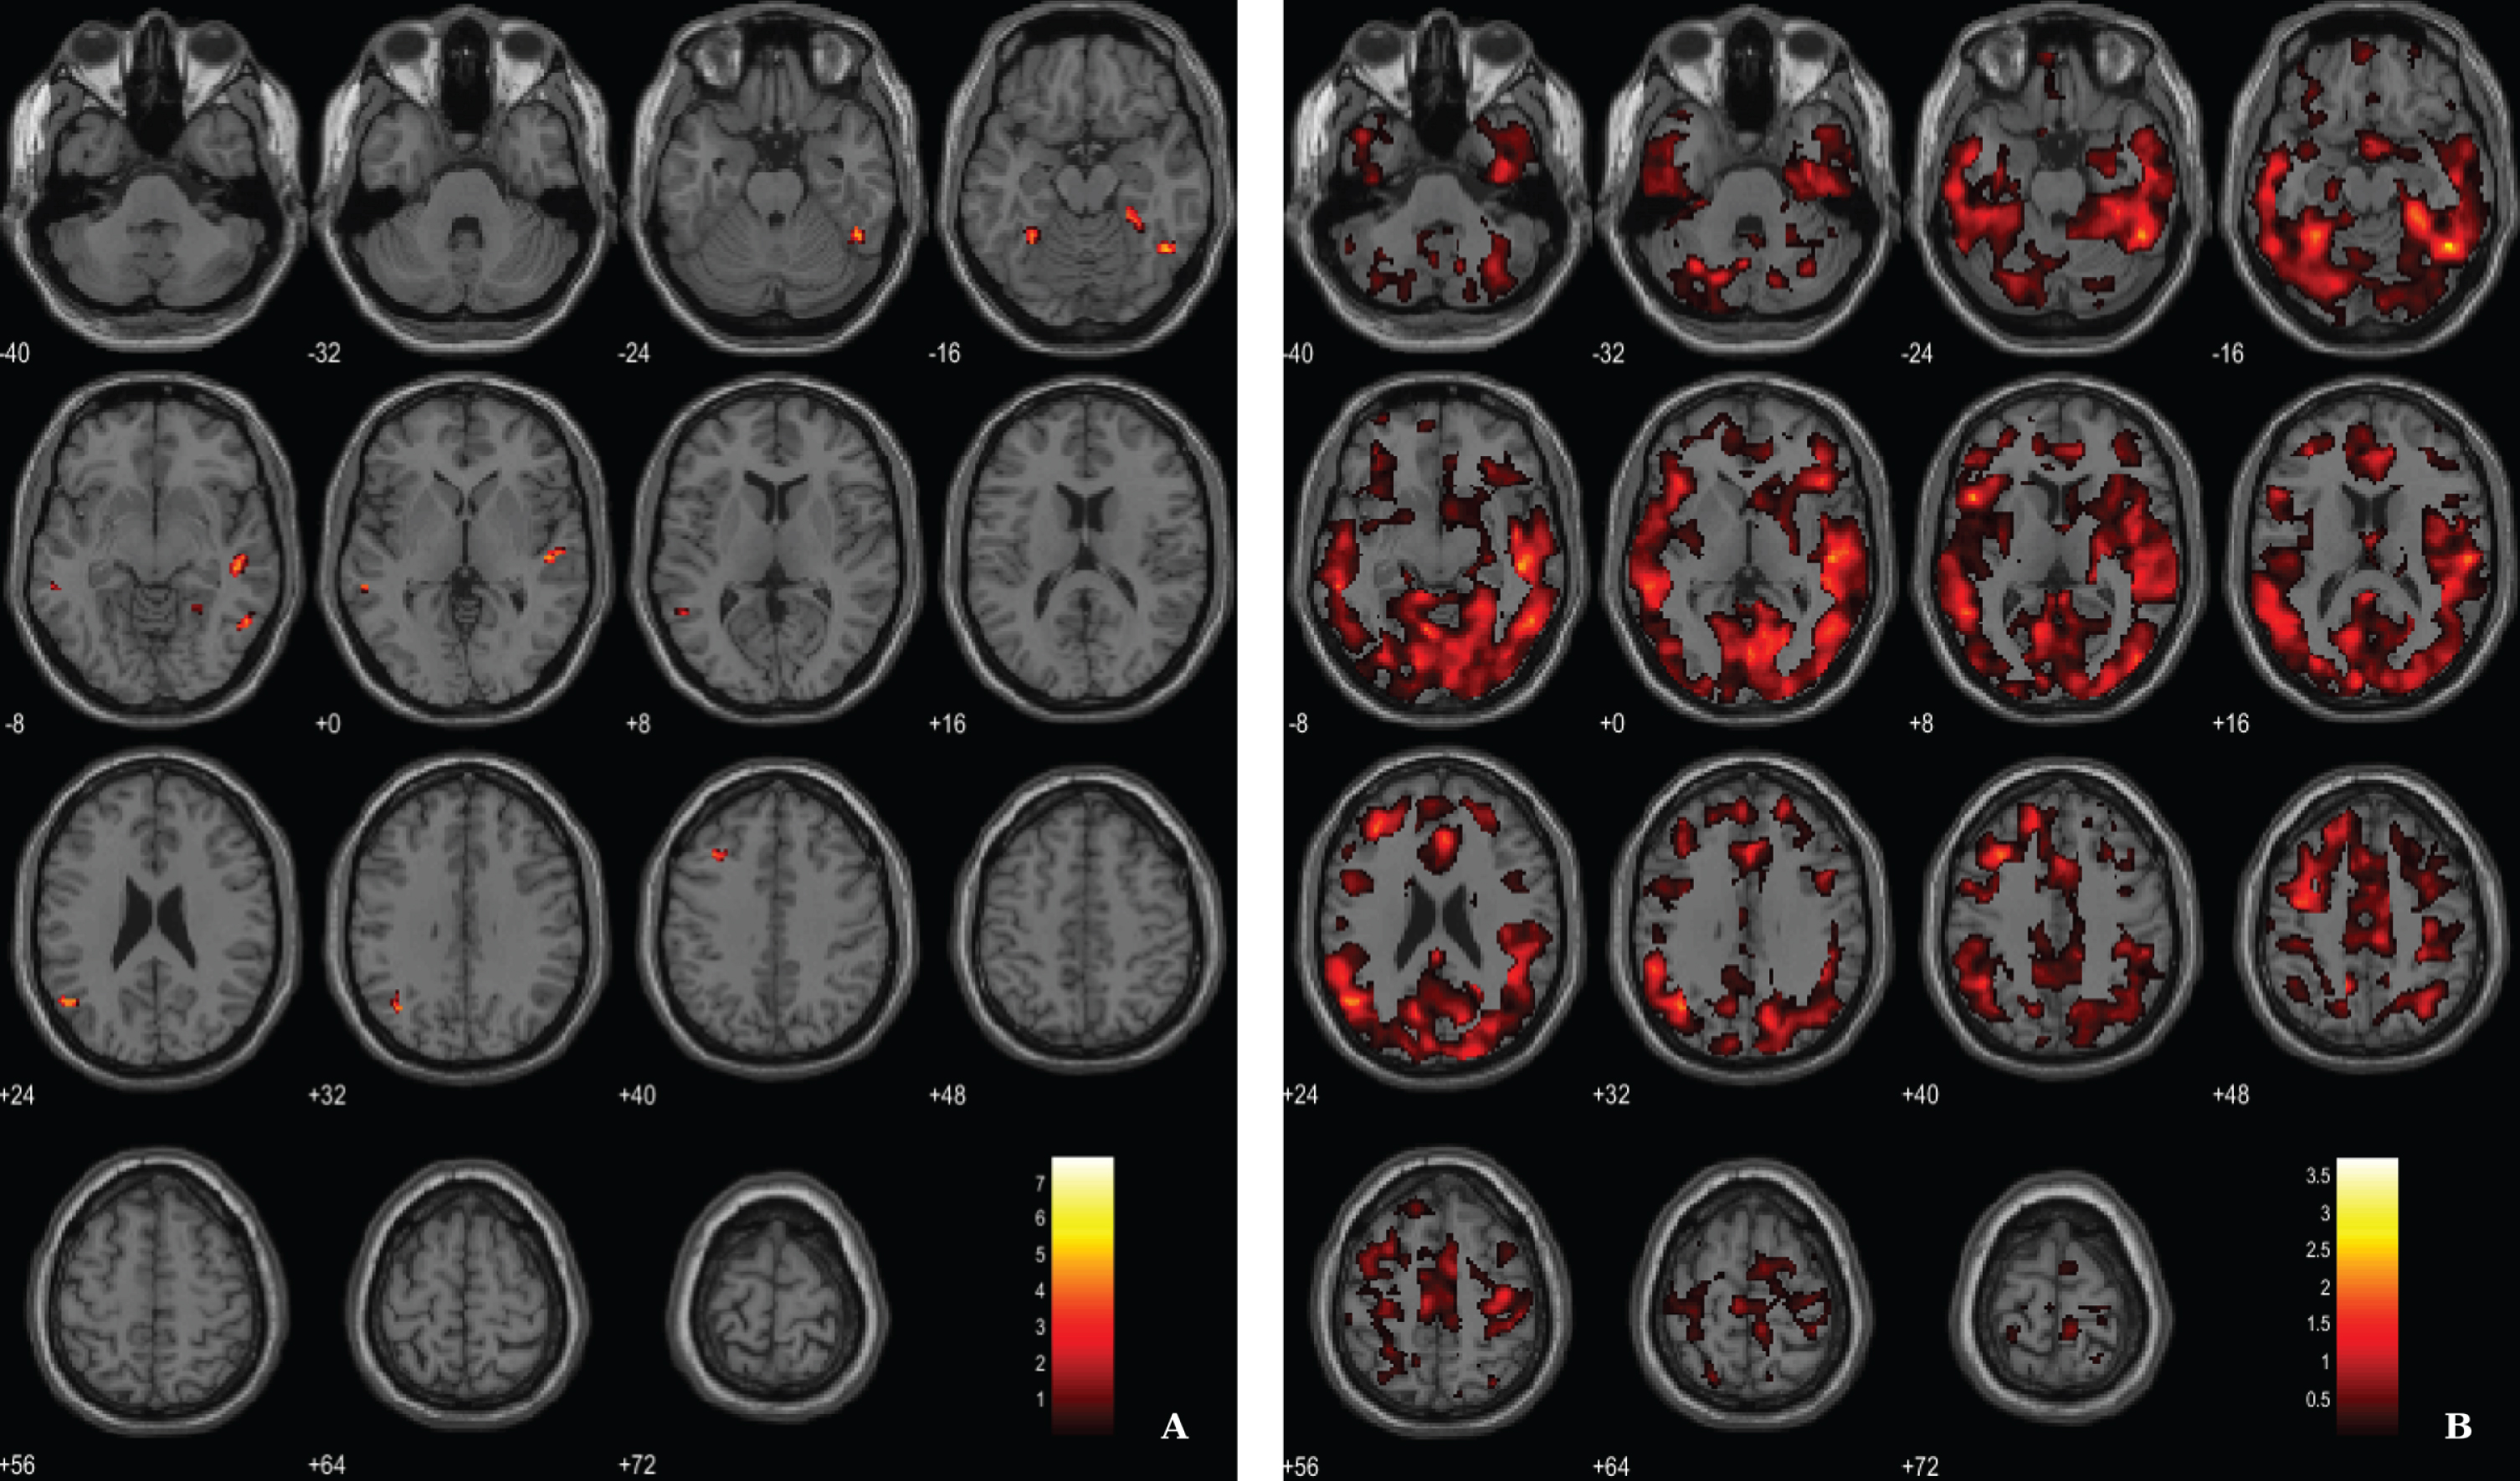
Aβ load differences in parametric 11C-PiB SUVR images were localized, using a statistical threshold at voxel-level of p < 0.01, family-wise error (FWE) corrected and the extent threshold at 100 voxels for this contrast. The between-group SPM analysis revealed that AD patients had a higher marked cortical 11C-PiB PET uptake compared to HC (Fig. 2). In fact, 11C-PiB PET positivity was used as criteria for AD diagnosis, thus increased uptake of the radiotracer in the patients was expected. Overall, there was a widespread whole brain amyloid deposition with the notorious sparing of the medial temporal areas and primary and secondary visual occipital areas. Significant Aβ retention is visible in cingulate cortex, frontal lobe, parietal lobe and temporal lobe.
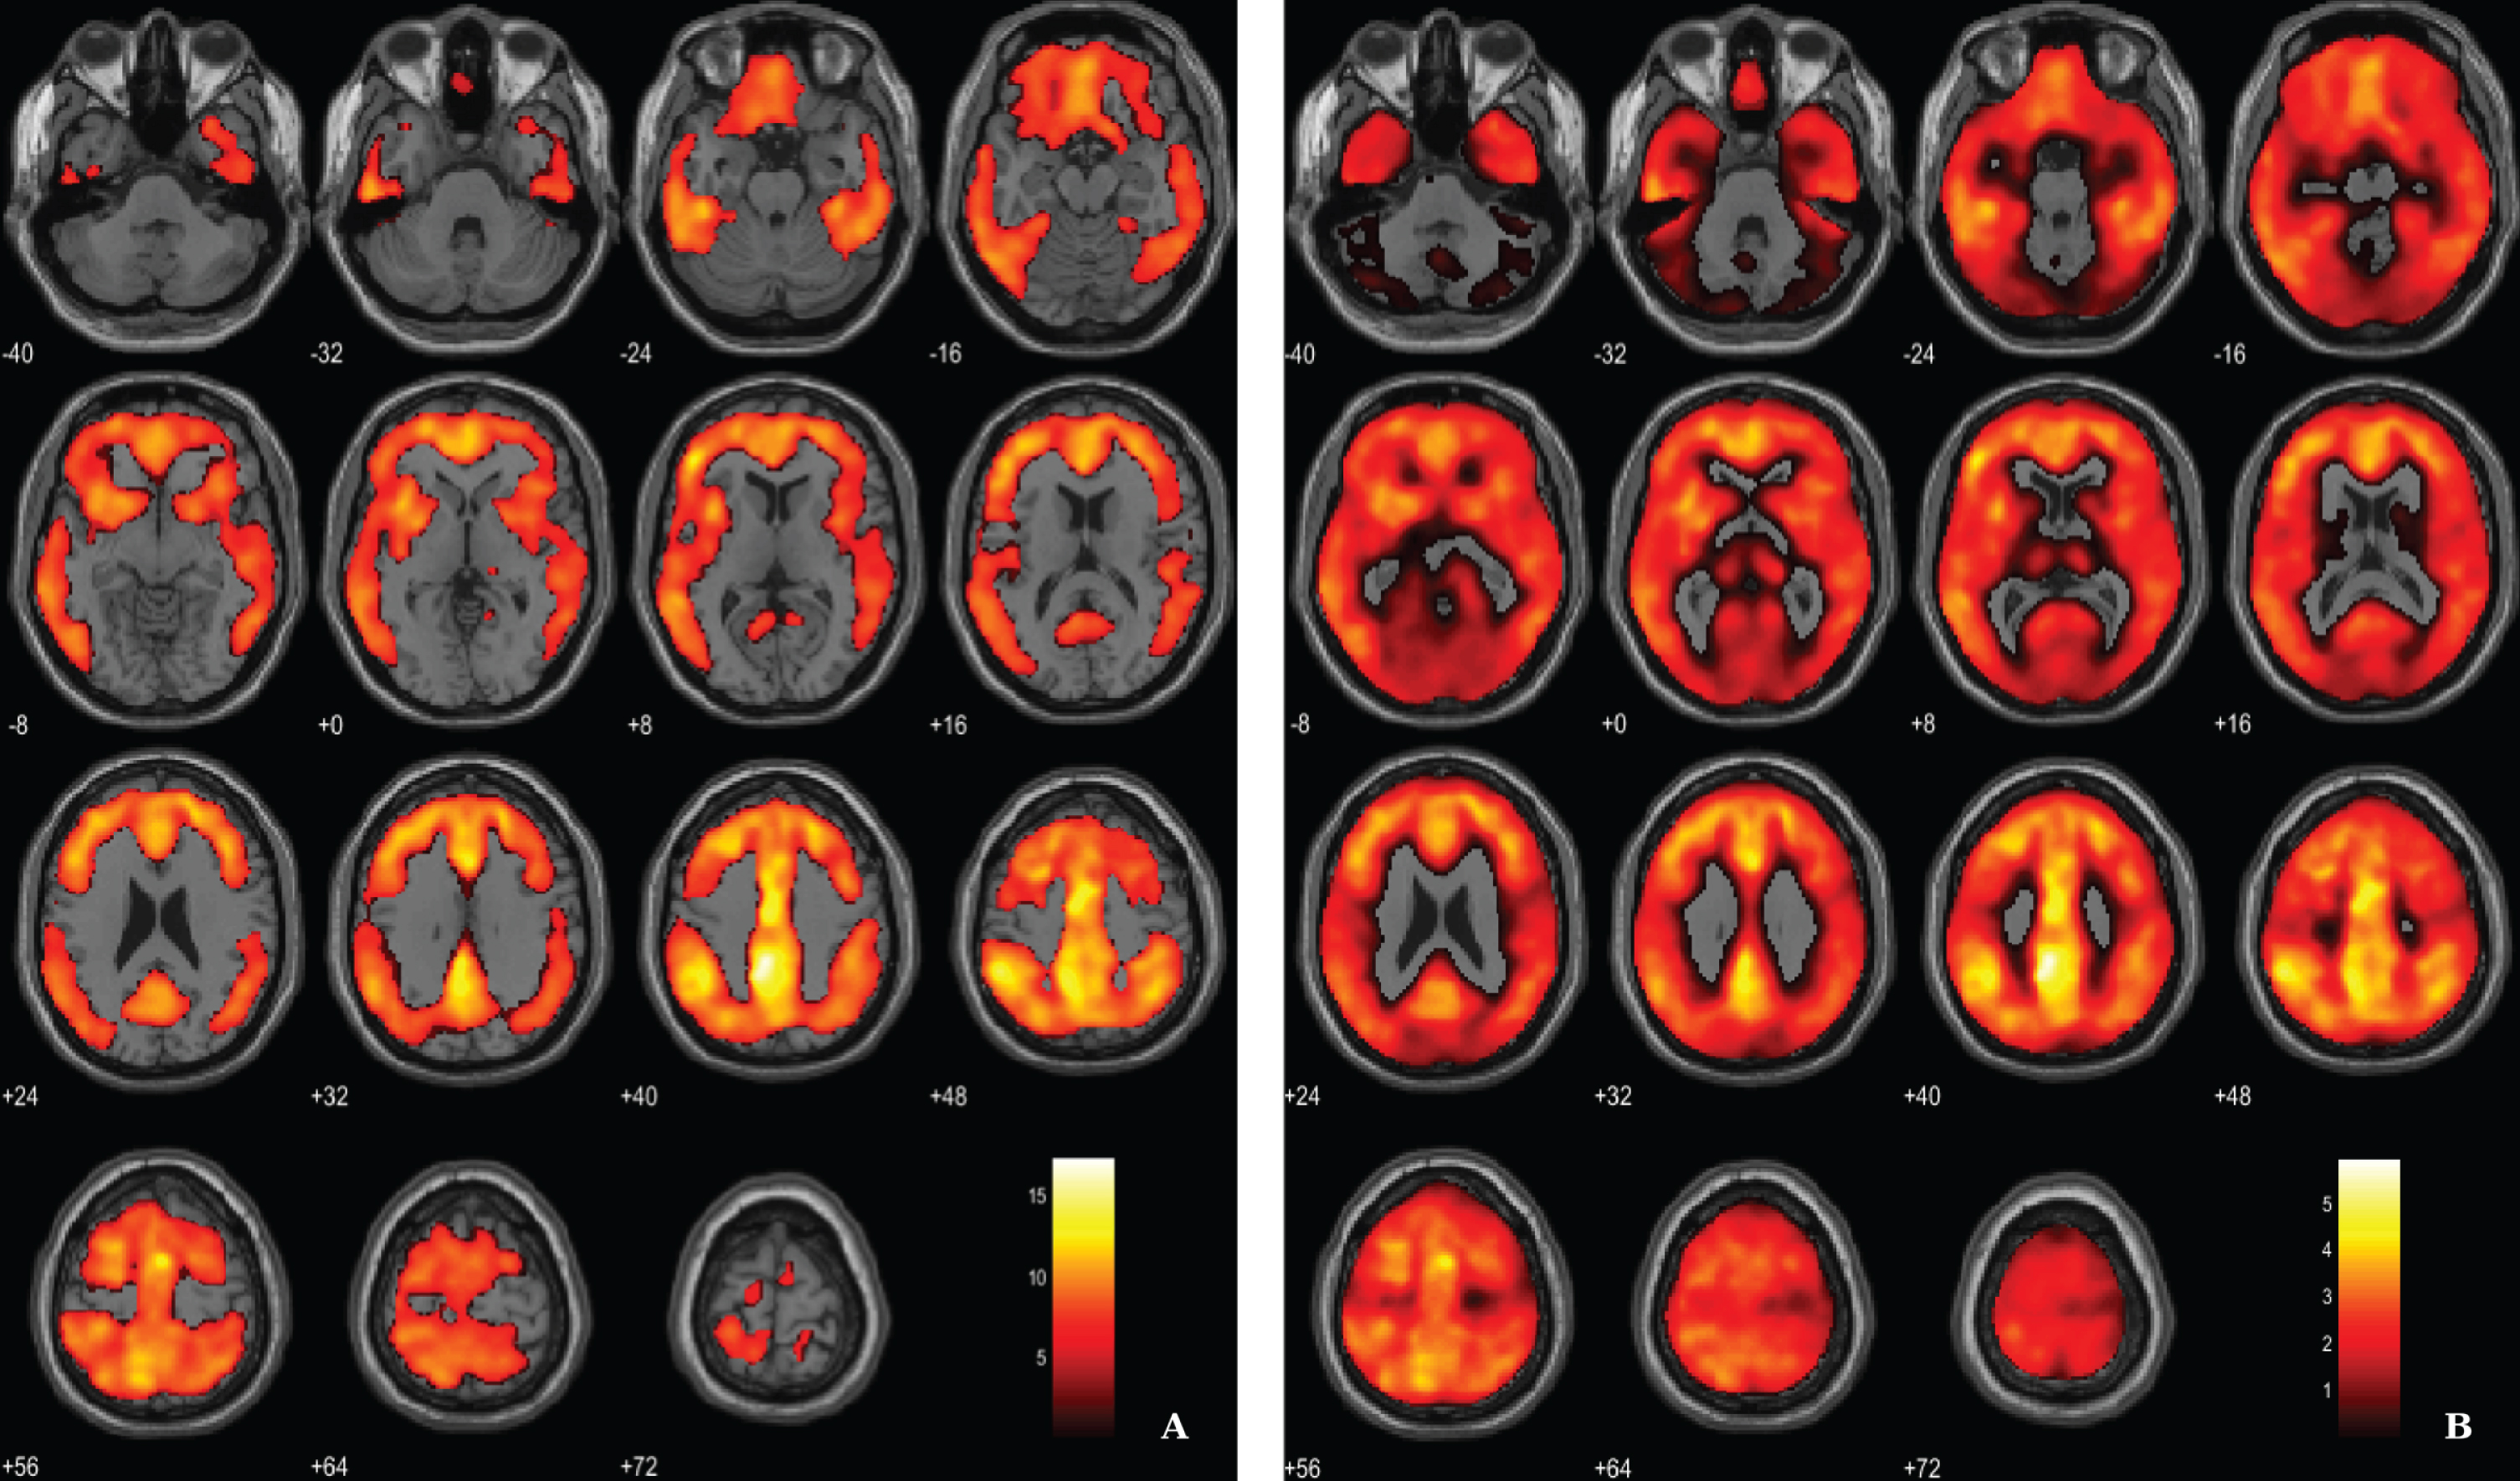
Voxel-based between-group comparison of 11C-PiB PET SUVR maps superimposed on the T1-weighted template in the axial plane for the AD > HC contrast. A) Thresholded T-map (p < 0.01, FWE-corrected at voxel-level, cluster size > 100 voxels). B) Unthresholded effect size (Cohen’s d) map.
11C-PK11195 PET
Microglial activation was assessed by the localization of clusters with increased 11C-PK11195 BP in AD patients, using a voxel-wise threshold of p < 0.01 (not corrected), with an extent threshold of 100 voxels, see rationale in Methods section. Differences between AD patients and HC pertaining neuroinflammation were less evident compared with the other two imaging modalities. Results evidence differences in key areas involved in AD pathology, namely the parahippocampal gyrus and cingulate gyrus. Table 3 and Fig. 3 depict significant clusters.
Regions of significant elevated 11C-PK11195 BP in patients with AD compared to HC
BA, Broadman areas; clusters were considered significant using a voxel-wise statistical threshold of p < 0.01 (uncorrected) with an extent threshold of 100 voxels.
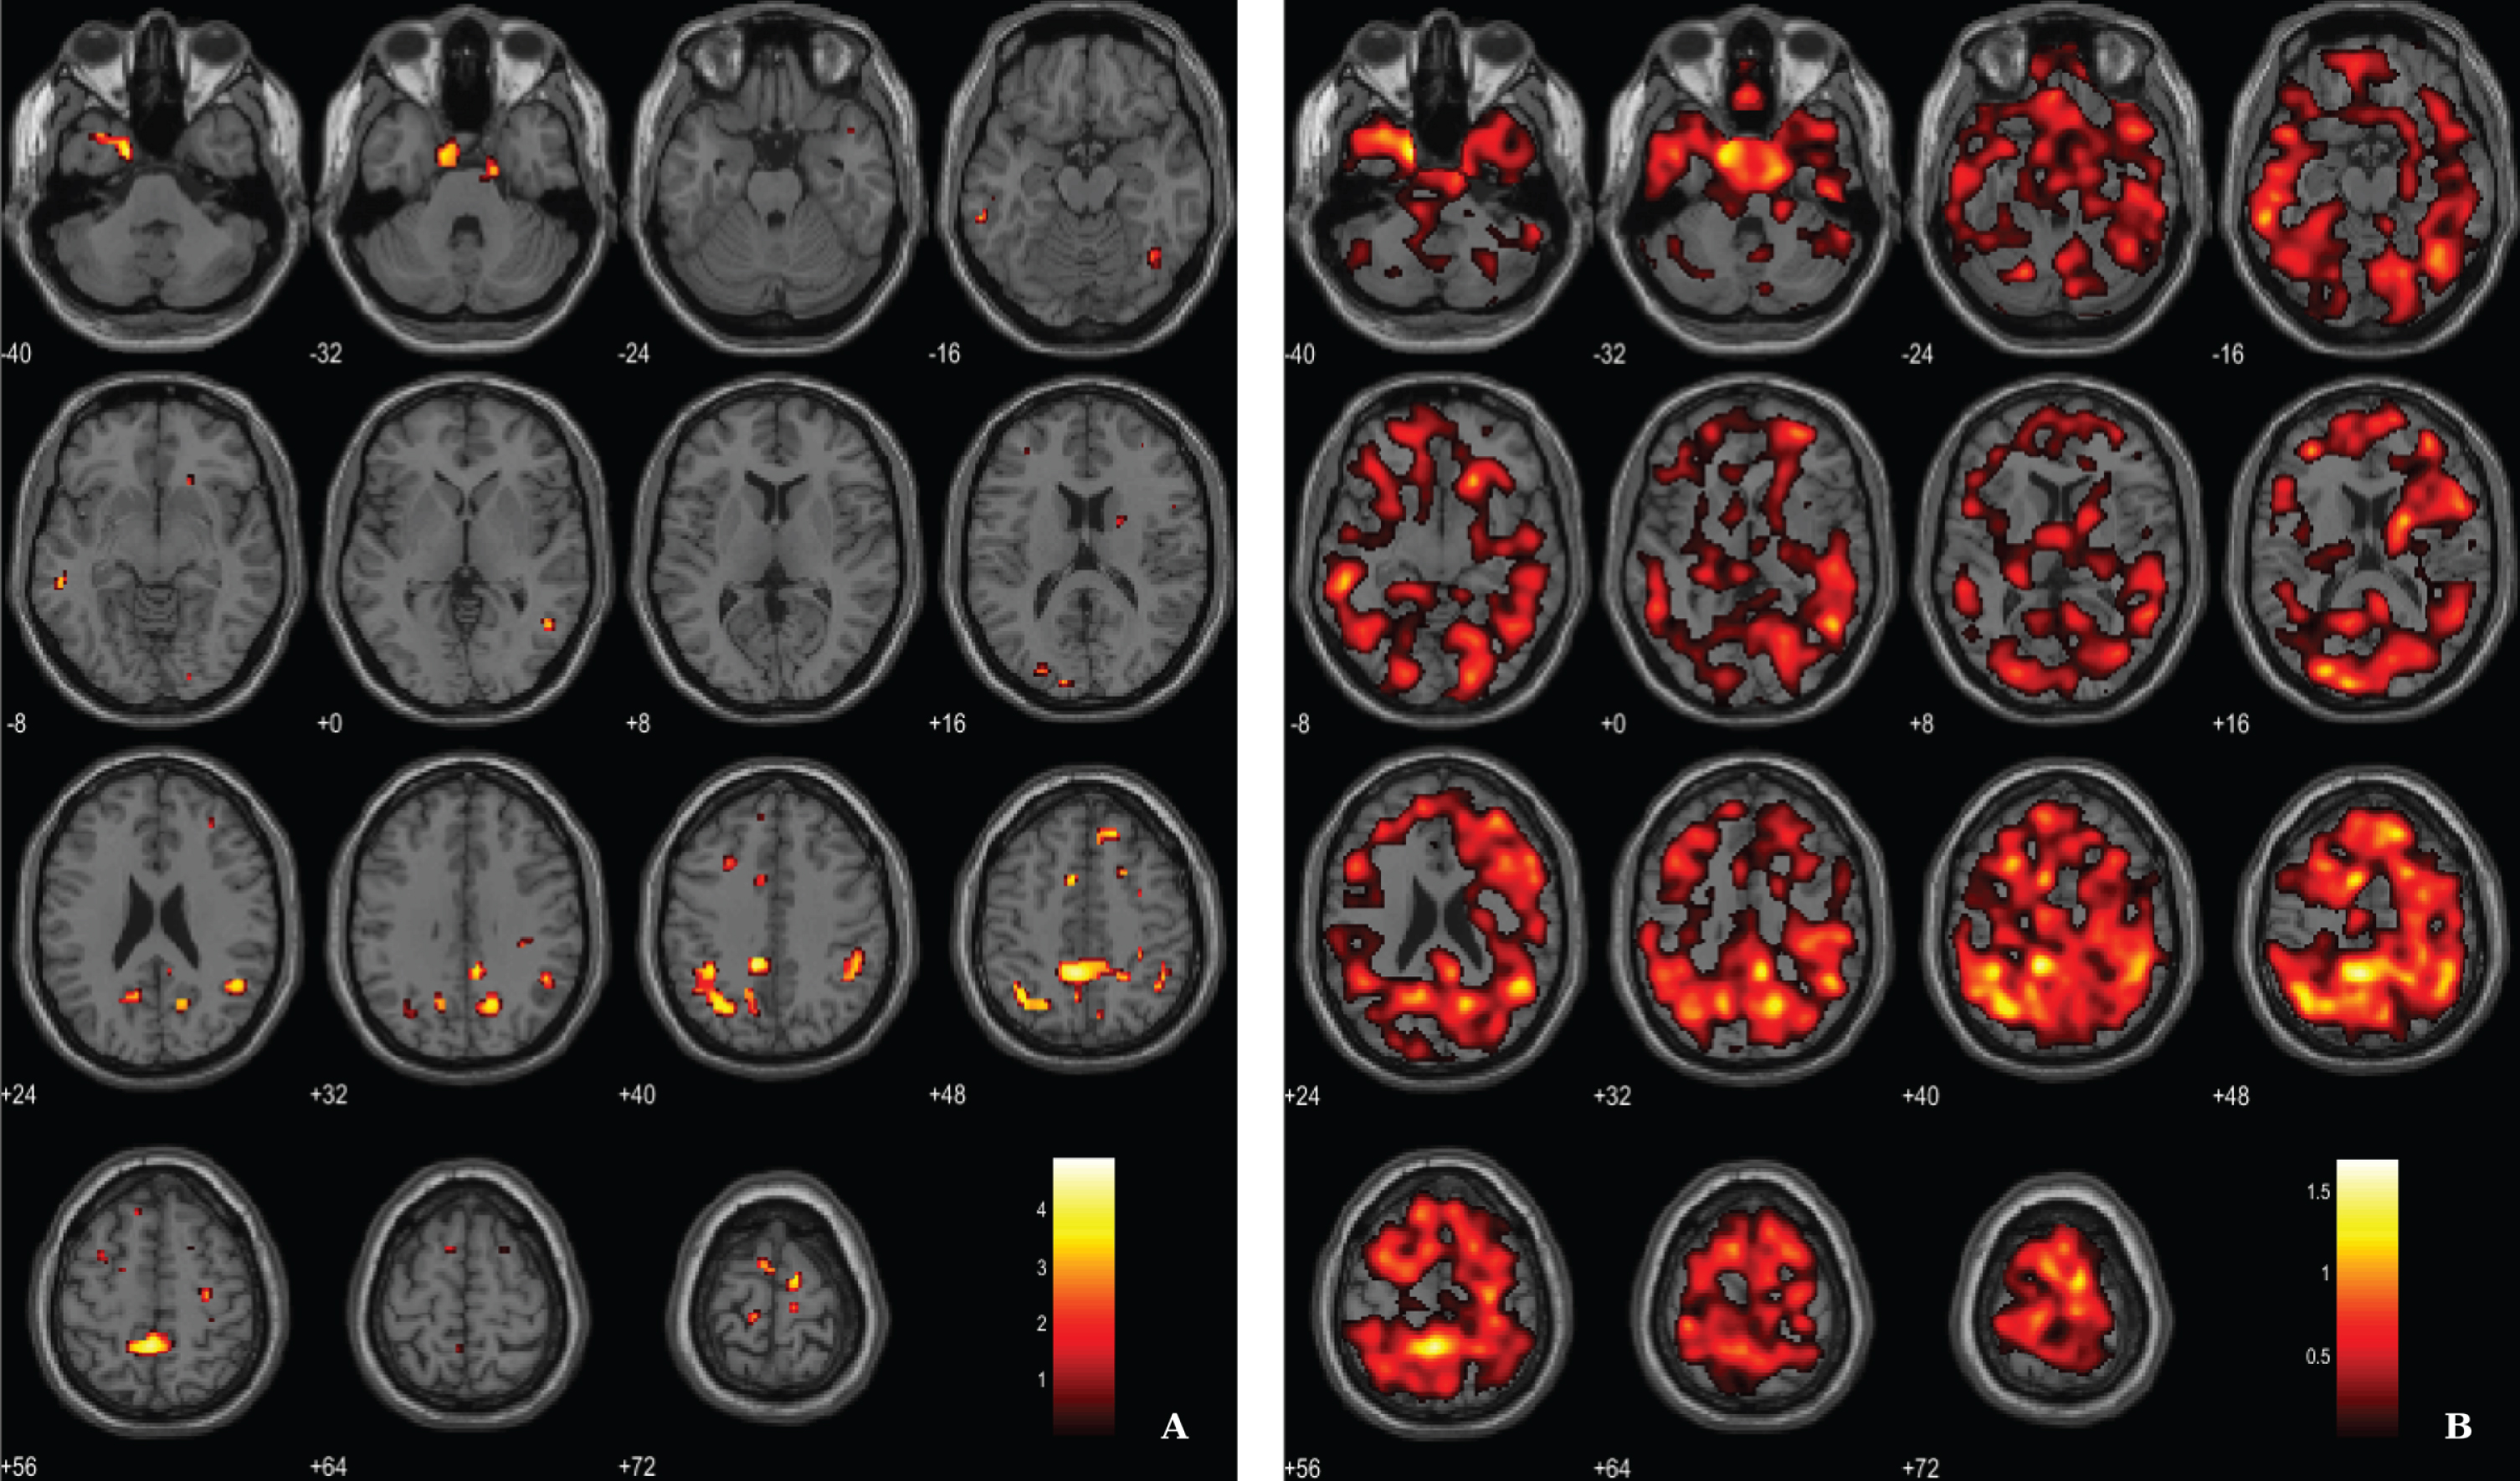
Voxel-based between-group comparison of 11C-PK11195 BP maps superimposed on the T1-weighted template in the axial plane for the AD > HC contrast. A) Thresholded T-map (p < 0.01, uncorrected at voxel-level, cluster size > 100 voxels). B) Unthresholded effect size (Cohen’s d) map.
BPM analysis
For the ANCOVA design, the 11C-PiB SUVR images were inserted as explanatory variables to evaluate the influence of Aβ levels differences in the structural integrity (VBM-GM data). A voxel-wise statistical threshold of p < 0.03 (FDR corrected) and a cluster extent of 60 voxels were considered. Results revealed that apparently 11C-PiB SUVR did not account for GM differences in some regions such as medial temporal lobe, thalamus, prefrontal cortex and superior parietal cortex, among other regions (Table 4 and Fig. 4).
Results from ANCOVA reflecting regions where VBM-GM differences were not explained by 11C-PiB SUVR levels in AD
BA, Broadman areas; clusters were considered significant using a voxel-wise statistical threshold of p < 0.03 (FDR corrected for multiple comparisons) with an extent threshold of 60 voxels.
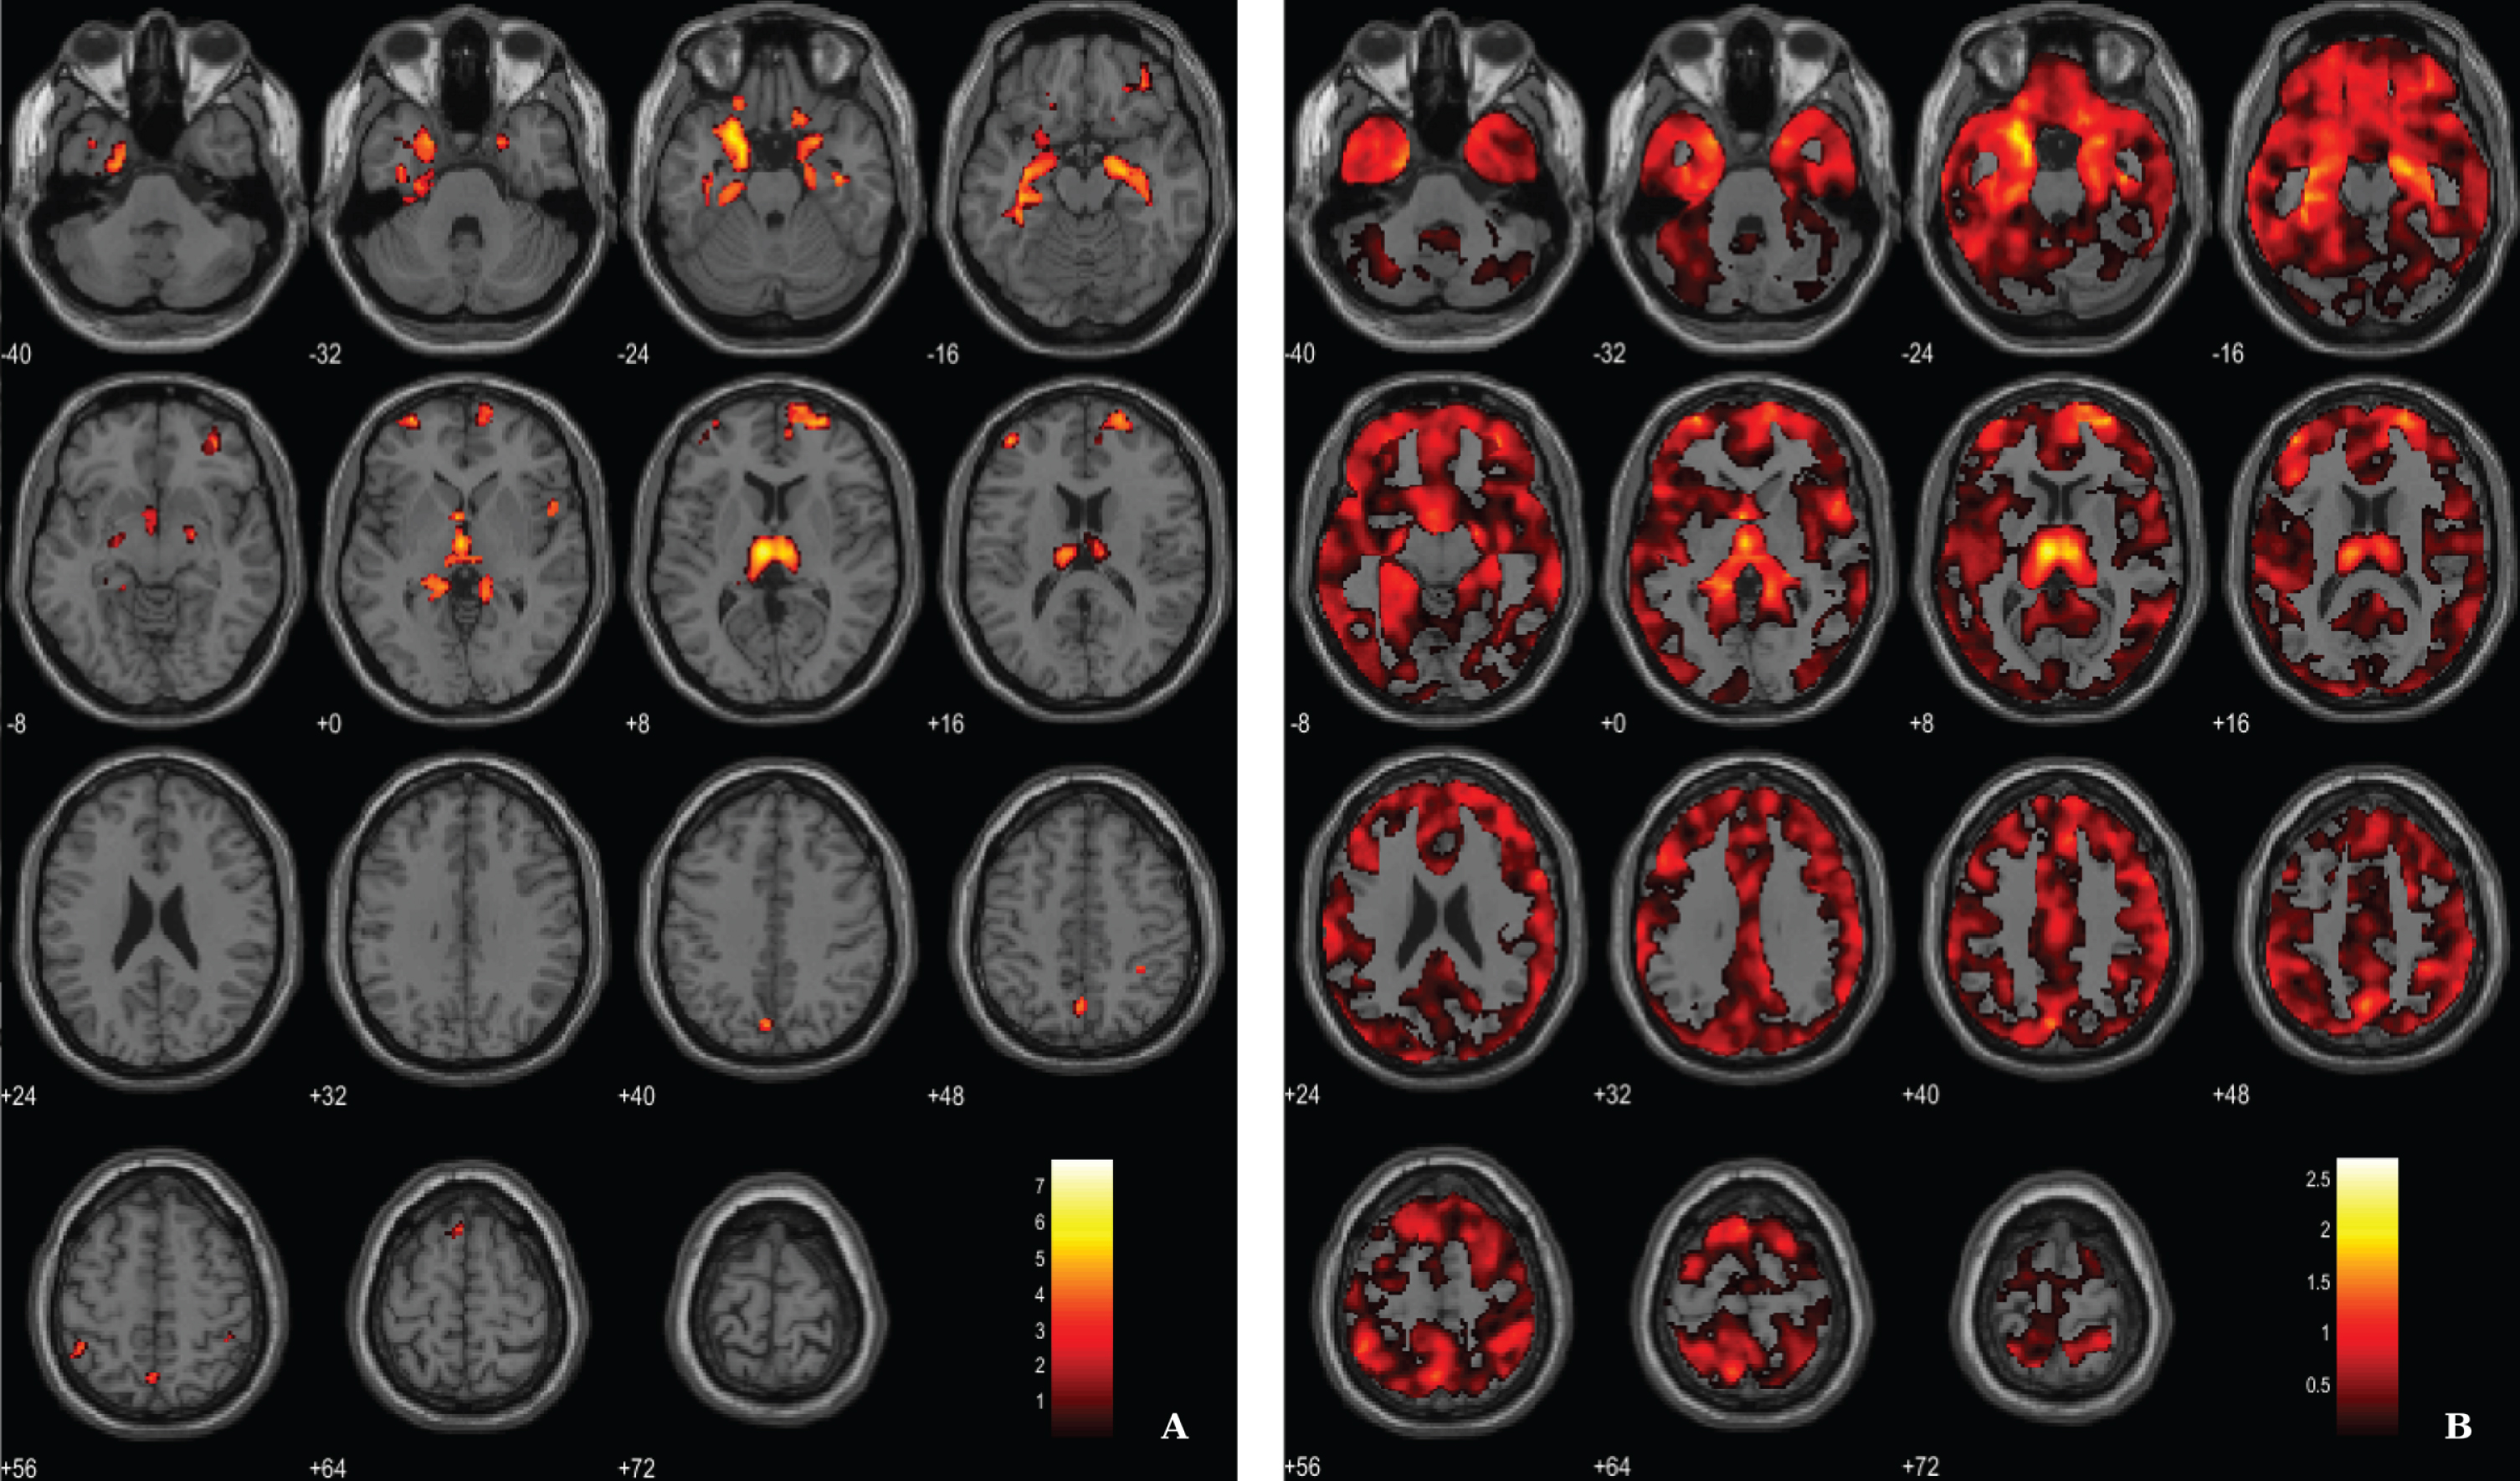
BPM ANCOVA analysis of GM maps superimposed on the T1-weighted template in the axial plane for the contrast AD < CT and controlling for 11C-PiB SUVR levels. A) Thresholded T-map (p < 0.03, FDR corrected at voxel-level, cluster size > 60 voxels). B) Unthresholded effect size (Cohen’s d) map.
Results from the regression analysis between VBM-GM data and 11C-PiB SUVR images in the AD group have revealed weak associations between the two image modalities in fusiform gyrus, lateral temporal lobe and parietal lobe (Fig. 5, Table 5). We used a voxel-wise threshold of p < 0.001 (uncorrected, except for the extent cluster correction threshold of 40 voxels).
BPM regression analysis between VBM-GM and 11C-PiB SUVR maps for the AD group superimposed on the T1-weighted template in the axial plane. A) Thresholded T-map (p < 0.001, cluster size > 40 voxels). B) Unthresholded effect size (Cohen’s d) map.
Regions of significant association between VBM-GM and 11C-PiB SUVR in AD patients
BA, Broadman areas; clusters were considered significant using a voxel-wise statistical threshold of p < 0.001 (uncorrected) with an extent threshold of 40 voxels.
In addition, following an approach replicating previous studies [51, 52] we have merged both groups in order to search for associations between VBM-GM and Aβ data. For the regression between the VBM-GM and 11C-PiB SUVR data, aggregating 20 AD and 17 HC, we used a voxel-wise threshold of p < 0.03 (FDR corrected) with an extent threshold of 60 voxels. The results evidence stronger associations when compared to the AD group solo, surviving to a more demanding statistical threshold (Fig. 6; Table 6).
BPM regression analysis between VBM-GM and 11C-PiB SUVR maps for 20 AD and 17 HC superimposed on the T1-weighted template in the axial plane. A) Thresholded T-map (p < 0.03, FDR corrected at voxel-level, cluster size > 60). B) Unthresholded effect size (Cohen’s d) map.
Regions of significant association between VBM-GM and 11C-PiB SUVR in AD patients and HC
BA, Broadman areas; clusters were considered significant using voxel-wise statistical threshold of p < 0.03 (FDR corrected for multiple comparisons) with an extent threshold of 60 voxels.
In addition, results from the regression analysis between VBM-GM data and 11C-PK11195 BP data in the AD group did not reveal significant associations between GM volume and neuroinflammation in the less sensitive voxel-wise analysis.
Likewise, the voxel-to-voxel correlation analysis between 11C-PiB SUVR images and 11C-PK11195 BP data did not show significant relationships between the two molecular imaging markers. This suggested to follow a more sensitive approach, based on ROI analysis.
ROI-based analysis
Since no significant associations were found when considering neuroinflammation data in a voxel-wise fashion, we opted to carry out region-based correlation analysis in the areas that showed significant microglia activation in AD. Results evidence a modest negative correlation between VBM-GM data and 11C-PK11195 BP data in lateral temporal lobe (BA21) of AD group (r = –0.526, p = 0.021) and a positive correlation between 11C-PiB SUVR and 11C-PK11195 BP in right superior frontal gyrus (BA8) (r = 0.523, p = 0.019).
The results from tests in anatomic ROIs unveiled some associations between pairs of neuropathological markers: a negative association between GM volume and 11C-PiB SUVR in left angular region (r = –0.514, p = 0.021) and left middle temporal region (r = –0.562, p = 0.010), a week negative correlation between VBM and 11C-PK11195 BP in left middle frontal (r = –0.457, p < 0.049) and in left inferior temporal cortex (r = –0.457, p < 0.049). In contrast, a stronger positive association between VBM and 11C-PK11195 BP was found in left hippocampus (r = 0.810, p < 0.001), right hippocampus (r = 0.614, p = 0.005) and left parahippocampal region (p = 0.557, p = 0.013). Finally, associations between 11C-PiB SUVR and 11C-PK11195 BP were found only in left hippocampus (r = 0.629, p = 0.004). These ROI-based results are exploratory and therefore were not corrected for multiple comparisons.
Overall, our results suggest that Aβ deposition is more tightly linked to brain atrophy than neuroinflammation.
DISCUSSION
It has been considered that Aβ accumulation triggers neurotoxic events in AD [53] leading to brain atrophy, where neuroinflammation may play an important role. Nevertheless, the relationships between these neuropathological events and their dynamics along disease trajectories remain far from certain. In the present study we found a significant interplay between Aβ and atrophy but a less prominent and more restricted interplay between neuroinflammation and atrophy in early AD.
Regarding the 11C-PiB PET retention, our results from the between group comparisons are in line with the pattern reported in the literature [20, 55]. Also, VBM results confirmed a pattern of atrophy already reported in previous studies performed with subjects in early stages of AD [56–59]. However, studies combining Aβ and GM have reported incongruent results concerning the relationships between both [21, 61].
At early stages of the disease (CDR = 1) we found some regions where structural neurodegeneration appeared independent of Aβ deposition in some areas, namely medial temporal areas (amygdala, hippocampus), frontal, prefrontal, superior parietal and occipital. In particular, medial temporal areas, including hippocampus and amygdala, have shown the lowest or absent Aβ deposition in imaging studies [23, 63], despite being highly susceptible to GM loss and the earliest regions to degenerate [58, 64–68]. In fact, it has been suggested that the presence of neurofibrillary tangles, rather than Aβ might account for atrophy in these regions [57–62]. Moreover, the deposition of soluble Aβ species, the most toxic form [69], that are not sensed by current PET imaging might explain degeneration in these regions [70–73]. In turn, a distant effect of Aβ on the hippocampus was also reported [74].
In opposition, frontal areas are the ones that show higher and earlier Aβ deposition [20, 63] but the last to experience atrophy [58, 64–68]. In fact, this resilience of frontal cortex to atrophy may arise from compensatory mechanisms (for a review, see [75]) namely compensatory changes in neurotransmitter systems [76, 77]. It is also possible that a higher synaptic/dendritic density present in frontal areas [78] delay the neurotoxicity of Aβ maintaining brain volume for longer. A significant independence of Aβ and atrophy in thalamus and occipital cortex have also stood out, two regions characterized by the lowest Aβ uptake levels in PET imaging studies [23, 79].
On the other hand, the regression analysis between 11C-PiB PET and VBM data in the 20 AD pa-tients revealed modest associations between both in fusiform gyrus, lateral temporal lobe, and angular gyrus, areas highly implicated in this early stage of the disease. Similarly, it was observed in early AD that Aβ was related to cortical thickness reductions in the posterior cingulate, extending into the precuneus, inferior parietal lobule, superior parietal, lateral temporal, and lateral prefrontal, whereas no significant associations were detected in medial temporal cortical regions [60]. In turn, another study by [61] found only a significant correlation between both neuropathological mechanisms in the inferior temporal region and hippocampal volume in a PiB-positive HC group. This relationship was not detected either in aMCI (amnestic mild cognitive impairment) or AD groups. The authors explained their results in light of the typical late-onset AD model which suggests a divergence between both mechanisms, so that Aβ deposition follows at a sustained slow rate towards a plateau [55, 80], while atrophy rate hastens as the disease evolves [81]. A recent study by [51] has explored Aβ and neurodegeneration in three different groups: subjects with subjective memory complaints (SCI), aMCI patients, and a group of AD. In this study associations were found between Aβ and atrophy when considering all the groups together, but individually only the SCI group preserved a strong relationship between both events in the regions of highest Aβ load (medial orbitofrontal as well as anterior and posterior cingulate areas). The authors argued that there is a marked interplay between both pathological events very early in prodromal AD, but as the disease progresses other downstream pathological events might be responsible for the ongoing neuronal deterioration. Furthermore, by pooling HC and AD patients it was found by [52] associations between increased Aβ uptake and GM density loss in the hippocampal and amygdala regions, suggesting that toxic effects of Aβ deposition may depend on the region. Nevertheless, the obtained correlations might had resulted from intergroup differences since both groups were merged, as the authors concluded.
It is noteworthy that several studies have found associations when combining different groups. For instance, a study by [60] reported associations in a mixed group composed by 68 PiB negative and 18 PiB positive normal controls, reporting a pattern of association similar to AD. Also, the study by [52] reported associations when joining both groups HC and AD patients. In turn, the study by [61] found an interplay between neocortical PiB and hippocampal volume when pooling 93 normal controls (32 PiB positive) 33 aMCI (20 PiB positive) and 35 mild AD patients PiB positive. Finally, the study by [51] reported associations between global measures of PiB and grey matter atrophy when the SCI, HC, aMCI, and AD groups were assembled, whereas the voxel–to-voxel analysis revealed only significant associations in SCI (with only 39% of the subjects positive for 11C-PiB PET). In line with these previous reports, we have also searched for associations between Aβ and neurodegeneration by merging 20 PiB positive early AD and 17 PiB negative HC. The results still show the same lateral temporal areas that we found modestly in AD group alone extending notably to medial prefrontal, occipital, and lateral parietal. Since our groups were age, sex, and education matched, and that all controls were PiB negative in contrast to all PiB positive AD patients, it is likely that the obtained correlations had resulted from AD related mechanisms rather than from other sources of intergroup differences, contrasting to previous studies where heterogenous groups were evaluated. It should also be stressed as a cautionary note that merging both groups might lead to inferences that are not necessarily related to AD pathological mechanism. Further studies with higher AD sample sizes will be needed to corroborate these disease related outcomes.
Thus, it is notorious the difficulty of neuroimaging studies to uphold a direct link between Aβ and neurodegeneration, with several studies pointing towards a dissociation between Aβ and atrophy as the disease progress [55, 82]. Accordingly, a study by [83] proposed a reformulation of Aβ hypothesis by suggesting a second stage process increasingly independent of the initial Aβ deposition. Hence, it is likely that after Aβ reaches a certain level of accumulation other neuropathological mechanisms are triggered that instead promote atrophy. Thus, as time goes by, and the levels of Aβ deposition increase, achieving eventually a plateau by the time that symptoms manifest [80], the direct mechanisms that account for atrophy became increasingly distant of Aβ burden, being less probable to find associations between the two biomarkers [83]. All this evidence led us to the rationale that areas that undergo neurodegeneration later in the course of the disease have a distinct probability to show associations between Aβ and atrophy. Regarding our results, since the frontal lobe shows some resilience to Aβ deposition, perhaps amyloid deposition is not so distant from atrophy mechanisms so that it is still evidencing in some restricted regions a correlation with GM loss. Regarding the lateral temporal lobe, mainly its posterior regions, there is evidence of a higher rate of atrophy when the disease is detected [68, 85], indicating that neurodegeneration mechanisms are still very salient and possibly not so distant from abnormal Aβ accumulation. In fact, this is one the areas that best splits MCI groups from AD groups as reported by some studies [86–88]. In turn, the occipital lobe is also one of the areas that later experiences neurodegeneration [67] and one of the last to undergo fibrillar amyloid aggregation [55], so Aβ might still influencing atrophy in these regions. Interestingly, our pattern of association is quite similar to that one comparing atrophy between AD and MCI, and the ones that show the rate of change in early AD (please see [68, 85]). As these aforementioned morphometric studies, we found a higher involvement of left hemisphere in the disease, particularly in the associations between Aβ and neurodegeneration.
Moreover, it is likely that amyloid plaques yield uneven effects through different brain areas or even sub-regions, probably reflecting distinct region specific pathological or protective mechanisms, as for example the presence of neurofibrillary tangles [89, 90], disconnection [91, 92], as well as compensation processes [75, 76]. Thus, while on one hand there is regional susceptibility to Aβ deposition [93], on the other one there is also regional susceptibility to the involvement of Aβ in the neurodegeneration processes [23, 74]. Thus, this might explain why the pattern of amyloid and atrophy is not coherent with the pattern of association between the two biomarkers. Atrophy may not be a mandatory subsequent process of Aβ deposition. In turn, other neuropathological mechanisms might prevail over Aβ deposition and rather promote atrophy of some regions.
Regarding the neuroinflammation data, different extents and levels of microglial activation have been reported using PET imaging in both AD and aMCI patients [24, 25]. Some have indeed found regions with substantial microglial activation in AD [22, 94–96], whereas others have not [63, 98]. While some have highlighted a pivotal role of neuroinflammation in prodromal AD (MCI) [7, 99–102], others have suggested that microglial activation increased with the progression of the disease [26, 27]. All this conflicting evidence might point to a fluctuation of reactive microglia cells along the disease [26] reflecting two peaks: an initial anti-inflammatory response at the very early stages of the disease (prodromal AD) and a second peak during the conversion from MCI to AD, possibly representing a pro-inflammatory change [103–106].
In the present study and opposite to the marked Aβ widespread deposition across the brain, an increased 11C-PK11195 BP was confined to more small brain regions such as: parahippocampal, cingulate, middle temporal, superior parietal, and superior frontal. Our findings were consistent with previous studies [7, 94] reporting larger differences in temporo-parietal cortex.
Although neuroinflammation is an accepted hallmark of AD, the precise mechanisms by which it might promote cortical atrophy and how it interacts with amyloid plaques have not been firmly established. A few neuroimaging studies have searched for associations between Aβ and neuroinflammation, whereas studies searching for the associations with GM density are scarce. Even though we were not able to demonstrate at voxel-level a significant interplay between neuroinflammation and the other two neuropathological biomarkers, this could be demonstrated using a more sensitive ROI-based analysis. Regionally we found the most notorious association between GM volume and neuroinflammation in hippocampus and parahippocampal area. In fact, the apparently counterintuitive positive correlations found in these medial temporal areas might suggest a protective role of reactive microglial cells in response to pathological events either it be tau tangles, Aβ, or other downstream pathological mechanism. In contrast, the tendency to a negative association between GM volume and neuroinflammation in frontal middle and temporal inferior areas might point to a detrimental role of microglia activation on the structural integrity of these regions.
Thus, it is possible that at the same time point neuroinflammation is associated with cell loss in some regions while older regions from the phylogenetic point of view, such as the hippocampus, may show different effects due an hypercellularity shift. Although this dichotomy is reasonable, given the temporal disparity with which the same neuropathological mechanisms affect different areas of the brain, further studies with higher sample sizes are needed to confirm this theory.
The work by [94] examined the structural changes between the first and second MRI scan (after 24 months) of AD patients, and they found that areas with high 11C-(R)-PK11195 BP showed the highest rate of atrophy, suggesting that the presence of a local immune response was related with subsequent tissue loss (inferior and middle temporal area/fusiform gyrus/parahippocampal gyrus/posterior cingulate). Also, other two studies have found a linkage between reactive microglia and grey matter atrophy, approximately in the same areas [7, 27]. With regard to the interplay between Aβ and neuroinflammation, in spite of the fact that postmortem literature has shown a spatial relationship between Aβ accumulation and microglial activation [107], our ROI-based results only suggest associations between both in left hippocampus and right superior frontal gyrus. Concerning the neuroimaging literature, a previous study by [28] reported only a negative correlation between 11C-PK11195 BP and 11C-PiB SUVR in the posterior cingulate cortex, denoting that Aβ might not be always the leading cause of microglial activation. Also, a study by [26] argued that some reactive microglia cells might be triggered by other events, since some areas lacked to evidence coupling with amyloid plaques. In the study by [27], it was found that AD patients had significant correlations between both in inferior parietal lobule, superior temporal cortex, precuneus, hippocampus, and parahippocampal gyrus. Moreover, a study by [108] reported positive correlations throughout the cortex in both MCI and AD groups. However, MCI subjects revealed a wider cortical distribution and strong correlations compared to AD. They suggested an early peak of microglial activation in response to the beginning of Aβ deposition in MCI, and a second peak in response to neurofibrillary tangles formation and spread when the disease is diagnosed.
As such, it is likely that our data represent the second peak of microglial activation in the course of the disease. Since associations between Aβ and activated microglia were confined to left hippocampus and right superior frontal lobe, one could speculate that in general neuroinflammation might not be a consequence of fibrillar Aβ deposition at this stage of the disease in which Aβ deposition already reached a plateau. In fact, evidence across studies have demonstrated strong associations of microglial activation with Aβ in early MCI [7, 109], while in established AD the associations were stronger with tau tangle burden [108, 110]. Thus, microglial activation we found might have been triggered by neurofibrillary tangles rather than amyloid, since tau tangles continue increasing in this phase [62]. This potential lack of coupling is biologically plausible since in the aging brain both neuroinflammation and neurodegeneration were found in the absence of Aβ [111]. Moreover, this pathologic event is also present in other neurodegenerative diseases [112, 113], which are not characterized by brain amyloidosis. Several studies failed to show evidence of an association between Aβ load and neuroinflammation [22, 114]. Our study provides a somewhat reconciling view on this debate.
As such, the complexity and uncertainty about the neuropathological mechanisms underlying AD and their constant change throughout the disease’s progression makes of utmost importance to study clearly defined groups as we have done here. Our AD group was clinically well characterized and in the same stage of the disease (CDR = 1, with less than 1 year of diagnosis) and all of them were positive for PiB retention. In addition, our controls were matched for age (preventing effects of aging), education (preventing effects of cognitive reserve), and sex (preventing brain and sex differences) and were PiB negative. Thus, it is highly probable that differences arise due to AD-related differences and not due to other group differences.
Nevertheless, our study presents some limitations that should be considered, as the small size of the groups, the lack of follow-up clinically or with imaging data as well as the fact of our AD sample have a probable diagnostic since no postmortem confirmation of AD pathology was possible.
Thus, our results suggest an important, although uneven, role of Aβ in cortical atrophy related to AD, which might depend on regional susceptibility. However, regions that later experience atrophy are more prone to show associations with Aβ since the neurodegenerative mechanisms still noticeable, providing an excellent opportunity to gain insight into the mechanisms underlying the effects of Aβ on atrophy. Thus, despite the fact that Aβ has a prominent role in the neurogenerative processes involved in AD, our findings provide a reconciling view on the still controversial role of neuroinflammation which might be stage dependent.
Footnotes
ACKNOWLEDGMENTS
This work was supported by Neuroscience Mantero Belard Prize 2015 (Santa Casa da Misericórdia): Ref: MB-1049-2015. Foundation for Science and Technology, Portugal (UID/NEU/04950/2020, CEECINST/00041/2018, COMPETE-FEDER (POCI-01-0145-FEDER-007440), MEDPERSYST, POCI-01-0145-FEDER-016428, DSAIPA/DS/0041/2020 Centro 2020 (CENTRO-01-0145-FEDER-000008: BrainHealth 2020), BIGDATIMAGE, CENTRO-01-0145-FEDER-000016, Centro 2020 FEDER, COMPETE.