
Abstract
Background:
Gait analysis with accelerometers is a relatively inexpensive and easy to use method to potentially support clinical diagnoses of Alzheimer’s disease and other dementias. It is not clear, however, which gait features are most informative and how these measures relate to Alzheimer’s disease pathology.
Objective:
In this study, we tested if calculated features of gait 1) differ between cognitively normal subjects (CN), mild cognitive impairment (MCI) patients, and dementia patients, 2) are correlated with cerebrospinal fluid (CSF) biomarkers related to Alzheimer’s disease, and 3) predict cognitive decline.
Methods:
Gait was measured using tri-axial accelerometers attached to the fifth lumbar vertebra (L5) in 58 CN, 58 MCI, and 26 dementia participants, while performing a walk and dual task. Ten gait features were calculated from the vertical L5 accelerations, following principal component analysis clustered in four domains, namely pace, rhythm, time variability, and length variability. Cognitive decline over time was measured using MMSE, and CSF biomarkers were available in a sub-group.
Results:
Linear mixed models showed that dementia patients had lower pace scores than MCI patients and CN subjects (p < 0.05). In addition, we found associations between the rhythm domain and CSF-tau, especially in the dual task. Gait was not associated with CSF Aβ42 levels and cognitive decline over time as measured with the MMSE.
Conclusion:
These findings suggest that gait — particularly measures related to pace and rhythm — are altered in dementia and have a direct link with measures of neurodegeneration.
INTRODUCTION
Dementia affects almost 50 million people worldwide [1], and this number is doubling every 20 years [2]. Alzheimer’s disease (AD) is the most frequent cause of dementia, contributing to 60–70% of all dementia cases [1]. An early and accurate diagnosis is essential to provide appropriate care, information, and inclusion to clinical trials. However, diagnosing correctly can be difficult due to overlapping symptoms, comorbid pathologies, and relatively general diagnostic guidelines [3]. Biomarkers are of increasing importance and improve diagnosis accuracy, but are not always available [4]. Thus, simple methods are needed to support clinical diagnosis. Evaluation of gait is a simple tool that may help clinicians to identify patients with neurodegenerative disorders and in this way contribute to an accurate diagnosis.
Gait is a highly complex movement, which requires integration of motor control and cognitive functioning across large neural networks. It is therefore likely that even in very early stages of AD, measurable consequences in gait are present [5]. The presence of gait impairment has been shown in the preclinical stages of AD [6–9], and both mild cognitive impairment (MCI) and dementia stages of AD [10–13], but analysis techniques to capture gait features are not optimal in these studies. Gait analysis was done using either simple stopwatches, which can capture walk speed only, or complex specialized gait analysis equipment, such as instrumented walkways. These instrumented walkways are expensive, spacious, and need specialized personnel, and are thus less suited for widespread implementation. Due to recent technological developments, wearable devices like accelerometers, which are inexpensive, are now widely available, and validated as a reliable gait analysis tool [14]. Gait tests performed with accelerometers are easy to perform, take little time, are possible in naturalistic environments, and are thus easy to implement.
Yet, only a few studies tested gait extensively in a dementia patient group with wearable devices like accelerometers [11, 16]. These results show that gait is associated with cognition [11, 16] and CSF biomarkers [13]. All studies emphasize that a dual task, in which participants have to perform a cognitive task while walking, is essential to show these associations. However, sample sizes are small in each study (n < 36), especially when combining gait and AD biomarkers (n < 17) [13]. Hence, using accelerometers for in-depth gait analysis seems promising, but still too little is known regarding the relation with diagnostics and AD biomarkers. Therefore, this study aims to evaluate the associations between dynamics of gait and syndrome diagnosis of dementia, CSF biomarkers of AD pathology, and cognitive decline over time in a multicenter memory clinic cohort.
METHODS
Subjects
We included 142 participants from the EU-funded project Predict ND (Grant Agreement 611005) [17] from three European memory clinics (Amsterdam UMC, location VUmc in Amsterdam, The Netherlands [18], Rigs hospitalet in Copenhagen, Denmark, and the University of Eastern-Finland in Kuopio, Finland). The PredictND study was set up with the aim to develop computer tools to support the clinician in the differential diagnosis of dementia [3]. Inclusion criteria for this study were: MMSE at or above 25 and Clinical Dementia Rating (CDR) at or under 1.0. The exclusion criteria were: diagnosis of previous or current major psychiatric disorder within the last two years, excessive alcohol intake or substance abuse within the last 2 years, and other known brain disorders that may explain the cognitive problems. All subjects were clinically diagnosed during the baseline visit. This could either be cognitively normal (CN), mild cognitive impairment (MCI) [19], or mild dementia [20]. Dementia included dementia due to several etiologies: AD [20, 21], Lewy body dementia [22], frontotemporal dementia [23], vascular dementia [24], or other. Our study sample included 58 CN, 58 MCI, and 26 dementia participants.
As part of the study protocol [17], subjects underwent elaborate testing including medical examination, neuropsychological assessment, and an MRI scan. A lumbar puncture to collect CSF was performed in a subgroup of 76 participants. One-year follow-up was available for n = 130 and two-year follow-up for n = 38. MMSE follow-up scores were used as measure for cognitive decline. All subjects of the PredictND study signed informed consent prior to participation. Ethical approval was obtained in all three clinics.
Walk tests
All subjects were requested to perform the walking tests in two conditions (walk and dual task). Subjects completed the walking tests in a fixed order described below. Prior to the walking tests, the subject sat on a chair and received the following task instructions:
Walk task
In sequence: 1) stand up from a chair, 2) walk for five meters towards a cone, 3) turn around the cone and walk back to the chair, 4) turn around the chair and walk back to the cone, 5) turn around the cone and walk back to the chair, and 6) sit back down on the chair. Subjects were instructed to complete this task as quickly as they could do comfortably. Figure 1 provides a graphic representation of the task instructions.
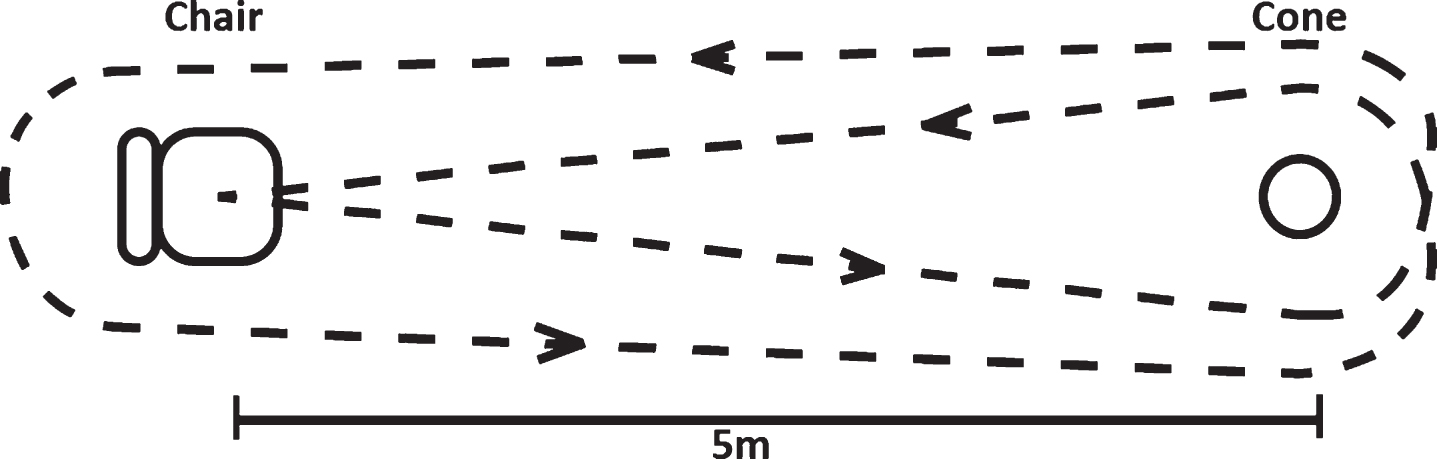
The walking trajectory during both the walk and dual task. Participants were asked to stand up from the chair, walk around the cone, walk around the chair, again around the cone and back to the chair. The distance between the chair and the cone was 5 meters.
Dual task
For this condition, instructions were similar to the walking test described above. However, in addition subjects were instructed to count back from 100 to 0 while completing the task.
During the walking tests, four tri-axial Acti Graph wGT3X-BT accelerometers (ActiGraph LCC, Pensacola, FL) attached to the right ankle, left ankle, right trouser pocket, and the fifth lumbar vertebrae (L5) of the subject collected acceleration data. The accelerometers measured accelerations in their local coordinate system in the x, y, and z direction at a rate of 50 Hz. Measurements started manually prior to the start of each trial, and stopped manually once the subject had completed a task. After completion of the walking test, raw data was uploaded using ActiLife 6 application (version v6.11.4).
Data processing and features
To determine gait features, the vertical acceleration data from the accelerometer attached to L5 was used [25], while the accelerations measured by the remaining accelerometers were used for confirmation of the algorithm. Data analysis was performed using custom software programmed in MATLAB 2011a (Math Works, Natick, MA). Using this custom written software, we performed the following data processing steps for each participant in each condition (walk task and dual task):
Algorithm 1: Determining the start and end of a walking test
The start of a walking test was defined as the first instance where the standard deviation of three successive data points was larger than 0.1 m/s2. This corresponds to the first instance in which a significant vertical acceleration occurred, i.e. the start of a series of gait cycles. Similarly, the end of a walking test was defined as the last instance where the standard deviation of three successive data points was larger than 0.1 m/s2.
Algorithm 2: Determining the initial and final contact of each gait cycle
Walking consists of a series of gait cycles. To facilitate calculation of features, for each gait cycle the point of initial contact (IC) and final contact (FC) was determined using the algorithm described by McCamley et al. [25] and validated by Del Din et al. [14] and Bugane et al. [26]. In short: the integrated vertical acceleration of L5 was differentiated using a Gaussian continuous wavelet transform (CWT). The ICs were defined as the local minima of the CWT and the FCs were defined as the local maxima of the differentiated CWT. To optimize the algorithm, it was defined that IC and FC intervals should be at least 0.24s to be detected [14]. Furthermore, ICs and FCs had to alternate. Therefore, when multiple IC or FC events happened after each other, only the last instance was considered as the event.
Algorithm 3: Determining features of gait
Using the start and end points of each walking test (Algorithm 1), in combination with the initial and final contact of the gait cycles (Algorithm 2), the following ten features were determined (Table 1): mean stance time, stride time, swing time, step length and velocity, step frequency, and stance time, stride time, swing time, step length variability (see Table 1 for a description and equations). Stance, stride, and swing time were calculated on the basis of the IC and FC events [14]. To calculate the step length, an inverted pendulum model was used [27]. The vertical displacement (h) was calculated as the amplitude of the filtered (high pass 4th order Butterworth filter, cutoff frequency 1 Hz) double integrated vertical acceleration of L5. The leg length (l) was calculated as a ratio of the participant’s height (l = height * 0.53), which was found to be a reliable method [14].
Description of ten gait features in both walk and dual task
Ten gait features with their units, description, formula, and domain, as measured during both the walk and dual task. s, second; min, minute; FC, final contact; IC, initial contact; i, ith gait cycle; sd, standard deviation; m, meter; N, total number of steps during one walk task; h, vertical hip displacement; l, leg length, calculated as a ratio of the participant’s height.
Gait domains
To reduce the number of outcomes and combine highly correlated gait features, a principal components analysis (PCA) was conducted to create gait domains [28]. The PCA was conducted twice (once for the walk task, and once for the dual task) on either the 10 walk gait features, or the 10 dual gait features, with orthogonal rotation (varimax). For the walk task, Bartlett’s test of sphericity, χ2(45) = 6066, p < 0.001, indicated that correlations between items were sufficiently large for PCA. Based on an eigenvalue cutoff at 0.7 [29] and convergence of the scree plot, four components were retained in the final analysis, explaining 90% of the variance. The items that cluster on the same components (gait domains) suggested that component 1 represented rhythm (consisting of cadence, mean stride, swing and stance time), component 2 represented time variability (consisting of stance, stride and swing time variability), component 3 represented pace (consisting of step length and velocity), and component 4 represented length variability (consisting of step length variability), as shown in Table 1, in accordance with the study of Darweesh et al. [28]. For the dual task, the same PCA method showed similar results, resulting in the same gait domains.
Cerebrospinal fluid biomarkers
CSF was available in 76 participants. CSF-Aβ1–42 (Aβ), total tau, and phosphorylated tau (p-tau) levels were measured using a commercially available ELISA assay (Innotest, Fujirebio, Ghent, Belgium) in all centers. Since total tau and p-tau correlate highly (r = 0.97), only total tau was used for analysis in the main text, while p-tau outcomes are included in the Supplementary tables.
Statistical analysis
Baseline characteristics were compared between CN, MCI, and dementia groups using an analysis of variance (ANOVA), t-test, Kruskal-Wallis test, or chi-squared test when appropriate. Post-hoc analysis was performed with t-tests or Wilcoxon signed-rank tests with Bonferroni correction.
First, we examined the relation between syndrome diagnosis and gait domains using linear mixed models. The model included a between factor diagnosis group, a within factor condition (dual or walk task), and the interaction term diagnosis group * condition. Each model was adjusted for age, sex, and research center, and we assumed a random intercept for each participant. The gait domain factor loads were used as dependent variables (separate models for each gait domain). Second, we examined the relation between CSF biomarkers and gait domains. The model included terms for CSF level (separate models for either Aβ or total tau), a within factor condition (dual or walk task), and the interaction term CSF level * condition. The gait domain factor loads were used as dependent variable (separate models for each gait domain). Finally, we examined the effect of gait domain performance on cognitive decline over time as measured using MMSE. The model included terms for gait domain factor loads (separate models for each gait domain), time, and condition (dual or walk task), including all interaction effects of gait domain, time, and condition. MMSE scores were used as dependent variable. All models were adjusted for age, sex, and research center and assumed random intercepts for each participant.
A p-value of 0.05 was considered significant. Statistical analyses were performed using R [30].
RESULTS
From the 142 participants completing the walk task, 126 participants completed the dual task as well. Table 2 shows the baseline characteristics of the groups based on syndrome diagnosis. MCI patients were older than the CN (p < 0.001). MCI (p = 0.002) and dementia groups (p = 0.002) had lower MMSE scores than the CN group but there were no significant differences between MCI and dementia groups. The dementia group showed lower Aβ levels than the CN group (p < 0.001), but not than the MCI group (p = 0.057). No between-group differences were found on any other demographic parameters.
Baseline characteristics of groups based on syndrome diagnosis
Data is represented as Mean (SD), unless specified otherwise. CN, cognitively normal; MCI, mild cognitive impairment; BMI, body mass index; MMSE, Mini-Mental State Examination; FU, follow-up; CSF, cerebrospinal fluid; AD, Alzheimer’s disease. The ‘other’ category of the nosological diagnosis consisted of 2 dementia with Lewy bodies, 2 frontotemporal dementia, 2 AD and vascular dementia, and 4 other.
Syndrome diagnosis and gait
First, we used linear mixed models to examine the association between syndrome diagnosis and gait domains (Fig. 2, row 1). There was a main effect of diagnosis, as the dementia group showed lower scores in the gait domain pace compared to the MCI group (β±SE = –1.13±0.52, p = 0.03) and the CN group (β±SE = –1.24±0.53, p = 0.02). No differences were seen between the MCI and CN group (β±SE = –0.11±0.49, p = 0.82). There was an interaction between condition and group (p = 0.053), as MCI and dementia patients had more severe impairments in the dual condition than in the walk condition. When stratifying for condition, in the walk task the dementia group showed lower pace scores than the MCI group (β±SE = –1.06±0.52, p = 0.04) and CN group (β±SE = –0.92±0.54, p = 0.09), and in the dual task the dementia group showed also lower scores than the MCI group (β±SE = –1.03±0.54, p = 0.056) and CN group (β±SE = –1.15±0.58, p = 0.049). Similar effects were seen when only AD dementia patients were included in the dementia group (Supplementary tables). No effects were found in the other domains (Supplementary tables).
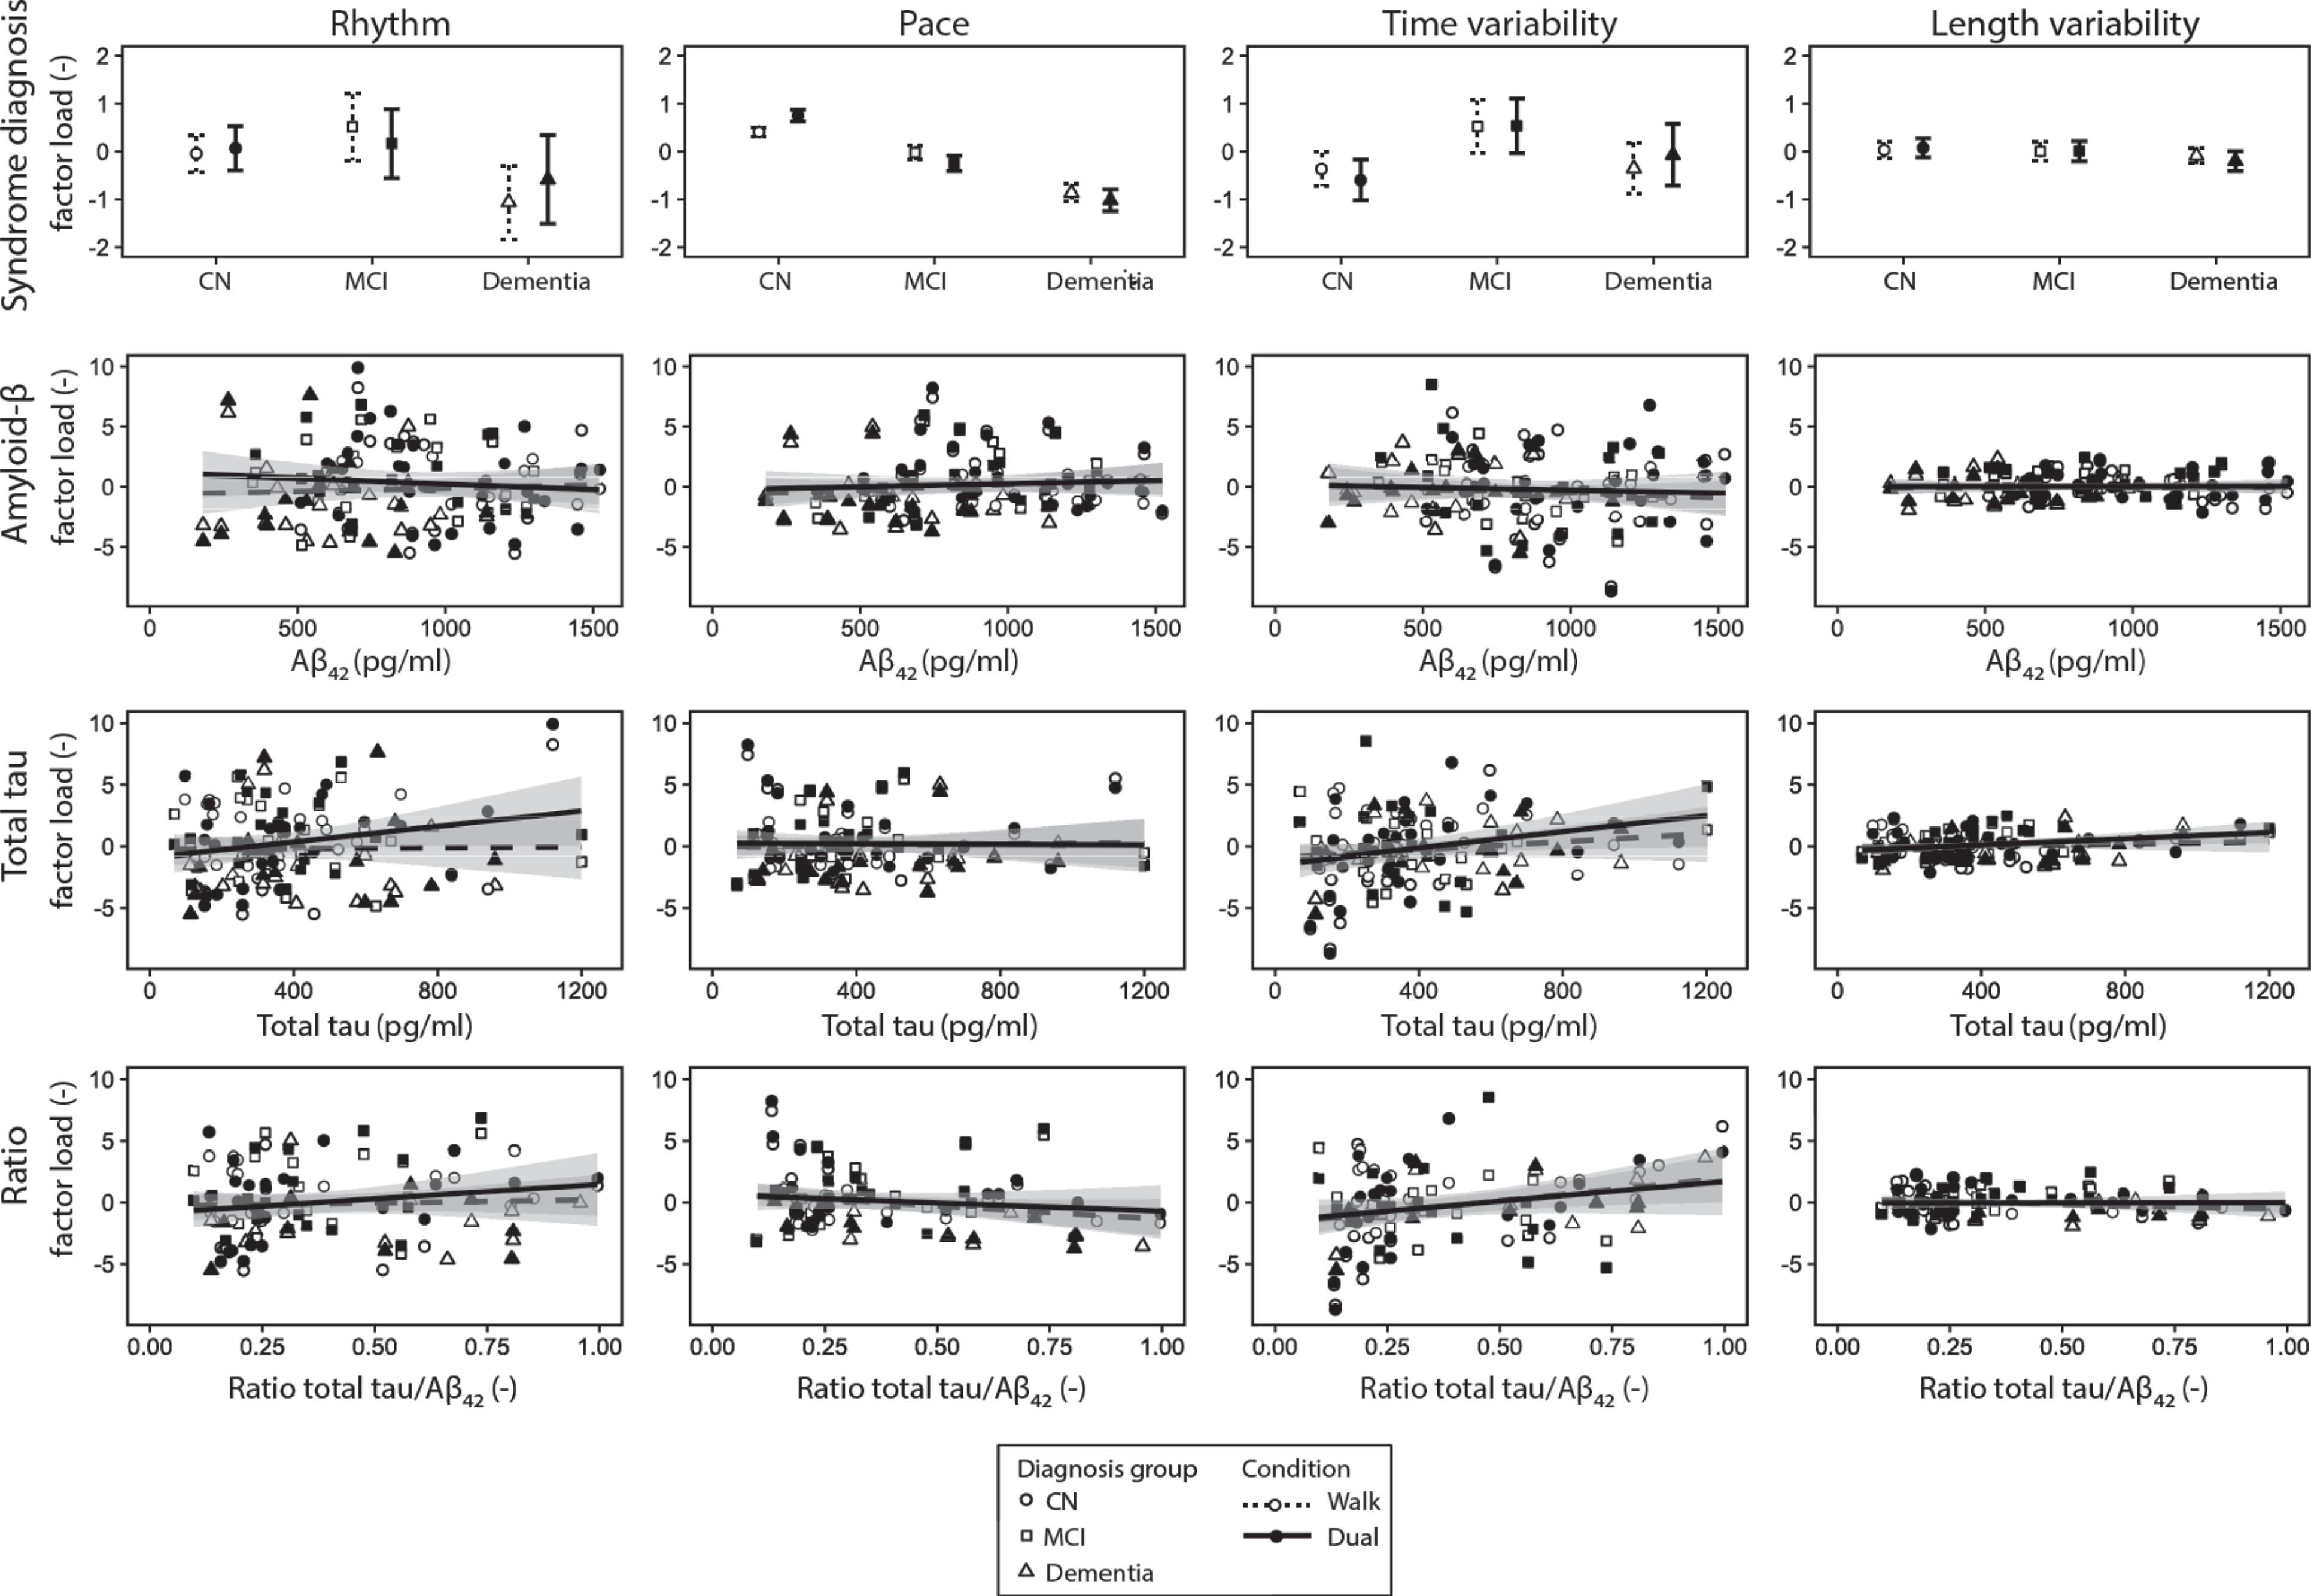
Row 1: The means and their 95% confidence interval for the four gait domains for both the dual (solid line) and walk (dashed line) task for the groups based on their syndrome diagnosis, disregarding the etiology causing the symptoms. When adjusted for age, sex, and center, only pace was associated with diagnosis group. Row 2–4: Regression lines and their 95% confidence interval of the four gait domains with Aβ, total tau and their ratio for the walk (dashed line) and dual (solid line) task separately. Each dot represents one trial of one participant, circles represent cognitively normal participants, squares represent MCI participants, and triangles represent dementia participants. When adjusted for age, sex, and center, only rhythm was associated with total tau.
CSF biomarkers and gait
Second, we examined the relation of CSF biomarkers with gait domains (Fig. 2, row 2–3). No effects were found for Aβ. For total tau, effects were found within the domain rhythm: a main effect of CSF total tau (β±SE = 0.003±–0.001, p = 0.03) and an interaction between condition and total tau (p = 0.04), which means that the effect of CSF on the gait domain rhythm is higher in the dual task. When stratifying for condition, the results were driven by the dual task, in which CSF total tau showed an effect on the gait domain rhythm (β±SE = 0.003±0.001, p = 0.069), but not in the walk condition (β±SE = 0.0009±0.001, p = 0.53). Similar effects were seen when only AD dementia patients were included in the dementia group (Supplementary tables).
Cognitive decline and gait
Third, we examined if the scores on the gait domains were associated with cognitive decline over time. There were neither associations with baseline MMSE (main effect rhythm: β±SE = 0.00±0.05, p = 0.998; time variability: β±SE = –0.002±0.06, p = 0.97; pace: β±SE = 0.05±0.09, p = 0.55; length variability: β ±SE = –0.12±0.15, p = 0.41), nor change in MMSE (p > 0.10).
DISCUSSION
The main findings of our study are that gait is associated with both syndrome diagnosis and CSF tau, but not with longitudinal cognitive decline. The dual task, which is the cognitively complex walk task, was essential to show the association between CSF total tau and gait. These findings show that gait analysis with accelerometers is a potential simple, yet effective tool to support clinical diagnosis.
Gait and syndrome diagnosis
We found that the gait domain pace, consisting of velocity and step length, was lowered in the dementia group compared to the MCI group and CN group. This suggests that dementia patients walk with smaller steps and lower velocity than MCI patients and CN people, which is in accordance with various studies reviewed by Scherder et al. [31] and Morris et al. [5]. The gait domains rhythm, time and length variability did not show any differences between the diagnosis groups, which is also in accordance with the reviewed studies by Morris et al. [5]. The study of Darweesh et al. [28], however, found an association between cognitive decline, rhythm, and pace, which may be explained by the number of participants and calculation of the gait features. It suggests that when using simple accelerometers to calculate several gait features, gait velocity and step length have the best ability to differentiate between different diagnosis groups. Effects of the dementia and MCI group compared to the CN group interacting with condition suggests that CN people react differently to the dual task than MCI and dementia patients (Fig. 2). This finding confirms that performing the dual task is helpful in finding a difference between the CN and MCI group, which is in accordance with previous literature [11, 32].
Gait and CSF biomarkers
The gait domain rhythm was found to be associated with total tau in CSF. When stratifying for condition, this effect was mainly driven by the dual task. This suggests again that the dual task is essential in gait analysis in cognitively impaired people. Our study confirms the results of the study of Åhman et al. [33]; they found correlations between the cognitive task in a dual walk task and p-tau and total tau and therefore concluded that neurodegeneration may affect dual-task performance.
This study did not find any associations with CSF Aβ, although it was expected that AD pathology, and Aβ pathology in particular, would affect gait performance. The opinions in previous literature are divided regarding the relation of Aβ and gait impairment. For example, the findings in our study were in accordance with the study of Åhman et al. [33], who did not find a relationship between CSF Aβ and gait features. Additionally, Koychev et al. [13] showed correlations of amyloid levels in CSF with gait features, but did not find any correlations with Aβ42, which we analyzed in this study. This is contradictory to several studies using Aβ PET scans, although it is unsure whether the effects are the result of Aβ pathology or concomitant neurodegeneration: a positive relation between Aβ deposition and gait speed is shown in CN [7, 34], dementia patients [35], and postmortem research [36]
Altogether, the scientific evidence regarding Aβ and gait impairment is divided and therefore more research is needed before gait can be used as support for AD diagnosis. Tau is, however, a measure which is shown to be related with gait impairment and neurodegeneration [37]. This suggests that gait impairment is rather related to neurodegeneration in general than to AD pathology specifically.
Gait and cognitive decline
No association was found between gait and cognitive decline as measured with the MMSE. This finding is contradictory to the results found in prospective cohort studies in the general population [28, 38]. Hooghiemstra et al. [8] performed similar gait tests with extensive neuropsychological tests as measure for cognitive decline in a larger sample size (n = 309) than our study, but did not find any significant associations with walk velocity either. These discrepancies may be the result of a small sample size in our study, although Hooghiemstra et al. [8] discuss that it is not solely a power problem. Other possible explanations are the selection of mild dementia patients (MMSE > 25), short follow-up duration, and relatively young participants compared to a typical dementia cohort, which means that they probably experience less vascular damage and frailty than average elderly with cognitive impairment.
Strengths and limitations
This study showed that in-depth gait analysis is possible with simple and inexpensive accelerometers and applicable to memory clinic patients. This study is the first multicenter study investigating the relationship of gait performance and CSF values in a larger sample size. Our cohort represented a patient population in a memory clinic with different levels of cognitive impairment, who underwent standardized gait tests. However, although our study had a larger sample size than previous studies, sample size was still fairly small. Another limitation is that selection bias could have occurred since the inclusion criterion was a MMSE score of at least 25, including the dementia group. When more severely demented or older patients participate, effects might have been larger.
Conclusion and recommendations
In conclusion, this study shows that gait 1) supports syndrome diagnosis, and 2) is associated with tau, but not with Aβ. Dual tasks are essential to distinguish MCI patients from CN participants, and to show the association with tau. Further research should focus on creating probability distributions for (combinations of) gait features. If probability distributions are available, as a next step, the implementation of gait analyses in clinical practice can be studied. For this, we recommend to include dual tasks, in order to distinguish between early stages of the disease. Accelerometers in widely available smartphones can be used, which are proven to be reliable and accurate sensors [39]. Additional to the accelerometers, we recommend to use gyroscopes, which are already present in smartphones, to make analysis more accurate. In this way, in-depth gait analysis with inexpensive and easy to use accelerometers can potentially contribute to diagnosis support.
Footnotes
ACKNOWLEDGMENTS
Research of Alzheimer Center Amsterdam is part of the neurodegeneration research program of Amsterdam Neuroscience. Alzheimer Center Amsterdam is supported by Stichting Alzheimer Nederland and Stichting VUmc fonds. The chair of Wiesje van der Flier is supported by the Pasman stichting. This project has received funding from the European Union’s Seventh Framework Programme for research, technological development and demonstration under Grant Agreement no. 611005 (Predict ND). The collaboration project DAILY (project no. LSHM19123-HSGF) is co-funded by the PPP Allowance made available by Health-Holland, Top Sector Life Sciences & Health, to stimulate public-private partnerships.