
Abstract
Background:
Vascular risk factors have been associated with risk of Alzheimer’s disease (AD) and volume loss of the hippocampus, but the associations with subfields of the hippocampus are understudied. Knowing if vascular risk factors contribute to hippocampal subfield atrophy may improve our understanding of vascular contributions to neurodegenerative diseases.
Objective:
To investigate the associations between age, sex, and vascular risk factors with hippocampal subfields volumes on 7T MRI in older persons without dementia.
Methods:
From the Medea 7T study, 283 participants (67±9 years, 68% men) without dementia had 7T brain MRI and hippocampal subfield segmentation. Subfields were automatically segmented on the 3D T2-weighted 7T images with ASHS software. Using linear mixed models, we estimated adjusted associations of age, sex, and vascular risk factors with z-scores of volumes of the entorhinal cortex (ERC), subiculum (SUB), Cornu Ammonis (CA)1, CA2, CA3, CA4, and dentate gyrus (DG), and tail as multivariate correlated outcomes.
Results:
Increasing age was associated with smaller volumes in all subfields, except CA4/DG. Current smoking was associated with smaller ERC and SUB volumes; moderate alcohol use with smaller CA1 and CA4/DG, obesity with smaller volumes of ERC, SUB, CA2, CA3, and tail; and diabetes mellitus with smaller SUB volume. Sex, former smoking, and hypertension were not associated with subfield volumes. When formally tested, no risk factor affected the subfield volumes differentially.
Conclusion:
Several vascular risk factors were associated with smaller volumes of specific hippocampal subfields. However, no statistical evidence was found that subfields were differentially affected by these risk factors.
Keywords
INTRODUCTION
Around 50 million people worldwide have dementia. An estimated 30 to 35 million (60–70%) of these people have Alzheimer’s disease (AD). It is predicted that by 2050, 152 million people will have dementia [1]. Dementia has a huge impact on the physical, psychological, and emotional wellbeing of patients and their caregivers, and is also a major contributor of a rise in health care costs [2]. Understanding how risk factors contribute to AD etiology may aid in the prevention or treatment of AD. It has been established that vascular risk factors, of which most are modifiable by either lifestyle or medication, play an important role in AD risk [3], hippocampal calcifications [4], and hippocampal atrophy [5]. The hippocampus is one of the first structures to be affected in AD [6].
The hippocampus and adjacent areas consist of several subfields, including the entorhinal cortex, subiculum, Cornu Ammonis (CA)1, CA2, CA3, CA4, and dentate gyrus (DG) [7]. Evidence exists that hippocampal subfields are differentially affected by aging, by diseases such as diabetes, and by neurodegenerative disease as AD [8, 9]. A better understanding of how vascular risk factors contribute to hippocampal subfield atrophy may improve our understanding of the vascular contributions to the AD phenotype, vascular dementia, or other neurodegenerative diseases.
Studies on vascular risk factors—i.e., smoking, alcohol, obesity, hypertension, and diabetes mellitus—and hippocampal subfields in vivo in humans are rather scarce (overview in Table 1 of studies using manual or automated delineation methods). Further, these studies used relatively low MRI field strength, varying from 1.5 Tesla up to 4.7 Tesla, and usually looked at combined subfield volumes such as CA1 and 2 (CA1-2), or CA2, CA3, CA4, and DG (CA2-3-4-DG), rather than individual subfields, with variable results. Moreover, most studies did not examine all subfield volumes and none examined effects of risk factors on the different subfield volumes (see Table 1). The use of ultra-high field strength 7T MRI more than doubles the signal-to-noise ratio compared to 3T which enabled us to increase the spatial resolution while keeping scan duration within acceptable limits [10] and therefore allows for investigating associations between vascular risk factors and the different hippocampal subfield volumes more precisely.
Overview of studies researching vascular risk factors and hippocampal subfield volumes
APOE ɛ4, Apolipoprotein E ɛ4; HDL cholesterol, high density lipoprotein cholesterol;IL, interleukin; AUD, alcohol use disorder; DM2, diabetes mellitus type 2; aMCI, amnestic mild cognitive impairment; MCI, mild cognitive impairment;paraSUB, parasubiculum;preSUB, presubiculum; SUB, subiculum; ERC, entorhinal cortex; CA, CornuAmmonis; DG, dentate gyrus; GC-ML-DG, granule cell and molecular layer of the dentate gyrus, HATA, hippocampus-amygdala-transition-area.
We aimed to estimate the associations of age, sex, and vascular risk factors with hippocampal subfields volumes with 7T MRI in a large cohort of middle-aged and older adults without clinically established dementia. We also provide an overview of existing literature on vascular risk factors and hippocampal subfields volumes on MRI.
METHODS
Study population
Data were used from the Memory Depression and Aging (Medea)-7T study, a cohort study at the University Medical Center (UMC) Utrecht, with the objective to investigate risk factors and outcomes of brain changes defined on 7T MRI in a diverse population of individuals with and without dementia. For the Medea-7T study cohort, we originally recruited participants from four settings: 1) persons of 60 years or older registered in a general practice in Utrecht and without a diagnosis of mild cognitive impairment (MCI) or dementia, 2) participants of the PREDICT-MR study, 3) patients of the SMART-MR study, and 4) patients with MCI or early AD from the memory clinics of the UMC Utrecht and a general hospital in Utrecht. A total of 368 participants were included in these four settings between January 2010 and October 2017, 70 from the general practice, 50 from the PREDICT-MR study, 213 from the SMART-MR study, and 35 from the memory clinics. A more detailed description of the separate cohorts/settings is provided in the Supplementary Methods and Supplementary Figure 1. All participants underwent a 7T brain MRI using the same MRI sequences, and similar assessment of risk factors and outcomes and clinical examinations, all performed at the UMC Utrecht. For the present study we excluded 35 patients with MCI or AD and 8 persons with missing values on covariates, resulting in a sample of 325 participants with a 7T brain MRI. Another 42 participants were excluded from the analyses, due to incomplete hippocampal subfield segmentation (e.g., due to movement artefacts, see below for details), leaving 283 participants for this study sample. Approval of the medical ethics committee of the UMC Utrecht was obtained, and all participants provided written informed consent.
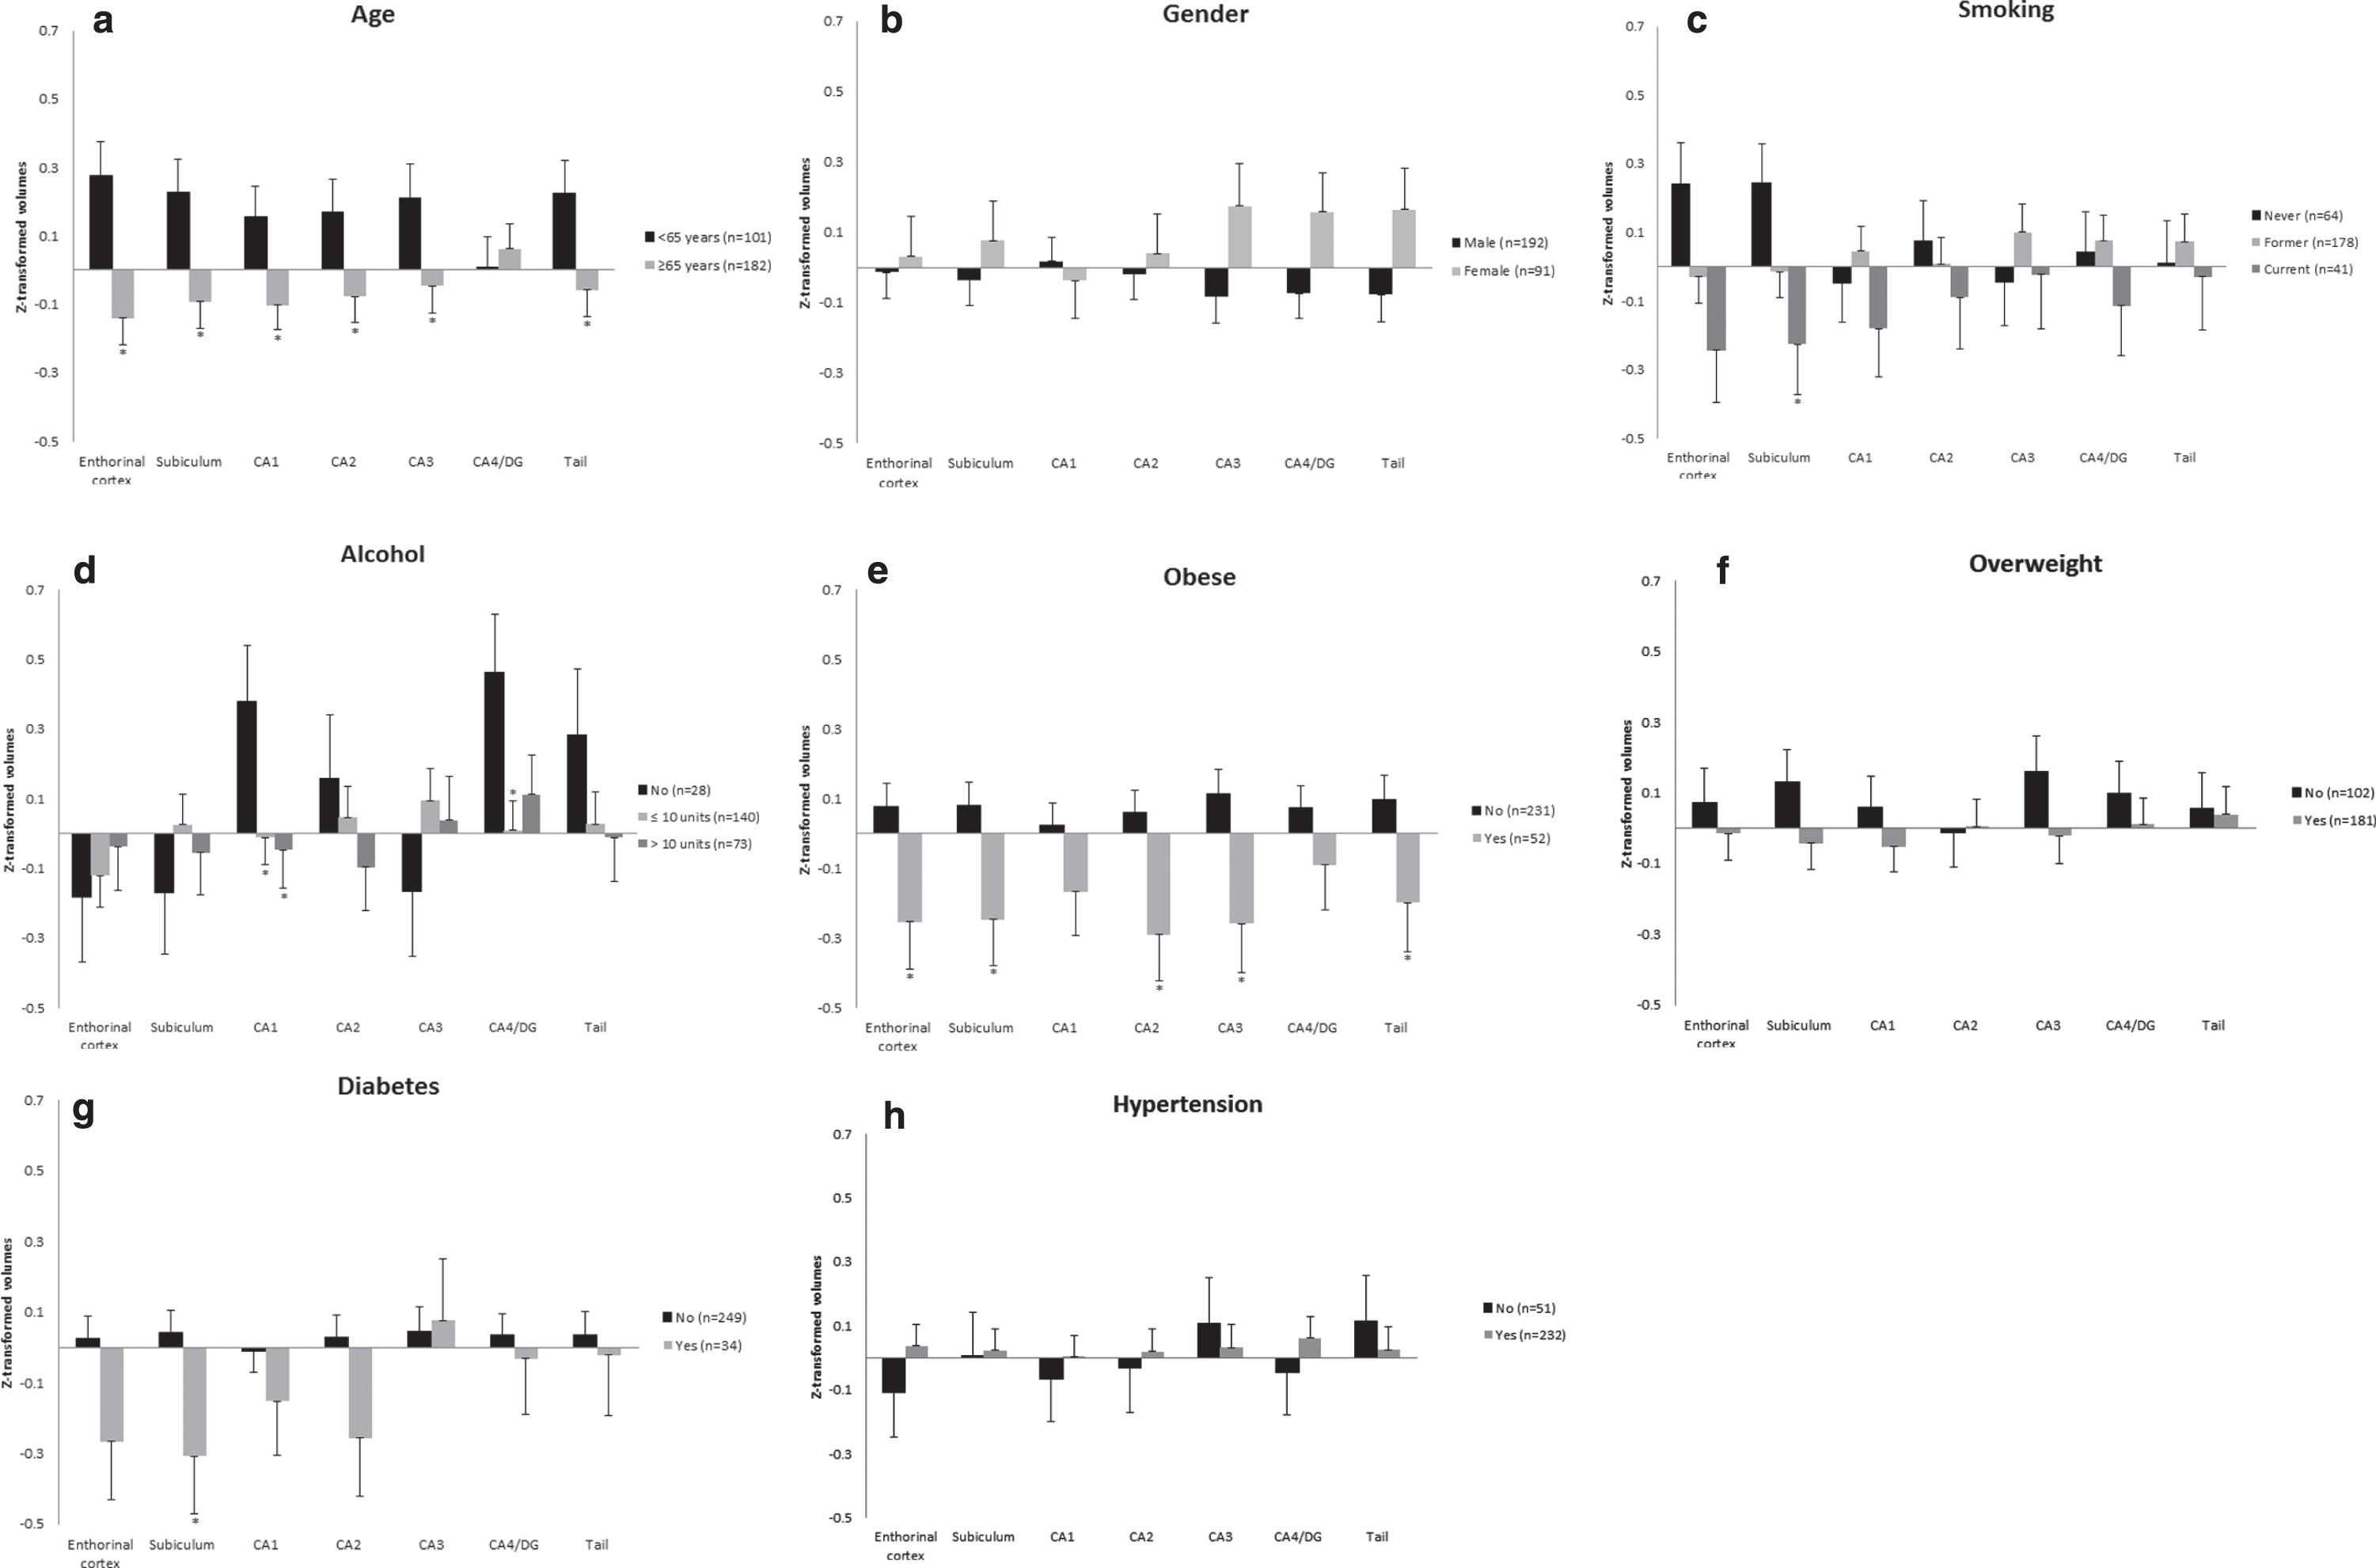
Non-adjusted estimated means and standard errors of age, sex, and vascular risk factors with z-transformed volumes of each hippocampal subfield. CA, Cornu Ammonis; DG, dentate gyrus. * significant difference between the groups compared in this subfield, p-value<0.05. In the cases that there are 3 groups visualized per subfield, the significant difference is between the vascular risk factor and the group were the risk factor is absent (reference category). Note: Plots of ‘age’ and ‘overweight’ include groups generated for visualization purpose only, these dichotomous groups were not used in an analysis.
Demographics
Age and sex were assessed with questionnaires.
Vascular risk factors
For this study, we defined the vascular risk factors as follows: smoking was determined as never, current, or former smoker. Alcohol use was expressed in units per week and was categorized as no alcohol use, up to 10 units per week, and more than 10 units per week. One unit of alcohol in the Netherlands is equal to 10 grams of alcohol or 12 mL of alcohol [11]. Both smoking history and alcohol use were assessed with questionnaires. Body mass index (BMI) was calculated as weight (kg)/height (m2) for which height and weight were measured without shoes or heavy clothing. Obesity was defined as having a BMI of 30.0 kg/m2 or higher. Diabetes mellitus (DM) was defined as use of glucose-lowering agents or insulin, a known history of DM or a non-fasting plasma glucose ≥11.1 mmol/L. Blood pressure was measured three times in supine position and the average was calculated for both systolic and diastolic blood pressure. Hypertension was defined as mean systolic blood pressure >140 mmHg, mean diastolic blood pressure >90 mmHg or use of antihypertensive drugs.
7T MRI protocol
Brain images at 7 Tesla MRI were obtained using a 7.0 T MRI system (Philips Healthcare, Cleveland, OH, USA) with a 32-channel receive head coil (Nova Medical, Wilmington, MA, USA). For the hippocampal subfield segmentation, 3D T1-weighted (3D T1-weighted (TI/TR/TE = 1225/4.8/2.2, acquired voxel size = 1.00×1.00×1.00 mm3, (reconstructed = 0.66×0.66×0.50 mm3)) and 3D T2-weighted (TR/ TE = 3158/301, acquired voxel size = 0.70×0.70×0.70 mm3 (reconstructed = 0.35 ×0.35×0.35 mm3)) images were acquired.
1.5T and 3T MRI protocol
For the SMART-MR study and the PREDICT-MR study, MR images were obtained using a 1.5 Tesla whole-body system (Gyroscan ACS-NT, Philips Medical Systems, Best, the Netherlands). For segmentation of the intracranial volume (ICV), the protocol consisted of a sagittal 3D T1-weighted sequence (SMART-MR: repetition time (TR)/echo time (TE): 7.0/3.2 ms; voxel size = 0.94×0.94×1.00 mm3 isotropic; PREDICT-MR: TR/TE: 6.9/3.1 ms; voxel size = 0.98×0.98×1.10 mm3 isotropic). For the participants recruited via the general practice MR images were obtained using a 3.0 Tesla MRI whole-body system (Philips Medical Systems, Best, the Netherlands). For segmentation of the ICV, the protocol consisted of a sagittal 3D T1-weighted sequence (TR/TE = 8.0/4.5, voxel size = 1.00×1.00×1.00 mm3 isotropic). Segmentation of ICV was performed on 1.5T and 3T images, respectively, as ICV segmentation by Automatic Segmentation of Hippocampal Subfields (ASHS, see Hippocampal segmentation below) on 7T has not been validated yet.
Segmentation of MR images
Brain segmentation: all studies
The 3D T1-weighted sequence of the 3T or 1.5T images was used for automatic brain segmentation by CAT 12 (version 1155), with use of SPM12 (version 6906) and MATLAB (version 8.6). Cat12 distinguishes gray matter, white matter, and cerebrospinal fluid (CSF). Total ICV was calculated by summing up total gray and white matter and total CSF volume.
Hippocampal segmentation at 7T MRI
Hippocampal subfields were automatically segmented on the 3D T2-weighted 7T images with the ASHS software (UPenn, PA, USA) [12]. ASHS segments the subfields CA1, CA2, CA3, CA4&DG, subiculum, the entorhinal cortex, and tail. Previously, a freely downloadable ASHS atlas (https://www.nitrc.org/projects/ashs) was validated for use on 7Tesla MRI [13]. For this study we used the ‘UMC Utrecht 7T ASHS Atlas, compatible with original (slow) ASHS’. Generated hippocampal subfield volumes were checked for outliers using frequencies and histograms. Segmentations of outliers were then visually inspected and removed from the analysis if they were due to a segmentation error. Additionally, we visually inspected segmentations of a random sample of 5% of the total study sample. We did not manually adjust failed segmentations that were due to segmentation errors. Of the 325 participants without MCI or AD that underwent a 7T MRI and had no missing covariates, n = 11 had no T1 or T2 available, n = 18 were excluded due to movement or signal interference, and n = 13 had a segmentation error, leaving n = 283 with a complete hippocampal segmentation.
Data analysis
Baseline characteristics were calculated for the total study sample (n = 283). Hippocampal subfields of the left and right hemisphere were summed and then Z-transformed to improve comparability between the results of the subfields. Using mixed effect regression models (PROC MIXED statement in SAS), we estimated associations between the vascular risk factors and the volume of the hippocampal subfields and tail. The mixed model was used as it takes the multiple correlated observations (volumes of the hippocampal subfields) per subject into account. Missing data on covariates were excluded from analyses. Missing values ranged from 0.4% for BMI to 14.8% for alcohol use. The vascular risk factors included age, sex, smoking (former, current versus never), alcohol use (up to 10 units per week, more than 10 units per week versus no alcohol use), BMI, obesity, diabetes mellitus, hypertension, and systolic and diastolic blood pressure. The volumes of the hippocampal subfields were included as dependent variables in one mixed model, while each vascular risk was included as the independent variable in separate models. All analyses were adjusted for age, sex, and ICV (calculated from the 1.5T or 3T scan), with exception of sex and age which were adjusted for age and ICV, and sex and ICV, respectively. If a risk factor was statistically significantly associated with one of the subfield volumes, we performed post-hoc analyses to explore to what extent this subfield was differentially affected by the risk factor by using estimate statements comparing the observed effect estimate with the effect estimate of the risk factor on CA1. We chose comparison with one subfield instead of comparison between all subfields to avoid multiple comparisons. Further, we chose CA1 as the reference subfield, because CA1 is relatively large in volume, which makes it more robust and less prone to measurement differences across methods, thus improving comparability with other (future) studies.
Data for statistical analyses were prepared using IBM SPSS Statistics for Windows, Version 25.0, Armonk, NY: IBM Corp., and the analyses were conducted with SAS software, Version 9.4 of the SAS system for Windows, SAS Institute Inc., Cary, NC, USA.
RESULTS
An overview of existing literature on vascular risk factors and hippocampal subfield volumes using manual or automated delineation methods is displayed in Table 1. As can be seen, the majority of in vivo studies with humans researching risk factors and hippocampal subfield volumes were published in the past 10 years and are relatively few in number. Risk factors studied differed between studies from only age or alcohol use disorder up to the inclusion of hypertension, obesity, APOE ɛ4 carrier status, and HDL-cholesterol. Studies used 1.5T to 4.7T MRI, except for one study that used 7T MRI. Following our inclusion criterion, subfields were segmented manually, or automatically by protocols developed by the authors or by freely available software (e.g., Freesurfer). Areas of the hippocampus that were studied ranged from one up to eleven, and number of subjects included in the studies widely varied with the majority having a study population less than hundred participants.
Baseline characteristics of the study population are displayed in Table 2. Participants were on average 67 years of age (SD 9 years) and 32% were female. Of all participants, 22.6% never smoked, 9.9% used no alcohol, 12.0% had diabetes, and 82.0% had hypertension.
Baseline characteristics of the study sample
1Data of 241 participants on alcohol use (n = 42 missing). 2,3Data of 282 participants on body mass index and obesity (n = 1 missing). 4Data of 281 participants on diabetes mellitus (n = 2 missing). 5Sum of left and right hippocampus (subfield).
Table 3 shows the results of the mixed models for the adjusted associations of age, sex, and other risk factors with z-transformed volumes of each hippocampal subfield. In Fig. 1, we also visualized the unadjusted volumes for each risk factor. As can be seen, with increasing age, all subfield volumes were significantly smaller, with the exception of CA4/DG. Post-hoc tests showed that with increasing age, the entorhinal cortex, subiculum, CA2, CA3, and the tail were similarly affected as CA1 (Table 4). Sex was not significantly associated with any of the subfield volumes.
Associations between age, sex, vascular risk factors, and z-transformed hippocampal subfield volumes in the study sample
Mixed models: adjusted for age, sex, intracranial volume. Reference categories for all categorical risk factors is absence of that risk factor. 1Adjusted for sex and intracranial volume. 2Adjusted for age and intracranial volume. 3Current and former smoking were compared to never smoking. 4Alcohol: data of 241 participants used due to missing data (n = 42). 5Body mass index, obesity: data of 282 participants on body mass index and obesity (n = 1 missing). 6Diabetes mellitus: data of 281 participants on diabetes mellitus (n = 2 missing). 7For easier interpretation, we used the continuous systolic and diastolic blood pressure divided by a factor ten. *significant p–value < 0.05. **significant p-value < 0.01
Age, vascular risk factors and volumes in standardized z–scores of hippocampal subfields compared to the volume of Cornu Ammonis 1
Mixed models: adjusted for age, sex and intracranial volume. Volumes of hippocampal subfields with Cornu Ammonis 1 as reference volume (all z-transformed), for vascular risk factors that showed a significant association with volumes in Table 2. 1Alcohol: data of 241 participants used due to missing data (n = 42). 2Body Mass Index, obesity: data of 282 participants on body mass index and obesity (n = 1 missing). 3Diabetes mellitus: data of 281 participants on diabetes mellitus (n = 2 missing).4For easier interpretation we used the continuous diastolic blood pressure divided by a factor ten.
Compared to never smokers, current smokers had statistically significantly smaller volumes of the entorhinal cortex and subiculum (entorhinal cortex: B = –0.48, 95% CI: –0.85; –0.12, and subiculum B = –0.47, 95% CI: –0.83; –0.11). This equals about half a standard deviation, and thus a 16% smaller volume than the mean volumes of these subfields. Former smokers also had smaller volume of the entorhinal cortex (B = –0.27, 95% CI: –0.55; 0.01) and subiculum (B = –0.26, 95% CI: –0.53; 0.01), although this association did not reach statistical significance (Table 3). When formally tested, post-hoc analyses did not show entorhinal cortex and subiculum to be significantly differentially affected by current smoking status compared to CA1 (Table 4).
Compared to no alcohol use, alcohol use up to 10 units/week showed statistically significantly smaller volumes of CA1 (B = –0.39, 95% CI: –0.74; –0.04) and CA4/DG (B = –0.45, 95% CI: –0.82; –0.08), and alcohol use of more than 10 units/week also showed a statistically significantly smaller CA1 volume (B = –0.43, 95% CI: –0.81; –0.05). CA1 was not significantly more affected, when formally tested, than the other subfield volumes as shown by post-hoc comparisons (Table 4).
Higher BMI was significantly associated with smaller volumes of the entorhinal cortex (B = –0.04, 95% CI: –0.06; –0.01), subiculum (B = –0.04, 95% CI: –0.07; –0.01), CA1 (B = –0.03, 95% CI: –0.05; –0.00), CA2 (B = –0.03, 95% CI: –0.06; –0.00), and CA3 (B = –0.05, 95% CI: –0.08; –0.02), but not CA4/DG or tail. These B values are similar to around 1–1.7% smaller volumes compared to the mean of these volumes. BMI affected entorhinal cortex, subiculum, CA2, and CA3 similarly to CA1 when we tested this formally with post-hoc analyses (Table 4).
Presence of obesity showed around 10 to 12% smaller subfield volumes compared to the mean volumes of the entorhinal cortex (B = –0.33, 95% CI: –0.62; –0.05), subiculum (B = –0.33, 95% CI: –0.61; –0.05), CA2 (B = –0.35, 95% CI: –0.63; –0.07), CA3 (B = –0.37, 95% CI: –0.67; –0.08), and tail (B = –0.30, 95% CI: –0.59; –0.00), although not significantly different from CA1 as shown by post-hoc comparisons (Table 4).
Diabetes mellitus was associated with smaller volume of the subiculum (B = –0.35, 95% CI: –0.68; –0.02) but not with other subfields. Yet, the effect estimate for the subiculum was not statistically significantly different from the effect estimate for CA1 volume when tested formally (Table 4).
Hypertension was not statistically significantly associated with any of the hippocampal subfield volumes, nor was increasing systolic blood pressure (per 10 mmHg increase) or increasing diastolic blood pressure (per 10 mmHg increase) with the exception of CA4/DG volume, which was larger (B = 0.13, 95% CI: 0.02; 0.24). We repeated the analyses within participants without anti-hypertensive medication (n = 41 with hypertension based on elevated blood pressure, n = 50 without hypertension). There were no significant associations between hypertension, systolic or diastolic blood pressure and hippocampal subfield volumes (data not shown). When formally tested, post-hoc analyses showed no difference between the effect estimates for CA4/DG and CA1 volume.
DISCUSSION
In this study among middle-aged and older adults without clinical dementia, we observed that increasing age was associated with smaller volumes of all subfields, except CA4/DG. Current smoking was associated with smaller volumes of the entorhinal cortex and subiculum. Moderate alcohol use was associated with smaller volumes of CA1 and CA4/DG. Obesity was associated with smaller volumes of the majority of subfields. Diabetes mellitus was associated with smaller subiculum volume. Other risk factors studied were not associated with hippocampal subfield volumes.
Although we observed that risk factors were associated with specific subfield volumes, and that some effect estimates were relatively large compared to others, none of the subfields was differentially affected by any of the risk factors when formally tested. Of note, this study included the largest number of participants with 7T MRI segmentations to date; nevertheless, it is possible that we lacked sufficient power to detect small differences between subfields. Also, we tried to avoid multiple comparisons by using one subfield (CA1) as a reference subfield to test if the subfields were differentially affected by a risk factor. CA1 is the largest subfield and thus least prone to measurement error. This already resulted in 30 comparisons. It is thus possible that we missed differences between other subfields. However, comparing all risk factors with all subfields would have largely increased the number of comparisons and thus the likelihood of chance findings.
Our finding that increasing age was associated with smaller subfield volumes is consistent with previous findings from other in vivo studies in humans that found increasing age to be associated with smaller volumes in one or more subfields [10, 14–26] (Table 1). Although these studies did not examine any potential differential effects on individual subfields, the variety in subfields affected between studies suggests that all subfields are to a lesser or greater extent affected. This is consistent with our observation that subfields were not differentially affected when formally tested, and is in line with in vivo literature reporting that aging is associated with hippocampal shrinkage [27]. An histological study, showed most neuron loss in the subiculum and CA4 (or hilus) with ageing [28], although the effect on the volume of the subfields with this neuron loss was not specified.
In this study, sex was not associated with any subfield volume reduction, which is consistent with most literature [14, 25]. To our knowledge only one study reported that men had a larger CA2 volume than women (Table 1) [23]. Overall, sex does not seem to influence a decrease in hippocampal (subfield) volume. Current smoking, but not former smoking, was associated with smaller entorhinal cortex and subiculum volumes. Another study found a trend for a decrease in subiculum volume and smaller volumes of CA1, CA2-3, and CA4/DG (Table 1) [29]. Smoking is an important risk factor for AD [30] and previous studies, in vivo and histological, report that the entorhinal cortex and subiculum are among the first structures affected in AD [8, 28]. It is interesting to note that in our study also the entorhinal cortex and subiculum show the strongest associations with smoking status. Although we did not find that the entorhinal cortex and subiculum were significantly more affected than CA1 as reference subfield when formally tested, our findings support the notion that smoking contributes to AD development through hippocampal volume loss. We also found an association between alcohol use up to 10 units per week and more than 10 units per week and a smaller CA1 volume, and also between alcohol use up to 10 units per week and a smaller CA4/DG. One other study also found a smaller CA1 volume, CA4, and DG in patients with alcohol use disorder compared to control participants, which may be consistent with our findings. However, that study also found a smaller subiculum volume in alcohol use disorder compared to control participants, which we did not observe (Table 1) [15]. Another study in patients with alcohol use disorder found a smaller subiculum volume, but no associations with CA2-3 or CA4/DG (Table 1) [31]. It should be noted that we did not examine alcohol use disorder, but units per week in participants not selected on alcohol dependence. In alcohol use disorder it is reported that individuals on average have an 8% smaller hippocampus [5].
Higher BMI and obesity were associated with volume reductions in almost all hippocampal subfields. One other study that investigated ERC found no association with obesity (Table 1) [20], and another investigated SUB, CA2-3, and CA4/DG and also found no associations (Table 1) [31]. Reviews report that obesity is associated with a smaller total hippocampal volume [5, 27], possibly due to several different effects leading to a decrease in insulin sensitivity [27]. Insulin resistance in the hippocampus is thought to be an important factor in cognitive dysfunction and AD [32].
DM was associated with significant volume reduction in the subiculum, which is consistent with one other study, although that study also observed an association with volume reduction in CA1 (Table 1) [33]. It has been reported that patients with DM have increased atrophy of the total hippocampus [5], and DM is one of the more consistently reported risk factors for AD and vascular dementia [3] and is thought to affect cognition by the mechanism of insulin resistance as mentioned above.
We found no association between hypertension and hippocampal subfield volumes, which is consistent with two other studies (Table 1) [20, 25]. However, one other study found a smaller CA1-2 volume in older adults with hypertension compared to normotensive older adults (Table 1) [26]. To our knowledge, no studies investigated the associations between continuous systolic or diastolic blood pressure and subfield volumes in humans in vivo. We did not find evidence for an association between systolic blood pressure and smaller hippocampal subfield volumes. In our study, higher diastolic blood pressure was associated with larger CA4/DG volume, but not with other subfield volumes. CA4/DG was not differentially affected when compared to CA1 volume. To explore if pulse pressure could explain this unexpected finding, we performed a post-hoc mixed effect regression model, and found that pulse pressure was not associated with any of the subfields volumes. Overall, the associations between blood pressure and hippocampal subfield volumes are inconsistent, and there does not seem to be a differential effect on subfield volumes. Hypertension, systolic and diastolic blood pressure levels and their association with dementia is complex. Both hypertension and low diastolic blood pressure are associated with a decrease in hippocampal volume [5].
Strengths of this study include the large number of participants with 7T brain imaging. Further, we used 7T MRI to visualize the hippocampal subfields and used a freely available fully automated segmentation program (ASHS) that has been validated and showed high accuracy compared to the labor-intensive manual segmentation [13]. Previous studies were conducted on lower resolution MRI scanners which make it more difficult to delineate the subfields and studies therefore combined different subfields in their analyses. Furthermore, the method of delineation of the subfields differs across studies. Some studies used manual protocols, while others used automatic methods of delineation. These automatic programs included Freesurfer version 5.1 up to version 5.3, which have been criticized before as these subfields did not agree well with histological boundaries and other studies using manual protocols [34]. The subfield boundaries have been improved in version 6.0, although caution with interpretation of the volumetric data on the subfields is still advised as some boundaries are not visual in training data [35]. In Table 1, we included those studies that used a manual or automated delineation method of hippocampal subfield volumes, to increase comparability with our study, although it must be noted that there are many interesting other studies using different techniques (e.g., [36–44]) on the association between age or other risk factors and the hippocampus). Another strength of this study is that we examined differential effects of the vascular risk factors on subfield volumes. As can be seen from Table 1, few studies investigated the associations between vascular risk factors and hippocampal subfield volumes in vivo, and none examined any potential differential effects of the risk factors on subfield volumes. Further, we included participants from various settings, which increased variability in risk factor distribution. At the same time, it should be noted that the majority of participants in the study came from the SMART-MR study that had a history of vascular disease and were survivors of the cohort still willing and able to undergo a 7T MRI. The results may therefore not be generalizable to the general population without dementia.
A limitation of this study is the cross-sectional design, and we therefore do not know to what extent the smaller subfield volumes observed represent volume loss in the context of normal aging or neurodegenerative diseases, such as AD. The participants were not selected on having an increased risk for AD, although a portion of the sample may have a family history of AD or experience subjective cognitive decline. Also, we did not have APOE genotype for all participants available nor did we have amyloid-β or tau. Also, we were not able to determine to what extent hippocampal subfields show differential volume loss over time. Prospective studies are needed to determine to what extent the observed hippocampal subfield volume reductions increase the risk of AD or are part of normal aging.
In conclusion, in older adults without dementia, age, smoking, alcohol use, obesity and diabetes mellitus were associated with smaller volumes of specific hippocampal subfields on 7T MRI; however, no statistical evidence was found that these subfields were differentially affected by these risk factors. More studies are needed to confirm our findings and investigate to what extent hippocampal subfields are differentially affected by risk factors and contribute to AD development.
Footnotes
ACKNOWLEDGMENTS
We gratefully acknowledge the time and effort of all participants. We would like to thank all general practitioners from the general practice “Huisartsenpraktijk Bosboomstraat” for their help in inclusion of the participants. Furthermore, we would like to thank all the people involved in data acquisition in the memory clinics, and people involved in the data acquisition of the PREDICT-MR study.
Financial support was received by the Alzheimer Nederland - Internationale Stichting Alzheimer Onderzoek (AN-ISAO) (Grant number 12504). The funding source had no involvement in writing of this article or the decision to submit it for publication.
We gratefully acknowledge the contribution of the SMART research nurses; R. van Petersen (data-manager); B.G.F. Dinther (vascular manager) and the members of the Utrecht Cardiovascular Cohort-Second Manifestations of ARTerial disease-Study Group (UCC-SMART-Study Group): F.W. Asselbergs and H.M. Nathoe, Department of Cardiology; G.J. de Borst, Department of Vascular Surgery; M.L. Bots and M.I. Geerlings, Julius Center for health Sciences and Primary Care; M.H. Emmelot, Department of Geriatrics; P.A. de Jong and T. Leiner, Department of Radiology; A.T. Lely, Department of Obstetrics & Gynecology; N.P. van der Kaaij, Department of Cardiothoracic Surgery; L.J. Kappelle and Y.M. Ruigrok, Department of Neurology; M.C. Verhaar, Department of Nephrology, F.L.J. Visseren (chair) and J. Westerink, Department of Vascular Medicine, University Medical Center Utrecht and Utrecht University. Special thanks go to N.P.A. Zuithoff, Julius Center for Health Sciences and Primary Care, University Medical Center Utrecht and Utrecht University, for his assistance with SAS.