
Abstract
Background:
Late-onset Alzheimer’s disease (AD) is highly heritable. The effect of many common genetic variants, single nucleotide polymorphisms (SNPs), confer risk. Variants are clustered in areas of biology, notably immunity and inflammation, cholesterol metabolism, endocytosis, and ubiquitination. Polygenic scores (PRS), which weight the sum of an individual’s risk alleles, have been used to draw inferences about the pathological processes underpinning AD.
Objective:
This paper aims to systematically review how AD PRS are being used to study a range of outcomes and phenotypes related to neurodegeneration.
Methods:
We searched the literature from July 2008–July 2018 following PRISMA guidelines.
Results:
57 studies met criteria. The AD PRS can distinguish AD cases from controls. The ability of AD PRS to predict conversion from mild cognitive impairment (MCI) to AD was less clear. There was strong evidence of association between AD PRS and cognitive impairment. AD PRS were correlated with a number of biological phenotypes associated with AD pathology, such as neuroimaging changes and amyloid and tau measures. Pathway-specific polygenic scores were also associated with AD-related biologically relevant phenotypes.
Conclusion:
PRS can predict AD effectively and are associated with cognitive impairment. There is also evidence of association between AD PRS and other phenotypes relevant to neurodegeneration. The associations between pathway specific polygenic scores and phenotypic changes may allow us to define the biology of the disease in individuals and indicate who may benefit from specific treatments. Longitudinal cohort studies are required to test the ability of PGS to delineate pathway-specific disease activity.
Keywords
INTRODUCTION
Alzheimer’s disease (AD) is a common neurodegenerative condition affecting people in later life. The heritability of late-onset AD is estimated to be almost 75% [1]. Genome-wide association studies (GWAS) have identified a number of loci associated with AD. The largest meta-analysis to date reported 25 loci associated with increased risk for AD at genome-wide significant level [2]. These common genetic variants, known as single nucleotide polymorphisms (SNPs), have only a small effect on disease risk.
Polygenic risk scores (PRS) sum the weighted allelic dosages across the genome, and have allowed the exploration of how genetic risk for AD is manifest in different populations [3]. However, genetic score methodology varies greatly between studies. For example, Escott-Price et al. analyzed over 200,000 SNPs, including APOE and reported an area under the curve (AUC) value of 0.84 [4] whereas Tosto et al. used only 21 SNPs excluding APOE resulting in an AUC of 0.57 [5].
As GWAS allows all variants in the genome to be tested for association simultaneously without any a priori hypothesis, they have implicated a number of areas of biology previously unconnected to AD. Pathway analyses of genome-wide association data have shown that the disease processes that underpin AD are highly complex, involving a number of biological processes, including immunity, lipid metabolism, tau binding proteins, and amyloid-β protein precursor metabolism [2, 6].
Since the PRS approach was first described, many studies have investigated whether AD PRS are associated with a wide variety of phenotypes. To summarize this literature, we undertook a systematic review to identify studies that have used a PRS approach to investigate phenotypes associated with genetic risk for AD.
METHODS
The review was conducted in accordance with the PRISMA guidelines for systematic reviews [7]. (please see PRISMA checklist in Supplementary Materials).
Search strategy
We searched MEDLINE, PSYCHINFO, and EMBASE literature from July 2008–July 2018. We used a list of predetermined search terms listed in Supplementary Table 1, and also manually searched the reference lists of relevant articles.
Inclusion criteria:
Longitudinal, cross-sectional or case-control studies including genotyped data; Validated risk loci for AD identified and combined into a PRS; Reported associations with AD case/control status or another phenotype.
Exclusion criteria:
Studies reporting associations with family history only; Studies reporting on genetic risk for other conditions or loci that have not been previously shown to increase risk of AD; Studies reporting the effect of only one locus or gene (e.g., APOE), or APOE combined with non-genetic risk factors; Non-English publications in the absence of resources to translate, or an existing translation.
Article selection
All articles selected for inclusion were original research reports written in English. The design of the studies was cross-sectional, longitudinal or observational. The initial search was conducted by NM. Based on the eligibility criteria, two reviewers (JH and SM) independently selected studies. Any discrepancies were resolved by a third reviewer (VEP).
Data extraction
The reviewers (JH and SM) extracted data from the studies independently and in duplicate. The extracts included: 1) the type of study, 2) the discovery sample (study name, sample size and number of cases), 3) the target sample (study name, sample size, and case number); and 4) the number of SNPs included in the PRS (see data extraction form in Supplementary Material). Results that were reported in separate papers were only included once.
RESULTS
Search results
The initial search produced 4,717 articles (see PRISMA flow chart in Fig. 1). 1,322 were removed as duplicates. A further 3,275 were excluded based on their title and abstract. The reviewers (JH and SM) reviewed the full text of the remaining 120 articles and applied strict inclusion criteria, excluding a further 63. 57 articles were eligible for inclusion.
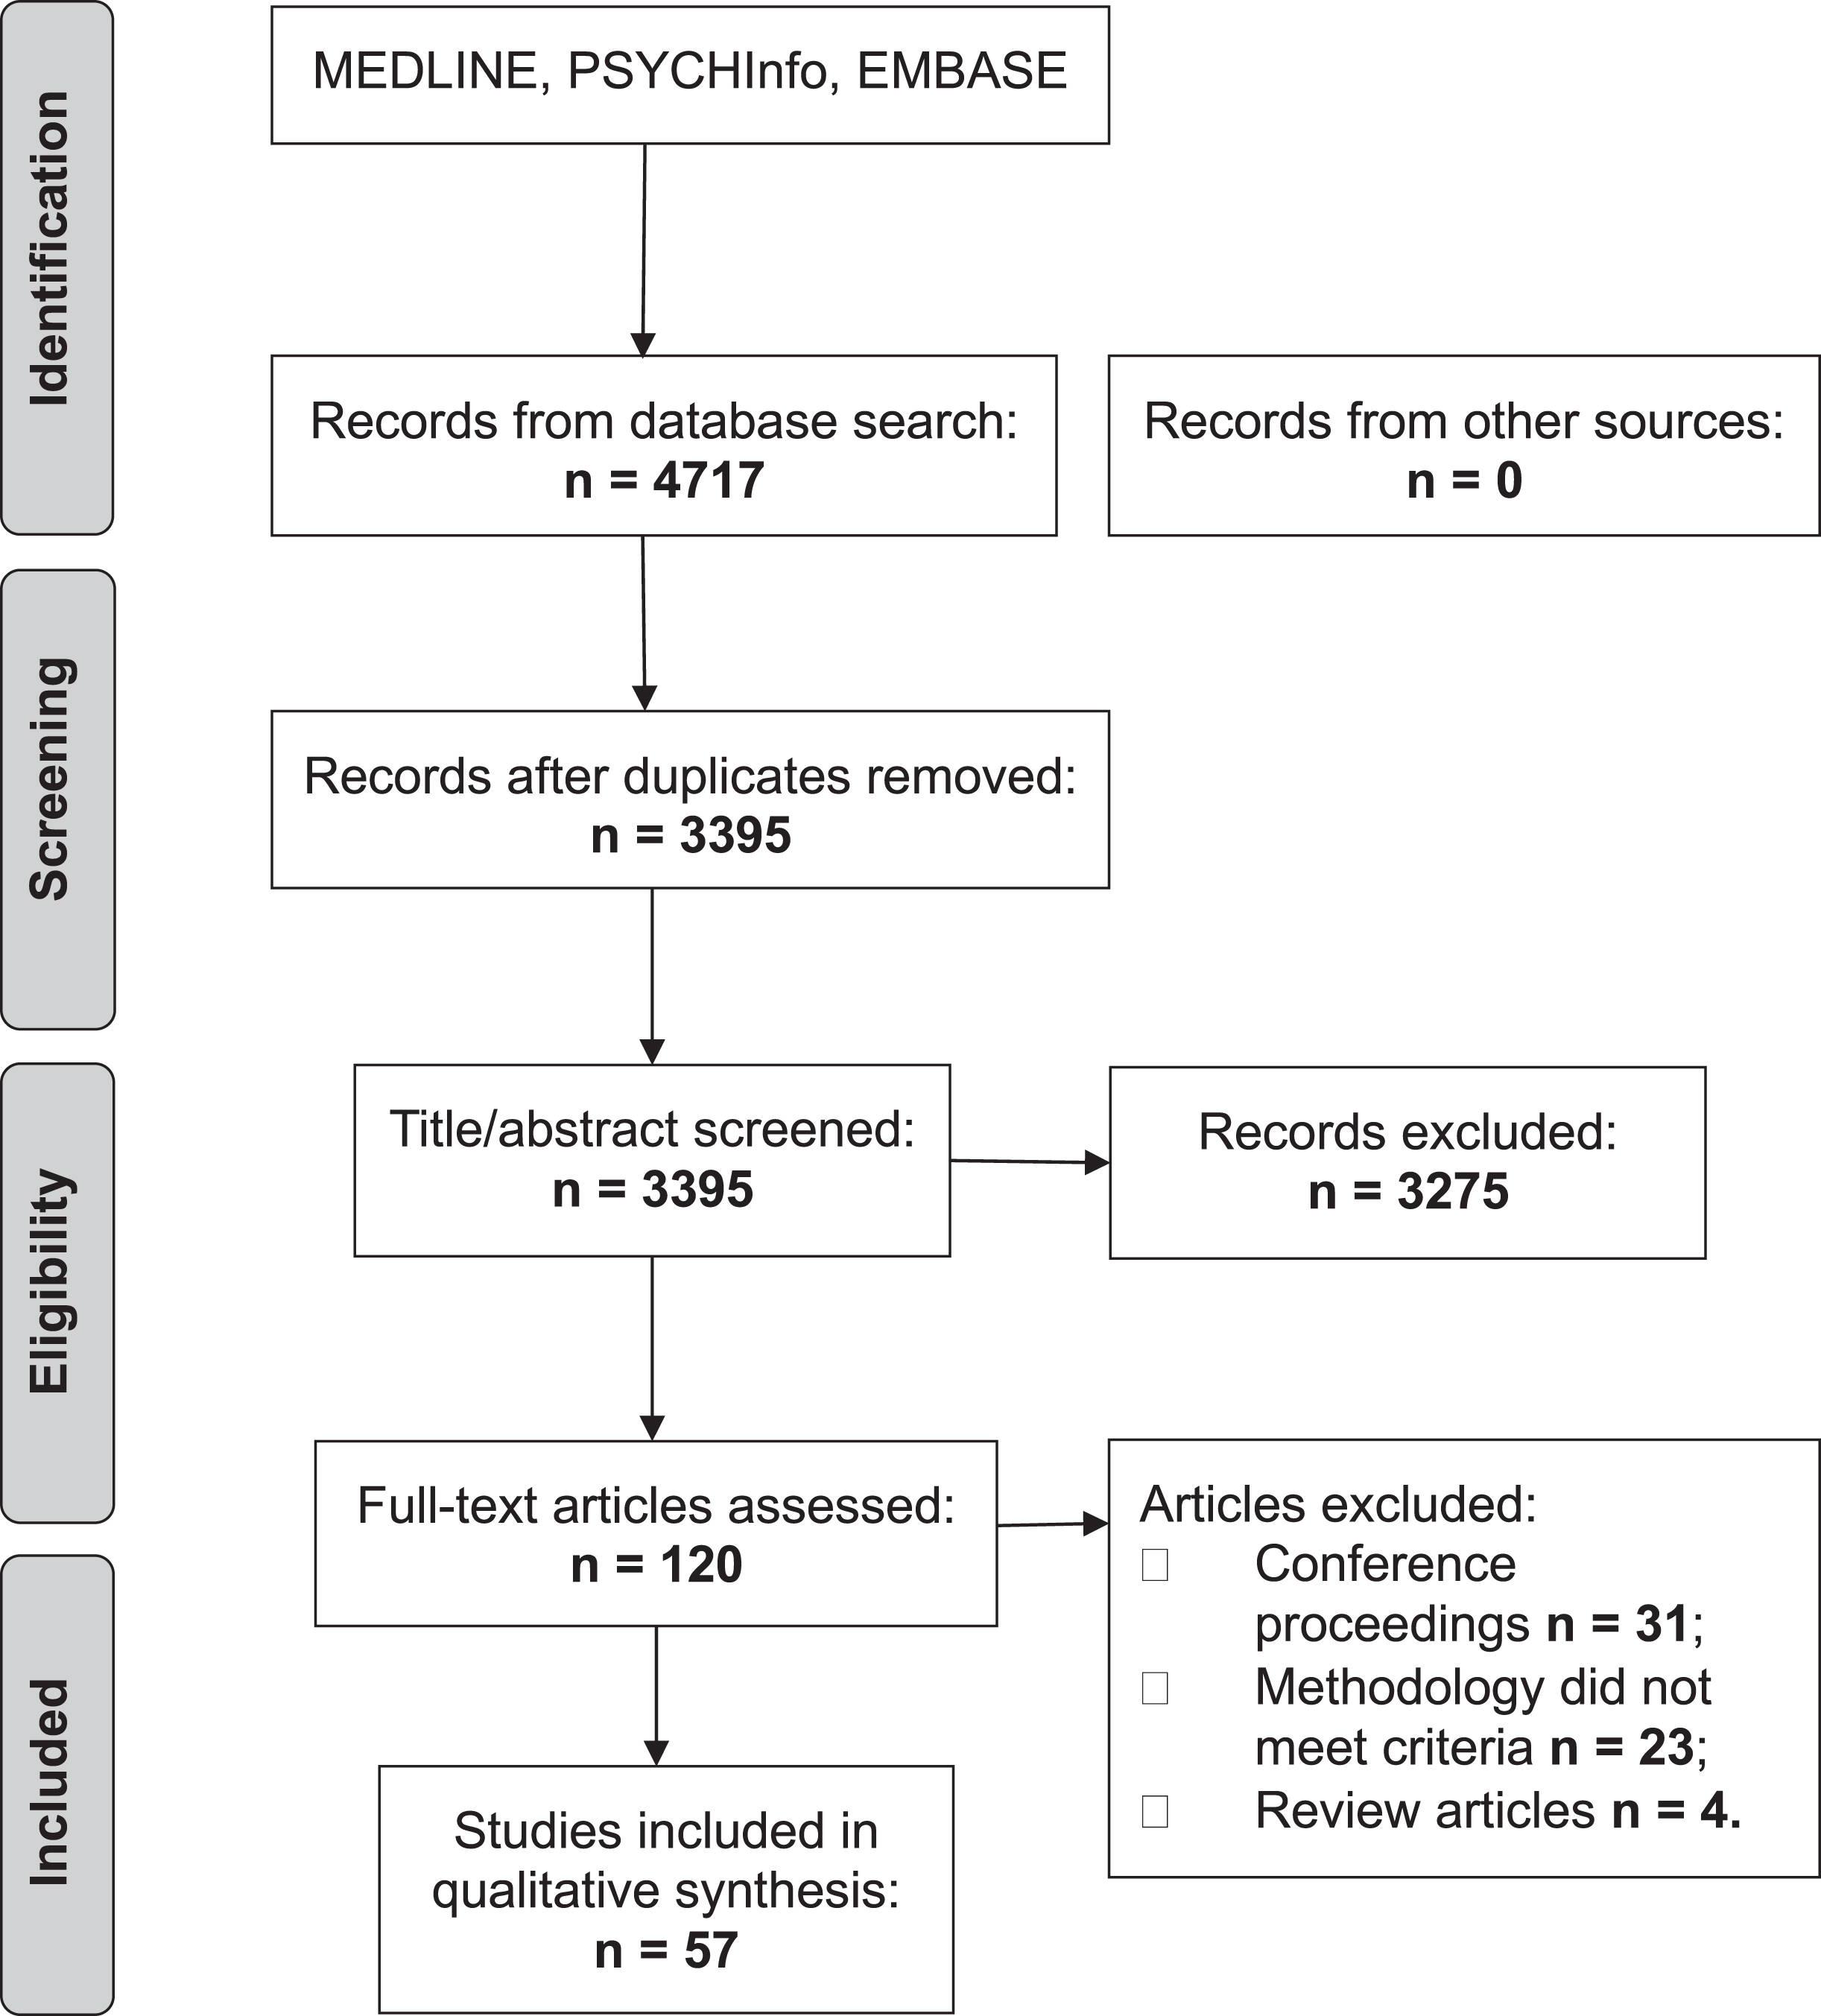
PRISMA flow chart.
There was only one disagreement between raters which was resolved by a third reviewer (VEP).
Study characteristics
There was a variety of study designs. Most were case-control studies, comparing those with AD or mild cognitive impairment (MCI) to healthy controls [4, 8–29]. Others were cross-sectional [20, 30–58] and some were longitudinal [59–64]. The majority included participants of European ancestry from Europe, the US or Australia, although some included Black African American [39, 45], Hispanic [5, 40], Caribbean [5], or Han Chinese participants [13, 57]. Sample size ranged from 66 [65] to over one hundred thousand [47]. The articles examined associations with several phenotypes. See Table 1 for a summary of study characteristics.
Summary of included studies by type of PRS
AD, Alzheimer’s disease; MCI, mild cognitive impairment; MRI, magnetic resonance imaging; CSF, cerebrospinal fluid; GWAS, genome-wide association study.
PRS calculation
All studies computed PRS using SNPs that have been associated with AD in large meta-analyses. Most used the International Genomics of Alzheimer’s Project (IGAP) [66] or another recent GWAS. There were two approaches to identifying SNPs for inclusion: 1) selecting SNPs that reached genome-wide significance in meta-analysis, or 2) using p-value thresholds, including a greater number of nominally associated SNPs (please see Supplementary Tables 3 and 4 for a summary of PRS calculation). The number of studies using each approach is outlined in Table 1. Two of the studies in Han Chinese populations choose to verify that the SNPs were associated with AD in their population before computing PRS [13, 22]. Most studies weighted PRS by effect size, specifically the logarithm of the odds ratio or beta-coefficient from the regression analysis model, as described by Purcell and colleagues [67]. There were five exceptions: one study weighted by explained variance [37]; four studies created unweighted scores by summing the number of risk loci [27, 68]. APOE was either included as a co-variate, included in the PRS or excluded (see Supplementary Tables 3 and 4).
Prediction of AD case/control status
15 studies used PRS to predict AD case/control status with various statistical approaches. Some studies used the area under the receiver operating characteristic (ROC) curve, whereas others used time-to-event analysis, odds ratios (OR), or a combination of methods. All found that PRS was able to discriminate cases from controls, although prediction accuracy varied.
Of those studies reporting area under the curve (AUC), five included APOE and achieved AUC ranging from 0.62–0.84 [12, 69]. Four studies excluded APOE and achieved AUC ranging from 0.57–0.75 [5, 30]. Of those studies using time-to-event analysis, all four excluded APOE and reported hazard ratios (HR) ranging from 1.11–2.36 [23, 70]. Of those studies using ORs, two included APOE in their PRS and reported OR ranging from 2.06–2.32 [12, 34]. Four studies excluded APOE and reported OR ranging from 1.14–2.85 [5, 71]. For more detailed information including the details of the samples and outcome measures used by each study, please see Supplementary Tables 3 and 4.
Mild cognitive impairment to AD conversion
Eight studies assessed the ability of PRS to predict MCI to AD conversion. Three studies did not report statistically significant results [11, 37]. Rodriguez-Rodriguez et al. compared those in the 1st and 3rd tertile of PRS (OR: 1.32, 95% CI: 0.57–3.06). Neither of the hazard models used by Lacour et al. and Andrews et al. produced significant results (Lacour HR: 1.18, 95% CI: 0.37–2.0; Andrews HR: 1.05, 95% CI: 0.86–1.29) [29, 37]. However, Andrews et al found their PRS was associated with an increased risk of transitioning from normal cognition to dementia (HR = 4.19, 95% CI: 1.72–10.20) [37]. Five studies did report statistically significant results [18, 64]. However, when APOE was removed, only one study remained positive [58]. An additional study evaluated genetic contributors to the Diagnostic and Statistical Manual IV (DSM-IV) diagnosis of Cognitive Impairment, No Dementia, which is similar to MCI. They found no significant difference in the frequency of risk alleles between cases and controls (p = 0.710) [27].
Cognitive measures
Cognition and PRS were examined in 21 studies [11, 68]. While a variety of cognitive measures were used, all but four studies reported some significant associations with PRS. Most studies were in healthy older adults, although two studies included participants with established AD/MCI [11, 26], two studies had young adult participants [51, 57], one study had adolescent participants [40] and one included longitudinal data from children aged 11 [59]. There were some cross-sectional studies that only reported associations with AD polygenic risk and cognition at one timepoint [40, 68], whereas longitudinal studies were able to report the correlations with change in cognition over time [11, 62–64]. As expected, most studies reported that the effects attenuated or were no longer significant when APOE was excluded from the PRS. Please see Supplementary Tables 3 and 4 for full details of cohorts and measures used.
MRI phenotypes
12 studies explored correlations between AD PRS and MRI phenotypes. Most studies looked at subcortical volumes [13, 51]. Some also explored cortical thickness [34, 56], white matter metrics [51], and functional MRI [13]. One study used algorithms that assess spatial atrophy patterns in AD [43]. Most studies sampled healthy older adults, although some included younger adults [51, 57], adolescents [40], or a range of age groups [30]. Some studies included some participants with MCI or AD [13, 33] and one study sampled military veterans with head injuries [56].
Of the six studies that explored subcortical volumes, all reported significant negative correlations between PRS and hippocampal volume [30, 72]. Hohman et al. only found a significant association in participants who were negative for amyloid on PET [28]. Lupton et al. reported a significant negative association with amygdala volume [30] but only in participants with diagnoses of MCI or AD. Habes et al. trained an algorithm to detect the spatial patterns of healthy brain aging and atrophy in AD. They found a significant association AD PRS and the spatial pattern AD atrophy [43].
Of those studies looking at cortical thickness [34, 61], all but one [61] reported significant associations between increased PRS and cortical thinning. Studies either reported associations with cortical thinning across multiple regions that are susceptible to AD pathology [34, 56], or with cortical thinning is specific regions such as the precuneus [57].
Foley et al. assessed white matter, and identified reduced fractional anisotropy in the right cingulum with increasing PRS [51]. Su et al. explored changes in the default mode network and reported changes in functional connectivity in the left medial temporal gyrus and the right hippocampal/parahippocampal gyrus in those with MCI. However, there were no significant associations in healthy controls [13].
Amyloid and tau biomarkers
Nine studies explored associations between PRS and amyloid and tau biomarkers [8–10, 60]. They were all case/control studies. One study sampled those with autosomal dominant and sporadic AD [25]. Another included participants with normal pressure hydrocephalus [8]. The phenotypes included: cerebrospinal fluid (CSF) amyloid and tau measures [10, 49]; postmortem biomarkers or histology [8, 35]; amyloid PET [33, 35].
A variety of analysis approaches were taken. Some studies assessed each tau and amyloid biomarker independently [9, 10], whereas others created composite variables using CSF, PET, or histology biomarkers [21, 49].
There were significant associations reported between AD PRS and the following: increased CSF tau and phosphorylated tau [9]; CSF Aβ [10]; lower Aβ42/Aβ40 [49]; higher t-tau/Aβ42 and higher p-tau/Aβ42 ratio [25, 49]; positive Aβ PET [33]; total PET/CSF amyloid load and tau load [35]; postmortem soluble Aβ42 and λ-secretase activity [10]; postmortem amyloid plaques and neurofibrillary tangles [60]. Some studies did not report significant associations between AD PRS and CSF tau [10, 33] or CSF Aβ [9, 33]. There was also no association with microglial density on postmortem histology [60] or amyloid deposition in brain biopsies of normal pressure hydrocephalus patients [8]. Voyle et al. combined CSF biomarkers with PRS to predict AD, but the PRS did not improve prediction over and above the CSF amyloid and tau [21].
Other diseases and syndromes
Other studies have explored associations between AD PRS and other disorders or syndromes. Pilling and colleagues reported significant negative correlations with longevity [47], and red cell volume, a measure of anemia [48]. However there were no significant associations reported with depression [53] or post-concussive syndrome [20].
Disease pathways
Four studies explored patterns associations between AD pathway PRS and disease-related phenotypes. Each study used sets of SNPs based on previous pathway analyses in AD [6, 73]. Some used only Bonferroni-significant loci [23, 42], whereas others used a threshold-based PRS [32]. Various phenotypes were assessed including: MCI risk [23], MRI phenotypes [23, 41], cognition [42], CSF Aβ and tau [42], Aβ PET [42], and complement markers [32].
Using PRS for the immune response, endocytosis, cholesterol transport, hematopoietic cell lineage, protein ubiquitination, hemostasis, clathrin/AP2 adaptor complex, and protein folding pathway, Ahmad et al. reported the immune response and clathrin/AP2 adaptor complex pathways showed nominal associations with white matter lesions, but this did not withstand correction for multiple testing. The endocytosis risk score was significantly associated with risk of MCI [23]. Darst et al. used PRS for Aβ clearance, cholesterol metabolism, and the immune response. They found no association between cognition and any PRS, even when APOE was included [42]. A higher Aβ clearance PRS and cholesterol PRS was associated with lower CSF Aβ42, a narrower Aβ42/Aβ40 ratio, and greater Aβ PET deposition. With APOE excluded, the only significant associations were between the cholesterol PRS and CSF Aβ42/Aβ40 and the immune response PRS and CSF tau, though not when corrected for multiple comparisons [42].
Two studies focused on the immune response PRS. Corlier et al. found that the immune response PRS was significantly associated with an overall measure of cortical thinning [41]. Morgan et al reported that clusterin, C1 inhibitor, and C-reactive protein all showed nominal association with the inflammation-specific PRS. Plasma clusterin levels were associated with the overall AD PRS [32].
Study quality
Overall, the articles had clear research questions and used adequate methodology. Some studies used small sample sizes [32, 65] and many studies failed to describe sample ascertainment clearly. They used standard outcome measures. Of those looking at AD prediction, all but two [14, 22] reporting using NINDS-ADRDA diagnostic criteria for AD. Most studies weighted PRS by effect size or odds ratio, although in some studies this was not clearly described [14, 22]. Some studies had some overlap between training and validation datasets which may have inflated their results. Most studies attempted to assess the contribution of APOE by either excluding it from the PRS or including it as a co-variate. Some studies included cohorts of non-European ancestry [5, 45]. These studies acknowledged that: 1) they may have had insufficient power in their non-European samples or 2) PRS based on GWAS conducted in European populations may not capture AD genetic risk among those of non-European descent.
DISCUSSION
This paper systematically reviews how AD PRS are associated with a range of phenotypes and outcomes. Other papers have covered PRS methodology [3] and some have reviewed the use of PRS in AD prediction alone [74].
Since the advent of large-scale genetics consortia such as the International Genomics of Alzheimer’s Project (IGAP), our understanding of the genetic underpinnings of AD has rapidly expanded. GWAS have resulted in the identification of over 20 novel genetic risk loci in addition to APOE ɛ4 [2, 66]. Most of these SNPs only increase AD risk incrementally. Therefore, combining SNPs into PRS has proved an important strategy for studying their effects. Some of the studies included in this review used only the most significant loci in their PRS. However, more recent studies used liberal threshold-based PRS computed from thousands of AD risk loci.
PRS in disease prediction
AD PRS have demonstrated strong predictive ability. Conservative PRS, including only genome-wide significant SNPs, have achieved reasonable prediction accuracy (AUC range: 57–72%) [4, 69]. Threshold-based PRS, including many more SNPs, have proved superior to both conservative PRS and to APOE alone (AUC 75%) [4]. Prediction accuracy is even greater using a threshold-based PRS in histologically confirmed cases and controls (AUC 84%) [17]. The findings for MCI conversion prediction are more mixed. Of the three studies reporting negative results, two had relatively low power [11, 29]. Almost all the studies exploring PRS prediction accuracy report that there is some overlap between cases and controls at high polygenic risk. Moreover, in the absence of therapeutic consequences, the clinical utility of these findings remains limited.
Associations between AD PRS, phenotypes, and biomarkers
Overall, the evidence from cross-sectional, case-control and longitudinal cohort studies pointed towards an association between PRS and a range of AD-related phenotypes. Of these, cognition has been the most widely investigated. While the methodology and samples were diverse, the vast majority of studies reported significant associations [11, 69]. Of the negative studies, one used a threshold-based PRS [59] and another used a PRS including 15 Bonferroni-significant risk SNPs [39] but both excluded APOE entirely. The other two negative studies both used samples of young adults [51, 57], suggesting that cognitive changes related to AD genetic risk may not manifest until later in life.
There was consistent evidence to support an association between AD PRS and changes in brain structure, particularly in decreased hippocampal volume [30, 72] and reduced cortical thickness [34, 61]. This was reported even in samples of young adults [40, 51], suggesting that AD risk may manifest in brain structure decades before the onset of disease. These studies provide also found that the threshold based PRS yielded better results. For example, Mormino et al. found an association between a threshold PRS and hippocampal volume that was not present when only genome-wide significant SNPs were used [33].
There were mixed findings for amyloid and tau biomarkers. Of those studies exploring CSF, PET, or histology biomarkers, all but one reported statistically significant associations. However, findings were not consistent across biomarkers. For example, one study reported an association between CSF tau and phosphorylated tau but not Aβ [9], whereas another study found the reverse [10]. Another study reported a significant association with Aβ PET but not with CSF Aβ or tau [33]. However, studies with postmortem samples did find evidence of association between AD PRS and soluble Aβ42 levels, λ-secretase activity [10], neuritic amyloid plaques and neurofibrillary tangles [60]. PRS for other neuropsychiatric disorders were not associated [60]. Moreover, AD PRS was not associated with amyloid accumulation in normal pressure hydrocephalus [8]. This suggests that the genetic foundations of amyloid deposition in other conditions may be distinct from those in AD. In addition, there was no evidence for pleiotropy between AD and depression [53].
PRS in disease pathways
GWAS have resulted in the identification of novel genetic risk loci in addition to APOE ɛ4,[2, 66] which have been associated with a range of biological pathways including lipid metabolism, immune response, and synaptic processes [6, 73]. AD is heterogeneous and multifactorial. Polygenic profiling can allow individual molecular sub-classification, by identifying the pathways enriched for risk alleles for an individual. Four of the most recent studies included in this review took this approach, suggesting that the field is moving in this direction. They found some evidence for association between pathway-specific polygenic scores and MCI risk [23], cognition [42], brain structure [23, 41], CSF biomarkers [42], Aβ PET [42], and serum complement markers [32]. The variance that each of these pathways explains is small [42]. This will probably increase as discovery sample sizes increase [75], but will be restricted as PRS do not capture the contributions of copy number variant or rare SNPs.
Pathway-specific polygenic profiling could enable personalized treatment of each individual with AD. This could allow entrants to clinical trials and biomarker studies to be stratified based on evidence of involvement of specific disease pathways. Moreover, if polygenic risk profiles can give prognostic information, they may aid decision making for individuals and clinicians. For example, a high PRS has been associated with a more accelerated progression from MCI to AD [11].
Strengths and limitations
We used a systematic and comprehensive search strategy to avoid missing eligible studies. However, we were not able to include studies that were not in English-language journals. Another strength is that articles were not limited to a particular sampling framework or research design (e.g., longitudinal studies or clinical samples), or to European ancestry samples. We also included studies investigating broad ranges of outcomes which enhanced our ability to assess how AD polygenic risk is manifest. However, results were not reported consistently across studies, meaning only a narrative review was feasible, and we were not able to assess for publication bias.
We identified a number of limitations in the studies included in this review. In order to conduct a polygenic score analysis, two completely independent datasets are required. Any overlap in the datasets will inflate the associations found. Some studies appeared to use sub-samples of the discovery sample as target samples and not all attempted to account for this. A number of studies used small sample sizes. Authors often did not provide a clear description of sample ascertainment, making it harder to put their findings into the context of the wider literature. Standardized effect estimates or confidence intervals were also often omitted, which are required to compare effect sizes across studies. We have previously proposed a reporting framework for studies which might assist future researchers who synthesize data across such studies [76].
Some studies explored similar phenotypes in comparable samples but reported different results. Heterogeneity may stem from the PRS or the study design. Regarding the PRS, the exact list of SNPs is likely to differ between studies. Some researchers selected SNPs that reached genome-wide significance, and others used a p-value threshold approach, a key distinction. With threshold based PRS, experimenters exclude SNPs with low imputation quality scores. These vary depending on the array, imputation platform and pre- and post-imputation quality control steps. In addition, even small differences in population genetics may lead to distinctive linkage disequilibrium (LD) structure and allele frequencies [77]. Pruning, an essential part of PRS calculation, relies on LD structure to retain SNPs that are most associated with a trait while removing others that are closely linked. Where LD structure diverges, alternative SNPs will be selected. Furthermore, in disease pathway PRS, the gene sets are determined by the databases used to define the pathways. Regarding study design, there are other potential causes of heterogeneity. There may be discrepancies in how phenotypes are defined or measured, and different approaches to data analysis. Finally, there are possible sources of bias. For example, disease prediction studies using PRS can be affected by selection bias. If the target dataset is enriched for AD or MCI cases, this will affect the prediction accuracy.
Conclusions
PRS approach is an important approach used for capturing the contribution of genome wide common variation of complex diseases. To the best of our knowledge, this is the first review attempting to collate information on how the use of the PRS approach has informed our understanding of a variety of phenotypes associated with AD genetic risk. PRS can predict AD and are associated with cognitive impairment. There is also evidence of association between AD PRS and other phenotypes relevant to neurodegeneration. The associations between pathway specific PRS and phenotypic changes may allow us to define the biology of the disease in individuals, heralding precision medicine in AD. However, longitudinal cohort studies are required to test the ability of PRS to delineate pathway-specific disease activity. In the absence of therapeutic consequences, the clinical utility of PRS is limited.
Footnotes
ACKNOWLEDGMENTS
JH was funded by the Wellcome Trust GW4-Clinical Academic Training Scheme. SM was funded by Mental Health Research UK. VEP was funded by the DRI (UKDRI-3003), DPUK (MR/L023784/2), MRC Centre for Neuropsychiatric Genetics and Genomics (MR/L010305). We thank Dr. Judith Allardyce for her comments on this manuscript.