
Abstract
Background:
Despite decades of research on the optimization of the diagnosis of Alzheimer’s disease (AD), its biomarker-based diagnosis is being hampered by the lack of comparability of raw biomarker data. In order to overcome this limitation, the Erlangen Score (ES), among other approaches, was set up as a diagnostic-relevant interpretation algorithm.
Objective:
To validate the ES algorithm in a cohort of neuropathologically confirmed cases with AD (n = 106) and non-AD dementia (n = 57).
Methods:
Cerebrospinal fluid (CSF) biomarker concentrations of Aβ1-42, T-tau, and P-tau181 were measured with commercially available single analyte ELISA kits. Based on these biomarkers, ES was calculated as previously reported.
Results:
This algorithm proved to categorize AD in different degrees of likelihood, ranging from neurochemically “normal”, “improbably having AD”, “possibly having AD”, to “probably having AD”, with a diagnostic accuracy of 74% using the neuropathology as a reference.
Conclusion:
The ability of the ES to overcome the high variability of raw CSF biomarker data may provide a useful diagnostic tool for comparing neurochemical diagnoses between different labs or methods used.
Keywords
INTRODUCTION
Alzheimer’s disease (AD) is one of the most frequently occurring neurodegenerative disorders in the Western population and decades of research on the optimization of AD diagnosis has led to the discovery of a validated cerebrospinal fluid (CSF) biomarker profile that reflects the presence of AD pathology in the brain [1, 2]. This biomarker profile is characterized by lowered CSF levels of amyloid-β peptide of 42 amino acids (Aβ1-42) in combination with elevated levels of total tau-protein (T-tau) and/or tau-protein phosphorylated at threonine 181 (P-tau181) as described in the IWG-2 criteria and is being used in clinical work-up as well as for research purposes [3, 4]. Although these biomarkers demonstrate sensitivities and specificities of 100% and 91%, respectively, for confirmation of AD against healthy controls, sensitivity and specificity values still only reach the 80% threshold to differentiate AD against other neurodegenerative disorders (80% and 93%) [1, 5]. The optimization of the stratification of patient populations would benefit the success rate of clinical trials with potential disease-modifying drugs against AD.
However, further improvement of the biomarker-based diagnosis of AD is being hampered by the lack of comparability of raw biomarker data [6]. These raw data are subjected to interlaboratory variances due to a lack in standardization of sample collection, handling and storage protocols, and due to laboratory-specific cutoff values or different laboratory platforms used [7 –11]. This has already been partially addressed by providing standard operating procedures for pre-analytical sample handling [12] as well as recommendations for analytical processes to improve standardization [13 –15]. Despite these steps, and provided the ongoing evolution in biomarker research, currently used methods and platforms may be modified. Therefore, much could still be gained by introducing a diagnostic-relevant interpretation algorithm for raw biomarker data.
Accordingly, the Erlangen Score (ES) was set up and previously validated across different patient cohorts, different pre-analytical operating procedures and different analytical platforms as an algorithm to standardize and improve the biomarker-based diagnosis of AD [16, 17]. In order to further validate the diagnostic utility of this algorithm for its use in differential AD diagnosis, this study with a neuropathologically confirmed cohort of AD and non-AD dementia patients was set up.
METHODS
Study population
The study cohort consists of 106 patients with a definite diagnosis of AD, either with concomitant but minor non-AD pathology or AD pathology in pure forms, and 57 patients with a definite diagnosis of non-AD, all confirmed by postmortem neuropathological examination. Non-AD is defined as clinical dementia with a pathological diagnosis not attributed to AD, meanwhile excluding concomitant AD pathology, consisting of definite frontotemporal lobar degeneration (FTLD; n = 28), vascular dementia (n = 13), Lewy body disease (LBD; n = 8), corticobasal degeneration (CBD; n = 1), or other including hippocampal sclerosis, arteriosclerosis, cerebral amyloid angiopathy, and cases without specific neuropathological findings (n = 7). Definite diagnosis was attained by neuropathological examination of the right hemisphere of the brain, performed at the Institute Born-Bunge (Antwerp, Belgium) by two neuropathologists (JJM and AS). Definite AD was diagnosed based on AD neuropathological changes scored using the Montine criteria [18], whereas definite LBD was evaluated using the McKeith classification [19]. Definite vascular disease was rated using the Deramecourt criteria [20]. Definite diagnosis of FTLD was established through the criteria of Cairns [21] and Mackenzie [22, 23]. A definite diagnosis of CBD was confirmed by visual assessment of pathological hallmarks of CBD [24].
The study was conducted according to the revised Declaration of Helsinki and good clinical practice guidelines. This study was approved by the ethics committee of UAntwerp, Antwerp, Belgium (B300201420406). Informed consent was obtained from all subjects.
CSF sampling and analysis
All CSF samples were obtained following standard collection protocols as previously described [4]. CSF was collected by lumbar puncture (LP) at the L3/L4 or L4/L5 interspace [12] into polypropylene vials. Samples were either frozen immediately and shipped on dry ice to the BIODEM lab or shipped unfrozen within 24 h after the puncture. Samples were stored at –80°C until analysis.
CSF biomarker concentrations of Aβ1-42, T-tau, and P-tau181 were measured with commercially available single analyte ELISA kits (INNOTEST® β-Amyloid(1-42), INNOTEST® hTau-Ag, and INNOTEST® PhosphoTau(181P), respectively; Fujirebio Europe, Ghent, Belgium) following manufacturer’s instructions as previously described [1]. The concentration ranges of the test kits, determined as the highest and lowest calibrator concentration, are described in the package inserts (Aβ1-42: 125–2000 pg/mL, T-tau: 75–1200 pg/mL, P-tau181: 15.6–500 pg/mL). Interpretation of the biomarker levels was based on cutoffs previously determined in a cohort of autopsy-confirmed AD patients and cognitively healthy elderly [25]. Levels of Aβ1-42 < 638.5 pg/ml, T-tau > 296.5 pg/ml, and P-tau181 > 56.5 pg/ml were defined as abnormal.
Erlangen score
The ES was proposed as an algorithm taking into account the core CSF biomarkers, as previously described [16]. The ES suggests a classification into four diagnostic groups. Depending on the pattern of the biomarker alterations, the CSF results of a given patient are scored between 0 and 4 points (Fig. 1). A CSF result with all biomarkers normal is scored 0 points; a pattern with marginal alterations in one biomarkers group (either Aβ or Tau, but not both) results in the score of 1; a CSF result with the alterations in either Aβ metabolism (decreased Aβ1-42 concentration or Aβ1-42/Aβ1 - 40 ratio) or tau metabolism (increased concentrations of T-tau and/or P-tau181) but not both is scored 2 points; a result with clear alterations in one biomarkers’ group (either Aβ or Tau) accompanied by marginal alterations in the other group is scored 3 points; clear alterations in both Aβ and T-tau/P-tau181 result in 4 points.
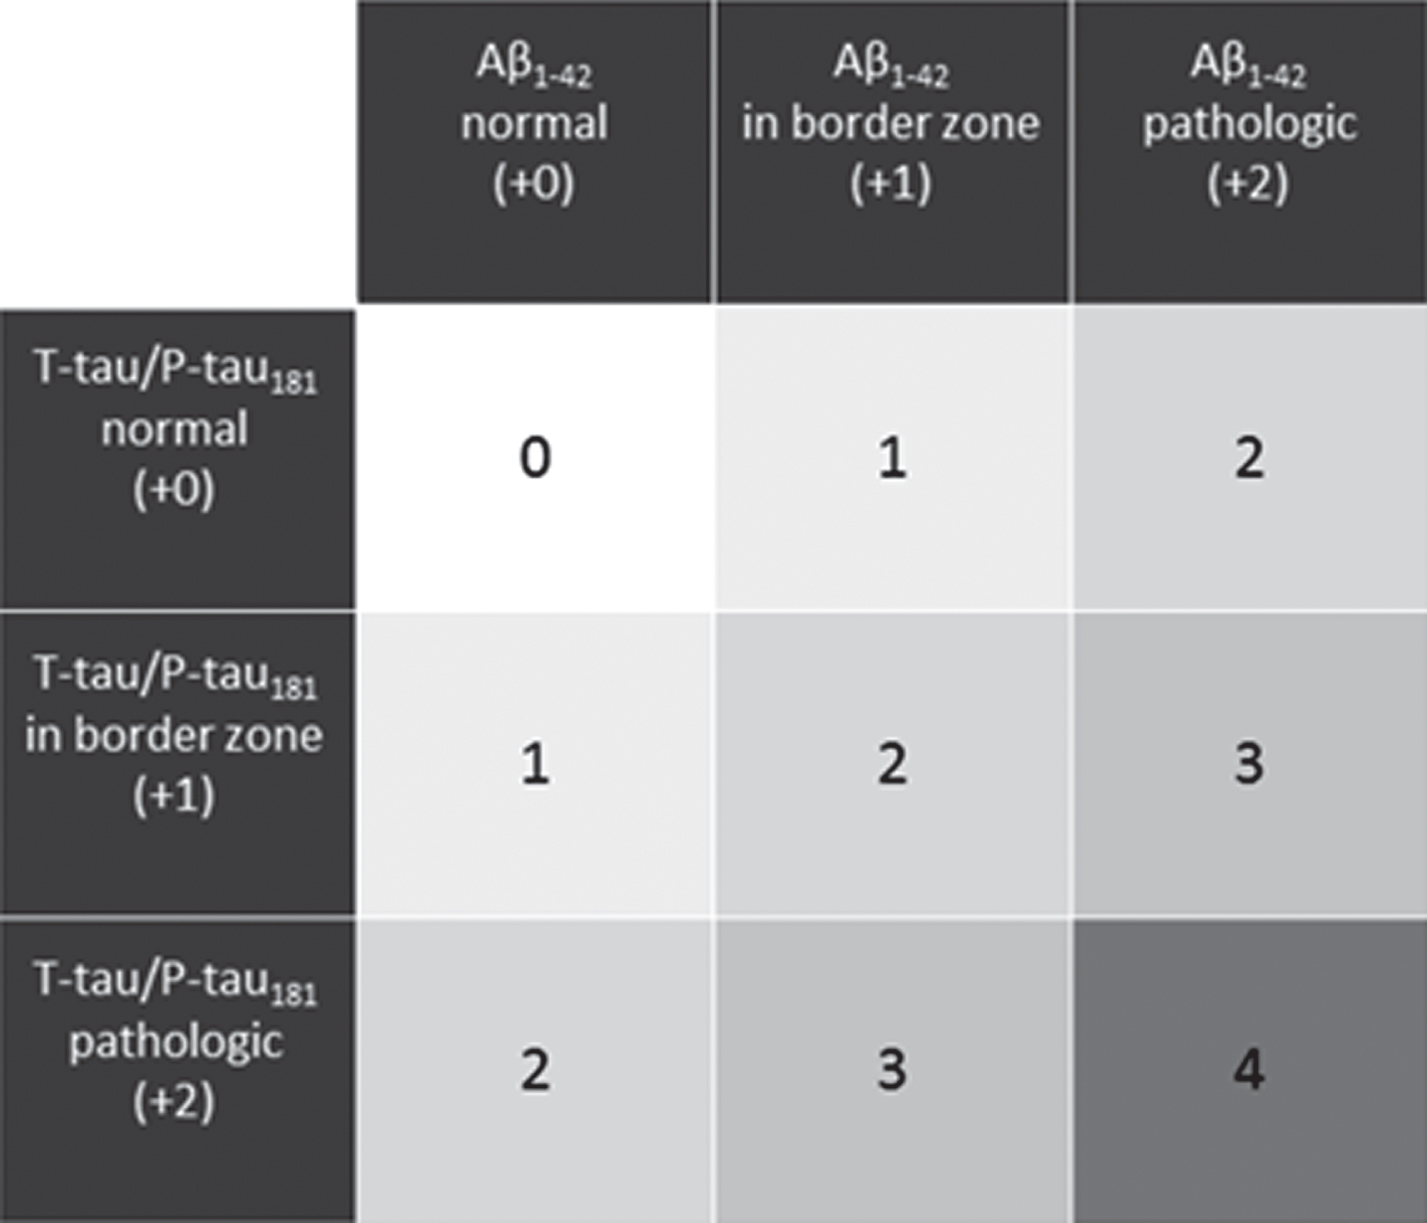
ES classification pattern based on the CSF biomarker alterations. Points appointed to each biomarker alteration is given between brackets.
Statistical analysis
Descriptive statistics on all data were performed using SPSS of IBM Statistics, version 24, with significance level defined as p < 0.05. In spite of an adequate sample size, non-parametric testing was selected as the variances across the groups was heteroscedastic. Demographic data and biomarker concentrations were compared between the groups with Mann-Whitney test. To compare gender and APOE genotype distributions, Chi-square test was performed. Logistic regression was then used to model the probability of having AD pathology at the postmortem examination as a function of the ES, whereupon the score was recoded, due to the small number of observations in some categories, into: neurochemically improbable AD (ES = 0 or 1, the reference category), neurochemically possible AD (ER = 2 or 3), or neurochemically probable AD (ES = 4), which is in agreement with the wording in the routine laboratory report presented to clinicians. The model was fitted with maximal likelihood, adjusting for gender (with female as the reference category), age, and the time between the LP and death (TLPD). After having the model fitted, marginal probabilities, odds ratios to have AD-pathology on neuropathological examination, and the ROC curve were post-estimated. Statistical modelling was performed with Stata 14.2 (StataCorp, College Station, TX, USA).
RESULTS
All demographic data and biomarker concentrations are summarized in Table 1. Patient groups differed in age at LP (p < 0.001), but not in gender distribution (p = 0.156) or TLPD (p = 0.083). All biomarkers differed significantly between the groups (p < 0.001). Of the 106 definite AD patients, 69 were classified as neurochemically probable AD (ES = 4), 34 as neurochemically possible AD (ES = 2 or 3), and 3 as neurochemically improbable AD (ES = 0 or 1). On the other hand, 13 of the 57 definite non-AD patients were classified as neurochemically probable AD (ES = 4), 32 as neurochemically possible AD (ES = 2 or 3), and 12 as neurochemically improbable AD (ES = 0 or 1).
Descriptive table of demographic and biomarker data
All data are presented as median values and corresponding interquartile ranges between brackets. Significant differences between groups are marked as asignificant difference with control group, bsignificant difference with AD group, csignificant difference with Non-AD group. The level of significance was set at a p-value below 0.05 (*). Only a fraction (67%) of cases had APOE genotyping by cause of blood sample availability. AD, Alzheimer’s disease; APOE, apolipoprotein E; ES, Erlangen Score; TLPD, time between LP and death.
The logistic regression model is presented in Table 2. Compared to the reference category (ES = 0 or 1, i.e., neurochemically improbable), both categories, (ES = 2 or 3, i.e., neurochemically possible) and ES = 4 (i.e., neurochemically probable) were significant positive predictors for the probability of having AD pathology postmortem (p < 0.05 and p < 0.001, respectively). Compared to the reference category (ES = 0 or 1), the group classified as neurochemically possible AD (ES = 2 or 3) had odds 4.22 times greater to have AD pathology on the postmortem examination, and the group classified as neurochemically probable AD (ES = 4) had odds 18.6 times greater. Compared to the neurochemically possible group, the odds of the neurochemically probable group were 4.4 times greater (Fig. 2). Of the explanatory variables, only age showed significant positive effect (p < 0.001), with every year of age increasing the odds by 8%, while the effect of gender was borderline insignificant (p = 0.054), and the effect of TLPD was insignificant.
Logistic regression model of the probability to have AD-pathology on the neuropathological examination
The logistic regression model was performed as a function of the ES, gender, and TLPD. The level of significance was set at a p-value below 0.05 (*). Log likelihood = –78.72; Pseudo R2 = 0.2539; Wald χ 2(5) = 53.57, p < 0.0001. AD, Alzheimer’s disease; CI, confidence interval; ES, Erlangen Score; TLPD, time between LP and death.
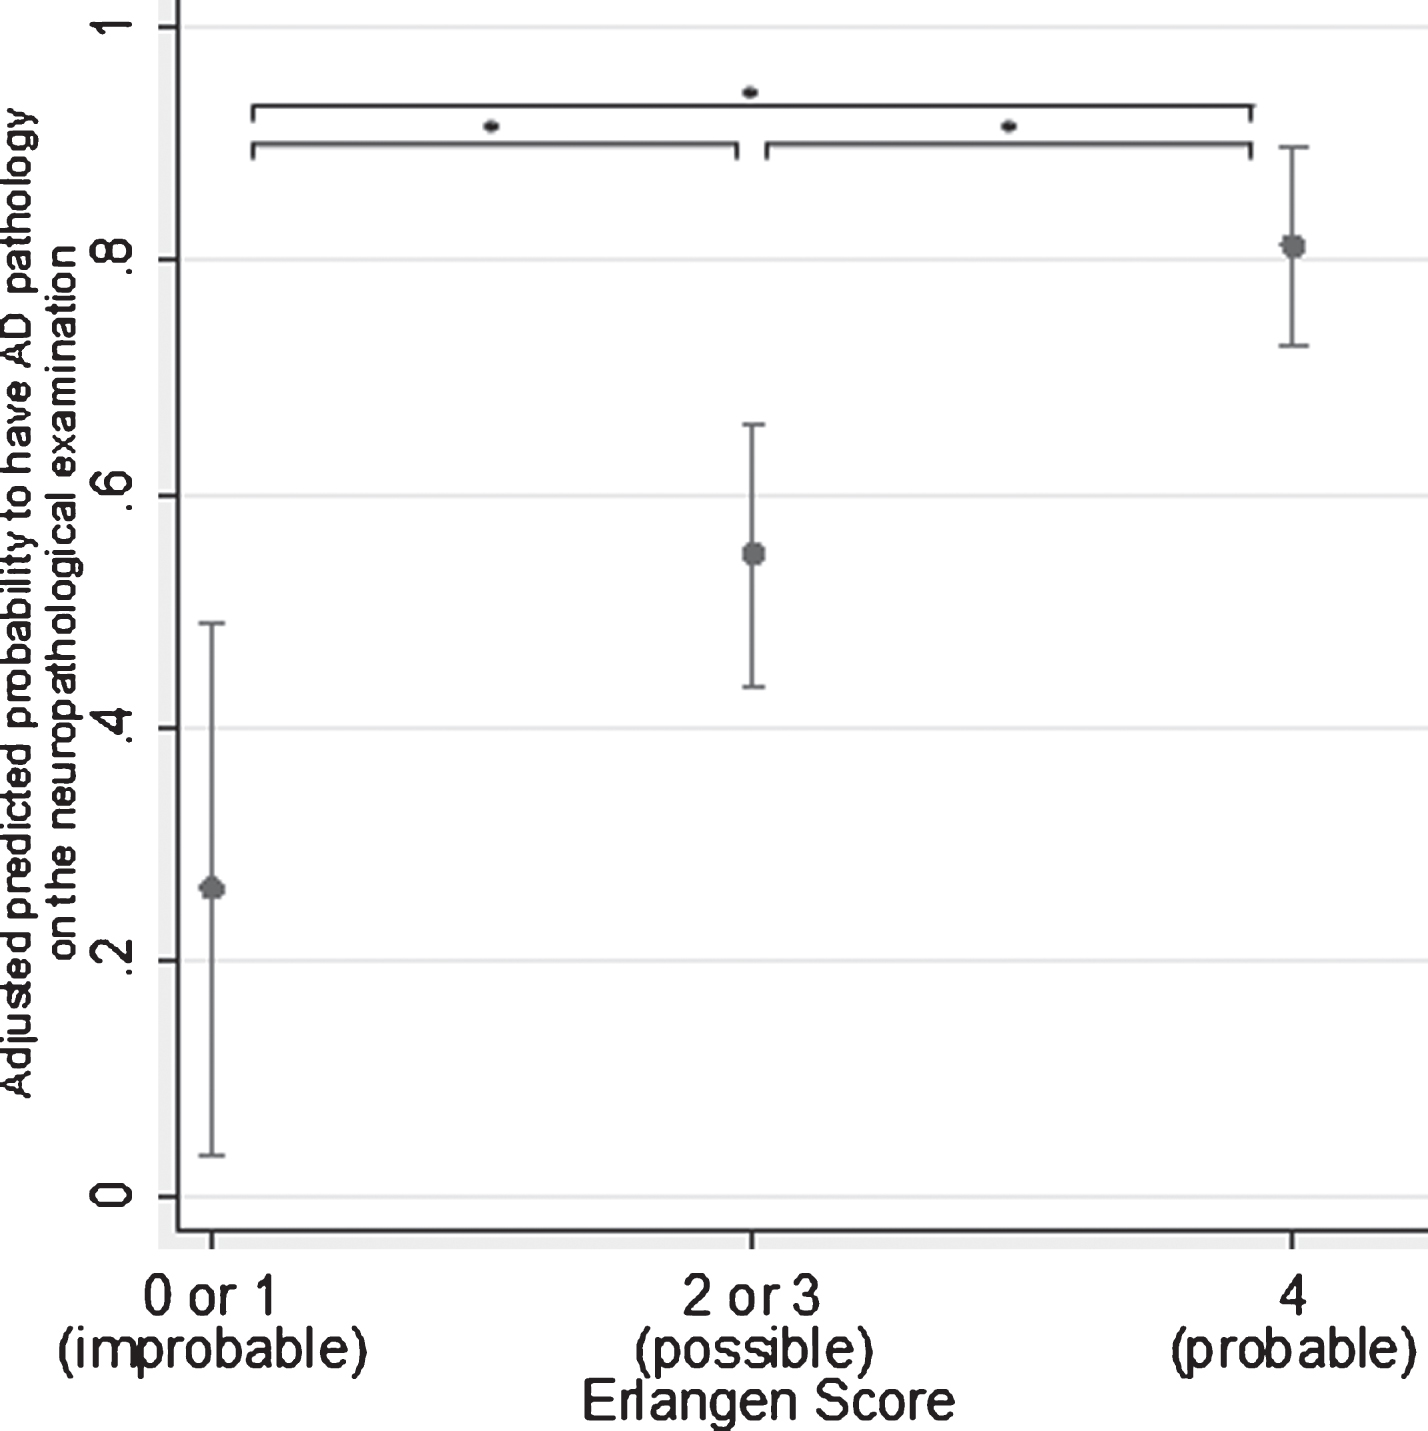
Marginal predictions of the probability to have AD pathology at the postmortem examination. Predications were made at the fixed values of the overall average of age and TLPD and the overall proportion of females across the groups. The level of significance was set at a p-value below 0.05 (*).
The ROC curve comparing the two groups, post-estimated from the above logistic model, resulted in an area under the curve (AUC) of 0.821 [95% CI: 0.750 to 0.893], which was significantly larger (p < 0.05) compared to the AUC (0.737 [95% CI: 0.656 to 0.819]) of the ROC curve, resulting from the model with ES as the sole explanatory variable.
DISCUSSION
In order to enable comparison of interpretations of AD biomarkers measurements across laboratories applying different preanalytical handling procedures, analytical methods, cut-offs or even different sets of the biomarkers, the ES interpretation algorithm was proposed in a previous study [16] and validated on two other large-scale multicenter cohorts [17]. In the current study, the ES algorithm enabled a correct prediction of the postmortem neuropathological outcome on the ground of the intra vitam CSF results of three core AD biomarkers. The probabilities to have AD pathology postmortem in contrast to non-AD pathologies including mainly FTLD, vascular dementia, and LBD increased almost linearly with increasing ES ordered categories. To this end, the results presented here are entirely in line with the previously published report showing prediction of the disease progression based on the ES outcome [17].
Less than 3% of the neuropathologically definite AD patients (3 out of 106) were categorized as neurochemically improbable AD (ES = 0 or 1). Foremost, these patients were in the earlier stages of AD pathology based on the Montine criteria (Supplementary Table 1). According to the amyloid cascade hypothesis, the prevailing theory of AD etiology, Aβ1-42 is attributed a central role as an initiator of AD pathology. This implies that Aβ1-42 is the first biomarker to change in the CSF, before changes reflecting neurofibrillary tangles and neurodegeneration (CSF P-tau181 and T-tau) can be detected [26]. Also, borderline values in the “normal” range and relative longer TLPD may have contributed to lower ES than expected. Further, it should be taken into consideration that neuropathological alterations in different areas of the brain may be reflected in the CSF to different extents, depending on their distance to the CSF space and the dynamic pathway the molecules need to diffuse to reach the CSF. Yet another potential explanation is that only Aβ1-42 was included in this study as a biomarker of amyloidosis, without considering Aβ1-42/Aβ1 - 40, which was unavailable. Therefore, it is plausible to speculate that some cases without alterations in Aβ1-42, and hence interpreted as not having amyloid-related alterations, may have turned into amyloid-positive if Aβ1-42/Aβ1 - 40 had been measured [27].
On the other hand, we observed that 23% (13 out of 57) of the definite non-AD patients, which were categorized as neurochemically probable AD (ES = 4). This, in turn, is in line with the presence of concomitant AD pathology in non-AD dementia patients, as reported previously [28 –30]. Indeed, many of the non-AD cases in this study that had an ES suggestive for AD pathological findings (n = 7), presented with AD-related neuropathological changes that may have had a higher impact than expected. Although these cases seemingly decrease diagnostic accuracy of the CSF biomarkers, and in consequence the ES, their inclusion is most representable for the general population. P-tau181 has previously demonstrated to be the most specific marker for AD, in contrast to T-tau [4 , 31], and hence it must be stressed that the current version of the ES, treating all three (or four) CSF biomarkers equally weighted, shows a considerable limitation from the point of view of specificity, favoring diagnostic sensitivity. Lack of studies on the harmonization of CSF biomarker interpretation in light of the differentiation of AD against non-AD dementias makes this study potentially interesting particularly in the scenarios where biomarker results must be compared across centers, the more so as a large cohort of neuropathologically confirmed AD and non-AD cases was included.
Despite lack of Aβ1 - 40 results in this cohort, which is probably the strongest limitation of the study, the ES proved to correctly categorize the vast majority of the patients, reconfirming its utility as an interpretation algorithm. As Aβ1 - 40 is the most abundant and stable isoform, its addition obviously further increases the diagnostic performance by eliminating the inter-individual variability of high or low content of total Aβ peptides [27 , 32–38] and correcting for other non-AD-specific subcortical changes that may alter the overall Aβ levels in the brain [39].
Other biomarker combinations have also been shown to have an accurate differential diagnostic performance for the discrimination of AD from non-AD dementia with high AUC values. Our previous study showed that the diagnostic accuracy for the differentiation of autopsy-confirmed AD from autopsy-confirmed non-AD, achieved AUC values of 0.647 for Aβ1-42 alone, 0.670 for T-tau alone, and 0.676 for P-tau181 alone, while for their ratios AUC values of 0.635 for the Aβ1-42/T-tau ratio and 0.734 for the Aβ1-42/P-tau181 ratio were obtained [4]. However, these ratios may not overcome biomarker variability as (pre-) analytical effects on both biomarkers included in such ratios may still differ [40], even when analyses are performed by automated methods that increase standardization and precision of CSF biomarker measurements [41]. The introduction of certified reference material calibrated ELISA kits may therefore provide further improvement for standardization of CSF biomarker measurements and may eventually enable the introduction of worldwide, biomarker-specific instead of center-specific cutoffs [42 –44].
Conclusion
In light of improving the differential diagnosis of AD, this validation of the ES demonstrated the categorization of AD and non-AD subjects with reasonable diagnostic accuracy. The ability of the ES to overcome the high variability of raw CSF biomarker data may provide a useful diagnostic tool for comparing neurochemical diagnosis between different labs or methods used, independently of their specific cutoffs.
Footnotes
ACKNOWLEDGMENTS
This research was funded in part by the University of Antwerp Research Fund; unrestrictive research grants from Janssen Pharmaceutica NV and ADx Neurosciences; the Institute Born-Bunge; the Flanders Impulse Program on Networks for Dementia Research (VIND); the agency of Flanders Innovation & Intrepreneurship (VLAIO, ![]() ). The research leading to these results has also received support from the Innovative Medicines Initiative Joint Undertaking under EMIF grant agreement n° 115372, resources of which are composed of financial contribution from the European Union’s Seventh Framework Programme (FP7/2007-2013) and EFPIA companies’ in kind contribution. Uitgegeven met steun van de Universitaire Stichting van België.
). The research leading to these results has also received support from the Innovative Medicines Initiative Joint Undertaking under EMIF grant agreement n° 115372, resources of which are composed of financial contribution from the European Union’s Seventh Framework Programme (FP7/2007-2013) and EFPIA companies’ in kind contribution. Uitgegeven met steun van de Universitaire Stichting van België.