
Abstract
Background:
Anosognosia is a frequent symptom of Alzheimer’s disease (AD), but its neural substrates remain in question.
Objective:
In this study, we combined neuroimaging with a neuropsychological evaluation to assess neural substrates of anosognosia.
Methods:
We prospectively recruited 30 patients with probable early-stage AD and matched healthy controls. Participants underwent MRI, FDG-PET, and a neuropsychological evaluation that includes an assessment of anosognosia. In the AD group, correlations between the anosognosia score, neuroimaging modalities, and neuropsychological performance were performed.
Results:
Atrophy and hypometabolism were correlated with the anosognosia score in the left dorsal anterior cingulate cortex. The anosognosia score was also correlated with atrophy of the cerebellar vermis, the left postcentral gyrus, and the right fusiform gyrus. No relation was found between anosognosia and the neuropsychological assessment.
Discussion:
Structural and metabolic alteration in the dorsal anterior cingulate cortex seems to be associated with a diminution of awareness in patients with early-stage AD.
Keywords
INTRODUCTION
For several years, lack of awareness of cognitive deficits has been reported in dementia with high prevalence [1, 2], in psychiatric disorders [3] or following stroke [4]. Although some regions are commonly impacted in relation to the lack of awareness, it would seem that this phenomenon is pathology-dependent. In Alzheimer’s disease (AD), while a recent meta-analysis [5] reported no difference in awareness level between healthy subjects and mild cognitive impairment (MCI) patients, others authors reported a lack of awareness from MCI (e.g., [6, 7]) to dementia stages (e.g., [8]). According to the literature, this phenomenon is not systematically observed in the course of the disease or among patients [6, 9]. Different terminologies such as “unawareness”, “lack of insight”, “anosognosia”, or “denial” have been used to refer to this phenomenon. In this study, we propose to use the term “anosognosia” to refer to the “impaired ability to recognize the presence or appreciate the severity of cognitive deficits” [10].
The use of different evaluation methods combined with a lack of consensus on the meaning of the term “anosognosia” [9] can explain the variability of the prevalence of anosognosia, from 23% to 75% across studies [9]. Therefore, synthesizing neuropsychological and neuroimaging findings remains difficult [11].
Cognitive mechanisms of anosognosia remain uncertain, but descriptive models have been proposed. From the metacognitive model of Nelson and Narens [12], Agnew and Morris [13] described three types of anosognosia in AD patients: 1) Mnemonic anosognosia refers to a deficit in the consolidation of new information in the personal data base; 2) Executive anosognosia refers to an alteration of the comparator mechanism allowing the comparison between the actual performance and the stored past information; and 3) Primary anosognosia refers to a direct deficit within the metacognitive awareness system, usually involved in bringing information to consciousness. However, while some authors [5] described a positive correlation between anosognosia and neurocognitive abilities in MCI patients (i.e., the more anosognosic the patient, the more severe the cognitive impairment), other reported a specific alteration of executive functions, in agreement with executive anosognosia [8, 15] or a specific alteration in memory performance in anosognosic AD patients [10, 16]. In 2013, Morris and Mograbi [17] revised this model by integrating the role of emotional processes. Positive correlation between anosognosia and apathy have already been reported in the literature in AD patients [18] (i.e., the more anosognosic the patient, the more apathetic they are) and could play an important role in awareness processes. Therefore, the pattern of cognitive impairment may not predict anosognosia symptoms or its severity. In this context, neuroimaging investigations could contribute to this understanding.
Magnetic resonance imaging (MRI) studies have reported a correlation between anosognosia severity and the atrophy of various cortical regions: the ventromedial prefrontal cortex [19], left superior frontal gyrus [20], anterior cingulate [21], right pars triangularis of the inferior frontal cortex [21], and the cerebellar vermis [21]. PET studies have shown hypometabolism in the orbitofrontal cortex [22–24], cingulate cortex [22, 23], medial temporal regions [24], and the temporoparietal cortex [24]. In a recent study combining fluorodeoxyglucose-positron emission tomography (FDG-PET) and resting state fMRI imaging in 23 AD patients, Perrotin and colleagues [22] reported that anosognosia could be due to an alteration of a specific brain area involved in self (posterior cingulate cortex) and executive functions (orbitofrontal cortex), as well as a disconnection within and between these regions and the temporal lobe, leading to impaired integration of new information in the personal data base. The neuronal substrate of anosognosia remains debatable and thus requires further studies.
The objective of the present study was to explore the neural basis of anosognosia in AD patients. An evaluation of executive and memory functions was carried out, as well as multimodal imaging using brain MRI and FDG-PET.
METHODS
This study was approved by the local Ethics Committee (Comité d’Ethique de la Recherche No. 57–1112), and all participants gave their informed consent. Thirty patients with probable early-stage AD were included in the present study. They were recruited through the outpatient Memory Clinic of the Neurology Department of Toulouse University Hospital (France). The clinical diagnosis of probable AD was made in accordance with IWG-2 criteria for typical AD [25]. Patients were included if they met the following criteria: age ≥50 years; no probable depression (Cornell Scale <14/48, [26]); impairment of anterograde verbal memory assessed by the Free and Cued Selective Reminding Test (FCSRT, sum of three free recalls ≤17/48 and/or sum of free and cued recalls ≤40/48 [27]); evidence of amyloid pathology in the cerebrospinal fluid (phospho-Tau ≥60 pg/mL and Innotest Amyloid Tau Index ≤0.8; or Aβ42/Aβ40 <0.045 [28]); and/or positive florbetapir PET imaging [25].
Thirty-five healthy controls (HC) matched for age, sex, and education were included in this study. Among them, 19 were used as a reference group for neuropsychological data and 16 were used as a reference group for neuroimaging data. They had no history or clinical evidence of psychological or neurological disorders, were cognitively intact (Mini-Mental State Examination (MMSE) >24/30) and had no cognitive complaint.
Anosognosia assessment
The severity of anosognosia was evaluated with the French version [29] of the Cognitive Difficulties Scale (CDS, [30]). This 39-item questionnaire was modified to exclude the 4 gender-dependent items and was completed by AD patients and their respective caregivers to assess 3 domains of cognitive difficulties in everyday life: attention/concentration, memory, and orientation. For each item, such as “I forget which day of the week it is” or “I have some difficulty staying focused on a job or occupation,” participants evaluated the frequency of cognitive difficulties on a 5-point scale (from 0 = “never” to 4 = “always”). The anosognosia score was calculated as follows: (sum of scores of the 35 items completed by the caregiver) –(sum of scores of the 35 items completed by the participant). Thus, the greater the score, the less aware the participant was of his difficulties. In order to better appreciate this phenomenon of anosognosia in AD patients, healthy controls and their respective relative also completed this questionnaire, and the calculation of the anosognosia score was the same as for the patients.
Neuropsychological assessment
Ten neuropsychological tests covering 5 cognitive domains were selected to comprehensively assess the cognitive processes often altered in patients with AD. Memory functions were evaluated with the Rivermead Behavioral Memory Test III [31] to assess visual, verbal, prospective, spatial memories, and the ability to learn a new task. Executive processes were explored with the Trail Making Test (TMT) [32] for flexibility, the Stroop test [32] for inhibition, phonemic and semantic verbal fluency [32] for initiation, and the Digit Span Forward and Backward test (WAIS-III) [33] for verbal working memory. We used the raw response times (s) for the TMT part A and Stroop naming and reading to assess the speed of information processing. A picture-naming test was chosen for language [34], and Mahieux’s test for ideational and ideomotor apraxia [35]. Finally, apathy was measured with the Apathy Inventory [36], depression with the Cornell Scale [26], and autonomy with the Activities of Daily Living Questionnaire [37] and the Lawton Instrumental Activities of Daily Living Scale [38]. The two latter self-care questionnaires were completed by caregivers only.
Brain imaging
Data acquisition
MRI and FDG-PET imaging were performed for 16 HC and 30 AD patients.
A high resolution anatomical image, using a 3D T1-weighted sequence (in plane resolution 1×1 mm, slice thickness 1 mm) and a T2-weighted sequence (reconstructed resolution 0.45×0.45×3 mm3) were obtained. FDG-PET scans were performed on a PET/computed tomography (CT) scanner (3D detection mode, producing images with 1×1×1.5 mm voxels). Cerebral emission scans began 20 min after the injection of 1.85 MBq/kg weight of FDG on average and lasted for 10 min. Both CT and PET scans were acquired.
Data processing and analyses
Grey matter density was assessed using a voxel-based morphometry method on Statistical Parametric Mapping version 12 (SPM 12, Wellcome Trust Centre for Neuroimaging) software running on MATLAB (MathWorks, Inc.). For each subject, the 3D T1 sequence was segmented to isolate grey matter and white matter partitions, modulated for deformation, normalized to the MNI space (Montreal Neurological Institute), and smoothed (8×8×8 mm). Three MRI scans from the AD group were excluded from imaging processing due to poor image quality.
FDG-PET scans were whole-brain normalized using a PET template from SPM12 software and smoothed (8×8×8 mm). Two FDG-PET scans from the patient group were excluded from imaging processing due to poor image quality.
Statistical analysis
Normality of clinical and neuropsychological data distribution was tested using the Shapiro-Wilk test. Intergroup comparison of the anosognosia score was performed using Student’s t-test for independent sample. Intergroup comparison of the neuropsychological assessment was performed using the Mann-Whitney test. A threshold of p < 0.05 was used.
The relationship between the anosognosia score and neuropsychological performance in AD patients was evaluated using the Spearman correlation and corrected for multiple correlations using Bonferroni’s procedure. Inter-group comparisons using voxel-based analysis (voxel level p < 0.05, FWE-corrected) were performed for MRI and FDG-PET imaging. In the AD group, a voxel-wise correlation analysis was also performed between the anosognosia score and grey matter density, and between the anosognosia score and metabolism (voxel level p < 0.001, cluster >70 voxels). Correlations between imaging modalities (MRI and FDG-PET scans) and cognitive functions ((FCSRT (Sum of free & cued recalls, /48)) and phonologic fluencies) have been computed in order to verify that altered regions are specific to the phenomenon of anosognosia.
To evaluate the potential mediating effect of apathy on anosognosia, correlations were also conducted between the apathy score and grey matter density and between the apathy score and metabolism (voxel level p < 0.001, cluster >70 voxels).
In the case where an alteration on the same region was found in both imaging modality, and thus to validate the relationship between grey density and metabolism, a Pearson correlation was used between the MRI and the FDG-PET data after extraction with the MARSBAR software running on MATLAB [39]. To confirm the spatial coherence between the two modalities, we conducted a Pearson correlation between the anosognosia score and the MRI data extracted from the FDG-PET cluster and between the anosognosia score and the FDG-PET data extracted from the MRI cluster.
RESULTS
No difference in age and education was found between the AD and the HC group for the neuropsychological assessment (Age (AD: 70.5 [8.75], HC (n = 19): 65 [20], p = 0.38); level of education in years (AD: 12 [3.5], HC: 12 [4], p = 0.84) and between the AD group and the HC on imaging assessment (Age (AD: 70.5 [8.75], HC (n = 16): 67.5 [6.25], p = 0.44) and level of education in years (AD: 12 [3.5], HC: 13.5 [6.5], p = 0.16). The anosognosia score was not related to the age and level of education in AD patients (see Supplementary Table 1).
Anosognosia and neuropsychological scores
Neuropsychological scores were lower in AD patients compared to healthy controls for memory, executive functioning, speed processing, praxis, and language. Concerning the behavioral assessment, there was no depression in the HC and AD groups and the scores were similar among the groups. However, AD patients were more apathetic than healthy controls. The anosognosia score was higher in AD patients than in healthy controls (Table 1, Fig. 1).
Demographic data and neuropsychological performance of HC and AD patients
HC, healthy controls; AD, Alzheimer’s disease; CDS, Cognitive Difficulties Scale; MMSE, Mini-Mental State Examination; RBMT III, Rivermead Behavioral Memory Test III; FCSRT, Free and Cued Selective Reminding Test; TMT, Trail Making Test; ADL, Activities of Daily Living Questionnaire; IADL, The Lawton Instrumental Activities of Daily Living Scale. Values shown are median [InterQuartile Range] for the not normally distributed data and mean [Standard Deviation] for normally distributed data.
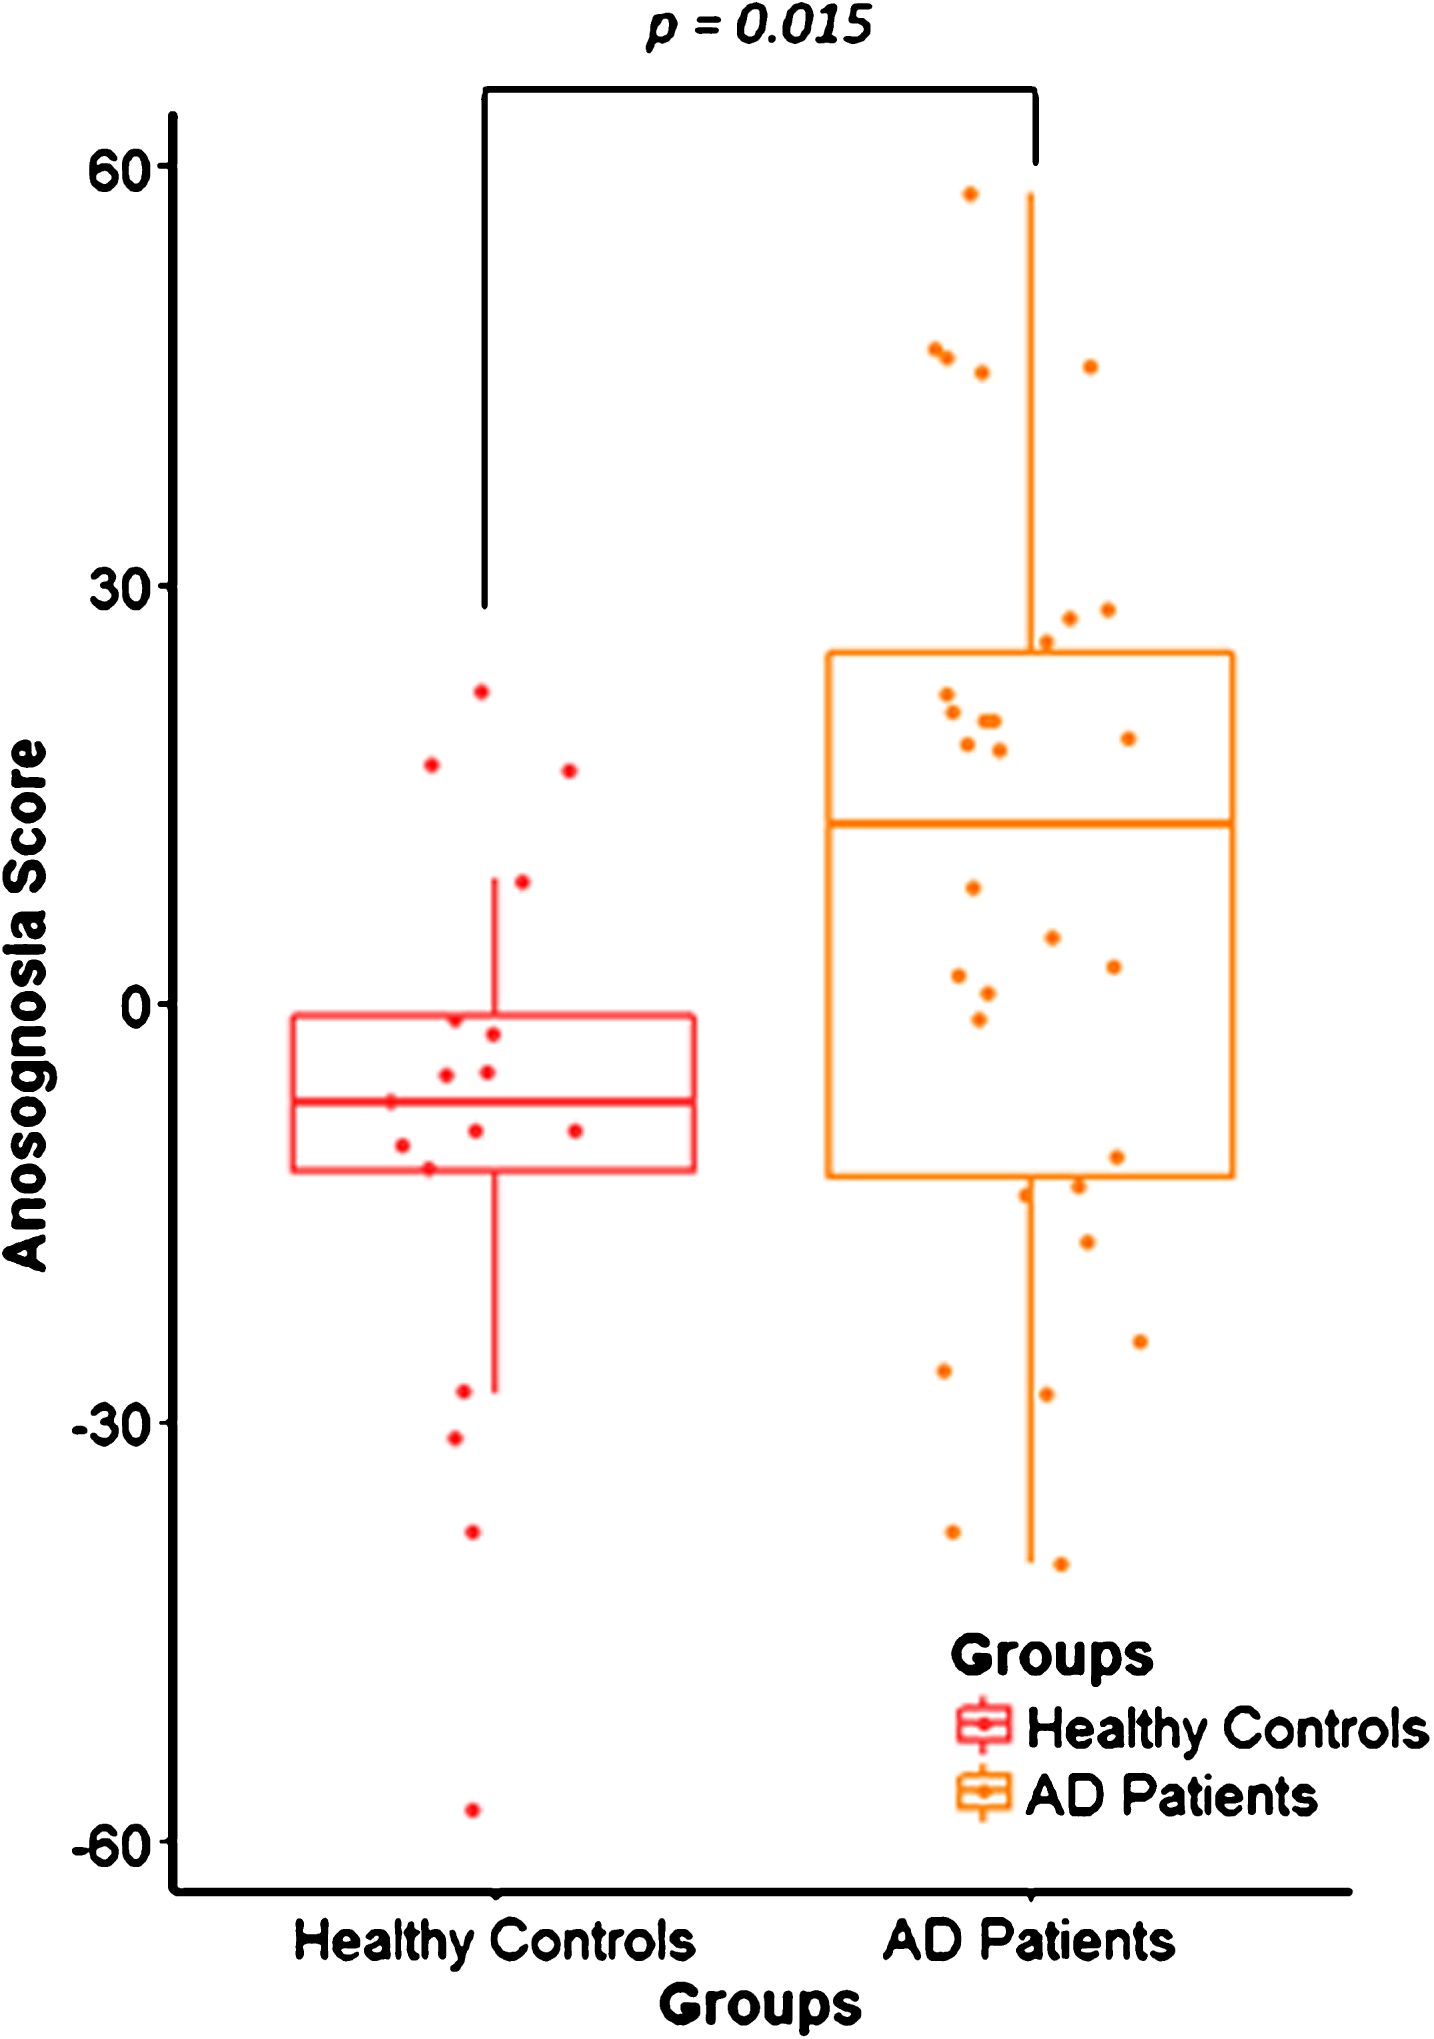
Distribution of the anosognosia score in healthy controls (HC) and Alzheimer’s disease (AD) patients. Box plot shows the difference between the anosognosia score distribution in the HC group (n = 17) in red and AD patients (n = 30) in yellow, with p = 0.015.
No correlation was found between the anosognosia score and any of the neuropsychological performances in the AD group (see Supplementary Table 1), either for memory or executive function.
Brain imaging and anosognosia
A difference in the density of grey matter in both left and right hippocampi and precuneus was found in AD patients in comparison to healthy controls (see Supplementary Figure 1A). We also found hypometabolism in both the left and right precuneus and parietal lobe in AD patients in comparison to healthy controls (see Supplementary Supplementary Figure 1B).
Negative correlations were observed between the anosognosia score and the density of grey matter in the left dorsal anterior cingulate cortex (dACC), left cerebellar vermis, left postcentral gyrus, and in the right fusiform gyrus (see Supplementary Figure 2). Concerning the PET imaging, a negative correlation was found between the anosognosia score and metabolism in the identical region, the left dACC. Details on the topographical location of these correlations and T scores are given in Table 2. Thus, the more anosognosic the patient, the more reduced the grey matter density and metabolism in the left dorsal anterior cingulate cortex (Fig. 2). Metabolism and grey matter density were positively correlated in this region (r = 0.41, p = 0.036). To confirm that is the same region involved in the two modalities, we also found a negative correlation between the anosognosia score and the MRI data extracted from the FDG-PET cluster (r = –0.55; p = 0.003) and the anosognosia score and FDG-PET data extracted from the MRI cluster of the left dACC (r = –0.6; p = 0.001).
Brain areas correlated with the anosognosia score on MRI and FDG-PET imaging
Correlation coefficient and p-values were calculated after extraction of data with MARSBAR.
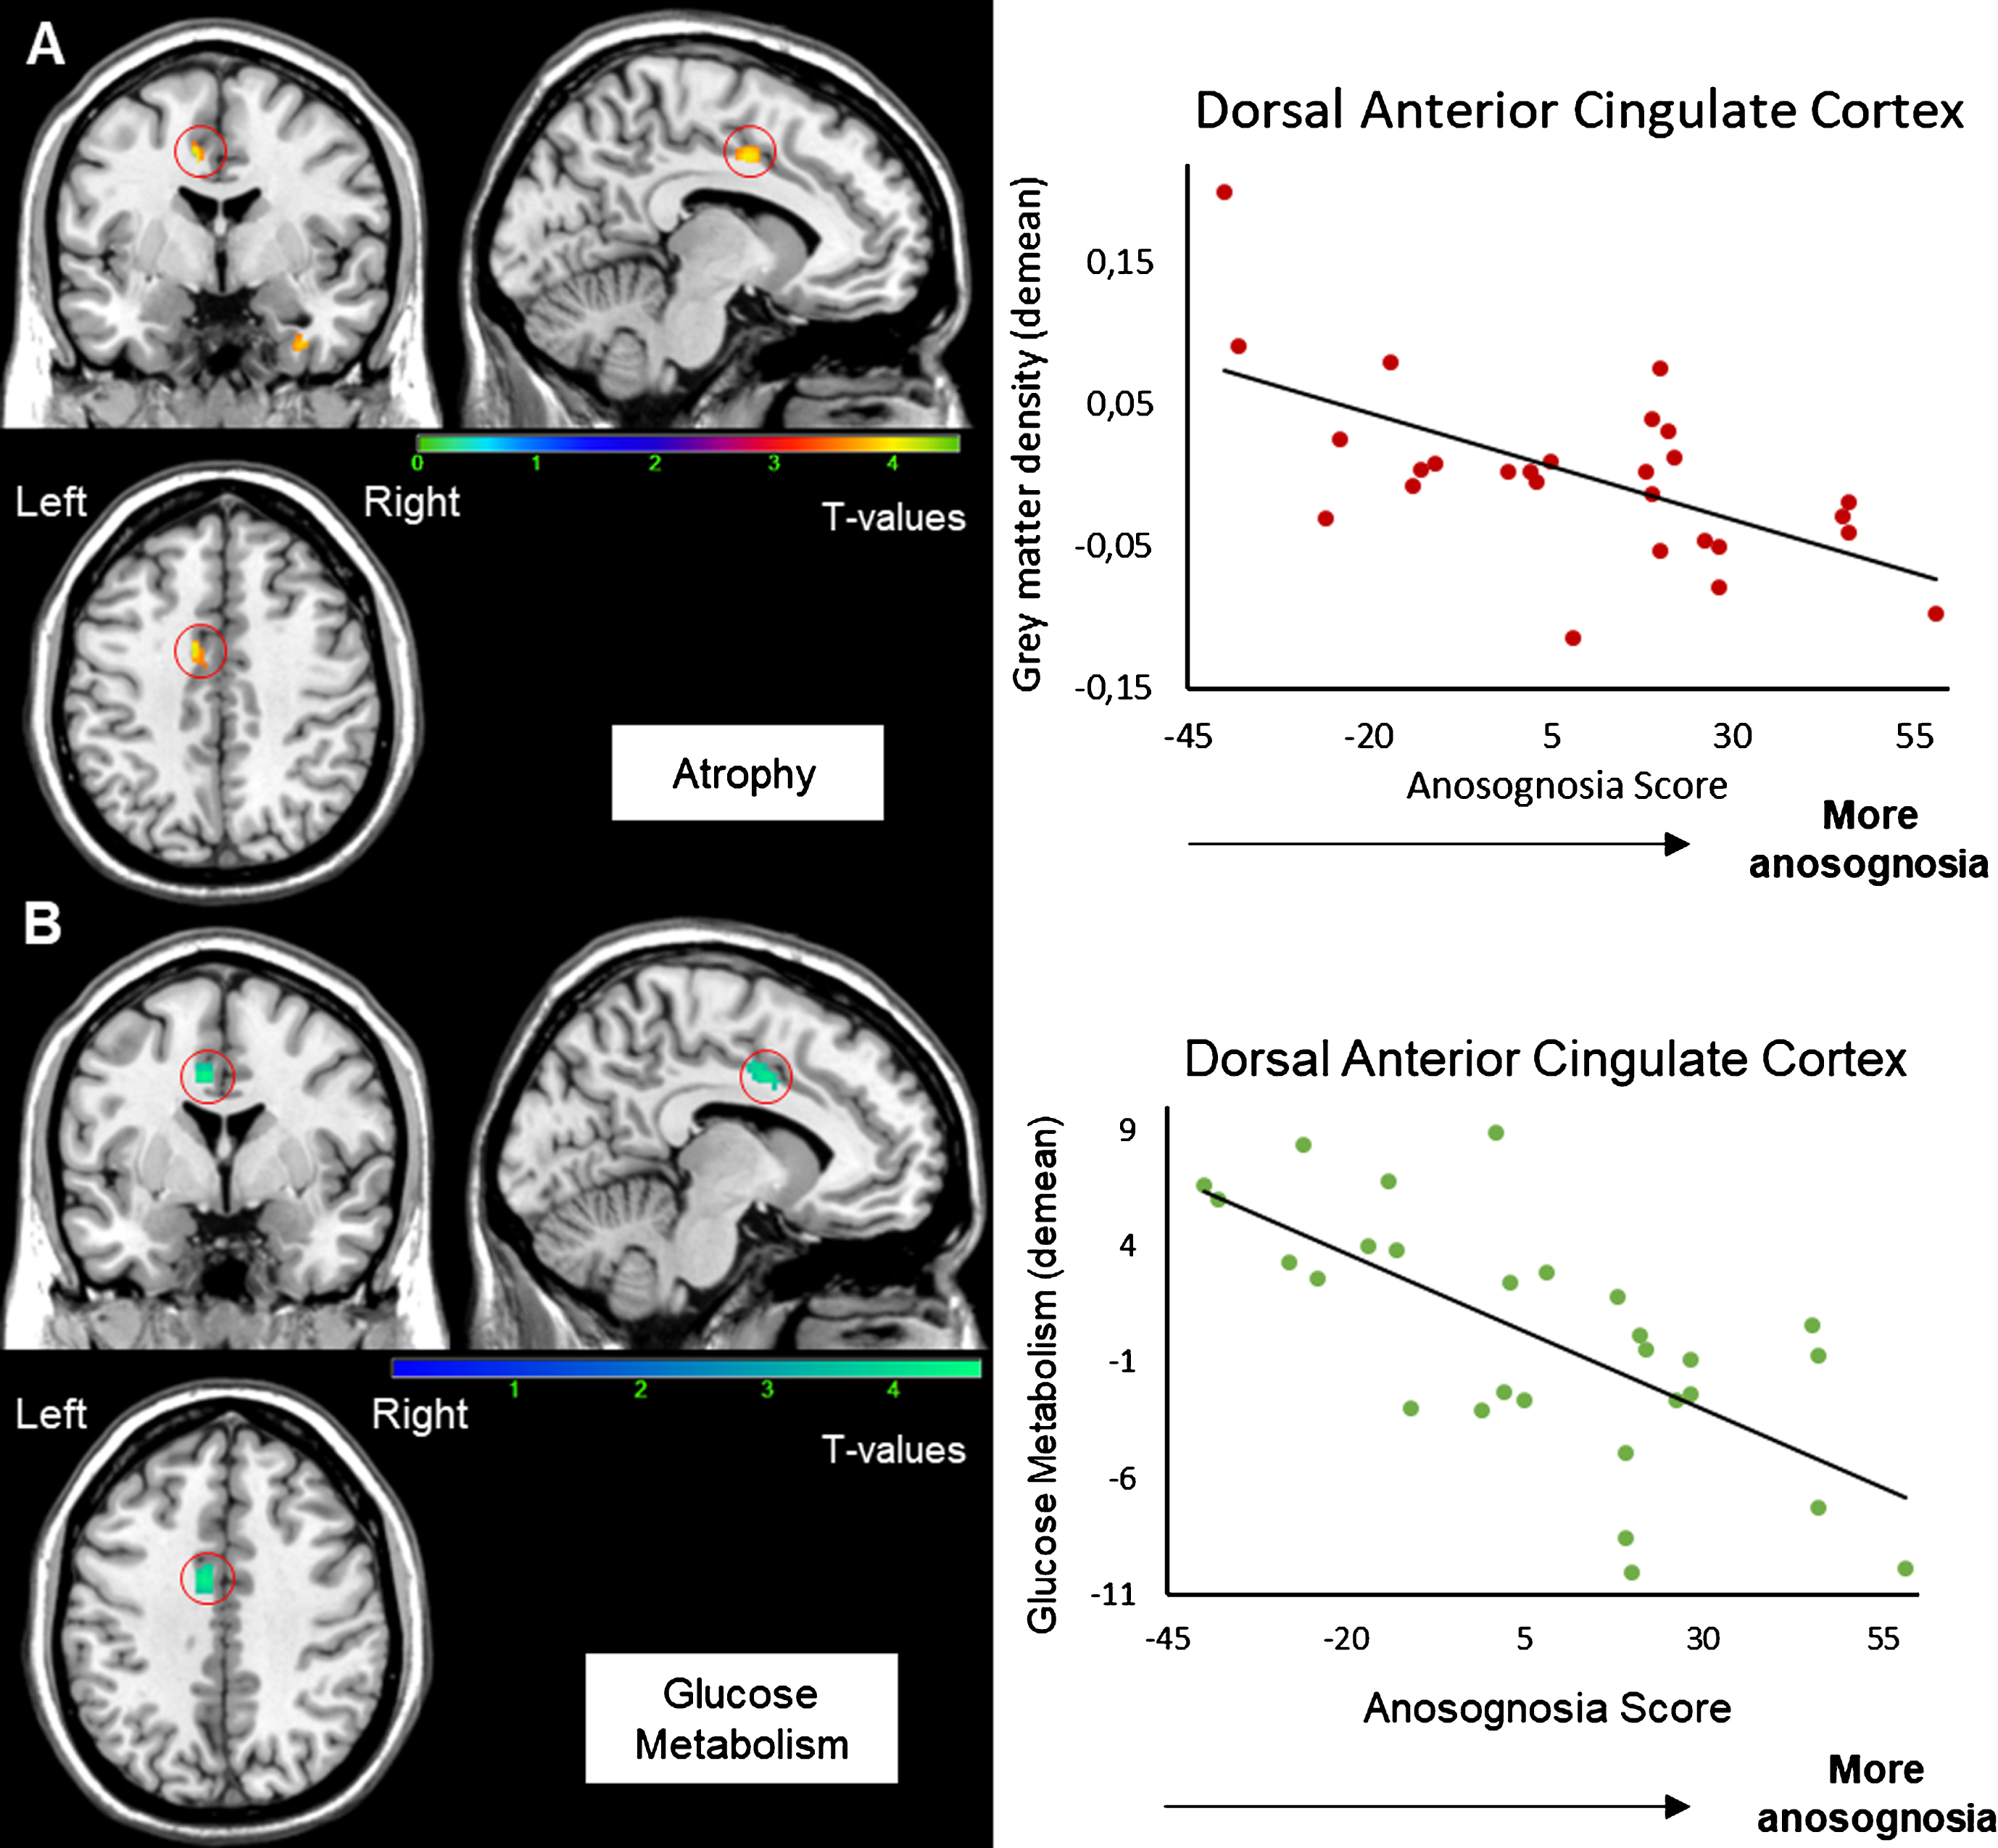
Correlation between the anosognosia score and MRI (A) and FDG-PET scans (B). Results were obtained from 27 T1-3D scans (A) and 28 FDG-PET scans (B) in Alzheimer’s disease patients. The statistical threshold is puncorr <0.001 (k > 70 voxels). Correlations are performed on the whole cluster after extraction of data with MARSBAR.
Cognitive functions ((FCSRT (Sum of free & cued recalls, /48)) and phonologic fluency) were significantly correlated with grey matter density (see Table 3). No correlation was found between these cognitive functions and metabolism.
Brain areas correlated with cognitive functions on MRI imaging
FCSRT, Free and Cued Selective Reminding.
Apathy score and grey matter density were negatively correlated in the left associative visual cortex (x, y, z: –44, –77, –2; k = 177; T = 4.8). Regarding results between the apathy score and metabolism, negative correlations were found in the right fusiform gyrus (x, y, z: 40, –38, –14; k = 245; T = 5.03), the left associative visual cortex (x, y, z: –42, –74, 4; k = 366; T = 4.49), and in the right (x, y, z: 42, –32, 18; k = 249; T 4.48) and left parietal operculum (x, y, z: –34, –28, 18; k = 127; T = 4.05).
DISCUSSION
The main aim of this study was to explore neural substrates of anosognosia in AD patients. In accordance with previous studies [22, 40], AD patients exhibited more anosognosia than healthy controls. We demonstrated a correlation between anosognosia and atrophy in the dorsal anterior cingulate cortex (dACC). This result is reinforced by the independent analysis of PET-FDG images, in which we found a correlation between anosognosia and hypometabolism in the very same region of the anterior cingulate cortex. Co-localization between MRI and PET findings seems to be a good indicator for the pertinence of the results [41]. It is important to note that we did not find any correlation between apathy and grey matter density or metabolism in the dACC. Concerning the neuropsychological assessment, no correlation was found between anosognosia and cognitive performance in the AD group. Correlations with cognitive functions ((FCSRT (Sum of free & cued recalls, /48)) and phonologic fluency) confirm that: 1) there is a coherent link between the cognitive alterations found in our patients and their imaging pattern and 2) there are specific alterations of the dorsal anterior cingulate cortex, posterior vermis, postcentral, and fusiform related to the phenomenon of anosognosia.
The part of the cingulate positively correlated with anosognosia scores in our study belongs to the dACC [42], but the terminology varies in the literature. Other authors have named it the supragenual anterior cingulate cortex (SACC) [43], or the posterior middle cingulate cortex [44]. The dACC is involved in high-level executive functions, such as response selection, error detection, performance monitoring, reappraisal and judgement of self-related stimuli [43, 46].
Impairment of the dACC has already been reported in other imaging studies. Wong et al., in 2016 [47], reported grey matter atrophy of the bilateral anterior cingulate and paracingulate cortices in 16 AD and 22 frontotemporal dementia patients using the self-reference effect paradigm. Specific alterations of the right posterior cingulate cortex and orbital frontal cortex have also been found in AD patients whereas a specific alteration of the right medial prefrontal and subcallosal cortices was found in frontotemporal dementia patients. In a SPECT study, decreased perfusion in the dACC and inferior, medial, and orbital frontal lobes was found in AD patients with a high score of anosognosia in comparison to a group of AD patients without anosognosia [23]. These authors explained that anosognosia may be associated with an alteration of these regions involved in error awareness. In a functional MRI study, Amanzio et al. [48] reported decreased activity in the dACC and rostral prefrontal cortex during a Go/no-Go task in anosognosic AD patients, whereas these regions are usually activated to make a choice between two situations. They also found a diminution of activation of the right post-central gyrus and parietotemporal-occipital junction, as well as the striatum and cerebellum during the same tasks. They supposed that a reduced functional recruitment of these cingulofrontal and parietotemporal regions could be associated with anosognosia in these patients.
An explanation for anosognosia in AD is the “petrified-self” model [49]. According to this model, the inability of the patient to update their own personal database leads patients to refer to their premorbid personal information. This is coherent with Conway’s “Self-Memory System” model [50], in which self and autobiographical memory are interdependent [51]. One hypothesis concerning the lack of integration of this self-information could be an alteration of executive processes involved in the selection, comparison, and updating mechanisms. We may hypothesize that dACC is important in this updating process, and therefore a structural and functional impairment of this region may have an effect on awareness processes. Ansell and Bucks in (2006) [52] were interested in this mechanism and measured AD patients’ pre- and post-estimation after learning word lists. They reported that AD patients were capable of adjusting their estimation after many repetitions, but accuracy was lower than healthy controls’ estimations, suggesting that the comparator mechanism was impaired in AD patients, in agreement with executive anosognosia.
Executive dysfunction in AD patients with anosognosia, supporting the executive anosognosia hypothesis, is frequently reported [8, 48] but was not observed in our study. We acknowledge that our clinical executive tests had a low specificity for assessing response selection, error detection, and performance monitoring. A more specific executive evaluation may have had a better possibility of correlating with anosognosia. To assess an alteration of this comparator process, the Judgement of Learning paradigm (JOL) would be more suitable for properly assessing this hypothesis [53].
Thus, we can propose that atrophy and hypometabolism in the dACC may explain, to a certain extent, the awareness deficit in AD patients. An alteration of this region, apparently involved in executive processes, can explain the hypothesis of a lack of personal database updating in anosognosic patients. The monitoring process could be deficient, leading to an alteration of the comparator mechanism. A disconnection between the cingulate cortex and the temporal lobe could also explain the alteration of information transfer between online monitoring and self-representation [22]. A recent study of three different memory training programs using a global JOL paradigm in 51 AD patients showed alteration of the information online transfer to the personal database, rather than a lack of updating or an alteration of the comparator mechanism [54].
In addition to being involved in executive processes, the anterior cingulate also plays an important role in apathy process [55, 56]. In 2007, Apostolova and colleagues [55] reported a negative correlation between the apathy severity and the grey matter density in 17 AD patients. Some studies have also reported positive correlations between apathy and anosognosia in AD (see [11] for review). Rosen in 2011 [57] suggested that motivational and emotional factors could play an important role in self-monitoring engagement and error detection and therefore would modulate the awareness level. Another important imaging result in this study is the correlation between grey matter density in the posterior cerebellar vermis found in AD patients and the anosognosia score. However, no alteration of metabolism related to anosognosia was found in this region. Executive functions are principally supported by the posterior cerebellum, and more precisely the lobules VI/Crus I and VIIB [58]. However, the altered region found in our study is the posterior vermis of the cerebellum, which is primarily involved in emotional processes [59, 60]. In a recent study, Bertrand et al. [60] reported that induction of a negative mood state after a failed memory task induced an augmentation of the awareness level. We can also postulate that during task performance, the presence of apathy or an altered emotional process in these patients can alter the detection of a difference between the actual self-information collected (e.g., the failure of the task) and the old information about oneself, leading to a lack of selection of this new information. The perceived difference may also be minimized or ignored [61]. In this study, we didn’t find any correlation between anosognosia and apathy scores. In addition, we didn’t find any correlation between apathy and dACC structure or metabolism. However, correlations between apathy and metabolism were found in the associative visual cortex (BA19). These results are in agreement with previous studies in healthy subjects [62] and MCI patients [63]. In our study, the distribution of the apathy score limits the interpretation of the results.
Other results were the grey matter density of the right fusiform gyrus and the left postcentral gyrus, which was negatively correlated with the anosognosia score. A diminution of connectivity between the fusiform gyrus and hippocampi in connection with anosognosia in MCI was reported in a recent study but not discussed [64]. Concerning the left postcentral gyrus, its involvement is better known in self-referential processing in the spatial domain than self-referential processing in the memory domain. Currently, no strong explanation was found for the involvement of these structures.
As mentioned above, more specific testing of high-level executive function (response selection, error detection, performance monitoring, reappraisal, and judgement of self-related stimuli) would be of great interest in future studies. Similarly, a specific ecological memory task would have a better chance of responding to the memory hypothesis for anosognosia. In fact, it is highly probable that “real life” autobiographical data related to the self and episodic memory are not integrated in the same way [65]. Concerning the anosognosia score, it is worth noting that the mean of anosognosia in healthy controls is negative but similar results had previously found in literature [22, 66]. As mentioned, we found in the AD group a wide distribution of the anosognosia score along a continuum. The choice of a cut-off for the anosognosia score was impossible (see Supplementary Figure 3). Therefore, we chose to use correlations. The inclusion of more patients in this study might have allowed us to find a bimodal distribution for this anosognosia score and therefore create two distinct groups.
Conclusion
This study combines a neuropsychological, structural, and metabolic assessment of anosognosia in AD patients. We found that the dACC seems to play a significant role in anosognosia. This region seems important for executive functions and specifically data updating, essential in awareness processes. One way to further explore this hypothesis would be to design a specific executive function assessment to evaluate the inner cognitive mechanisms of selection, error detection, performance monitoring, reappraisal, and judgement of self-related stimuli.
Footnotes
ACKNOWLEDGMENTS
The authors thank the patients and control participants who took part in this study, as well as the promoter of this study, Toulouse University Hospital (CHU). Our gratitude goes to Dr. Sophie Dechaumont-Palacin, Dr. Michèle Puel, Thomas Busigny, Laure Saint-Aubert, and Aurélie Pistono for their involvement and help in this project. This research did not receive any specific grant from funding agencies in the public, commercial, or not-for-profit sectors.