
Abstract
Diffusible amyloid-β (Aβ) oligomers are currently presumed to be the most cytotoxic Aβ assembly and held responsible to trigger the pathogenesis of Alzheimer’s disease (AD). Thus, Aβ oligomers are a prominent target in AD drug development. Previously, we reported on our solely
INTRODUCTION
Neurodegenerative diseases caused by the aggregation of misfolded proteins are about to become a threatening risk for our aging society and health care systems. Alzheimer’s disease (AD) is one of the most intensively researched progressive neurodegenerative diseases. More than 20 million people worldwide are currently affected by AD and no curative therapy has been developed in the last 110 years since Alois Alzheimer described the disease. This circumstance manifests the extensive medical need for development of a disease modifying or even a curative treatment of AD.
AD is characterized by three major hallmarks: extracellular deposits or plaques consisting of amyloid-β protein (Aβ), intracellular deposits consisting of hyperphosphorylated tau protein, and neurodegeneration. Aβ is natively generated throughout lifetime and able to aggregate, thus forming lower molecular weight soluble Aβ oligomers or insoluble Aβ fibrils that make up the plaques [1]. Since about one decade, researchers entitle soluble oligomers to be the most neurotoxic Aβ species [2]. Both Aβ and tau, with their formation, aggregation, and degradation, are prominent targets in AD drug development [3, 4].
In our laboratory, we identified and developed compounds that specifically and directly eliminate toxic Aβ oligomers. Previously, we described the properties of our lead compound D3 (Table 1). D3 consists of twelve
Peptides’ sequences and configurations
Here, we further investigated and characterized the most promising microarray-derived derivative ANK6 and compared it to two ANK6-variants, the head-to-tail linear tandem ANK6 (tANK6) and the head-to-tail cyclic ANK6 with an additional arginine (cANK6r) to maintain the total net charge, thus combining different peptide optimization tools. We conducted in vitro experiments that exhibit the
MATERIALS AND METHODS
Peptides
Non-labelled peptides ANK6, tANK6r, and cANK6r were synthesized by peptides & elephants GmbH (Germany). Radio-labelled 3H-ANK6, 3H-tANK6, and 3H-cANK6r were produced by Cambridge Research Biochemicals (United Kingdom) with 1 mCi/mL. The peptides’ sequences are shown in Table 1. Recombinant Aβ1 - 42 was obtained from Isoloid GmbH (Germany). Synthetic Aβ1 - 42 was obtained from Bachem AG (Switzerland).
D -peptides’ in vitro potencies
Aβ aggregation assay
The potencies of ANK6, tANK6, cANK6r, and D3 to inhibit Aβ1 - 42 aggregation was examined using Thioflavin T (ThT). For this purpose, a buffer solution composed of 20 mM sodium phosphate buffer (pH 7.4) including 50 mM sodium chloride, and 5μM ThT was prepared. Afterwards, ANK6, tANK6, cANK6r, or D3 were diluted in this solution, respectively, to final peptide concentrations between 0.3125 and 80μM (ANK6 and tANK6:0.3125, 0.625, 1.25, 2.5, 5, 10, 20μM; cANK6r: 1.25, 2.5, 5, 10, 20, 40, 80μM; D3:1.17, 2.34, 4.7, 9.4, 18.8, 37.5, 75μM).
The buffer solution only served as negative control (blank). Lyophilized Aβ1 - 42 was dissolved in the respective peptide solution to a final concentration of 10μM.
Cell viability assay
The ability of ANK6, tANK6, and cANK6r to neutralize the toxicity of oligomeric Aβ1 - 42 was investigated with 3-(4,5-Dimethylthiazol-2-yl)-2,5-diphenyltetrazoliumbromid (MTT). In this experiment, we used rat phaeochromocytoma cells (PC12 cells, Leibniz Institute DSMZ, Germany) cultivated in DMEM supplemented with 10% fetal calf serum, 5% horse serum, and 1% penicillin-streptomycin at 37°C, 5% CO2, and 95% humidity. The cells (10,000 cells/well) were incubated on collagen coated 96 well plates (Gibco, Life Technologies, # A11428-03) for growth in adherent cell culture (24 h, 37°C). Oligomeric Aβ was generated by incubating monomeric Aβ1 - 42 in sodium phosphate buffer (10 mM Na2HPO4/NaH2PO4, pH 7.4) at 21°C and 600 rpm agitation for 4.5 h. The cell viability was investigated after the incubation with buffer only (positive control, set to 100 % cell viability), Triton X-100 (0.125 %, cytotoxic agent, negative control), Aβ1 - 42 alone (1μM), ANK6, tANK6, or cANK6r alone (15μM each), as well as Aβ1 - 42 (1μM) in the presence of ANK6, tANK6, or cANK6r (each
Quantitative determination of interference with Aβ aggregate size distribution
As soluble Aβ oligomers are currently expected to be the most neurotoxic Aβ species causing AD, the Aβ1 - 42 oligomer elimination potency of ANK6, tANK6, and cANK6r was investigated by the quantitative determination of interference with Aβ aggregate size distribution (QIAD) similar as described before [19]. In short, lyophilized Aβ1 - 42 was dissolved in sodium phosphate buffer to a final concentration of 80μM and incubated for 2.5 h (21°C, 600 rpm) to achieve an Aβ aggregate distribution including monomers, oligomers, and higher molecular aggregates. Then, sodium phosphate buffer (control), 20μM ANK6, 20μM tANK6, or 20μM cANK6r were added and incubated for further 40 min (21°C, 600 rpm). Afterwards, the samples were loaded on top of a density gradient (5 to 50% (w/v) iodixanol, OptiPrep, Axis-Shield, Norway) and ultra-centrifuged for 3 h (4°C, 259.000× g, Optima TL-100, Beckman Coulter, USA). In the following, 14 fractions (140μL each) were taken from top to bottom, whereby the top fractions (1-2) contained Aβ monomers, the middle fractions (4–6) contained the Aβ oligomers of special interest, and the bottom fractions (11–14) contained high molecular weight co-precipitates. The left-over was diluted in 60μL 6 M guanidine hydrochloride (fraction 15). Finally, the Aβ1 - 42 concentrations in all fractions were determined via analytical RP-HPLC (reversed phase-high performance liquid chromatography) and UV absorbance detection at 214 nm.
Statistical calculation
Statistical analyses were performed using GraphPad Prism 5 (GraphPad Software, Inc., USA) and SigmaPlot Version 11 (Systat Software, Germany). Gaussian distribution was analyzed by use of a normal probability plot (SigmaPlot or InVivoStat by Simon Bate and Robin Clark, United Kingdom) [28]. Data is represented as mean±SEM, p > 0.05 was considered to be not significant. Data was analyzed by one-way ANOVA with Bonferroni post hoc analysis.
Preclinical pharmacokinetic characterization
Plasma protein binding
Plasma protein binding (PPB) to human serum albumin (HSA) and α1-acid glycoprotein (AGP) of ANK6, tANK6, and cANK6r was analyzed according to the manufacturer’s protocol of TRANSILXL HSA and AGP binding kits (Sovicell GmbH, Germany). To cover a larger range of HSA and AGP concentrations, the bead concentrations in the kit were modified. For detection, a mixture of 3H-labelled and non-labelled ANK6, tANK6, and cANK6r (final concentrations of 5μM) was added to different concentrations of HSA (7.4μM to 420μM, 10–12 different concentrations) or AGP beads (0.04μM to 3μM, 9–12 different concentrations). The amount of unbound ANK6, tANK6, and cANK6r (in %) to HSA or AGP, respectively, was determined by liquid scintillation counter (LSC) measurements. The dissociation constants (KD) as well as the free drug fractions (fu) in human plasma were calculated as described before [29]. Calculations were based on peptide concentrations detected in the blood 4 h after single oral administration of 10 mg/kg: 0.01μM ANK6, 0.01μM tANK6, and 0.01μM cANK6r.
Animals
The pharmacokinetic profiles were investigated in 180 male C57Bl/6N mice aged 13-14 weeks, weighing about 27.4 g in average. Mice were ordered at Charles River (Germany) and housed at least one week under standard housing conditions (12/12 h light-dark cycle, approximately 22°C room temperature and 54% humidity; water and food available ad libitum) in the animal facility of the Forschungszentrum Jülich GmbH before the experiments were carried out. All animal experiments were approved by the Animal Protection Committee of the local government according to the German Protection of Animals Act (LANUV, North-Rhine-Westphalia, Germany, Az.84-02.04.2017.A029).
Pharmacokinetic concentration-time profiles
To determine the concentration-time profiles of ANK6, tANK6, and cANK6r in murine brain, plasma, liver, kidney, and cerebrospinal fluid (CSF) after i.v. and p.o. administration, mixed solutions of non-labelled and 3H-labelled peptides were prepared. The administered solutions contained 1 mg/mL (i.v.) or 3 mg/mL (p.o.) of the respective
Animals whose CSF was not extracted were anesthetized with isoflurane (cp-pharma, Germany) inhalation approximately 2 min before each organ harvesting time point. Afterwards, blood was taken by cardiac puncture and the heparinized blood was centrifuged (3000 g, 5 min, 4°C) to get plasma. The plasma in the supernatant was separated and 1:1 diluted with PBS. The right brain hemisphere, 200 mg of the big liver lobe, and the right kidney were removed, weighed, and homogenized in 500μL PBS (Precellys Ceramic Kit 1.4 mm, Precellys 24, Bertin technologies SAS, France). 100μL of the diluted plasma, the homogenized brain, liver, or kidney (in triplicates), or 1–5μL (exactly determined) of the extracted CSF (extraction procedure see below, single determination) were mixed with 10 mL scintillation cocktail (Ultima Gold XR, PerkinElmer, USA). The mixture was incubated overnight (100 rpm, room temperature).
Animals whose CSF was extracted (organ harvesting time points: 60 min, 240 min, 1440 min) were i.p. anesthetized with ketamine/medetomidine approximately 20 min before each sampling time point. When the mouse was in deep narcosis, the cisterna magna was laid free and punctuated with a small capillary to extract about 5μL of CSF as described before [30]. Afterwards, cardiac puncture, organ extractions, and sample preparations were performed as described above.
Quantification of the amount of 3H-labelled
The determined peptide concentrations were plotted over time to allow for comparison of all peptides’ uptake into brain, plasma, liver, kidney, and CSF. Concentrations at 0 min were set to 0 % ID/mL or 0 % ID/g except for plasma concentrations after i.v. administration. There, concentrations were linearly back-extrapolated based on the first two measured time points (5 min, 10 min).
Pharmacokinetic parameters
To calculate the pharmacokinetic parameters of ANK6, tANK6, and cANK6r for plasma and brain, concentration-time profiles were analyzed. Non-compartmental data analysis was performed with Phoenix WinNonlin (Pharsight, a Certara Company; USA) to calculate the area under the curve from the first to the last measured data pair (AUClast), the mean residence time (MRT), and the terminal elimination rate constant (λz, nonlinear regression of the last four to five measured concentrations). Further pharmacokinetic parameters were calculated with the help of the formulas listed in Table 2.
Formulas for calculation of pharmacokinetic parameters and blood-brain barrier values
To allow for direct comparison with other peptides, four universally applied BBB parameters were determined [31]: the blood-brain equilibrium distribution (logBB), the universal influx rate constant (Kin), the initial distribution volume in brain (Vi), and the permeability surface-area product (PS). Based on data of the concentration-time profiles and pharmacokinetic parameters after i.v. administration, the BBB parameters were calculated with the help of the formulas listed in Table 2. Graphical determination of Kin and Vi was conducted by plotting the brain concentration to plasma concentration ratio at certain time points (Cb (t)/Cp (t) [mL/g]) on the y-axis against the exposure time (AUCp (t)/Cp (t) [min]) on the x-axis. The linear range for Kin and Vi determination was between 0 and 240 min for ANK6 and cANK6r (R2: 0.9970, 0.9996) and between 0 and 1440 min for tANK6 (R2: 0.9758). PS was calculated on the basis of a murine cerebral blood flow (CBF) of 1.07 mL/(g*min) [32].
RESULTS
D -peptides’ in vitro potencies
The Aβ aggregation assay was performed to compare the potencies of ANK6, tANK6, and cANK6r, with D3’s potency to inhibit the formation of ThT-positive Aβ1 - 42 fibrils. In Fig. 1, the Aβ aggregation inhibition [%], relative to Aβ1 - 42 aggregation without peptide, was plotted against different ANK6, tANK6, cANK6, or D3 concentrations (0.3125-80μM). The data fits resulted in the following IC50 values: 3.6μM ANK6, 2.1μM tANK6, 3.7μM cANK6r, 7.2μM D3. Equimolar concentrations of ANK6 relative to Aβ1 - 42 as well as of tANK6 relative to Aβ1 - 42 reduced the aggregation amplitude by more than 97%, while cANK6r and D3 needed about 8-fold molar excess relative to Aβ1 - 42 to reduce the aggregation amplitude by more than 95%.
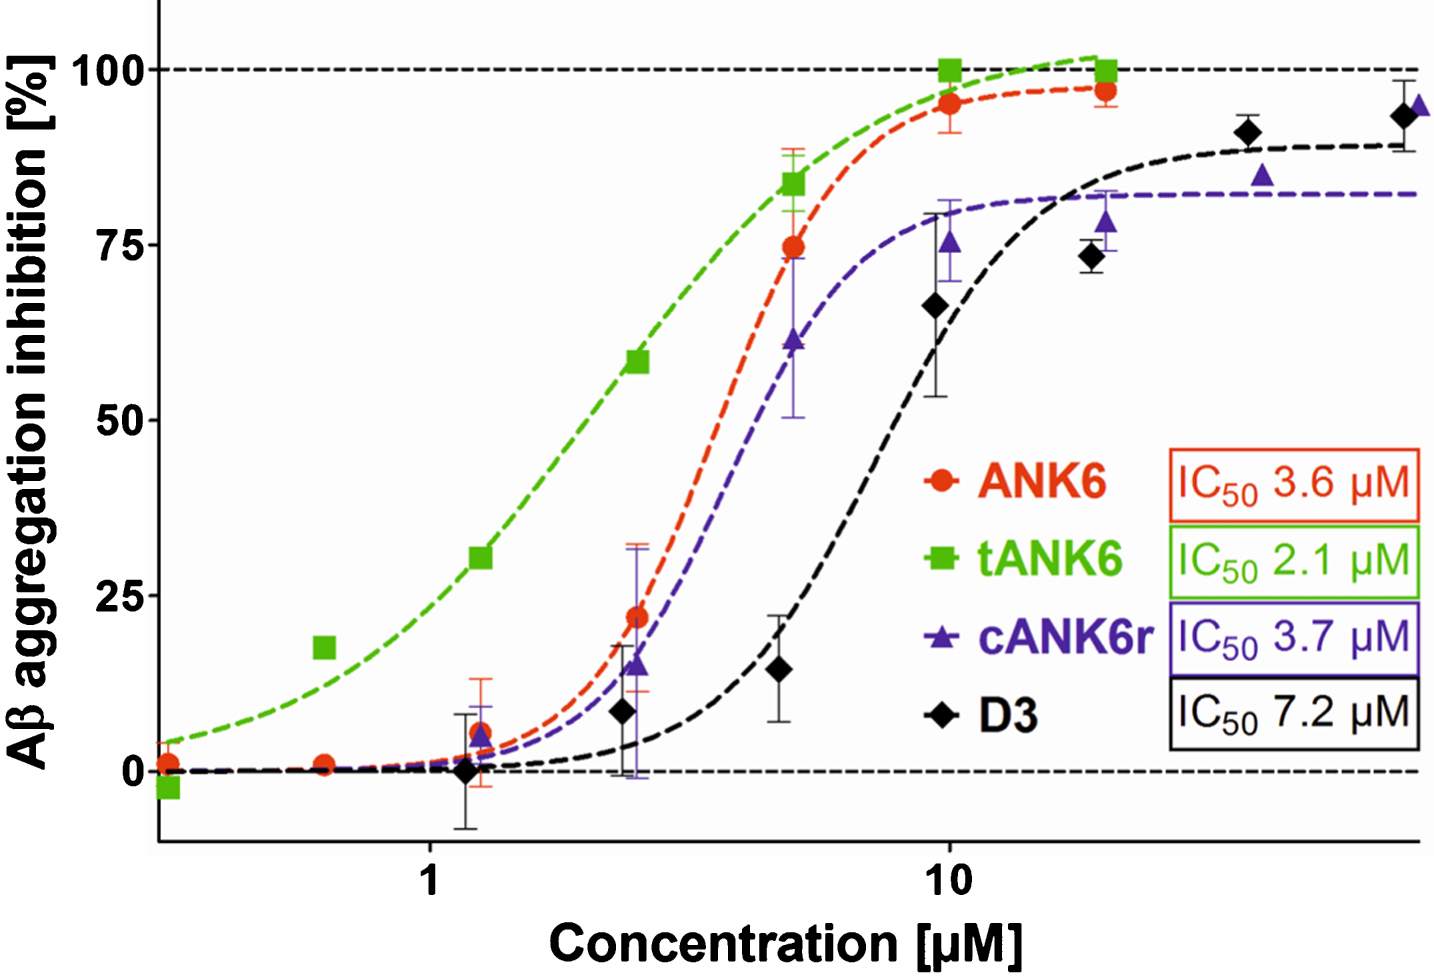
Aβ aggregation assay. To investigate ANK6’s (red circles), tANK6’s (green squares), cANK6r’s (blue triangles), and D3’s (black diamonds) potencies to inhibit Aβ1 - 42 monomer aggregation into ThT-positive fibrils, different concentrations of the respective peptides (0.3125-80μM) were incubated with 10μM Aβ1 - 42 each. The Aβ aggregation inhibition [%], relative to the fluorescence signal of ThT-positive Aβ1 - 42 fibrils which were formed without any peptide added, was plotted against the respective
To find out whether ANK6, tANK6, and cANK6r lowered the cytotoxic effect of Aβ1 - 42 on the cell viability of PC12 cells, MTT assays were performed with various
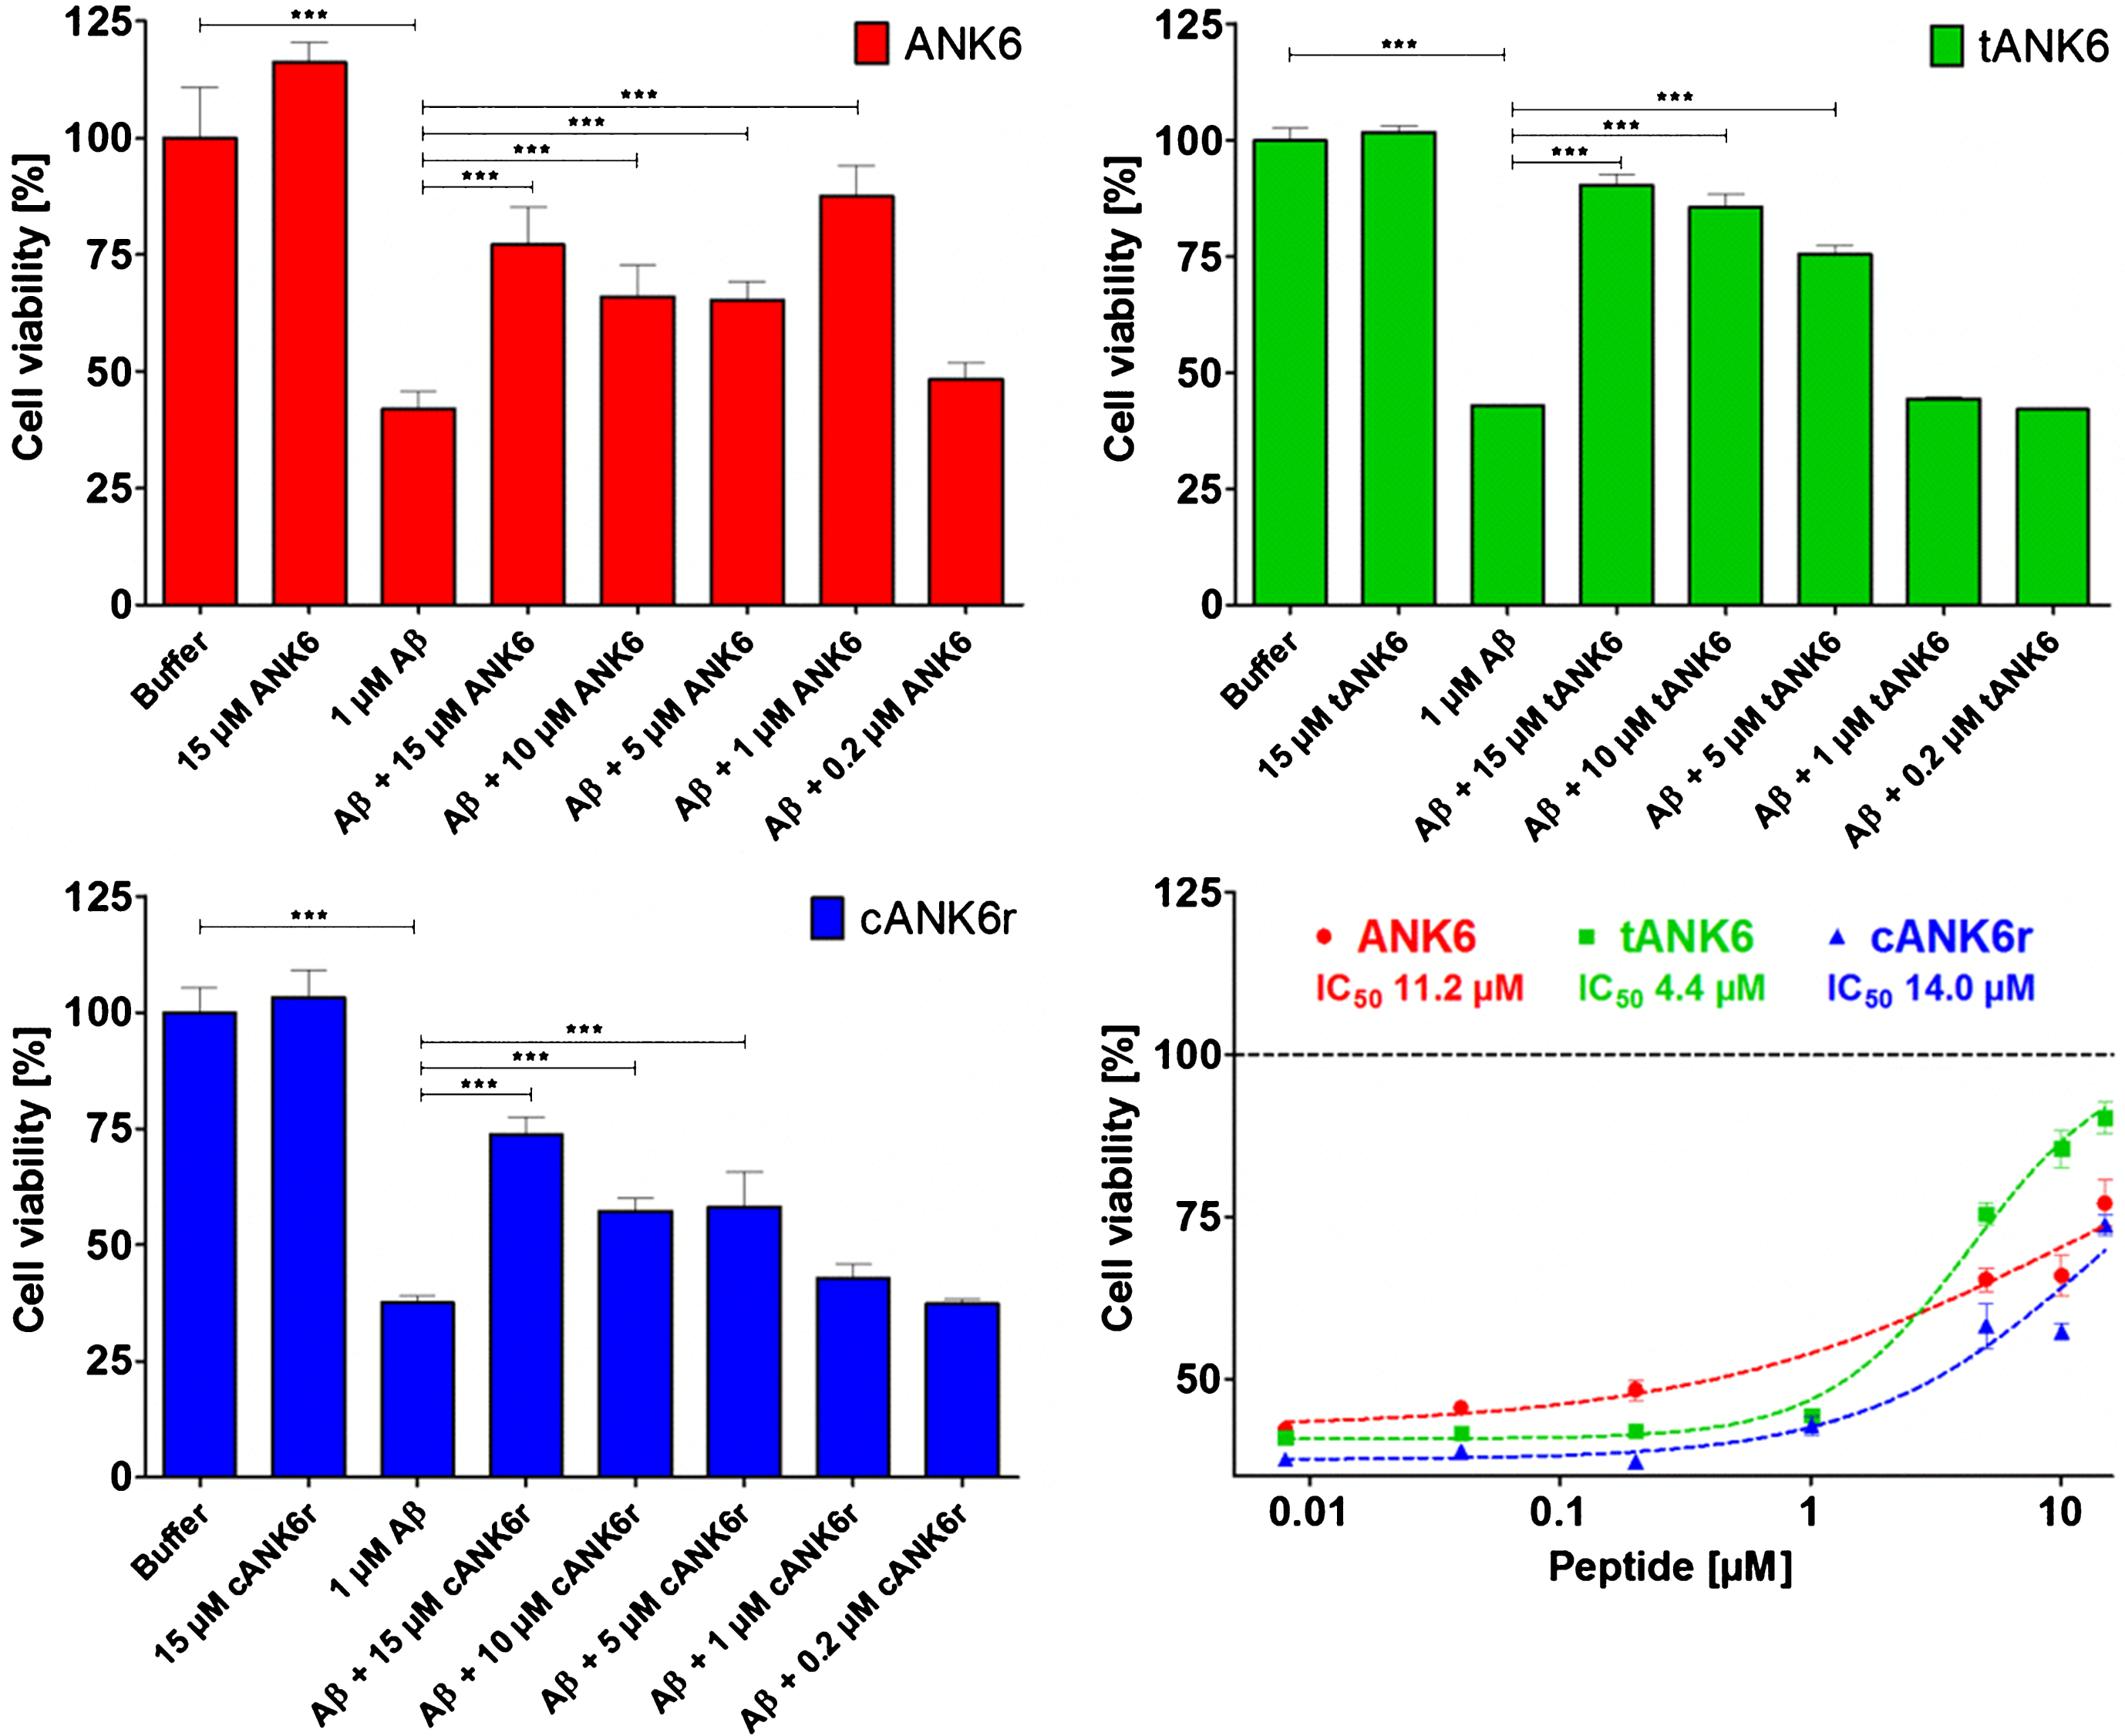
Cell viability assay. To investigate ANK6’s (red circles), tANK6’s (green squares), and cANK6r’s (blue triangles) potencies to reduce the toxicity of Aβ1 - 42, a cell viability assay was performed. After pre-incubation of Aβ1 - 42 monomers to ensure Aβ oligomerization, solutions containing either Aβ1 - 42 alone (1μM final concentration), or Aβ1 - 42 with different amounts of ANK6, tANK6, and cANK6r (final concentrations between 0.008 and 15μM) were incubated on PC12 cells overnight. Cell viabilities [%], relative to buffer-treated cells, were plotted against the respective
The
To investigate the
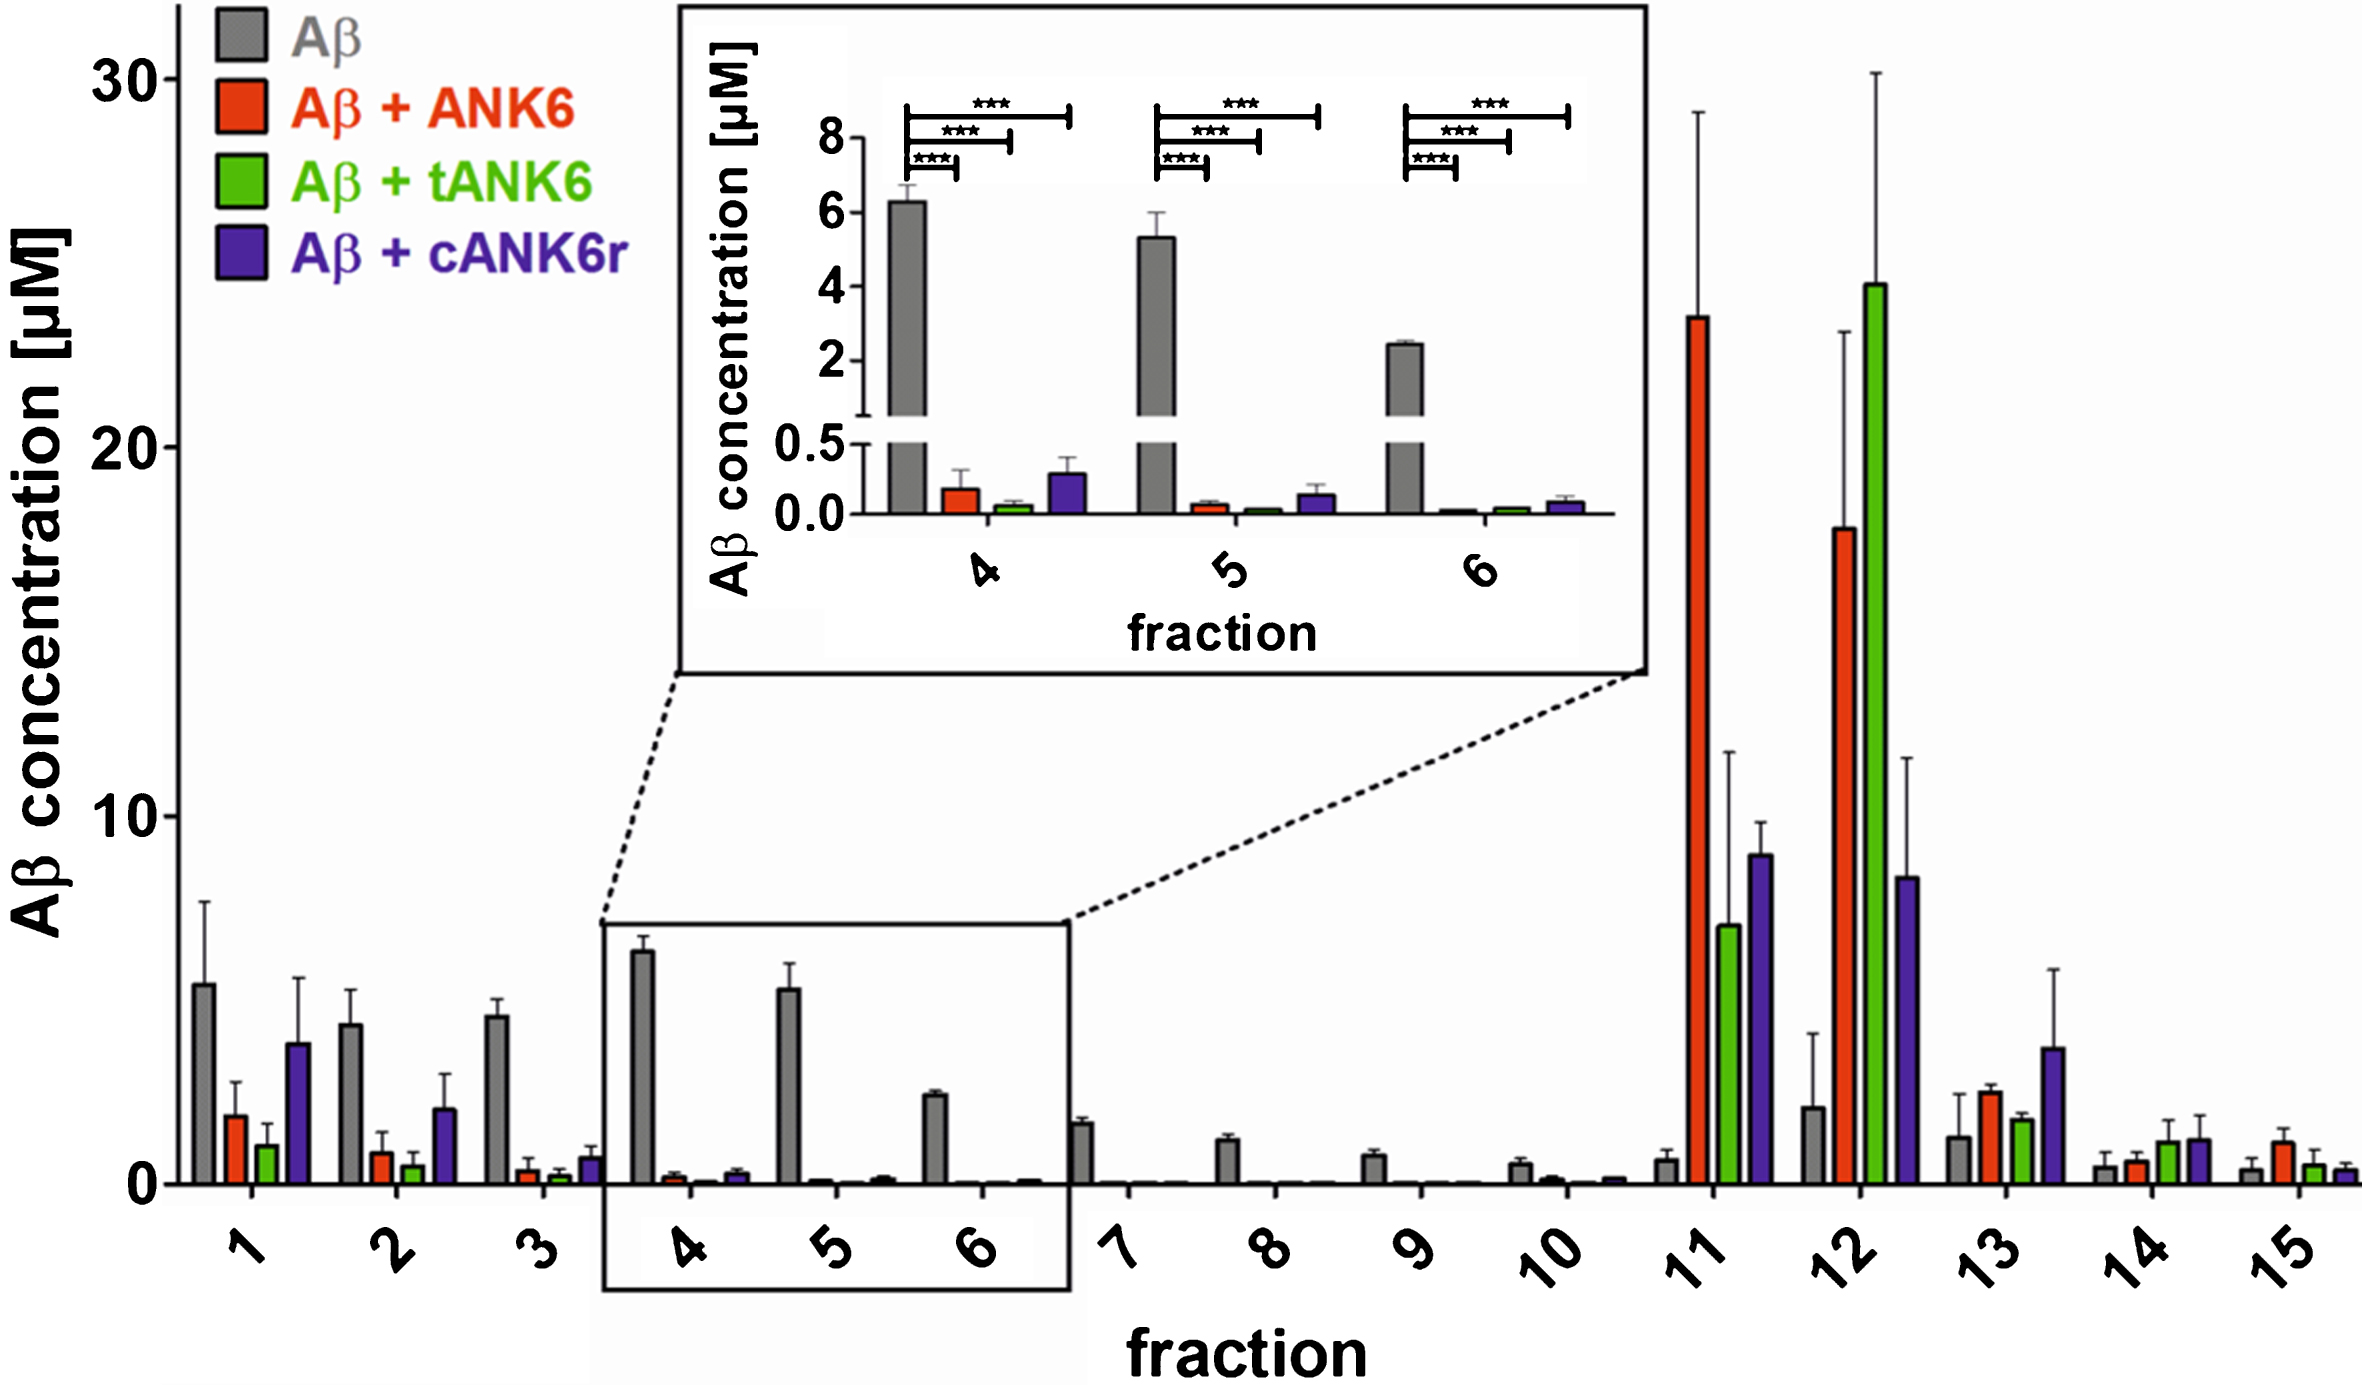
Quantitative determination of interference with Aβ aggregate size distribution (QIAD) assay. To investigate the
Preclinical pharmacokinetic characterization
Preclinical pharmacokinetic investigations were performed with ANK6, tANK6, and cANK6r in vitro and in vivo. First, affinity to the two most recurrent human plasma proteins, HSA and AGP, were determined in order to estimate the
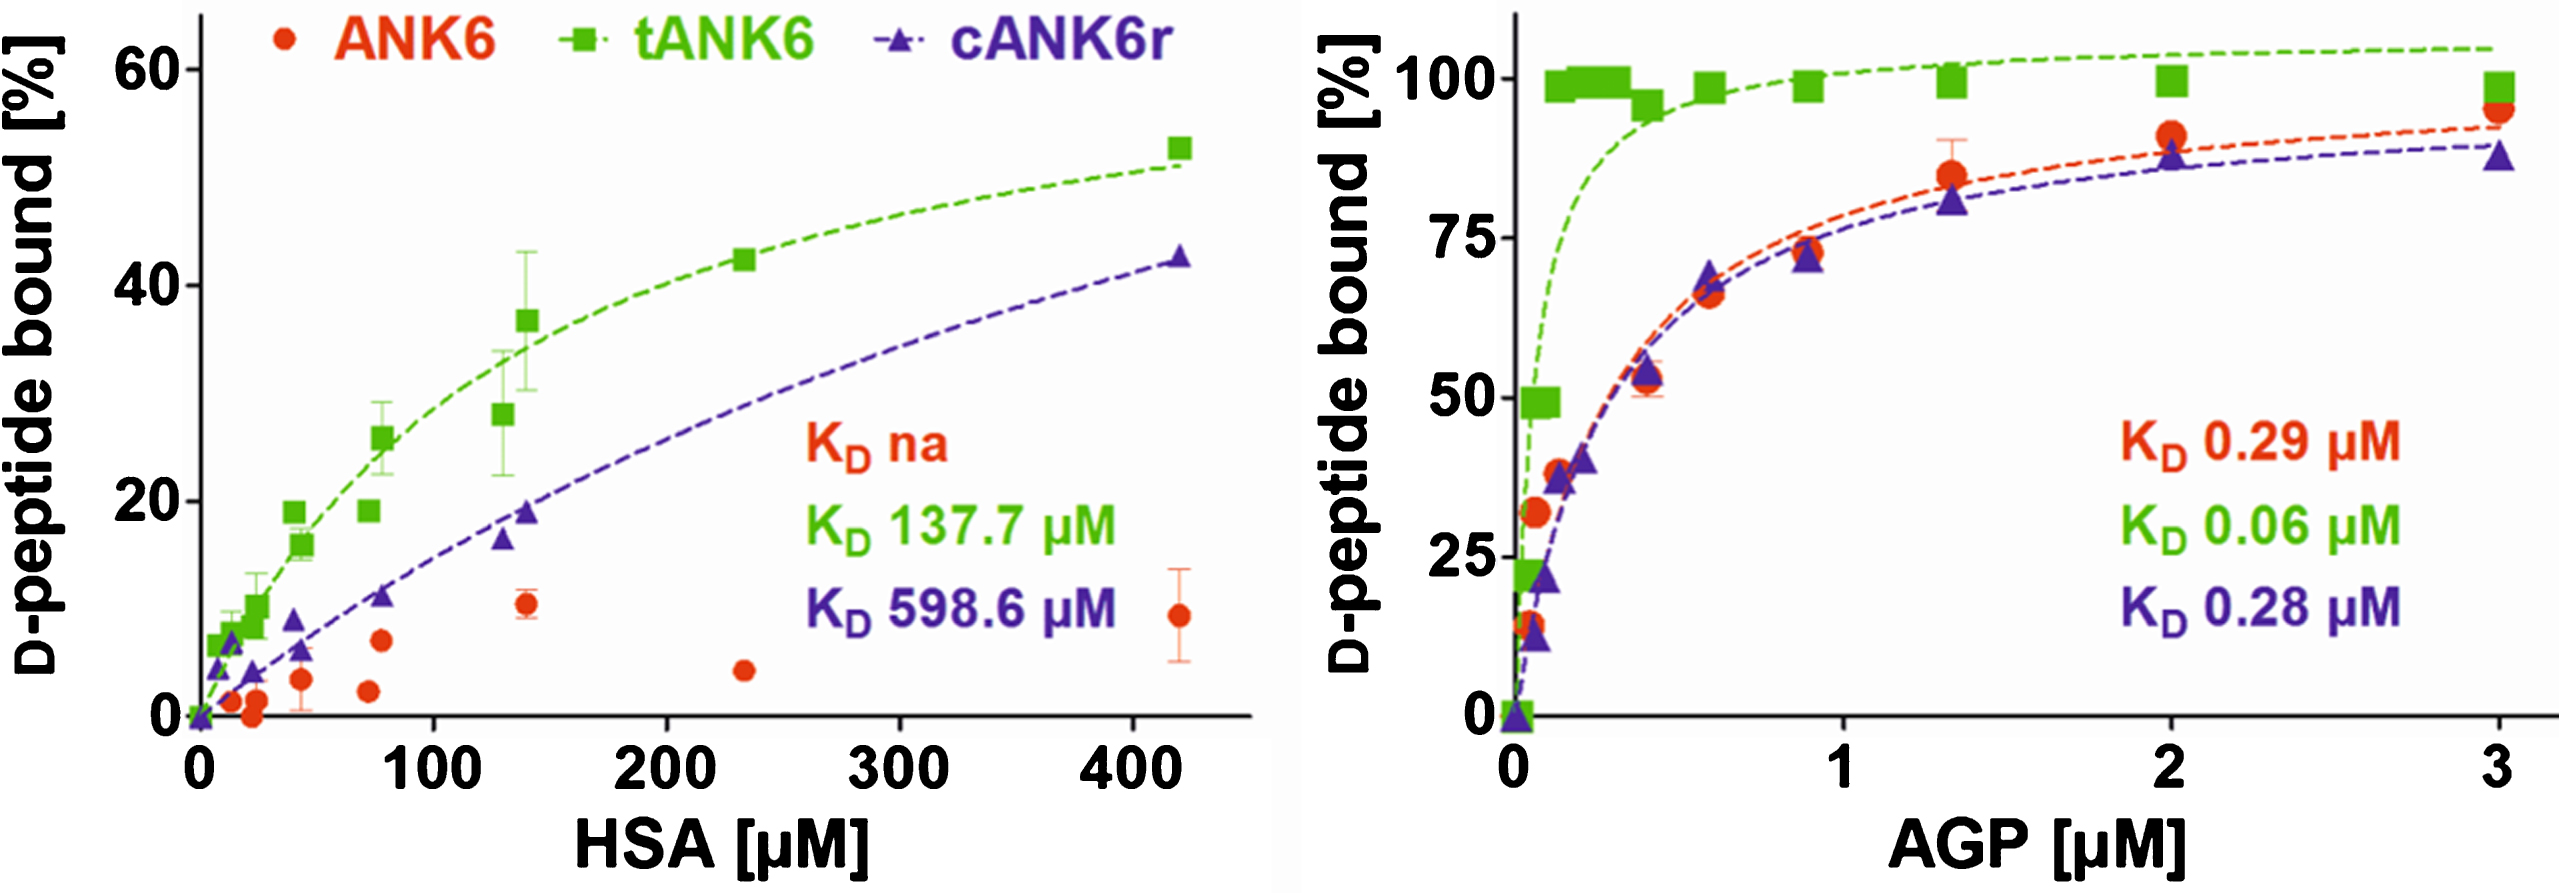
Binding to the plasma proteins HSA and AGP. ANK6’s (red circles), tANK6’s (green squares), and cANK6r’s (blue triangles) binding to the plasma proteins human serum albumin (HSA) and to α1 acid glycoprotein (AGP) was analyzed. The
Since we have shown that ANK6, tANK6, and cANK6r inhibit Aβ1 - 42 aggregation, eliminate toxic Aβ oligomers, and lower Aβ1 - 42-induced cytotoxicity, we conducted pharmacokinetic studies of these peptides via two different administration routes, intravenous (i.v.) and oral (p.o.). Concentration-time profiles of brain, plasma, liver, and kidney are presented in Fig. 5A, B, E, and F while the condensed CSF concentration-time profiles for four time points are shown in Fig. 5D. The highest
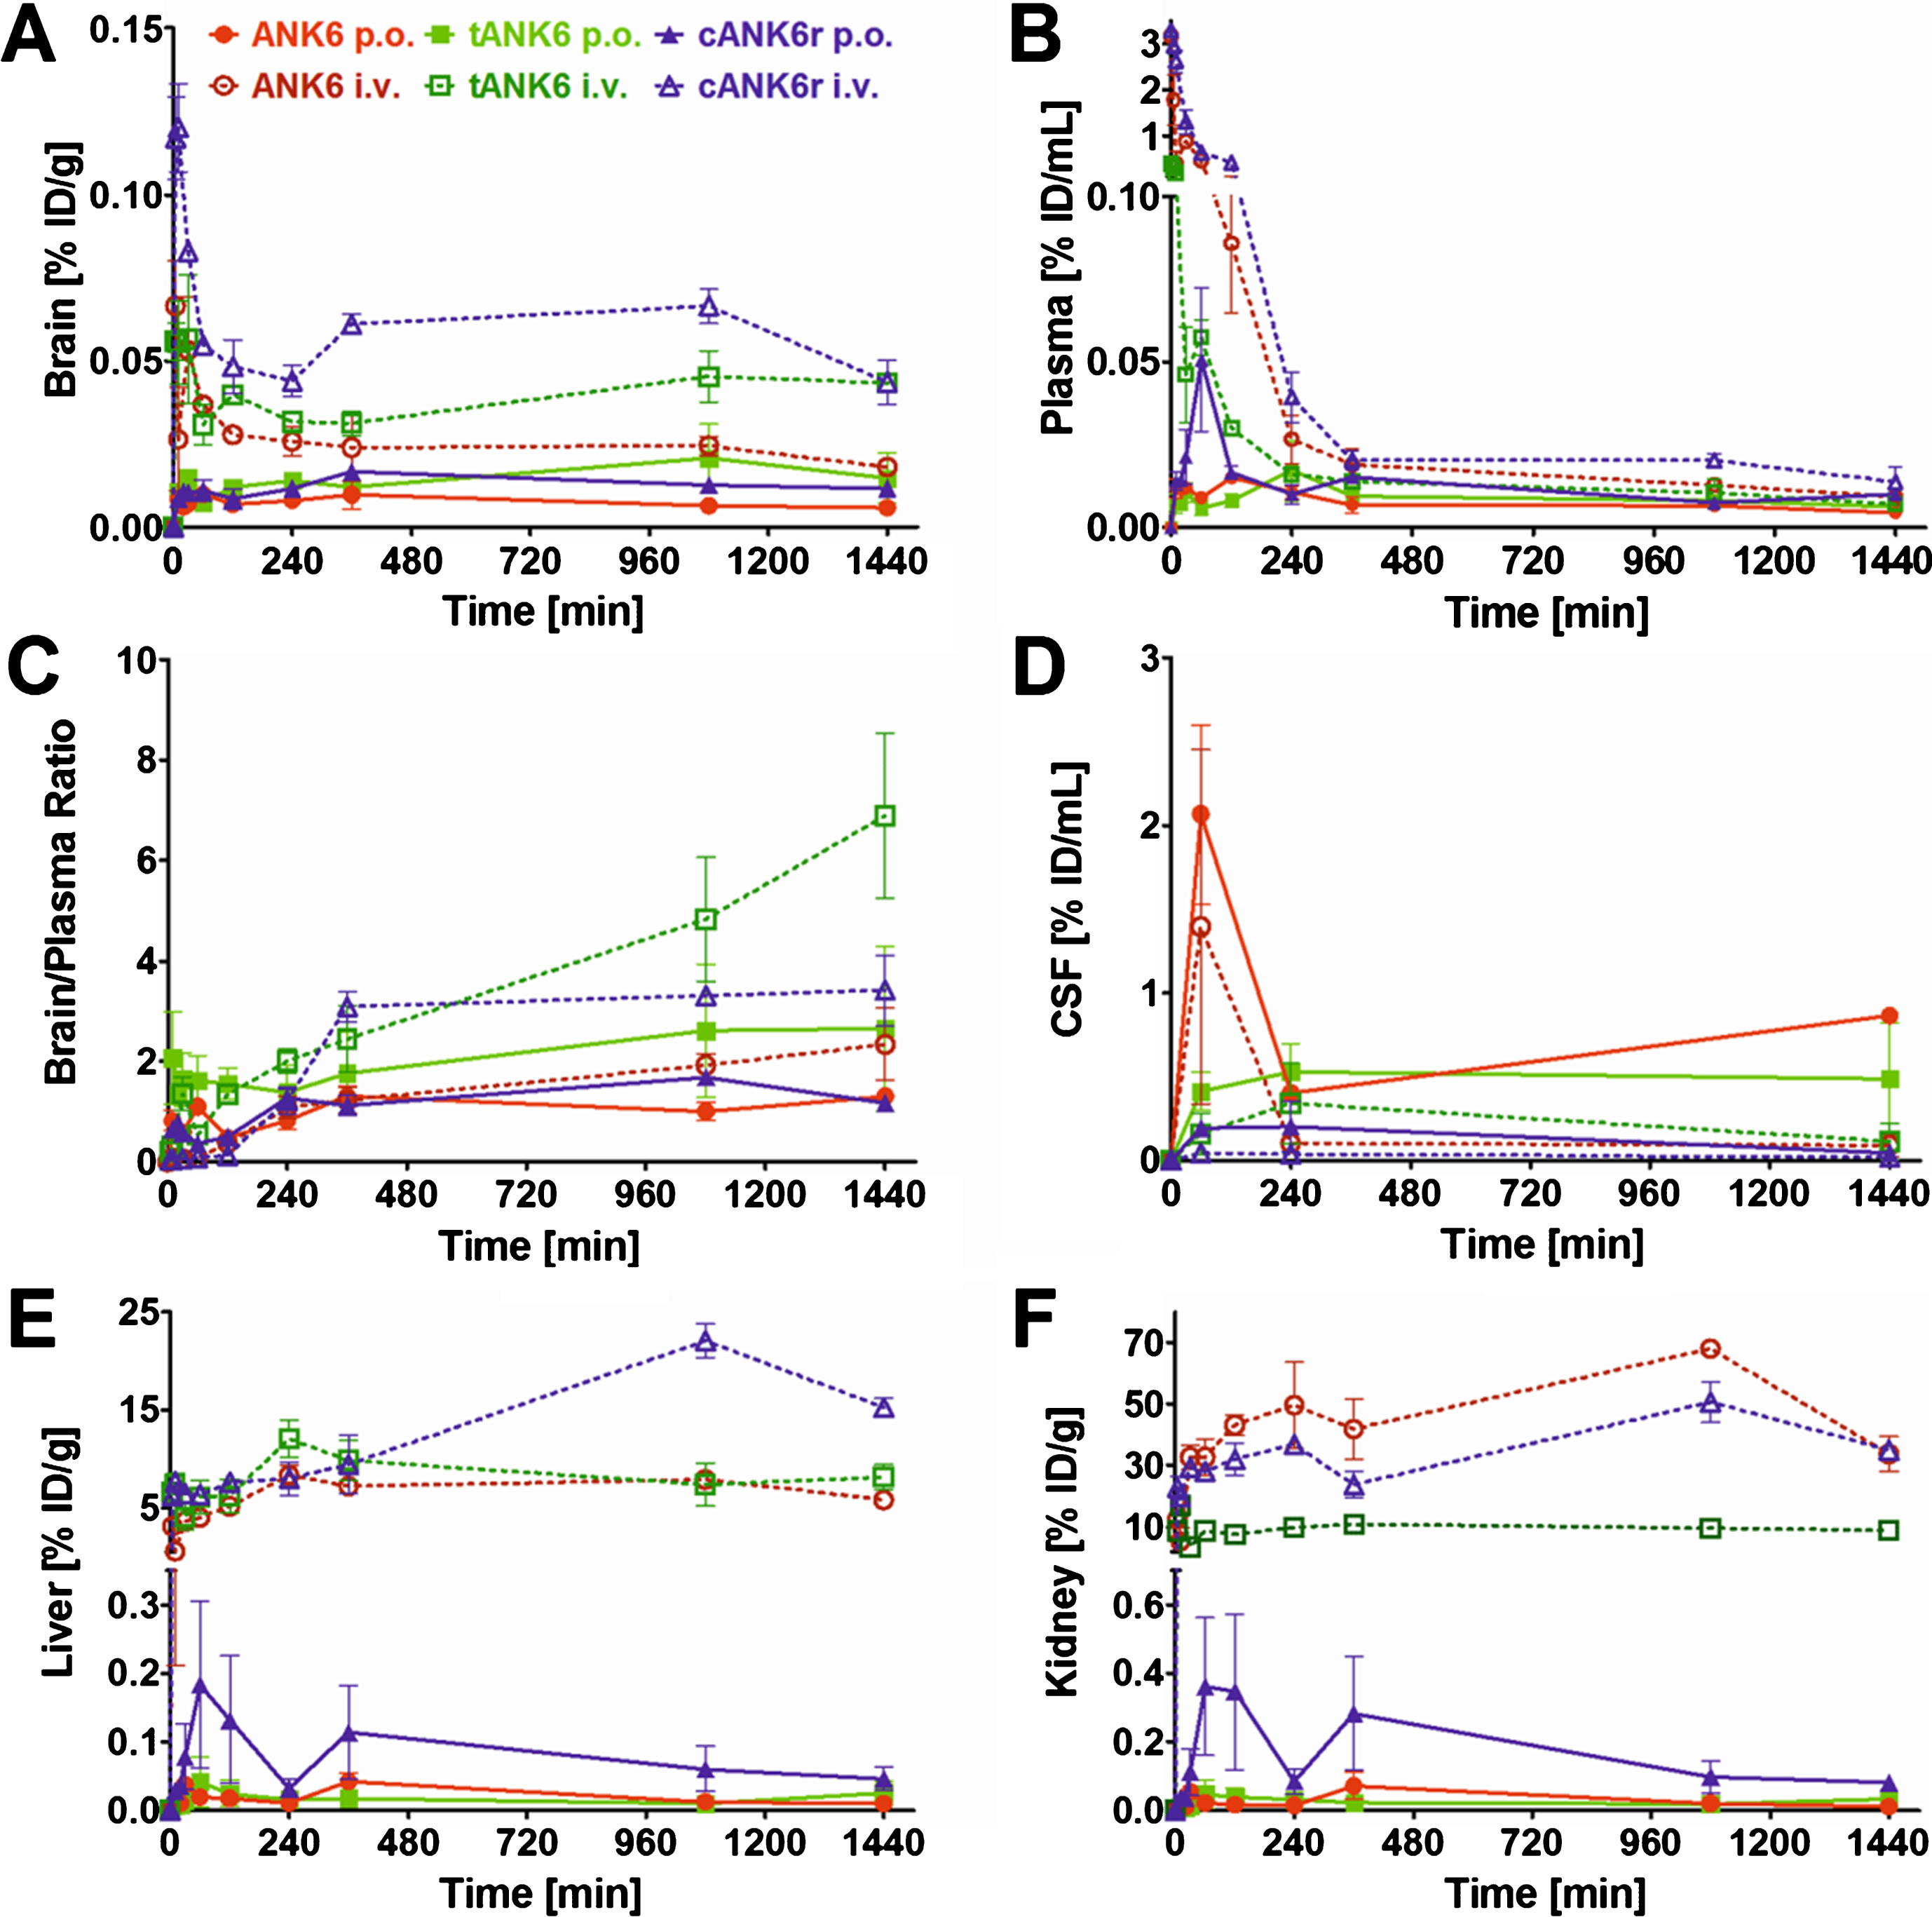
Pharmacokinetic concentration-time profiles of ANK6, tANK6, and cANK6r. Pharmacokinetic concentration-time profiles of ANK6 (red circles), tANK6 (green squares), and cANK6r (blue triangles) were investigated in brain (A), plasma (B), CSF (D), liver (E), and kidney (F) after i.v. (3.3 mg/kg, dotted lines) and p.o. (10 mg/kg ANK6 & tANK6, 15 mg/kg cANK6r, continuous lines) administration to wild type mice (3 mice/time point). The
The maximum concentrations relative to the injected dose (Cmax, % ID/mL) in plasma increased from tANK6 (i.v. 0.40, p.o. 0.02) over ANK6 (i.v. 3.17, p.o. 0.02) to cANK6r (i.v. 3.29, p.o. 0.05) while in the brain, the Cmax value (% ID/g) was dependent on the administration route. After i.v. administration, Cmax increased from tANK6 (0.06) over ANK6 (0.07) to cANK6r (0.12). After oral administration, Cmax increased from ANK6 (0.01) to tANK6 (0.02) and cANK6r (0.02).
The pharmacokinetic parameters in plasma and brain are summarized in Table 3. In plasma, compound exposure over time relative to the dose (AUC %ID,0 - 1440, min*% ID/mL) after i.v. administration was highest for the cyclic 13-mer cANK6r (181) followed by the linear 12-mer ANK6 (91.7) and finally by the linear 24-mer tANK6 (26.1). After oral administration, AUC %ID,0 - 1440 was still highest for cANK6r (17.9) but tANK6 (12.9) and ANK6 (10.8) changed the order whereby differences between the three
Pharmacokinetic parameters for ANK6, tANK6, and cANK6r in murine plasma and brain
In the brain, AUC %ID,0 - 1440 (min*% ID/g) after i.v. administration for cANK6r (85.6) was higher than for tANK6 (56.6), and for ANK6 (35.8). In contrast to the plasma values after oral administration, tANK6 (22.5) showed the highest AUC %ID,0 - 1440 followed by cANK6r (19.1) and ANK6 (11.0) in the brain. MRT in the brain was similar for all three
Calculated values of four commonly used BBB parameters, determined to allow for global comparison of any peptides’ efficiencies to cross the BBB, are listed in Table 4. The logBB value describes the blood-brain equilibrium distribution: negative logBB values result from lower AUCs in the brain than in plasma, whereas positive logBB values result from higher AUCs in the brain than in plasma. Kin describes the BBB permeability kinetics while Vi describes a peptides’ fictional (initial) distribution volume in the brain. The PS represents the uptake clearance from blood to brain. In this study, logBB values of ANK6 and cANK6r were below zero while tANK6’s logBB value was greater than zero. Regarding the graphically determined Kin and Vi values, ANK6 and cANK6r were in the same range while the values of tANK6 were increased by around factor 10. As PS was determined in consideration of a presumed CBF of 1.07 mL/(g*min) [32], values of all three
Blood-brain barrier values for ANK6, tANK6, and cANK6r after i.v. administration
DISCUSSION
The approach of Aβ oligomer elimination by
In this study, we focused on optimizing ANK6 regarding its potency to eliminate toxic Aβ oligomers as well as its pharmacokinetic in vivo characteristics by designing two derivatives. To increase the
The comparison of in vitro properties of ANK6, tANK6, and cANK6r included different experimental approaches, namely Aβ aggregation, cell viability, and QIAD assays. Thereby we could validate our assumption that tANK6 has an enhanced potency as it most efficiently inhibited the Aβ1 - 42 fibril formation with a resulting IC50 of 2.1μM as compared to ANK6 (3.6μM), cANK6r (3.7μM), and D3 (7.2μM). Additionally, one could observe that only tANK6 and ANK6 did completely inhibit Aβ1 - 42 fibril formation by two-fold molar excess with regard to Aβ whereas cANK6r and D3 needed about eight-fold molar excess. Cell viability assays, which were conducted to investigate the
In the following, PPB experiments were conducted to predict the
ANK6, tANK6, as well as cANK6r bound to AGP (KD between 0.06 and 0.29μM) much stronger than to HSA (KD of 138μM and higher). This had been expected before as all three
Summarizing the in vitro studies, cANK6r’s slight inferiorities after the Aβ aggregation inhibition and cell viability tests, possibly caused by structural hindrances due to cyclization, could be balanced by cANK6r’s very beneficial QIAD outcome in eliminating Aβ oligomers while not strongly affecting Aβ monomer levels. Nevertheless, tANK6 showed very promising results in all conducted in vitro tests, especially supporting the hypothesis that our tandem peptides do possess enhanced Aβ-targeting efficacy in vitro. As compared to the lead structure D3, the ANK peptides investigated in this study do show the same or, especially in the most important in vitro QIAD assay, even more promising results in these Aβ interaction assays. This is why we consider these
After extensive in vitro investigation of the three
Apparently, the pharmacokinetic profiles of liver and kidney revealed huge differences after i.v. and oral administration. The fact that i.v. administration was followed by far higher
Probably, huge parts of orally administered ANK6, tANK6, and cANK6r in this pharmacokinetic study were immediately excreted. Interestingly, plasma levels after i.v. and oral administration were in the same range about 6 h after administration while brain levels of the i.v. administered
Regarding pharmacokinetic parameters in plasma disclosed a bigger difference within the AUC %ID,0 - 1440 values after i.v. than after oral administration, most likely due to different uptake and accumulation characteristics in liver and kidney. These characteristics had more impact after i.v. administration, as plasma levels were initially higher. After oral administration, when most of the administered
To allow for comparability to other peptides listed in “Brainpeps: the blood-brain barrier peptide database”, four characterizing BBB values were determined (Table 4) [31]. tANK6’s logBB value (positive sign) reflected that the peptide’s drug exposure over time was greater in the brain than in plasma whereas for ANK6 and cANK6r (negative signs) it was the other way around. Thus, tANK6r seemed to have entered the brain from plasma most efficiently. However, one may not neglect that logBB values depend on binding to plasma and brain tissue as well as on active transport. Kin and Vi had been graphically determined with regard to investigate the velocity of the three
Summarized, ANK6 and its two derivatives, tANK6 and cANK6r, showed very beneficial Aβ-targeting in vitro efficacies. Analyzing the results, it became obvious that both newly developed ANK6-derivatives, tANK6 and cANK6r, had superior Aβ interacting properties as compared to ANK6. As shown already for ANK6’s predecessor peptide D3, i.v. administration led to accumulation in liver and kidney, whereas p.o. administration did not [20]. Oral bioavailabilities were with about 10% for ANK6 and cANK6r and 50% for tANK6 very high when compared with typical oral bioavailabilities of
Footnotes
ACKNOWLEDGMENTS
D.W. and K.J.L. were supported by grants from the “Portfolio Technology and Medicine”, and D.W. was additionally supported by the “Portfolio Drug Research” and the Helmholtz-Validierungsfonds of the “Impuls und Vernetzungs-Fonds der Helmholtzgemeinschaft”. The study was supported by the TT-Fonds of the Technology Transfer Department of the Forschungszentrum Jülich.