
Abstract
Background:
A previous Cochrane systematic review concluded there is insufficient evidence to support the routine use of 18F-FDG PET in clinical practice in people with mild cognitive impairment (MCI).
Objectives:
To update the evidence and reassess the accuracy of 18F-FDG-PET for detecting people with MCI at baseline who would clinically convert to Alzheimer’s disease (AD) dementia at follow-up.
Methods:
A systematic review including comprehensive search of electronic databases from January 2013 to July 2017, to update original searches (1999 to 2013). All key review steps, including quality assessment using QUADAS 2, were performed independently and blindly by two review authors. Meta-analysis could not be conducted due to heterogeneity across studies.
Results:
When all included studies were examined across all semi-quantitative and quantitative metrics, exploratory analysis for conversion of MCI to AD dementia (n = 24) showed highly variable accuracy; half the studies failed to meet four or more of the seven sets of QUADAS 2 criteria. Variable accuracy for all metrics was also found across eleven newly included studies published in the last 5 years (range: sensitivity 56–100%, specificity 24–100%). The most consistently high sensitivity and specificity values (approximately ≥80%) were reported for the sc-SPM (single case statistical parametric mapping) metric in 6 out of 8 studies.
Conclusion:
Systematic and comprehensive assessment of studies of 18FDG-PET for prediction of conversion from MCI to AD dementia reveals many studies have methodological limitations according to Cochrane diagnostic test accuracy gold standards, and shows accuracy remains highly variable, including in the most recent studies. There is some evidence, however, of higher and more consistent accuracy in studies using computer aided metrics, such as sc-SPM, in specialized clinical settings. Robust, methodologically sound prospective longitudinal cohort studies with long (≥5 years) follow-up, larger consecutive samples, and defined baseline threshold(s) are needed to test these promising results. Further evidence of the clinical validity and utility of 18F-FDG PET in people with MCI is needed.
Keywords
INTRODUCTION
The diagnosis of probable Alzheimer’s disease (AD) has classically been based on clinical criteria and postmortem confirmation of AD [1]. The reconceptualization of AD as a disease continuum [2]— with a long asymptomatic phase followed by a symptomatic phase of progressive cognitive decline before the onset of functional impairment and overt dementia— has led to a shift towards identifying AD at an earlier stage, before patients have crossed the threshold into dementia [3].
Clinical subtypes of mild cognitive impairment (MCI) have been regarded as prodromal forms of a variety of dementias [4]. There are four outcomes for patients with MCI: progression to AD dementia type, progression to another dementia, maintaining stable MCI, or recovery. Studies [5–8] indicate that an annual average of 10% to 15% of people with MCI progress to AD dementia. Discriminating between patients who will and will not progress to dementia due to AD is critical in the context of care and future therapies [9].
18F-FDG PET provides information about neuronal activity at tissue level by measuring regional cerebral glucose metabolic rate (CGMr). Glucose hypometabolism in the temporo-parietal lobe and posterior cingulate cortex, as assessed by 18F-FDG PET, signals a pattern of neuronal loss and synaptic dysfunction typically found in AD dementia [10, 11]. 18F-FDG PET is a valued biomarker test in the early, confirmatory diagnostic arsenal of AD dementia[12, 13].
For MCI, the 18F-FDG PET pattern is not consistent and usually presents as mild global and regional hypometabolism in patients diagnosed with MCI in research settings [14]. Nevertheless, several 18F-FDG PET studies in MCI patients have found characteristic and progressive CGMr reductions in particular AD-vulnerable regions, suggesting that certain findings on brain PET scans can potentially predict progression of MCI to AD dementia [15–18].
A previous Cochrane review (published in 2014 based on searches to 2013) [19] concluded that the evidence from studies (n = 16) published over a 14-year period shows variability in prognostic performance of 18F-FDG PET, and was insufficient to support the routine use of 18F-FDG PET in clinical practice in people with MCI. This conclusion was challenged [20] in light of further published studies and some concerns were expressed regarding study design, data analysis procedures, and lack of adequate and validated image analysis approaches in included studies.
This paper fully updates the original review, including studies published over the last five years, and maintains the same robust methodological approach. The main objectives are to: 1) reassess the accuracy and reliability of 18F-FDG-PET for conversion from MCI to AD dementia in light of the quality and quantity of the most recent evidence; 2) include an assessment of prognostic value among different metrics; 3) provide research recommendations to further strengthen the evidence base and move towards routine clinical utility.
MATERIALS AND METHODS
Search strategy and selection criteria
This is a systematic review of diagnostic test accuracy (DTA) studies that applied the same search strategy and methodology as the original Cochrane 18F-FDG-PET review [19], unless otherwise specified. Methods followed those of the Cochrane Handbook for DTA studies (http://methods.cochrane.org/sdt/handbook-dta-reviews).
Searches were conducted of electronic databases from January 2013 to July 2017 to update the original Cochrane review [19] (Supplementary Table 1). No language restrictions or search filters were applied [21]. Two review authors (NS, LL) independently screened references and examined reference lists of any relevant studies and systematic reviews to identify additional studies, and independently extracted data. Differences were resolved by discussion.
Study design
Prospective longitudinal, nested case-control cohort studies and cohorts that analysed data retrospectively were eligible if they contained sufficient data to construct two-by-two tables expressing 18F-FDG-PET results by disease status.
Both short and long periods of observation are needed to understand the role of biomarkers in predicting cognitive decline in people with MCI [22] and assess their accuracy. Because a ‘short’ follow-up interval has been defined as at least two years by some [23–25], and as one– three years by others [26], this review included studies with one year as the minimum period of follow-up for diagnostic verification. Cross-study variability in test accuracy according to follow-up intervals could not be examined due to insufficient number of studies.
Participants
Participants with MCI recruited from any setting were eligible if studies used the Petersen criteria [4, 27], or any of the classifications to describe MCI syndrome in Matthews et al. [28]. These broad definitions of MCI were applied in order not to exclude any study based only on criteria for MCI, and to assess the accuracy of 18F-FDG scans in identifying a feature of AD pathology in people with cognitive impairment [29].
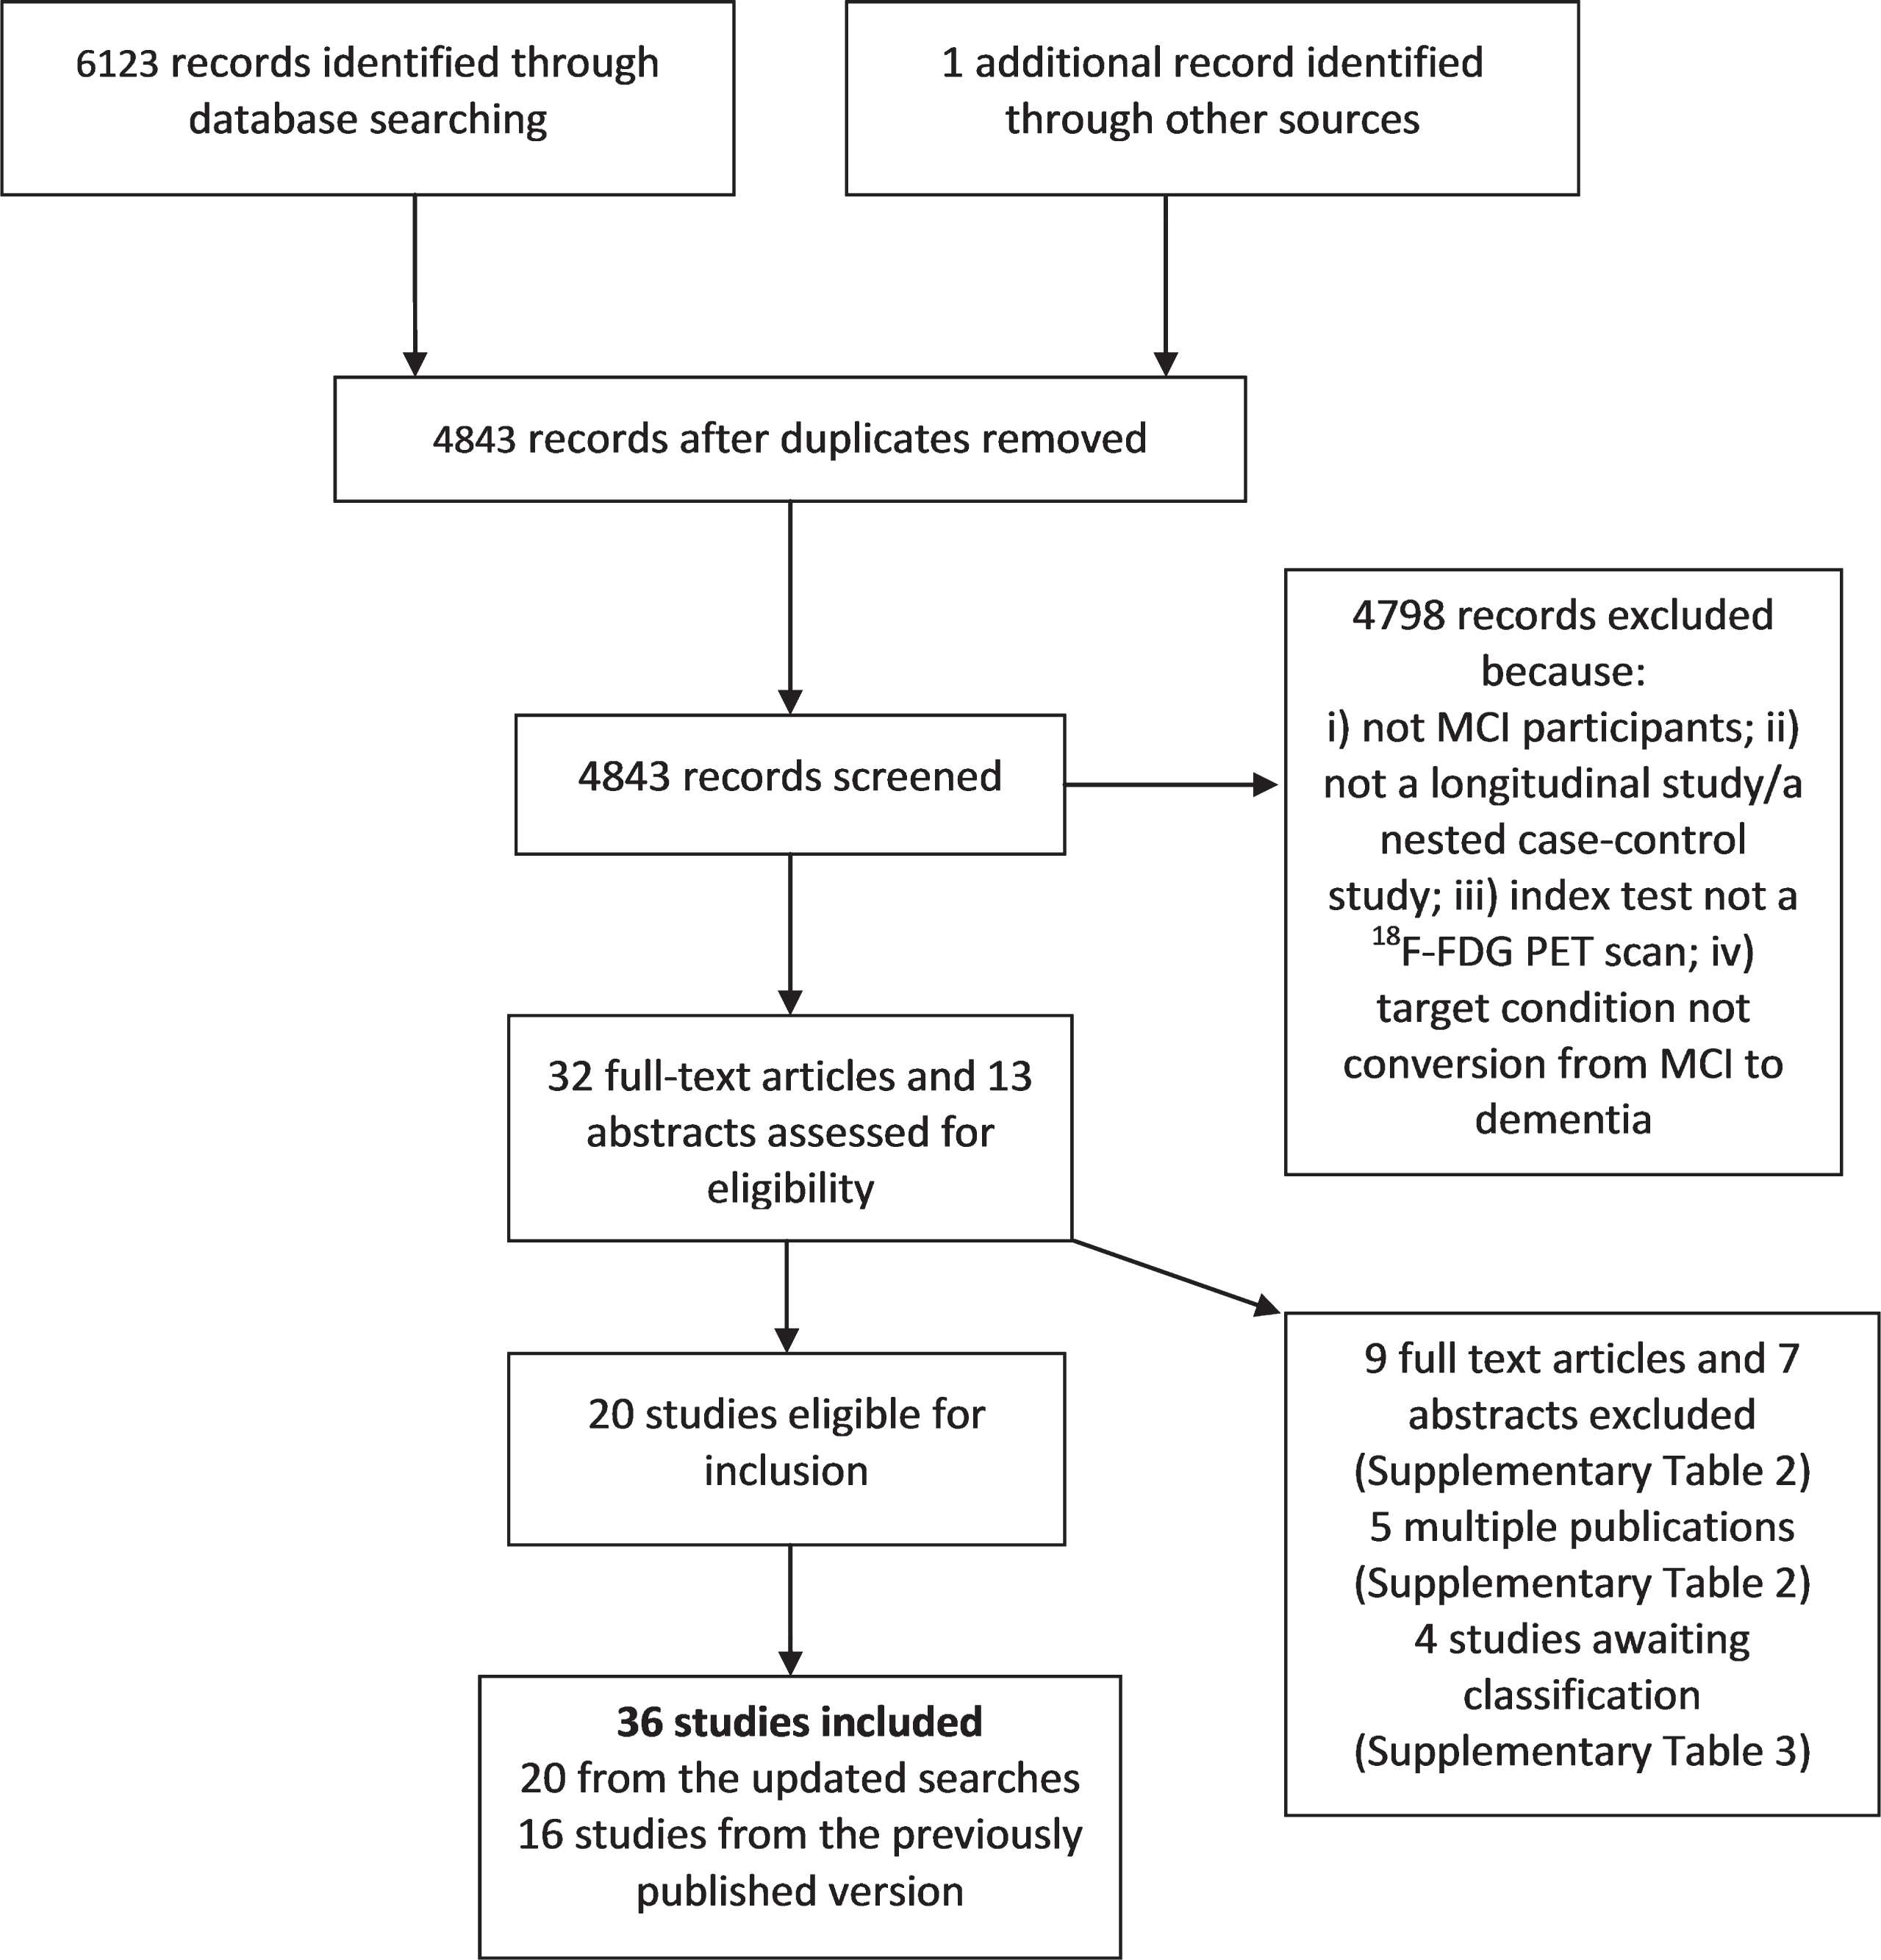
Study selection from the updated search.
Analytical method/ metric for 18F-FDG PET
Which standardization approaches (i.e., semi-quantification methods, observer-independent analyses, identification of cut-off values) are appropriate for best predictive value of 18F-FDG PET at MCI stage are still a matter of debate [20]. Recent literature [13–30] suggests that a quantitative approach is preferable and describes a number of tools that are widely used for automated FDG PET analysis, for instance: 1) Statistical Parametric Mapping (SPM); 2) three-dimensional Stereotactic Surface Projection (3-D-SSP) statistics (Neurostat); 3) AD t-sum implemented in PMOD, etc. However, there are currently neither generally accepted standards to define a 18F-FDG abnormality threshold nor a preferred and widely accepted metric; therefore, studies are included irrespective of analytical method.
Target condition/outcome
Rates of conversion were based on clinical assessment. The target condition was conversion to clinically diagnosed AD dementia. Studies that applied the probable or possible National Institute of Neurological and Communicative Disorders and Stroke and Alzheimer’s Disease and Related Disorders Association (NINCDS-ADRDA) criteria [1] or other widely used clinical criteria for AD dementia [31, 32] are included.
Exclusion criteria
Studies were excluded if they focused on people with a secondary cause for cognitive impairment, namely: 1) current use or history of alcohol/drug abuse; 2) central nervous system trauma, tumor, or infection; 3) other neurological conditions, e.g., Parkinson’s or Huntington’s diseases.
Extraction of data from individual studies
Data was extracted on study characteristics, PET acquisition, analytical approach, data for two-by-two tables, and methodological quality. Some study authors were contacted to obtain data for creating two-by-two tables and/or missing data and/or data for quality assessment. RevMan 5.3 software (Cochrane Collaboration) [33] was used for data collection and management.
Data analysis
The accuracy of 18F-FDG was evaluated according to the target condition. Data in the two-by-two tables (binary test results cross-classified with the binary reference standard) (Cochrane Handbook, http://methods.cochrane.org/sdt/handbook-dta-reviews) were used to calculate sensitivities and specificities, with 95% confidence intervals. Exploratory analyses were conducted by plotting estimates of sensitivity and specificity from each study on forest plots. As included studies used a wide range of thresholds, it was inappropriate to meta-analyse pairs of sensitivity and specificity using a bivariate random-effect approach [34], as first intended. Instead, a summary of exploratory analyses is provided.
The intention was to investigate, using subgroup and sensitivity analyses, the effect of 1) analytical approach (metric), 2) pre-specification of threshold, and 3) study design on the diagnostic accuracy of the 18F-FDG PET index test. The plan was to also explore the impact of 1) duration of follow-up, 2) MCI diagnostic criteria, 3) clinical setting, and 4) type of reference standard on the summary estimates. However, for the reasons described above, a meta-analysis was not feasible. Had a meta-analysis been possible, our plan had been to perform meta-regression by including each potential source of heterogeneity as a covariate in order to formally assess their effects on any summary accuracy estimates.
Quality assessment
Methodological quality was assessed using Quality Assessment of Diagnostic Accuracy Studies (QUADAS 2) [35] independently by two review authors (NS, SK) resolving disagreement by further review and discussion, alongside an arbitrating third reviewer, when necessary. The QUADAS 2 tool is made up of seven criteria organized around four domains: 1) Participant selection; 2) Index test; 3) Reference standard; 4) Participant flow. Full details of the questions to assess these domains for risk of bias are presented in Supplementary Table 4.
RESULTS
Search results
Accuracy figures of 18F-FDG PET for conversion from MCI to AD dementia at study level
18F-FDG PET, fluorine-18-2-fluoro-2-deoxy-D-glucose positron emission tomography; MCI, mild cognitive impairment; aMCI, amnestic MCI; snaMCI, single non-amnestic MCI; AD, Alzheimer’s disease; 3D-SSP, three-dimensional stereotactic surface projection; sc-SPM, single-case statistical parametric map; SUVr, standardized uptake value ratio; ROI, region of interest; VROI, volumetric region of interest; HCI, hypometabolic convergence index; TOMC, Transitional Outpatient Memory Clinic; SVM, support vector machine.
18F-FDG PET positive relates to hypometabolism in brain region exceeding a certain threshold.
No overlap between participants in those two studies (Email from Dr. Perani).
ADNI study, Alzheimer’s Disease Neuroimaging Initiative cohort. Notes: All 24 studies used quantitative/semi-quantitative methods. Two studies (Grimmer 2016; Ito 2015) applied two different metrics.
Assessment of the accuracy of 18F-FDG-PET for conversion from MCI to AD dementia
We included 36 studies overall: 16 studies [16, 55–68] from the original review [19] and 20 from the updated search, of which 12 (3 ‘old’ and 9 ‘new’) [36, 68] analysed data from participants from the same Alzheimer’s Disease Neuroimaging Initiative (ADNI) cohort (Supplementary Tables 4 and 5). To avoid participant double counting only one (new) ADNI study [45] is included in the exploratory analysis for conversion; this study had the largest sample size. One study [38] assessed conversion to AD dementia combined with frontotemporal dementia and dementia with Lewy bodies (LBD). In total, 24 studies were included in the exploratory analysis for conversion to AD dementia (Table 1). Demographic and patient characteristics of MCI participants and information on index test are shown in Supplementary Tables 6 and 7. The majority of studies (21/24) used the Petersen criteria for MCI. Responses from contacted authors (n = 26) are presented in Supplementary Table 4.
Individual study estimates of sensitivity and specificity are shown in Figs. 2 and 3 and Table 1. Overall, when studies were examined across all metrics (n = 24), sensitivity values ranged from 25–100% while specificity values ranged from 15–100%. In the eleven newly identified studies, sensitivity values ranged from 56–100% and specificity from 24–100%. The best values are reported for sc-SPM metric in four new studies; sensitivity values ranged from 77–100% and specificity from 74–100%. In addition to the accuracy of the test for conversion to AD dementia, seven of 24 studies also assessed the accuracy of the test for conversion to AD dementia plus other types of dementia, mainly frontotemporal dementia and LBD (Supplementary Table 8).
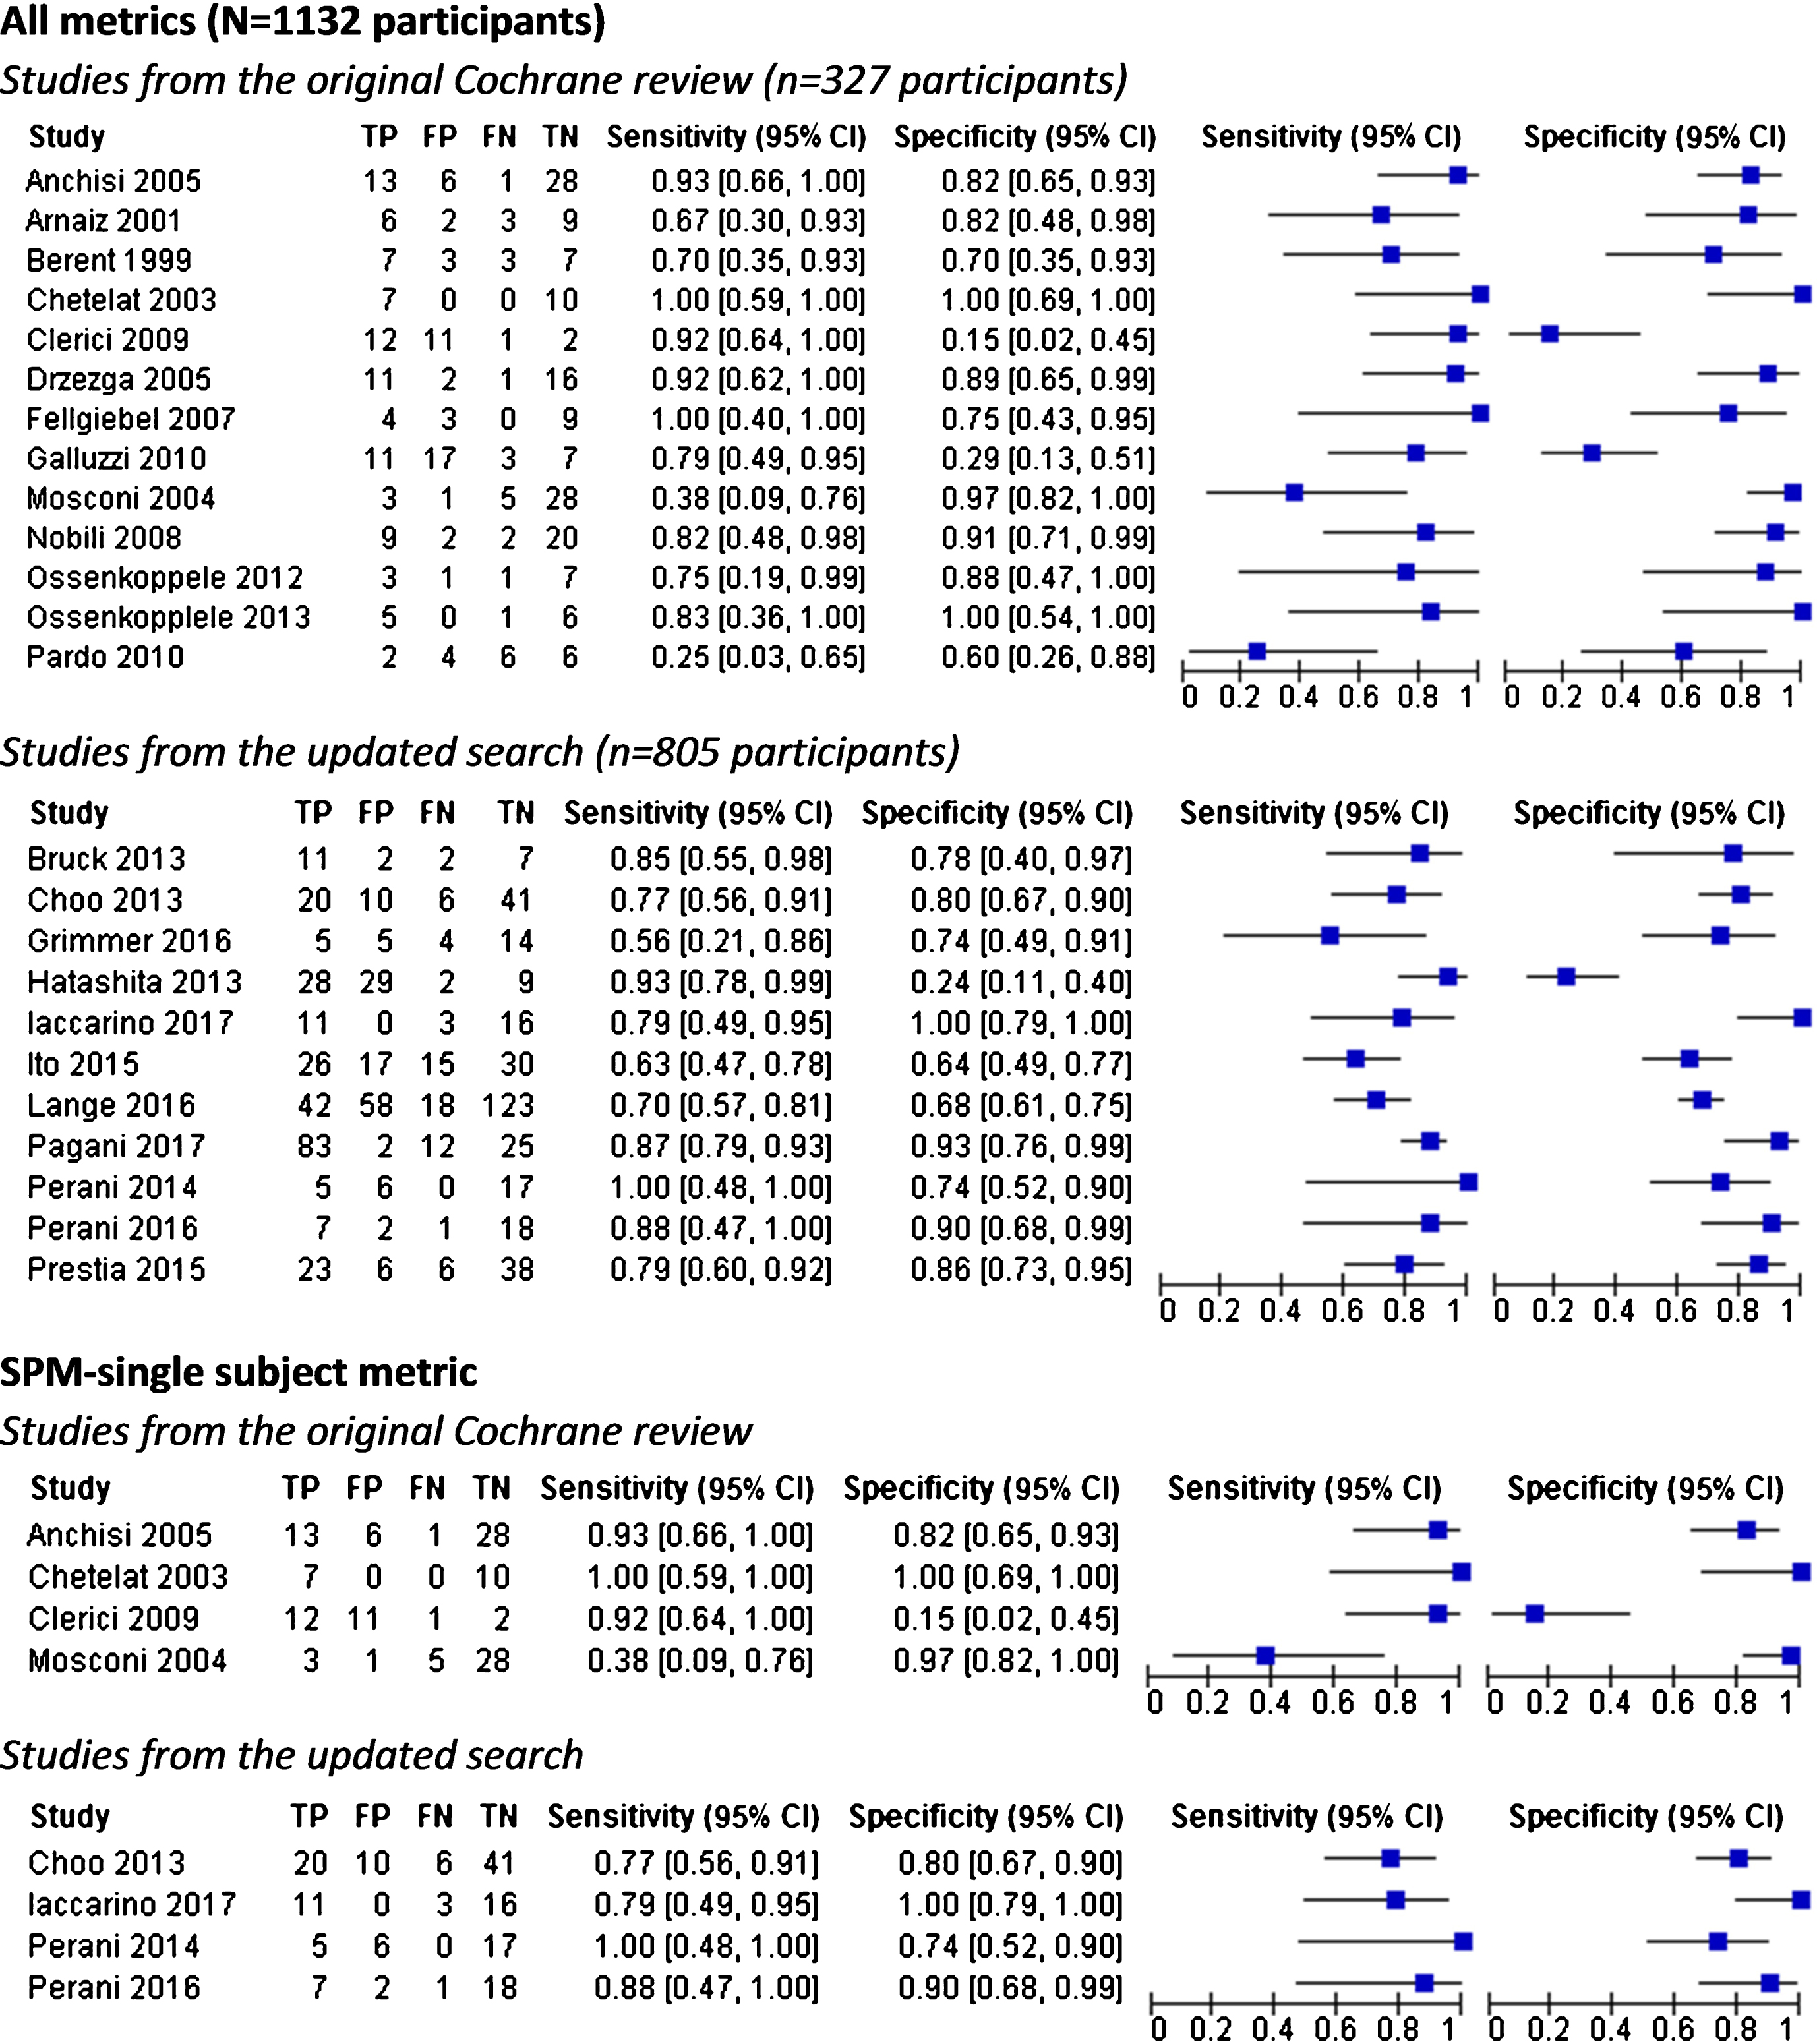
Forest plots of 18F-FDG PET for conversion from MCI to Alzheimer’s disease dementia.
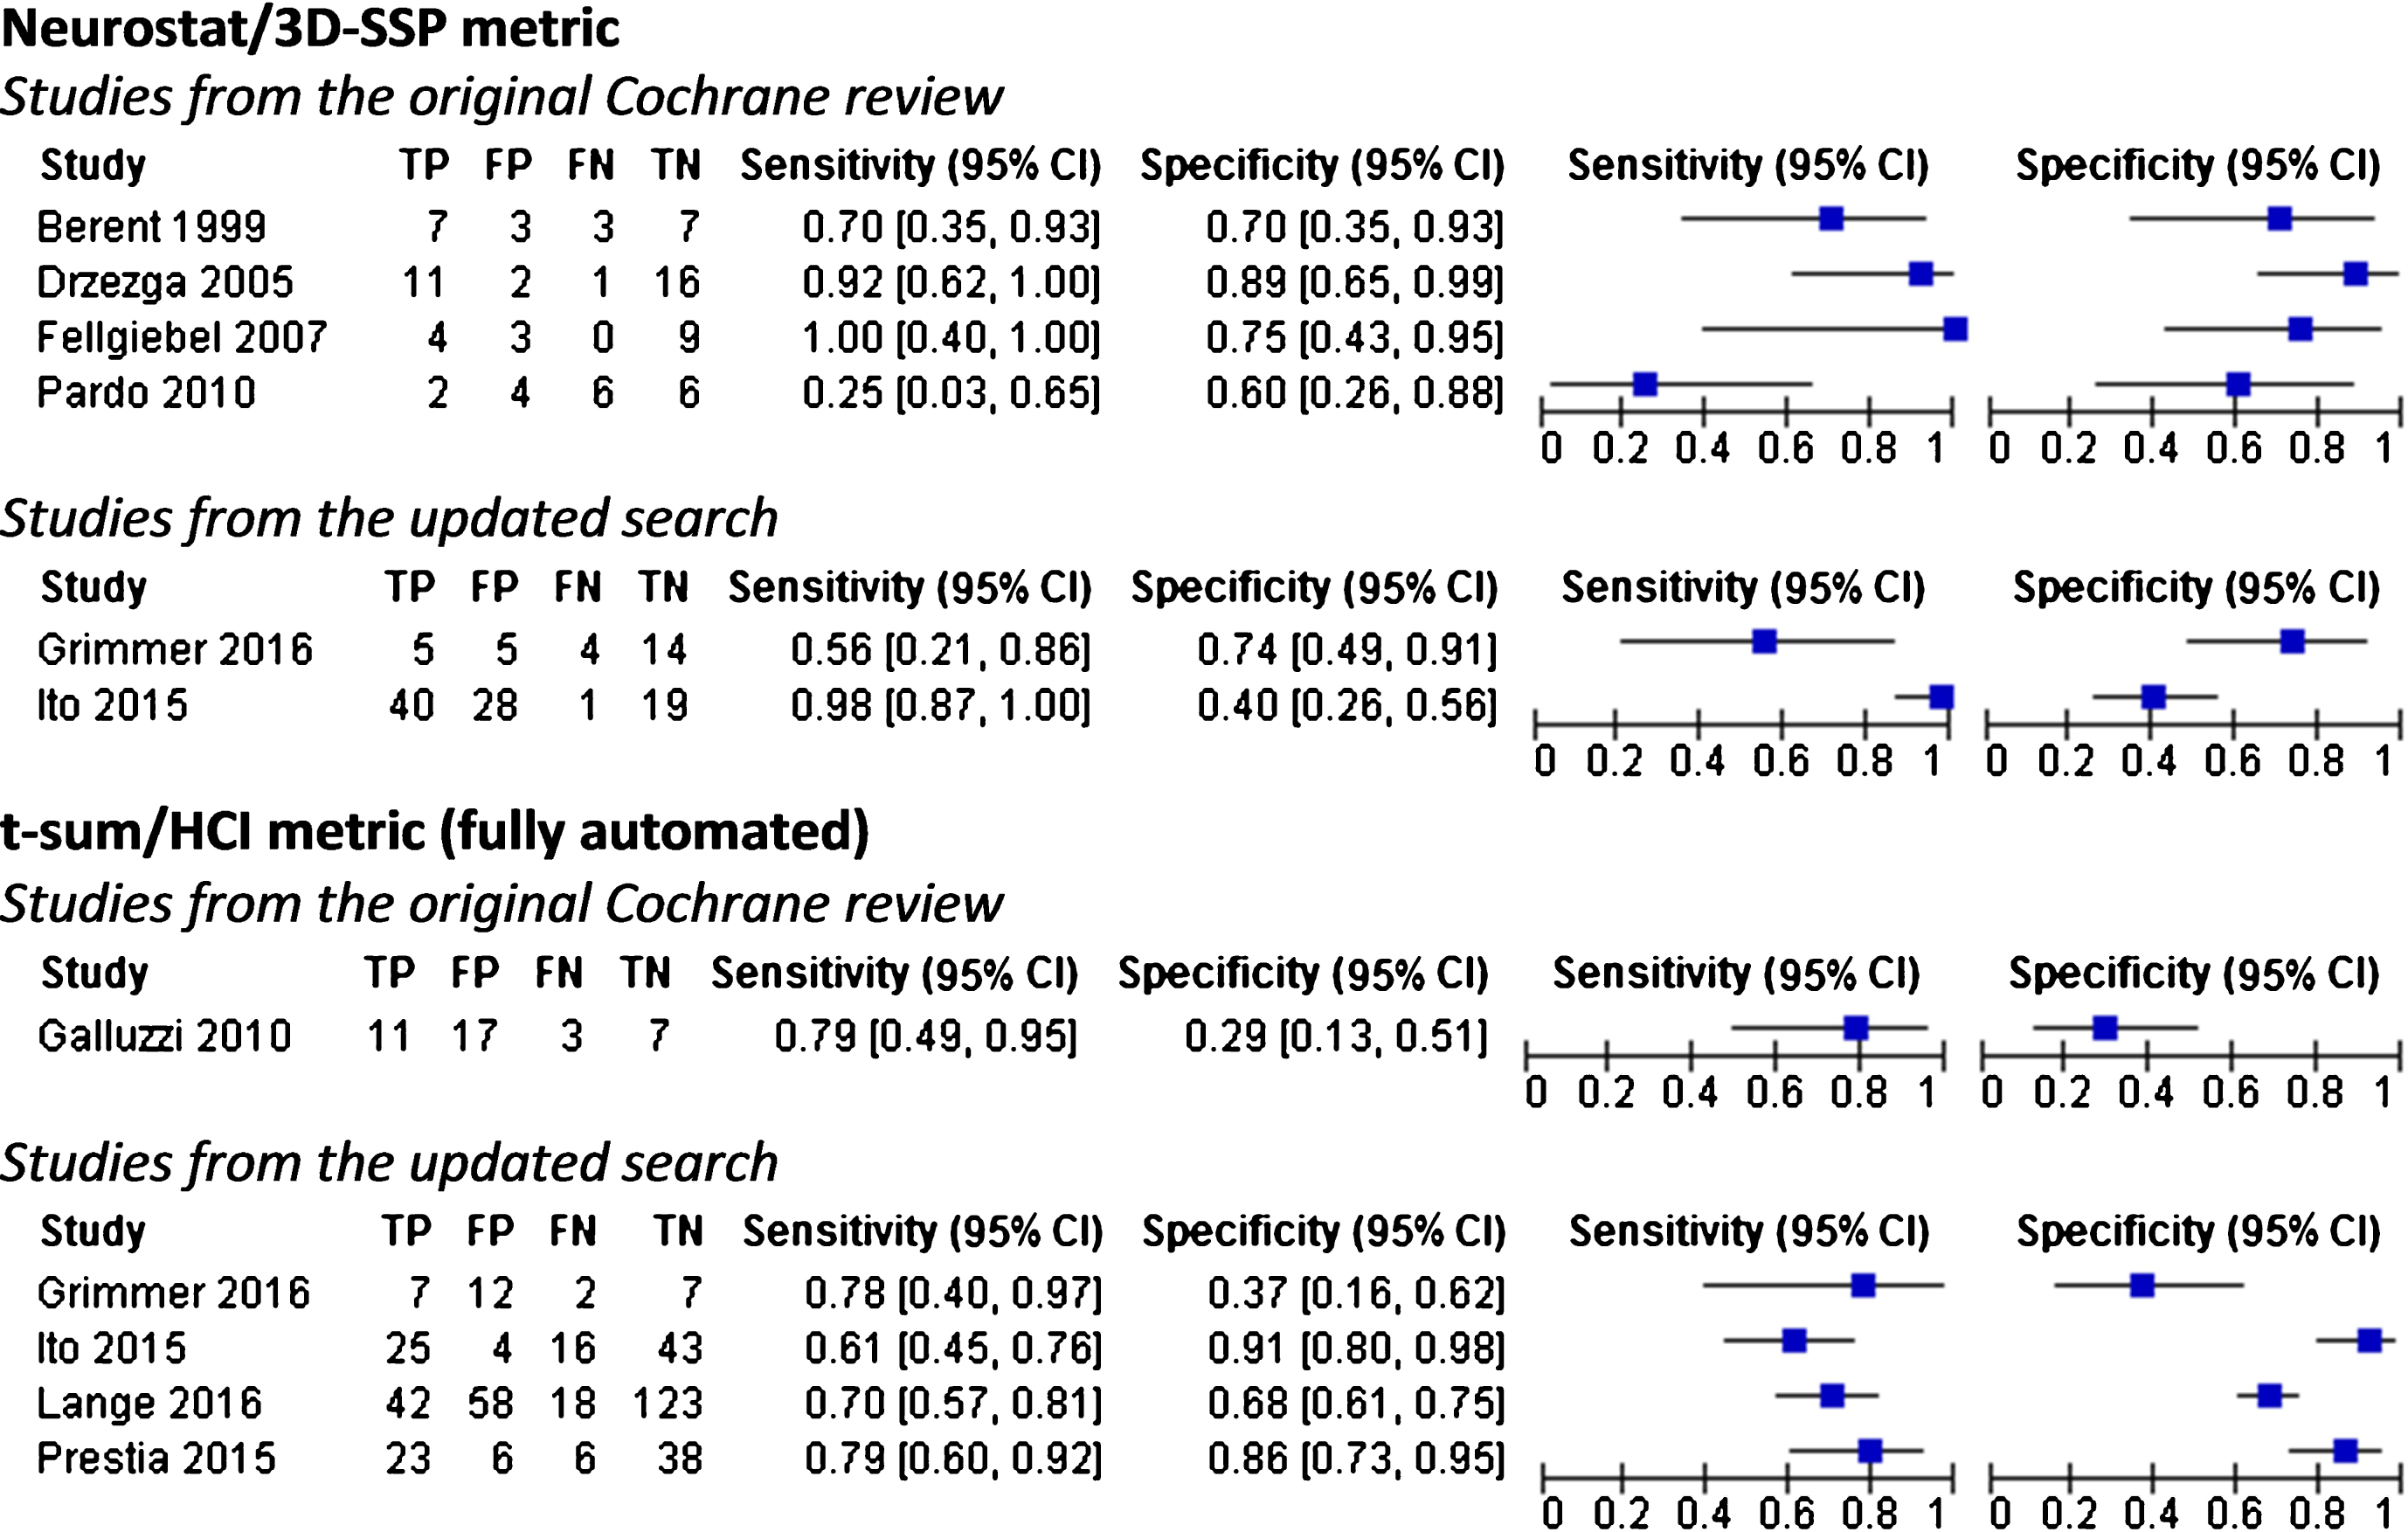
Forest plots of 18F-FDG PET for conversion from MCI to Alzheimer’s disease dementia.
Metrics
All 24 studies included in the exploratory analysis used quantitative/semi-quantitative methods. We have grouped studies according to the metric used and reported the predictive accuracy of 18F-FDG PET for conversion to AD dementia at study level (Table 1). None of the included studies compared different validated analytical tools in the same research participants.
Eighteen studies used only computer aided visual read metrics (sc-SPM = 8; Neurostat/3-D-SSP = 6; SUVr/ROI = 4); three [45, 60] used only fully automated metrics; two used both approaches [24, 44]; two [46, 64] used principal component analysis on volume region of interest (VROI), and one [66] used a combination of SUVr images and t-sum. The highest values for both sensitivity and specificity (approximately ≥80%) were achieved in six out of eight (2 ‘old’ and 4 ‘new’) that used the sc-SPM metrics [16, 55]. However, only one of these studies has a sample size above 50 participants and duration of follow-up of two years or longer [39]. For fully automated metrics, sensitivity values ranged from 61–79% while specificity values ranged from 29–91%. Three studies [44–45, 50], using these automated metrics, had a sample size above 50 participants and duration of follow-up two years or longer, but only one reported values for both sensitivity and specificity approximately ≥80% [50]. Supplementary Table 4 (Index test sections) shows how these studies differ in analytical and image analysis approaches.
ADNI studies
The results from ADNI studies are reported separately to illustrate the accuracy of 18F-FDG PET as a single test amongst studies that analysed data from the same cohort (Table 2). At the study level the sensitivity values ranged from 10–92% and the specificity values ranged from 55–97%. Values for both sensitivity and specificity were approximately ≥80% in only three studies [40, 52], of which two used the sc-SPM metric.
Supplementary Table 5 shows that all studies applied a retrospective analysis of longitudinal data for ‘MCI-converters’ and ‘MCI-stable’. Sample sizes ranged from 50–241 participants. Duration of follow-up averaged two-three years; in four studies [40, 51] participants were followed-up for four years or longer. Most of the included studies used a validated voxel-based analysis method of 18F-FDG PET imaging [13].
The conclusions in ADNI studies differed. For instance, it is reported that for a single biomarker, when compared to other biomarkers, the best accuracy was obtained using 18F-FDG PET [40]. However, 11C-PIB PET generated the best sensitivity, and 18FDG PET the lowest sensitivity in Trzepacz et al. [53]. PET score using 18F-FDG PET predicted clinical progression from MCI to AD dementia with a higher accuracy than Mini-Mental State Examination and Alzheimer’s Disease Assessment Scale cognitive subscale [49]. In contrast, cognitive markers were more robust predictors than biomarkers [41].
Quality assessment using QUADAS 2
QUADAS 2 scores for each domain are shown in Fig. 4 and further assessment details for studies included in the exploratory analyses are shown in Supplementary Table 4. Assessment of methodological quality was hampered by poor reporting and lack of details. Areas of particular concern for risk of bias were around Patient Selection and Index Test domains. Poor reporting about sampling procedure led mainly to unclear risk of bias or contributed to high risk of bias in the participant selection domain. For the Index test domain, eleven studies were of poor methodological quality and at high risk of bias due to lack of pre-specified threshold. Although the reference standard was regarded as adequate to correctly classify the target condition, poor reporting on blinding of dementia assessors resulted in unclear risk of bias for that domain in most of the included studies (n = 16).
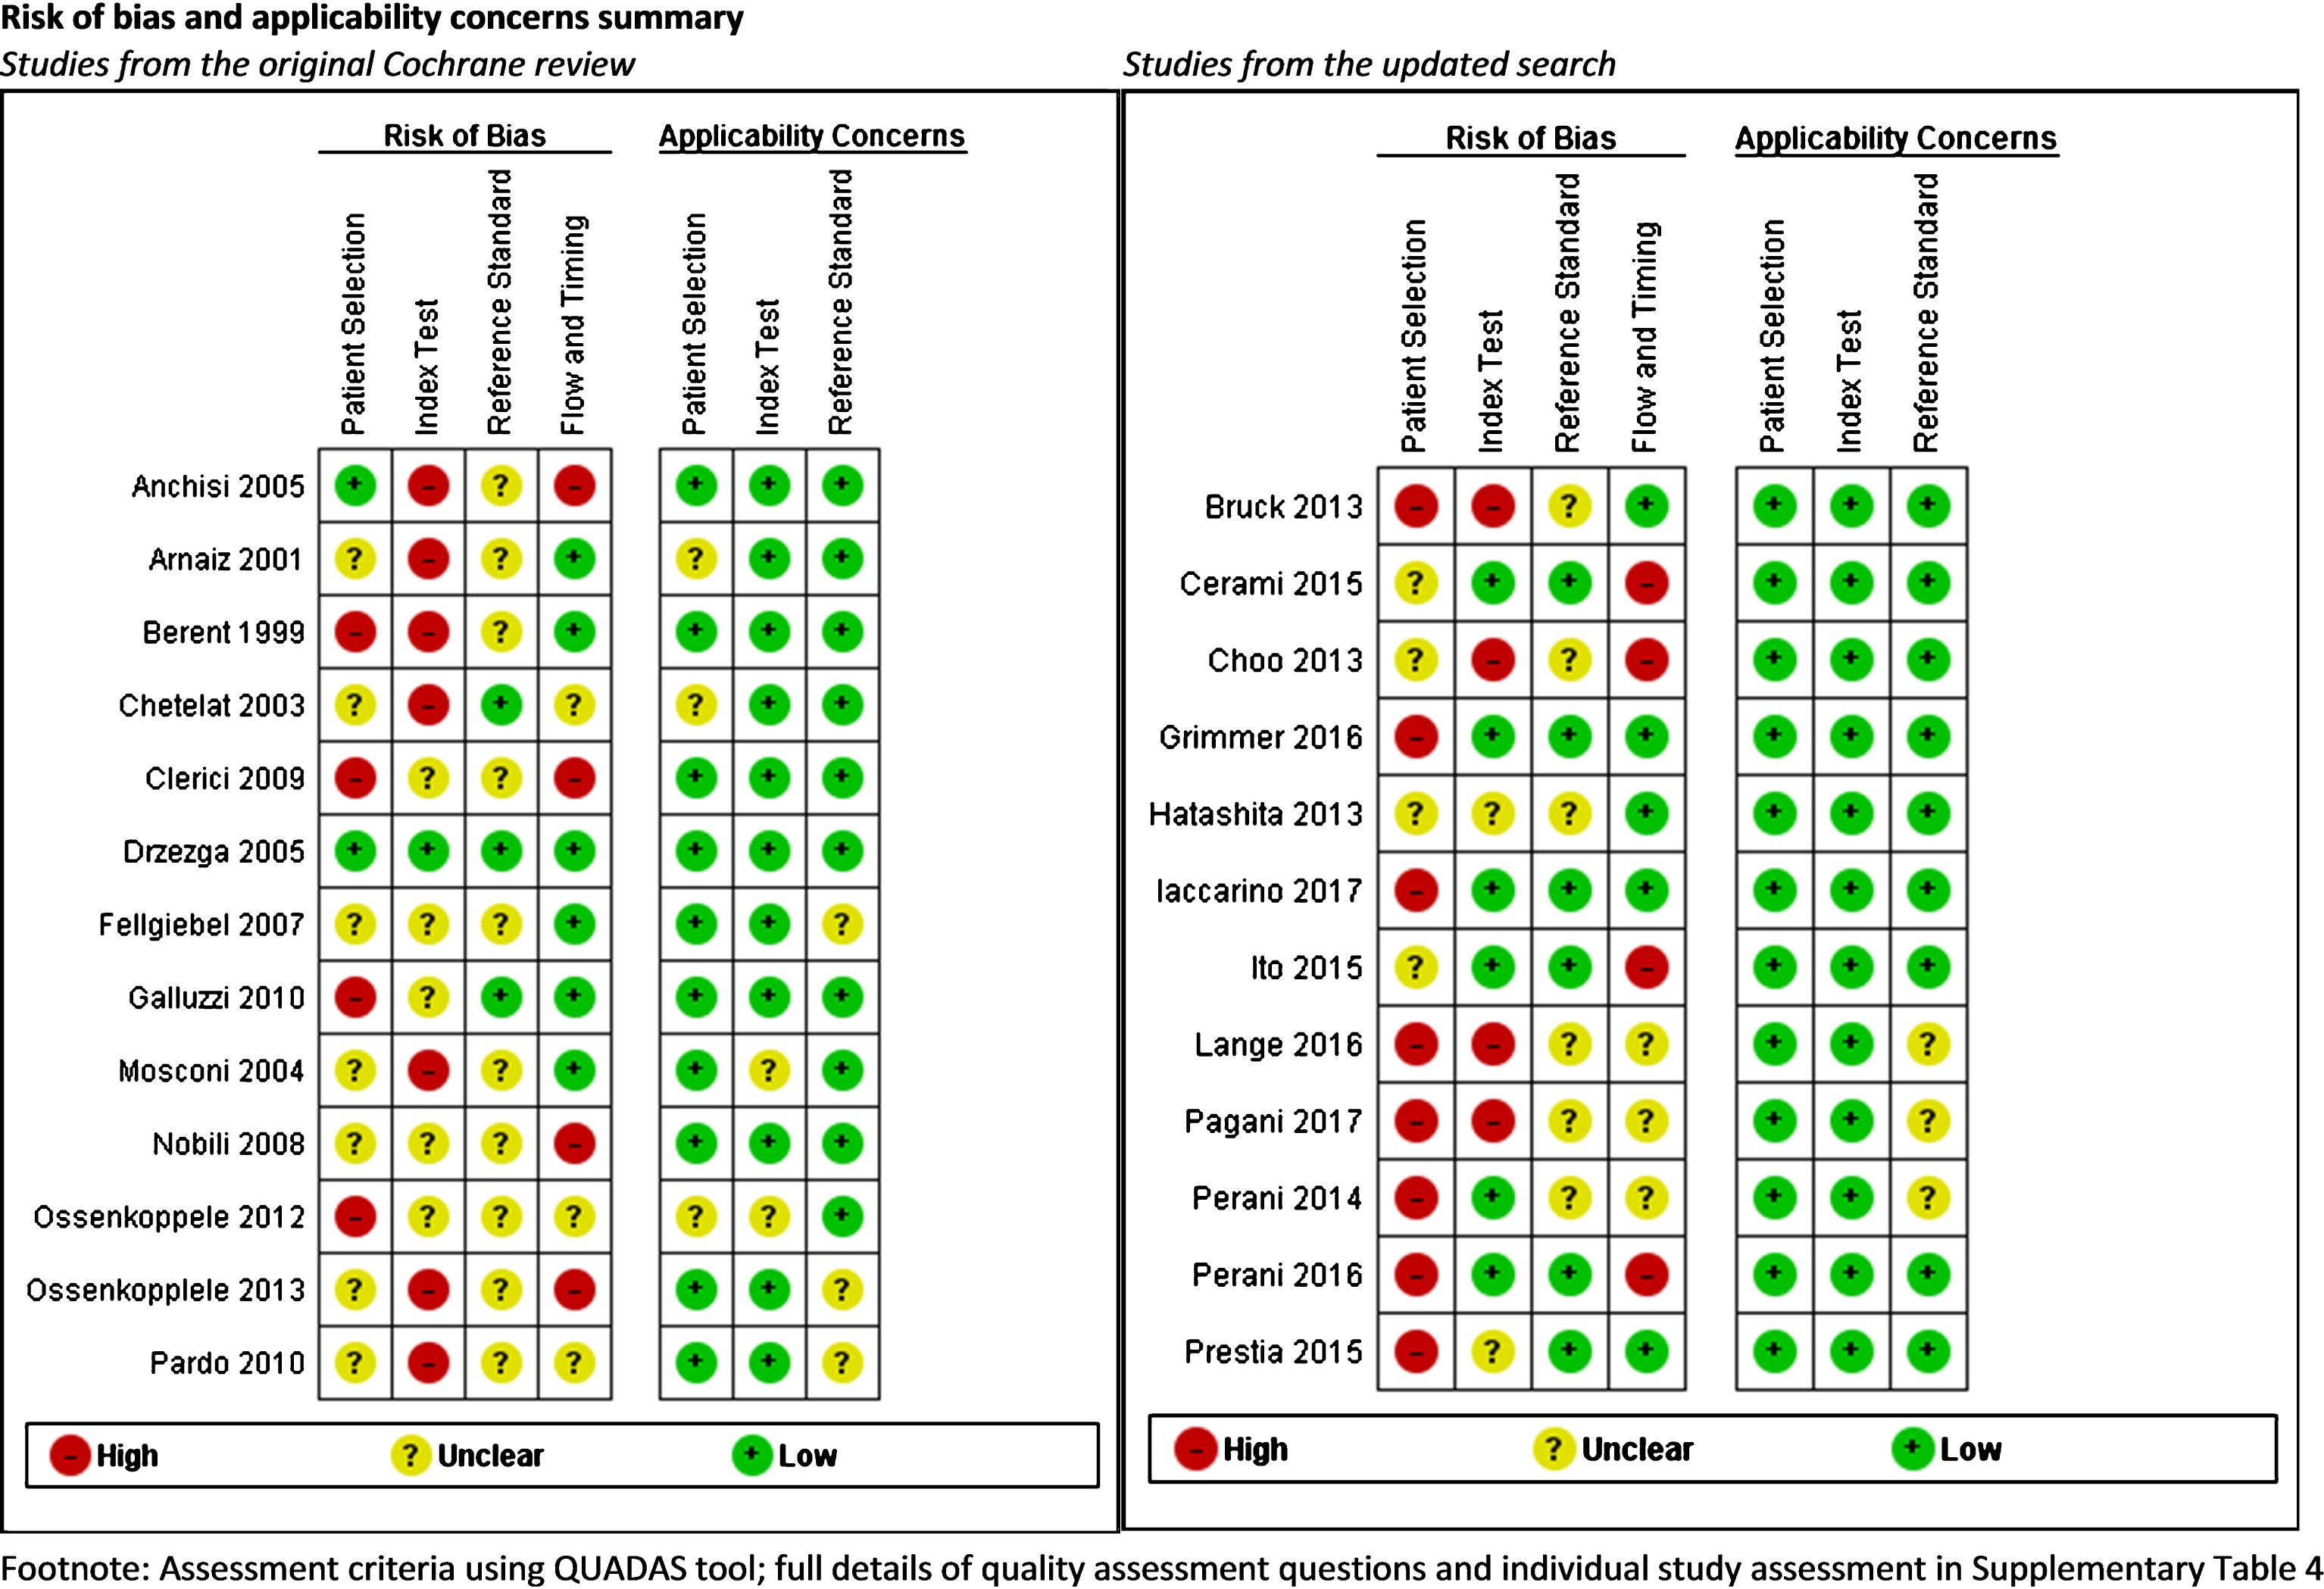
Risk of bias and applicability concerns summary: review authors’ judgements about each domain for each included study.
In summary, most studies have major threats to their validity according to QUADAS 2. Only one study [17] passed all the QUADAS 2 criteria; over half (n = 13) failed on four or more of the sevenavailable sets of criteria. The evidence base could thus be safely categorized as generally low quality.
A brief overview of the quality assessment is shown in the Legend section of Supplementary Table 4.
Accuracy figures of 18F-FDG PET for conversion from MCI to AD dementia at study levels in ADNI studies
18F-FDG PET, fluorine-18-2-fluoro-2-deoxy-D-glucose positron emission tomography; MCI, mild cognitive impairment; AD, Alzheimer’s disease; SPM, statistical parametric map; SUVr, standardised uptake value ratio; ROI, region of interest; VROI, volume region of interest; HCI, hypometabolic convergence index; TOMC, Transitional Outpatient Memory Clinic; SVM, support vector machine. *18F-FDG PET positive relates to hypometabolism in brain region exceeding a certain threshold. **No overlap between participants in those two studies (Dr. Perani). *ADNI study, Alzheimer’s Disease Neuroimaging Initiative cohort.
An overview and characteristics of studies included in the exploratory analysis are presented in Table 3.
Summary of the main findings
18F-FDG PET, fluorine 18-2-fluoro-2-deoxy-D-glucose positron emission tomography; MCI, mild cognitive impairment; VROI, volume region of interest; SUVr, standardized uptake value ratio; 3D-SSP, three-dimensional stereotactic surface projection; SPM, statistical parametric map; NINCDS-ADRDA, National Institute of Neurological and Communicative Disorders and Stroke and the Alzheimer’s Disease and Related Disorders Association; CDR, clinical dementia rating; NINDS-AIREN, National Institute of Neurological Disorders and Stroke and the Association Internationale pour la Recherche et l’Enseignement en Neurosciences; AD, Alzheimer’s disease; QUADAS, Quality Assessment of Diagnostic Accuracy Studies; HCI, hypometabolic convergence index; ADNI, Alzheimer’s Disease Neuroimaging Initiative cohort.
DISCUSSION
This paper updates the previous 18F-FDG PET Cochrane review [19] to determine this biomarker’s accuracy for prediction of conversion from MCI to AD dementia in light of recently published studies. Deploying the same methodological rigor, it yielded 36 studies overall. When all included studies were examined across all metrics, exploratory analysis for conversion of MCI to AD dementia (n = 24) showed sensitivity values ranged from 25–100% while specificity values ranged from 24–100%. Highly variable accuracy for all metrics was also found across the eleven newly included studies, published in the last 5 years. Sensitivity values ranged from 56–100% and specificity values from 24–100%. The best values are reported for the sc-SPM metric in four new studies; sensitivity values ranged from 77–100% and specificity from 74–100%. Three [43, 48] of these four studies used an optimized voxel-based procedure [69]. To be useful for dementia diagnosis, achieving both high sensitivity and specificity is critical [70].
The main sources of heterogeneity across studies are differences in study design, participants sampling, sample size and settings, variability in selected thresholds with respect to hypometabolism indifferent brain regions, variable length of follow-up, and analytical approaches (Table 3). The DTA study designs least likely to cause bias are prospective longitudinal studies with consecutive sampling and large sample size. Accuracy obtained from studies with retrospective design might be overestimated [71], and small samples may result in misleading estimates of test accuracy due to wide confidence intervals [72]. In this review, fourteen prospective cohort studies and ten that retrospectively analysed longitudinal data were included in the exploratory analysis for conversion to AD dementia. Only 5 studies recruited a consecutive sample. Most included studies had a sample size below 50, four between 50–120 participants, and only one study with over 200 participants; participants were recruited from a range of settings. A substantial number of included studies had limitations in methodological and reporting quality. Areas of particular bias concern were Patient Selection and Index Test domains; only one study was graded low risk of bias for all criteria of QUADAS 2 [17] and reported high values for sensitivity (92%) and specificity (89%) using Neurostat/3D-SSP metric. However, this study has a small sample size (n = 30); therefore, the accuracy achieved might be overestimated.
The accuracy of biomarkers also heavily depends on the length of the follow-up period. MCI participants with a positive (abnormal) 18F-FDG PET scan are classified as ‘false positive’ if they do not convert to AD dementia at a predefined follow-up period. It is possible the specificity values in some included studies with short follow-up are falsely low because some MCI participants might only convert to dementia at a later follow-up period and would thus be classified ‘true positive’. The same logic applies to sensitivity values with the ‘misclassification’ of participants as true negative. But what is the ideal follow-up to assess diagnostic accuracy? Duration of follow-up was 24–36 months in most included studies and one study [46] followed-up participants for five years. Three studies with a relatively short follow-up of 18 months or less [16, 63] reported specificity values of 100%, 89%, and 97%, respectively. One plausible explanation is that MCI study participants had more severe cognitive impairment at baseline, and consequently converted to AD dementia during the short observation period. Despite the fact that a majority of included studies (33/36) used Petersen’s standardized clinical criteria for MCI diagnosis [4, 27], reported information about participants’ cognitive impairment severity at baseline was insufficient to explore this issue. A better understanding of the role of biomarkers in prediction of conversion from MCI stage to AD requires both short and long-term periods of observation [25] and characterization of the severity of cognitive decline at baseline.
Increasing age of MCI participants is considered the strongest risk factor for progression to AD dementia [73, 74]. Participants’ age for studies included in the exploratory analysis ranged from 50–83 years. The influence of age groups on the predictive accuracy of 18F-FGD PET was assessed only in a few included studies. One study reported that age as covariate in statistical analysis did not improve the performance of 18F-FGD PET [45]; another found that in participants under 75 years this biomarker was only a marginally significant predictor and in participants over 75 did not predict conversion [68].
Only ten out of 24 studies defined a specific threshold for 18F-FDG PET biomarker at baseline and then prospectively assessed its predictive accuracy in identifying those participants with MCI who would convert to AD dementia at follow-up. The remaining studies used optimized thresholds, so reported sensitivity and/or specificity values might be overly optimistic. Furthermore, the accuracy of imaging biomarkers is highly influenced by the analytical approach used. It is still a matter of debate which 18F-FDG PET metrics are most accurate [25, 44]. Our review confirms previous evidence from a published meta-analysis [75] that sc-SPM metric shows the best prognostic accuracy when compared to other computer added visual read or fully automated metrics. However, the findings should be interpreted with caution because: 1) only one study [40] had a sample size above 50 and follow-up of 2 years or longer as recommended [30]; 2) the accuracy of sc-SPM and other metrics was not assessedsimultaneously in the same study participants; 3) four out of eight studies retrospectively analysed longitudinal data of MCI-converters and MCI-stable participants. Retrospective analysis has greater potential for bias than prospective longitudinal studies. A recent study [76], with 80 participants recruited retrospectively, concluded that an optimized voxel-based procedure sc-SPM metric has a relevant role in predicting progression to different dementias and in the exclusion of progression in prodromal MCI phase. These important, promising results for 18F-FDG PET-SPM need to be confirmed in future prospective longitudinal studies.
A number of studies [20, 30] concluded that a large body of data supports the accuracy of 18F-FDG PET to detect AD at MCI stage, showing high predictive value for conversion and providing highly relevant prognostic information for routine clinical use [30]. Based on a June 2015 search, Garibotto [30] reported that sensitivity ranged from 57–85% and specificity from 67–91% across five studies [44, 61] with over 50 participants and a minimum two-year follow-up; four of these five studies included overlapping ADNI participants. Conversely, our review found that the accuracy of 18F-FDG PET as a single test among 12 studies from the same ADNI cohort varied immensely. Sensitivity values ranged from 10–92% and specificity from 55–97% across several metrics; values for both sensitivity and specificity were >80% in only three studies. When applying the same criteria regarding sample size and duration of follow-up, our review identified five additional studies [39, 50] which reported sensitivity ranging from 63–93% and specificity from 24–93%; values for both sensitivity and specificity were ≥80% in only three studies. Our comprehensive, up-to-date review supports Frisoni’s statement [77] that “the informative value of biomarker cannot be used with full reliability in clinical practice” and further evidence of the clinical validity and utility of 18F-FDG PET in people with MCI is needed.
This review has systematically and comprehensively examined the up-to-date evidence for 18F-FDG PET as a single test for prediction of conversion to AD dementia in people with MCI, using Cochrane methods designed to minimize risk of bias for assessment and review of diagnostic testaccuracy.
Overall, sensitivity, and specificity vary widely between studies, and this variability was still present in studies published in the last 5 years. However, there is some evidence that sc-SPM is the metricshowing the best prognostic accuracy when compared to other computer aided visual read or fully automated metrics. The highest values for both sensitivity and specificity (approximately ≥80%) were achieved in 6 out of 8 studies (2 older and 4 new) that used the sc-SPM metrics. These findings should be interpreted with caution as only one study had a sample size above n = 50 and follow-up of 2 years or longer, and 4 out of 8 studies conducted retrospective analyses which are at greater risk of bias.
There are still methodological limitations in the available evidence and a lack of well-designed studies that meet best practice criteria for diagnostic test accuracy studies. Further work needs to be completed before 18F-FDG-PET as a single test can be widely recommended as a routine diagnostic test for conversion from MCI to AD dementia in clinicalpractice.
The promising results need further testing and confirmation in robust, methodologically sound prospective longitudinal cohort studies with long (≥5 years) follow-up, with defined baseline threshold(s) and larger consecutive samples stratified by age groups and other covariates. Various aspects of more efficient metrics, such as sc-SPM, need to be harmonized [30], optimized, standardized, agreed amongst experts and further tested. The predictive accuracy and the incremental diagnostic values of different metrics should also be assessed simultaneously in the same MCI participants. The use of dementia-specific guidance such as those proposed by STARDdem [78] may improve reporting quality in further DTAstudies.
Footnotes
ACKNOWLEDGMENTS
We thank Isla Kuhn, Medical Librarian, for help with the literature searches. We are also grateful to Andy Cowan, Communications & Project Administrator, for help with editing and the submission process. This paper presents independent research funded by the National Institute for Health Research (NIHR) Collaboration for Leadership in Applied Health Research and Care East of England (Grant number: RG74482). The views expressed are those of the authors and not necessarily those of the National Health System, the NIHR, the Department of Health and Social Care.